Salt densities and velocities with application to Gulf of ... densities.pdfSalt densities and...
5
Salt densities and velocities with application to Gulf of Mexico salt domes Salt densities and velocities with application to Gulf of Mexico salt domes Jingjing Zong * , Suleyman Coskun, Robert R. Stewart, Nikolay Dyaur, and Michael T. Myers, University of Houston SUMMARY We study the densties and elastic properties of rock salt from benchtop ultrasonic measurements, log data analysis in the Gulf Coast regions, and seismic survey designs, acquisition and interpretations over salt domes. In the lab, we analyzed the composition, density, velocity, and stress effects of a variety of rock salt samples. The tested sam- ples are from very different environment. Salt samples from the Gulf of Mexico region are largely isotropic with mixed orientations of micro-cracks and crystal aggregates. The Zi- paquir´ a, colombia samples show velocity and density varia- tions from their lamination of alternating layers of relatively pure halite and argillaceous halite. The Goderich, Canada halite crystals display distinct cubic anisotropy, with the elas- tic constants calculated as: C 11 =48.7, C 44 =13.1 and C 12 =11.9. From a study of 142 log suites from boreholes drilled through salt in the Gulf of Mexico, we found that P-wave velocity V p (km/s) increases with depth D(km) of the salt as: V p = 4.41 + 0.0104 · D, with the average standard deviation of 0.10 km/s. The salt electron density readings concentrate at 2.06 ± 0.1g/cm 3 . These lab measurements and log data analyses provide further information on the elastic properties of salt to assist with velocity model building, synthetic seismogram gen- eration, and understanding the elastic properties of halite. A southwest-northeast trending gravity line was collected in the Pierce Junction salt dome, TX. The 2D and 3D velocity model is proposed by combining that with earlier seismic sur- veys, topography surveys as well as a east-west gravity profile. Both 2D and 3D seismic surveys can be designed based on such velocity model for the purpose of full coverage of the tar- get zones. Gravity and elastic measurements complement each other to produce a more constrained subsurfece picture. INTRODUCTION With some of the world largest oil discoveries being located either below or close to salt bodies (Landrø et al., 2011), many studies have investigated the complexity of the salt bodies with respect to tectonics, stress effects, drilling hazards and anisotropy. Seismic imaging and interpretation of regions with salt struc- tures can be challenging. Velocity model building relies on the comprehensive understanding of evaporite composition, prop- erties, and tectonics. Rock salt is ductile and deformable under overburden pressure and heat. With the relative low density (2.0 to 2.2 g/cm 3 ), salt tends to flow upwards and push the overlying layers. Domi- nant stress also plays an important role in guiding the flow di- rection. The relative ease with which salt moves upwards and laterally adds complexity to both shapes and elastic properties of salt formation under different tectonic regimes. Gravity and magnetics methods, which measure lateral changes in density and magnetic field can provide constrains for boundaries in complicated structures such as salt bodies. ULTRASONIC LAB MEASUREMENTS The ultrasonic pulse-transmission method is often used to find velocities in geologic materials (Vernik and Liu, 1997; Stew- art et al., 2012). We conduct transmission traveltime recording by using vertical or horizontal pulse transducers (0.5-1 MHz) as sources and receivers (Figure 1). The tested samples are collected from various locations (Figure 2): Gulf of Mexico region (the Hockley salt mine, TX and the Bayou Corne salt dome, Louisiana), the Zipaquir´ a Salt Mine, Colombia and the Goderich salt mine, Ontario. From the X-ray powder diffrac- tion (XRD) and inductively coupled plasma-mass spectrome- try (ICP-MS) analysis, most of the samples are tested to be very pure halite (over 95%). The Zipaquir´ a salt samples, how- ever, contain argillaceous halite laminations which are visible from the samples as well as in-situ. Density and velocity are measured under room temperature and standard atmosphere pressure for all the samples first (Ta- ble 1, Table 2). The rock salt cores from the Gulf of Mex- ico areas (Hockley salt mine, TX and Bayou Corne salt dome, Louisiana) are generally isotropic from current measurements, with irregular crystals randomly distributed. The large veloc- ity variations are observed from the Zipaquir´ a and Goderich salt samples. The Zipaquir´ a rock salt samples show the elas- tic properties variation due to the lamination. The interbedded argillaceous layer has lower velocity (4.01±0.03 km/s for P- wave and 2.39±0.01 km/s for S-wave) than the halite layer. The Goderich salt samples display anisotropy from their cu- bic crystalline structure. Velocities are measured with waves propagate in two sets of directions: along the direction of sym- metric axes (X , Y and Z) and in the halfway between two sym- metric axes (K). The calculated elastic constants are: C 11 = 48.7, C 44 = 13.1, and C 12 = 11.9 (Zong et al., 2014). Complementary tests under confining pressure from 0 - 4000 psi are conducted on Bayou Corne samples. The velocity gen- erally increases when pressure is elevated (Figure 3). CT scan- ning shows that micro-fractures and cracks are closed under pressure, which explains the rapid velocity increment upon ap- plying pressure (Figure 4). WELL LOGS IN GULF OF MEXICO More field data and empirical relationships are investigated through the study of 142 wells drilled in the Gulf coast (Fig- ure 5). From the velocity-depth cross plot in Figure 6, we no- tice that there is a trend of velocity generally increasing with depth: V = 4.41 + 0.0104 · D, (1) where V is the velocity (km/s) and D is the depth (km). The average standard deviation is 0.10 km/s (Zong et al., 2015). The electron density readings range from 1.98 to 2.16 g/cm 3 Salt Challenges in Hydrocarbon Exploration SEG Annual Meeting Post-convention Workshop, New Orleans, 2015
Transcript of Salt densities and velocities with application to Gulf of ... densities.pdfSalt densities and...
Salt densities and velocities with application to Gulf of Mexico salt domes
Salt densities and velocities with application to Gulf of Mexico salt domesJingjing Zong∗, Suleyman Coskun, Robert R. Stewart, Nikolay Dyaur, and Michael T. Myers, University of Houston
SUMMARY
We study the densties and elastic properties of rock salt frombenchtop ultrasonic measurements, log data analysis in theGulf Coast regions, and seismic survey designs, acquisitionand interpretations over salt domes.In the lab, we analyzed the composition, density, velocity, andstress effects of a variety of rock salt samples. The tested sam-ples are from very different environment. Salt samples fromthe Gulf of Mexico region are largely isotropic with mixedorientations of micro-cracks and crystal aggregates. The Zi-paquira, colombia samples show velocity and density varia-tions from their lamination of alternating layers of relativelypure halite and argillaceous halite. The Goderich, Canadahalite crystals display distinct cubic anisotropy, with the elas-tic constants calculated as: C11=48.7, C44=13.1 and C12=11.9.From a study of 142 log suites from boreholes drilled throughsalt in the Gulf of Mexico, we found that P-wave velocityVp(km/s) increases with depth D(km) of the salt as: Vp =4.41+0.0104 ·D, with the average standard deviation of 0.10km/s. The salt electron density readings concentrate at 2.06± 0.1g/cm3. These lab measurements and log data analysesprovide further information on the elastic properties of salt toassist with velocity model building, synthetic seismogram gen-eration, and understanding the elastic properties of halite.A southwest-northeast trending gravity line was collected inthe Pierce Junction salt dome, TX. The 2D and 3D velocitymodel is proposed by combining that with earlier seismic sur-veys, topography surveys as well as a east-west gravity profile.Both 2D and 3D seismic surveys can be designed based onsuch velocity model for the purpose of full coverage of the tar-get zones. Gravity and elastic measurements complement eachother to produce a more constrained subsurfece picture.
INTRODUCTION
With some of the world largest oil discoveries being locatedeither below or close to salt bodies (Landrø et al., 2011), manystudies have investigated the complexity of the salt bodies withrespect to tectonics, stress effects, drilling hazards and anisotropy.Seismic imaging and interpretation of regions with salt struc-tures can be challenging. Velocity model building relies on thecomprehensive understanding of evaporite composition, prop-erties, and tectonics.Rock salt is ductile and deformable under overburden pressureand heat. With the relative low density (2.0 to 2.2 g/cm3), salttends to flow upwards and push the overlying layers. Domi-nant stress also plays an important role in guiding the flow di-rection. The relative ease with which salt moves upwards andlaterally adds complexity to both shapes and elastic propertiesof salt formation under different tectonic regimes. Gravity andmagnetics methods, which measure lateral changes in densityand magnetic field can provide constrains for boundaries in
complicated structures such as salt bodies.
ULTRASONIC LAB MEASUREMENTS
The ultrasonic pulse-transmission method is often used to findvelocities in geologic materials (Vernik and Liu, 1997; Stew-art et al., 2012). We conduct transmission traveltime recordingby using vertical or horizontal pulse transducers (0.5-1 MHz)as sources and receivers (Figure 1). The tested samples arecollected from various locations (Figure 2): Gulf of Mexicoregion (the Hockley salt mine, TX and the Bayou Corne saltdome, Louisiana), the Zipaquira Salt Mine, Colombia and theGoderich salt mine, Ontario. From the X-ray powder diffrac-tion (XRD) and inductively coupled plasma-mass spectrome-try (ICP-MS) analysis, most of the samples are tested to bevery pure halite (over 95%). The Zipaquira salt samples, how-ever, contain argillaceous halite laminations which are visiblefrom the samples as well as in-situ.Density and velocity are measured under room temperatureand standard atmosphere pressure for all the samples first (Ta-ble 1, Table 2). The rock salt cores from the Gulf of Mex-ico areas (Hockley salt mine, TX and Bayou Corne salt dome,Louisiana) are generally isotropic from current measurements,with irregular crystals randomly distributed. The large veloc-ity variations are observed from the Zipaquira and Goderichsalt samples. The Zipaquira rock salt samples show the elas-tic properties variation due to the lamination. The interbeddedargillaceous layer has lower velocity (4.01±0.03 km/s for P-wave and 2.39±0.01 km/s for S-wave) than the halite layer.The Goderich salt samples display anisotropy from their cu-bic crystalline structure. Velocities are measured with wavespropagate in two sets of directions: along the direction of sym-metric axes (X , Y and Z) and in the halfway between two sym-metric axes (K). The calculated elastic constants are: C11 =48.7, C44 = 13.1, and C12 = 11.9 (Zong et al., 2014).Complementary tests under confining pressure from 0 - 4000psi are conducted on Bayou Corne samples. The velocity gen-erally increases when pressure is elevated (Figure 3). CT scan-ning shows that micro-fractures and cracks are closed underpressure, which explains the rapid velocity increment upon ap-plying pressure (Figure 4).
WELL LOGS IN GULF OF MEXICO
More field data and empirical relationships are investigatedthrough the study of 142 wells drilled in the Gulf coast (Fig-ure 5). From the velocity-depth cross plot in Figure 6, we no-tice that there is a trend of velocity generally increasing withdepth:
V = 4.41+0.0104 ·D, (1)
where V is the velocity (km/s) and D is the depth (km). Theaverage standard deviation is 0.10 km/s (Zong et al., 2015).The electron density readings range from 1.98 to 2.16 g/cm3
Salt Challenges in Hydrocarbon ExplorationSEG Annual Meeting Post-convention Workshop, New Orleans, 2015

Salt densities and velocities with application to Gulf of Mexico salt domes
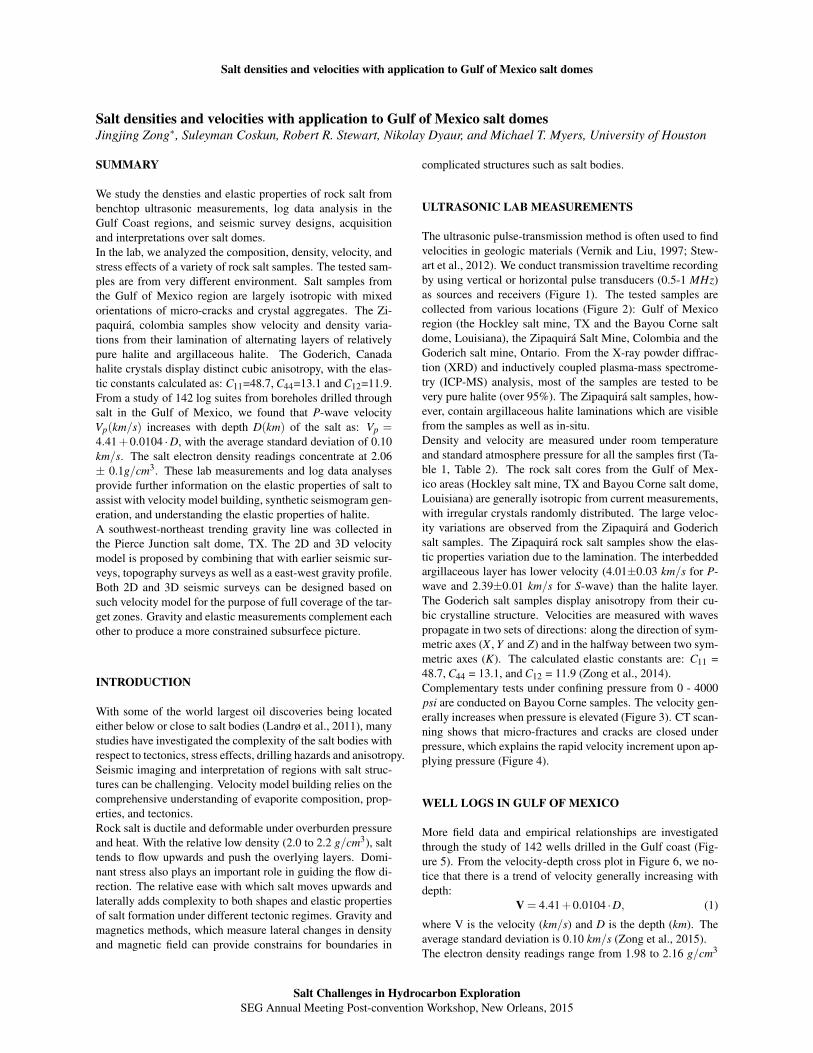
with most data concentrating around 2.06 g/cm3. We correctthe bulk density by ρbulk = 1.044 ·ρelectron and crossplot thatwith velocity (Figure 7). The color bar gives information of thevelocity-density correlation likelihood. The outliers are likelycontributed by different interbedded components, e.g., gypsum(Vp = 5.7 km/s, ρ = 2.3 g/cm3), anhydrite (Vp = 6.5 km/s,ρ = 2.97 g/cm3), sylvine (Vp = 3.5 km/s, ρ = 1.9 g/cm3),etc..(Jones et al., 2014). For a better comparison, we plot bothelectron density reading and corrected bulk density data over-lap with Gardners empirical velocity-density relationship plotin Figure 8. The original data match better with Gardner’s pre-diction. However, the current data appears more like a cloudrather than a trend. Hopefully these empirical numbers wouldhelp with the salt velocity models building in the Gulf coast.
GRAVITY SURVEY AND MODEL BUILDING
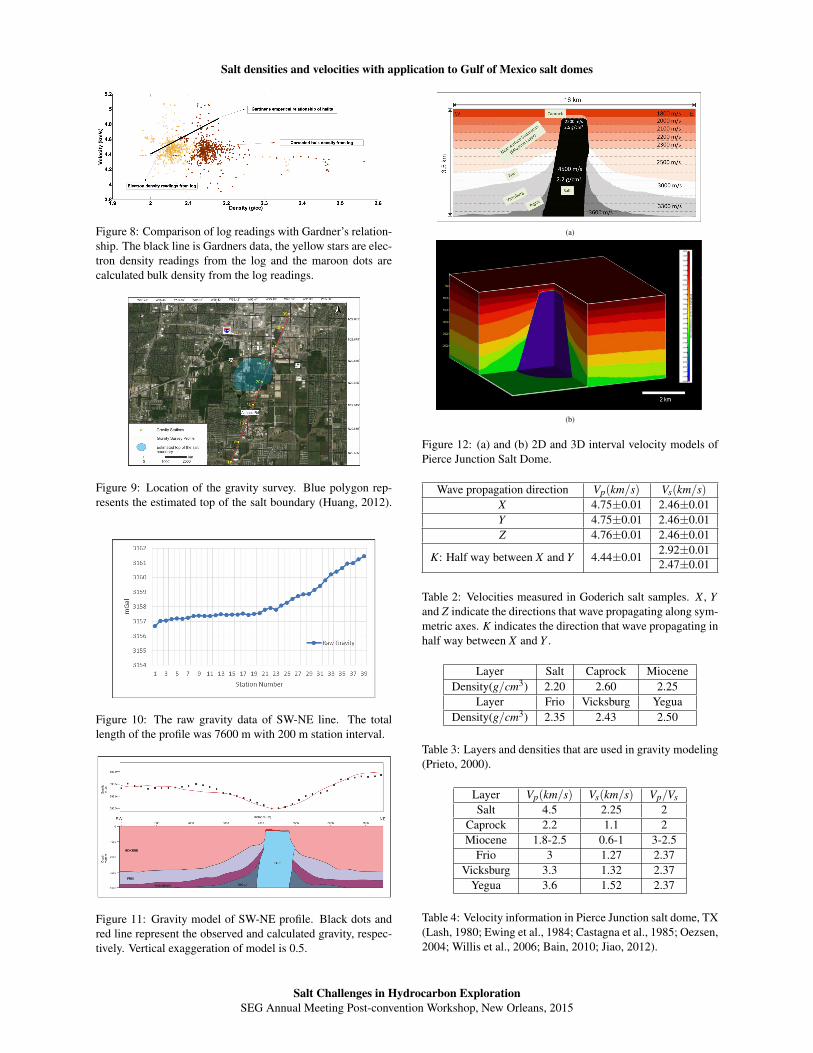
A 2-D gravity survey was carried out over the Pierce Junctionsalt dome TX in 2013 by AGL. The data were collected along asouthwest-northeast trending (18◦) profile. The total length ofthe profile was 7600 m with 200 m station interval (Figure 9).The objective of the survey was to model the gravity data andobtain a north-south cross-section of the salt dome, in additionto the east-west cross-section drawn by Glass (1953). AGL’sScintrex CG-5 Autograv gravimeter, Garmin GPS, distancemeasurement tools, and safety equipment were used during thedata acquisition. The graph of the raw gravity data was com-puted from topography survey and is shown in Figure 10. Thegravity variation caused by lithology change can be revealedafter removing the temporal and spatial effects (Figure 11). Weapplied drift and tide corrections to eliminate the time varyingeffects. Latitude, free-air, Bouguer, and terrain corrections areapplied to remove spatial effects. A forward modeling wascarried out by using GEOSOFT Oasis Montaj software (Fig-ure 11). The typical US Gulf Coast sediment densities wereused in the modeling stage (Table 3). Combining that withthe documented velocity values showed in Table 4 for this area(Lash, 1980; Ewing et al., 1984; Castagna et al., 1985; Oezsen,2004; Willis et al., 2006; Bain, 2010; Jiao, 2012). Both 2D and3D interval velocity models are built as Figure 12.
CONCLUSIONS
Through this study, we have a better understanding of saltproperties and have provided values for salt velocity modelingfor pre-salt and sub-salt imaging in the Gulf of Mexico area. Interms of the anisotropy, the tested samples show three differ-ent scenarios. We observed the cubic anisotropy in the unde-formed pure halite samples. The Louisiana salt cores show theslight velocity variation mainly due the alignment of deformedhalite crystalline. The Hockley salt cores behave generallyisotropic. The current results remind us that the isotropy as-sumption of salt formation should be carefully addressed dur-ing the velocity model building.Compared with lab measurements, the field measurements pro-vide a more realistic reference for building velocity model inspecific environment with multiple influencing factors and other
unknowns entailed (Gardner et al., 1974). We give an empir-ical relationship for velocity verses depth in Gulf of Mexicoarea from the log data analysis. Basically velocity increasesslightly with depth. The correlation between density and ve-locity from the probability density plot would be useful forinitial velocity model building. These results are representa-tive for general Gulf of Mexico area.For complex velocity variation areas such as salt domes, grav-ity survey provides a solution for obtaining velocity model. Aseries of synthetic seismic tests is able to be conducted on suchmodel in order of designing the seismic surveys with optimumparameters and low cost.
ACKNOWLEDGMENTS
We would like to express our special thanks of gratitude to Dr.Fred Hilterman and Geokinetics Inc., Houston for the well-logdata donation. We thank Dr. Joel Warneke, Texas Brine Corp.and United Salt Corp. for donating the Texas salt samples.We also thank Dr. James Korp, Dr. Yongjun Gao and WeihangYang at the University of Houston for the help during the XRDand ICP-MS tests. Thanks to Dr. Hao Hu and Yuandi Ganfor helpful discussions. We would like to thank all the AlliedGeophysics Laboratory (AGL) sponsors and personnel for thetechnical and spiritual support.
Figure 1: Samples are placed in between the ultrasonic sourceand receiver transducers using a couplant.
Figure 2: Rock salt tested samples from different areas (Hock-ley Salt Mine, Texas; Bayou Corne, Louisiana; Zipaquira SaltMine, Colombia; and Goderich, Ontario.).
Salt Challenges in Hydrocarbon ExplorationSEG Annual Meeting Post-convention Workshop, New Orleans, 2015

Salt densities and velocities with application to Gulf of Mexico salt domes
(a)
(b)
Figure 3: (a) and (b) The P- and S-wave velocities of BayouCorne salt plug measured under confining pressure (Zonget al., 2015).
(a)
(b)
Figure 4: CT scanning results of Bayou Corne salt plug (Zonget al., 2015).(a) Micro-fractures and cracks are visible before the confiningpressure is applied.(b) Most micro-fractures and cracks are closed after the con-fining pressure has been applied.
Figure 5: Well locations of this study, using 142 well-logsuites.
Figure 6: Top: Cross-plot of velocity-depth data from the logs.Red line is the fitted curve: Vp = 4.41+ 0.0104 ·D. Bottom:The residual of our fit with an averaged standard deviation of0.10 km/s.
Figure 7: Cross-plot of corrected bulk density readings andvelocity for salt intervals from the 142 log suites. The colorbar is the probability density.
Sample locations Vp(km/s) Vs(km/s) ρ(g/cm3)
Hockley 4.64±0.09 2.70±0.05 2.18±0.01Bayou Corne 4.45±0.02 2.59±0.03 2.15±0.01
Zipaquira 4.19±0.18 2.46±0.12 2.10±0.18
Table 1: Average velocities and densities measured in salt sam-ples.
Salt Challenges in Hydrocarbon ExplorationSEG Annual Meeting Post-convention Workshop, New Orleans, 2015
Salt densities and velocities with application to Gulf of Mexico salt domes
Figure 8: Comparison of log readings with Gardner’s relation-ship. The black line is Gardners data, the yellow stars are elec-tron density readings from the log and the maroon dots arecalculated bulk density from the log readings.
Figure 9: Location of the gravity survey. Blue polygon rep-resents the estimated top of the salt boundary (Huang, 2012).
Figure 10: The raw gravity data of SW-NE line. The totallength of the profile was 7600 m with 200 m station interval.
Figure 11: Gravity model of SW-NE profile. Black dots andred line represent the observed and calculated gravity, respec-tively. Vertical exaggeration of model is 0.5.
(a)
(b)
Figure 12: (a) and (b) 2D and 3D interval velocity models ofPierce Junction Salt Dome.
Wave propagation direction Vp(km/s) Vs(km/s)X 4.75±0.01 2.46±0.01Y 4.75±0.01 2.46±0.01Z 4.76±0.01 2.46±0.01
K: Half way between X and Y 4.44±0.012.92±0.012.47±0.01
Table 2: Velocities measured in Goderich salt samples. X , Yand Z indicate the directions that wave propagating along sym-metric axes. K indicates the direction that wave propagating inhalf way between X and Y .
Layer Salt Caprock MioceneDensity(g/cm3) 2.20 2.60 2.25
Layer Frio Vicksburg YeguaDensity(g/cm3) 2.35 2.43 2.50
Table 3: Layers and densities that are used in gravity modeling(Prieto, 2000).
Layer Vp(km/s) Vs(km/s) Vp/VsSalt 4.5 2.25 2
Caprock 2.2 1.1 2Miocene 1.8-2.5 0.6-1 3-2.5
Frio 3 1.27 2.37Vicksburg 3.3 1.32 2.37
Yegua 3.6 1.52 2.37
Table 4: Velocity information in Pierce Junction salt dome, TX(Lash, 1980; Ewing et al., 1984; Castagna et al., 1985; Oezsen,2004; Willis et al., 2006; Bain, 2010; Jiao, 2012).
Salt Challenges in Hydrocarbon ExplorationSEG Annual Meeting Post-convention Workshop, New Orleans, 2015

Salt densities and velocities with application to Gulf of Mexico salt domes
REFERENCES
Bain, R. C., 2010, Hidden structure revealed by a simple 3dvelocity model-mcallen ranch field, hidalgo county, texas.
Castagna, J. P., M. L. Batzle, and R. L. Eastwood, 1985, Rela-tionships between compressional-wave and shear-wave ve-locities in clastic silicate rocks: Geophysics, 50, 571–581.
Ewing, T. E., N. Tyler, R. Morton, and M. Light, 1984, Con-solidation of geologic studies of geopressured geothermalresources in Texas. 1983 annual report: Technical report,Texas Univ., Austin (USA). Bureau of Economic Geology.
Gardner, G., L. Gardner, and A. Gregory, 1974, Formationvelocity and density-the diagnostic basics for stratigraphictraps: Geophysics, 39, 770–780.
Glass, N., 1953, Pierce Junction field, Harris County Texas.Guidebook, field trip routes, oil fields: Houston GeologicalSociety.
Huang, Z., 2012, Multidisciplinary investigation of surface de-formation above salt domes in Houston, Texas: PhD thesis.
Jiao, K., H. W. D. V. K. J. C. R. S. E. C. X., 2012, Elasticmigration for improving salt and subsalt imaging and inver-sion: Presented at the 2012 SEG Annual Meeting, Societyof Exploration Geophysicists.
Jones, I. F., I. Davison, et al., 2014, Seismic imaging in andaround salt bodies: problems and pitfalls: Presented at the2014 SEG Annual Meeting, Society of Exploration Geo-physicists.
Landrø, M., C. Puigdefabregas, and B. Arntsen, 2011,Anisotropy in the salt outcrop at cardona, catalonia–implications for seismic imaging: First Break, 29, 41–45.
Lash, C., 1980, Shear waves, multiple reflections, and con-verted waves found by a deep vertical wave test (verticalseismic profiling): Geophysics, 45, 1373–1411.
Oezsen, R., 2004, Velocity modelling and prestack depthimaging below complex salt structures: a case history fromon-shore germany: Geophysical prospecting, 52, 693–705.
Prieto, C., 2000, Gravity/magnetic signatures of various ge-ologic models-an exercise in pattern recognition: GEO-PHYSICAL REFERENCES SERIES, 8, 20–27.
Stewart, R. R., N. Dyaur, B. Omoboya, J. De Figueiredo, M.Willis, and S. Sil, 2012, Physical modeling of anisotropicdomains: Ultrasonic imaging of laser-etched fractures inglass: Geophysics, 78, D11–D19.
Vernik, L., and X. Liu, 1997, Velocity anisotropy in shales: Apetrophysical study: Geophysics, 62, 521–532.
Willis, M. E., R. Lu, X. Campman, M. Nafi Toksoz, Y. Zhang,and M. V. d. Hoop, 2006, A novel application of time-reversed acoustics: Salt-dome flank imaging using walk-away vsp surveys: Geophysics, 71, A7–A11.
Zong, J., D. N. Stewart, R. Robert, and M. T. Myers, 2015,Elastic properties of rock salt: Lab experiments and welllog analysis in the gulf of mexico: Presented at the 2015SEG Annual Meeting, New Orleans, Society of ExplorationGeophysicists.
Zong, J., R. R. Stewart, and N. Dyaur, 2014, Salt anisotropy:Ultrasonic lab experiments and traveltime ramifications:Presented at the 2014 SEG Annual Meeting, Denver, So-ciety of Exploration Geophysicists.
Salt Challenges in Hydrocarbon ExplorationSEG Annual Meeting Post-convention Workshop, New Orleans, 2015