Salmon Creek Watershed Low Dissolved Oxygen … Creek Watershed . Low Dissolved Oxygen and pH . ......
93
Salmon Creek Watershed Low Dissolved Oxygen and pH Characterization Study March 2013 Publication No. 13-03-013
Transcript of Salmon Creek Watershed Low Dissolved Oxygen … Creek Watershed . Low Dissolved Oxygen and pH . ......
Salmon Creek Watershed Low Dissolved Oxygen and pH Characterization Study
March 2013 Publication No. 13-03-013

Publication and Contact Information This report is available on the Department of Ecology’s website at https://fortress.wa.gov/ecy/publications/SummaryPages/1303013.html Data for this project are available at Ecology’s Environmental Information Management (EIM) website www.ecy.wa.gov/eim/index.htm. Search User Study ID, NMat0004.
The Activity Tracker Code for this study is 11-046. For more information contact: Publications Coordinator Environmental Assessment Program P.O. Box 47600, Olympia, WA 98504-7600 Phone: (360) 407-6764
Washington State Department of Ecology - www.ecy.wa.gov o Headquarters, Olympia (360) 407-6000 o Northwest Regional Office, Bellevue (425) 649-7000 o Southwest Regional Office, Olympia (360) 407-6300 o Central Regional Office, Yakima (509) 575-2490 o Eastern Regional Office, Spokane (509) 329-3400 Cover photo: Salmon Creek at 36th Ave, looking downstream from bridge. (Photo taken 10/19/2011 by Nuri Mathieu.)
Any use of product or firm names in this publication is for descriptive purposes only and does not imply endorsement by the author or the Department of Ecology.
If you need this document in a format for the visually impaired, call 360-407-6764.
Persons with hearing loss can call 711 for Washington Relay Service. Persons with a speech disability can call 877-833-6341.
Page 1
Salmon Creek Watershed Low Dissolved Oxygen and pH
Characterization Study
by
Nuri Mathieu
Environmental Assessment Program Washington State Department of Ecology
Olympia, Washington 98504-7710
Waterbody Number: WA-28-1020 .

Page 2
This page is purposely left blank
Page 3
Table of Contents
Page
List of Figures and Tables....................................................................................................5
Abstract ................................................................................................................................7
Acknowledgements ..............................................................................................................8
Introduction ..........................................................................................................................9 Water Quality Criteria..................................................................................................10 Watershed Description .................................................................................................10 Comparison of the Jones and Upper Salmon Basins ...................................................11
Methods..............................................................................................................................13 Sampling Locations and Dates.....................................................................................13 Study Design ................................................................................................................17
Results ................................................................................................................................19 Data Quality Results ....................................................................................................19
Completeness ....................................................................................................19 Field and Laboratory Quality Control Procedures and MQOs .........................19
Study Results ...............................................................................................................20 August 2011 Synoptic Survey ...........................................................................20 Monthly Monitoring ..........................................................................................28 Wet-Season Monitoring ....................................................................................31 Macroinvertebrates and Periphyton Monitoring ...............................................38 Additional Continuous Monitoring (Summer 2012) .........................................42
Discussion ..........................................................................................................................45 Comparison of the Jones Creek and Upper Salmon Creek Basins ..............................45 Low pH in the Upper Salmon Creek Basin .................................................................46 Low DO in the Upper Salmon Creek Basin.................................................................48 Low pH in the Curtin Creek Basin ..............................................................................48 Low DO in the Curtin Creek Basin..............................................................................49 Low DO and pH in the Lower and Mid-Salmon Creek Basin .....................................50
Salmon Creek Mainstem ...................................................................................50 Salmon Creek Tributaries, Excluding Curtin Creek .........................................50
Conclusions ........................................................................................................................51
Recommendations ..............................................................................................................52
References ..........................................................................................................................53
Appendices .........................................................................................................................55 Appendix A. Detailed Biological Results ...................................................................57 Appendix B. Glossary, Acronyms, and Abbreviations ...............................................61

Page 4
This page is purposely left blank
Page 5
List of Figures and Tables
Page Figures
Figure 1. Overview map of Salmon Creek watershed. .......................................................9
Figure 2. Map of base network sites. ................................................................................14
Figure 3. Map of Upper Salmon basin extended network sites. .......................................15
Figure 4. Map of Curtin Creek extended network sites. ...................................................16
Figure 5. Plot of monitoring event types, dates, and streamflow. ....................................18
Figure 6. Nutrient and general chemistry sampling results for Salmon Creek mainstem sites and Jones Creek. .......................................................................................21
Figure 7. Nutrient and general chemistry sampling results for Salmon Creek tributary sites. ...................................................................................................................22
Figure 8. Continuous water quality data for Salmon Creek mainstem sites and Jones Creek collected during the August synoptic survey. .........................................23
Figure 9. Continuous water quality data for Salmon Creek tributary sites collected during the August synoptic survey. ...................................................................25
Figure 10. Continuous water quality data for Upper Salmon Creek sites and Jones Creek collected during the additional deployment in early September 2011. .26
Figure 11. Chlorophyll a and ash-free dry weight periphyton biomass results. ...............27
Figure 12. Monthly monitoring water quality results for Salmon Creek mainstem and Jones Creek. ..............................................................................................28
Figure 13. Monthly monitoring water quality results for Salmon Creek tributaries. .......29
Figure 14. Boxplots of nutrient concentrations at Upper Salmon (SMN086) and Jones Creek (JON010) with and without wet-season synoptic results included............................................................................................................30
Figure 15. Hydrograph and timing for the 11/16/2011 wet-season synoptic survey. .......31
Figure 16. pH and streamflow at extended network sites during the 11/16/2011 wet-season synoptic survey. ............................................................................32
Figure 17. Hydrograph and timing for the 1/25/2012 wet-season synoptic survey. .........33
Figure 18. pH and streamflow at extended network sites during the 1/25/2012 wet-season synoptic survey. ...................................................................................34
Figure 19. Hydrograph and timing for the 2/22/2012 wet-season synoptic survey. .........35
Figure 20. pH and streamflow at extended network sites during the 2/22/2012 wet-season synoptic survey. ...................................................................................36
Figure 21. Continuous pH data collected during February and March 2012. ...................37
Page 6
Figure 22. Frequency distribution of top 20 species identified from macroinvertebrate samples collected on 9/28/2011. ......................................................................40
Figure 23. Continuous dissolved oxygen for Salmon at 199th (SMN080) during the 2012 dry season. ..............................................................................................42
Figure 24. Continuous pH for Salmon at 199th (SMN080) during the 2012 dry season. .43
Figure 25. Continuous temperature for Salmon at 199th (SMN080) during the spring of 2012. ............................................................................................................44
Figure 26. Continuous temperature for Salmon at 199th (SMN080) during the 2012 dry season. .......................................................................................................44
Tables
Table 1. Water quality criteria for dissolved oxygen and pH in the Salmon Creek watershed. ...........................................................................................................10
Table 2. Comparison of the Jones and Upper Salmon basins. ..........................................12
Table 3. Location IDs, names, descriptions, and coordinates for the base network sites. ....................................................................................................................14
Table 4. Location IDs, names, descriptions, and coordinates for the Upper Salmon basin extended network sites. .............................................................................15
Table 5. Location IDs, names, descriptions, and coordinates for the Curtin Creek extended network sites. ......................................................................................16
Table 6. Monitoring dates for the 2011-12 field study components. ................................17
Table 7. Data quality ratings for Hydrolab monitoring results. ........................................20
Table 8. Selected macroinvertebrate metrics from samples collected on 9/28/2011. .......38
Table 9. Macroinvertebrate metric and B-IBI scores from samples collected on 9/28/2011. ...........................................................................................................39
Table 10. Selected periphyton metrics for samples collected on 9/28/2011. ....................41
Table 11. Comparison of water chemistry at the Jones and Upper Salmon sites. ............45
Table 12. Comparison of nutrient water quality index (WQI) scores at the Jones and Upper Salmon sites. ..........................................................................................46
.
Page 7
Abstract Washington State water quality criteria set minimum acceptable values for dissolved oxygen (DO) concentrations and an acceptable range of values for pH. Low DO and pH values, below minimum criteria, can be influenced by both natural processes and human-caused activities. Clark County has measured low DO and pH in the Salmon Creek watershed, including at their furthest upstream site on Salmon Creek. This 2011-12 study by the Washington State Department of Ecology (Ecology) characterized DO and pH values in the Salmon Creek watershed and investigated the influence of natural processes. DO levels fell below criteria at all locations, with the exception of Cougar Creek. Ecology did not observe pH excursions, above or below water quality criteria, in Salmon Creek or its major tributaries. Temperature levels above maximum criteria occurred at all sites, except for Cougar and Curtin Creeks. Elevated temperatures are partly responsible for low DO levels at sites above maximum temperature criteria. Excess nutrient levels and aquatic plant growth in Curtin Creek suggest that human-caused influence may further lower naturally low DO levels. The lowest pH levels, approaching the minimum criterion, occurred during large wet-season precipitation events. Low pH in the Upper Salmon Creek watershed likely results from a natural condition. Acidic precipitation, combined with poorly buffered soils, geology, and stream water, results in decreases in instream pH. The report recommends ranking DO listings in the watershed as low priority. While human-caused influence likely impacts DO in these waterbodies, the ongoing temperature and nonpoint source total maximum daily loads (TMDLs; water cleanup plans) are expected to improve DO levels in the watershed. The report also recommends removing 5 pH listings from the 303(d) list of impaired waters due to a natural condition of low pH in the watershed during large winter precipitation events.
Page 8
Acknowledgements The author of this report thanks the following people for their contributions to this study:
• Jeff Schnabel, Clark County Environmental Services-Clean Water Program, for review of the project plan and final report.
• Washington State Department of Ecology staff: o Brett Raunig and Kim McKee (Southwest Regional Office – Water Quality Program) for
project guidance and review of the project plan and final report.
o Don Fisher, Jennifer Hall, Bill Ward, Dave Hallock, and Brad Hopkins (Freshwater Monitoring Unit – Environmental Assessment Program) for installation, maintenance, troubleshooting, and data review for the continuous water quality gage.
o Christopher Moore (formerly Environmental Assessment Program), James Kardouni, Chris Hartman, and Scott Collyard (Directed Studies Unit – Environmental Assessment Program) for field assistance. Special thanks to Scott for directing bug/periphyton collection.
o Nancy Rosenbower, Leon Weiks, Aileen Richmond, Daniel Baker, Crystal Bowen, Kim Archer, Kamilee Ginder, Meredith Jones, and Dean Momohara (Manchester Environmental Laboratory – Environmental Assessment Program) for sample delivery, processing, analysis, and reporting.
Page 9
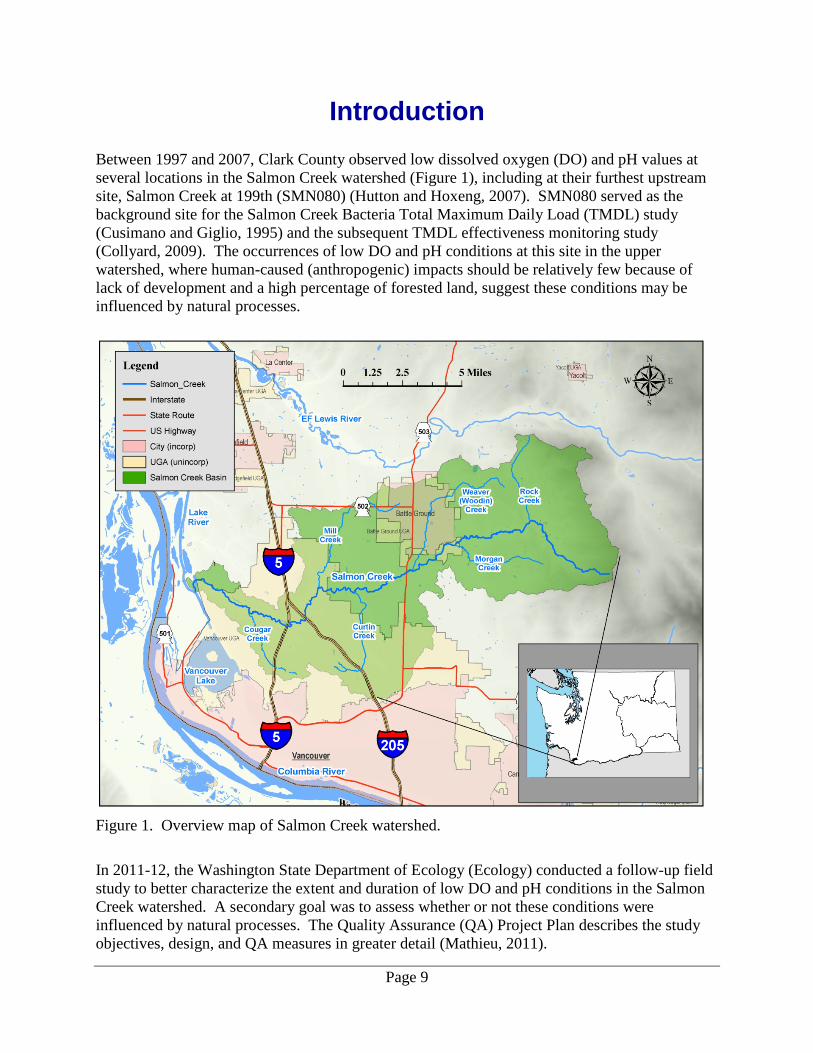
Introduction Between 1997 and 2007, Clark County observed low dissolved oxygen (DO) and pH values at several locations in the Salmon Creek watershed (Figure 1), including at their furthest upstream site, Salmon Creek at 199th (SMN080) (Hutton and Hoxeng, 2007). SMN080 served as the background site for the Salmon Creek Bacteria Total Maximum Daily Load (TMDL) study (Cusimano and Giglio, 1995) and the subsequent TMDL effectiveness monitoring study (Collyard, 2009). The occurrences of low DO and pH conditions at this site in the upper watershed, where human-caused (anthropogenic) impacts should be relatively few because of lack of development and a high percentage of forested land, suggest these conditions may be influenced by natural processes.
Figure 1. Overview map of Salmon Creek watershed.
In 2011-12, the Washington State Department of Ecology (Ecology) conducted a follow-up field study to better characterize the extent and duration of low DO and pH conditions in the Salmon Creek watershed. A secondary goal was to assess whether or not these conditions were influenced by natural processes. The Quality Assurance (QA) Project Plan describes the study objectives, design, and QA measures in greater detail (Mathieu, 2011).
Page 10
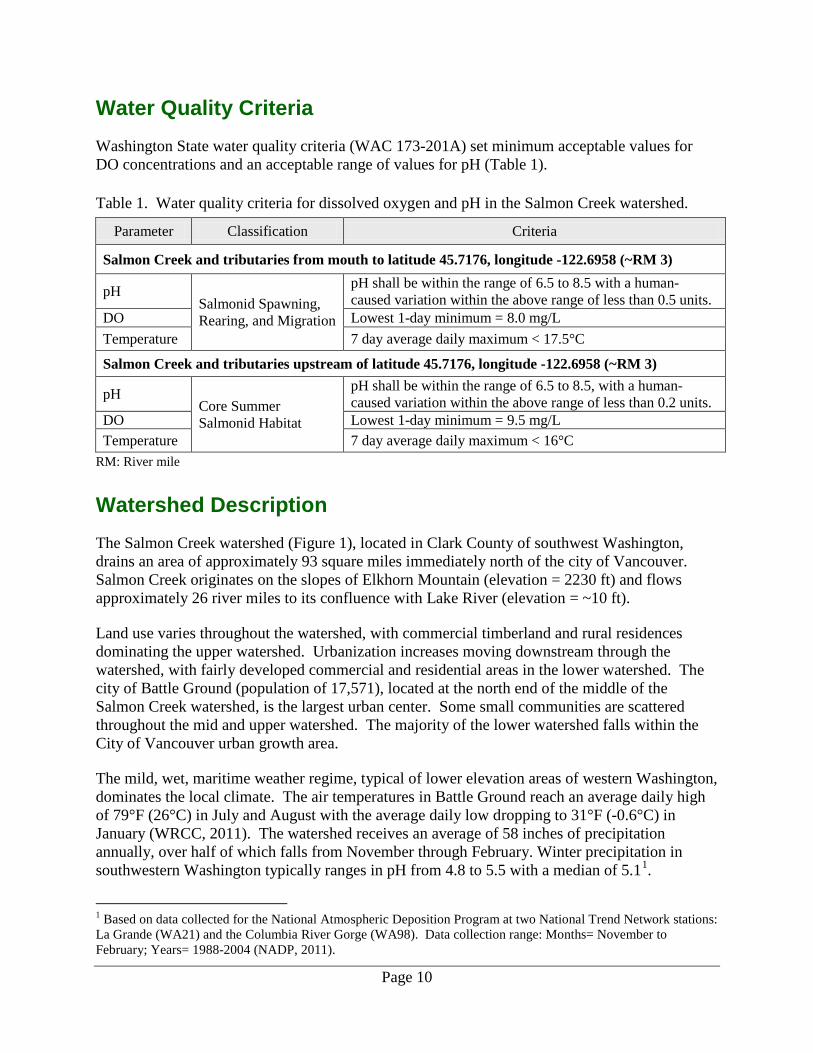
Water Quality Criteria Washington State water quality criteria (WAC 173-201A) set minimum acceptable values for DO concentrations and an acceptable range of values for pH (Table 1).
Table 1. Water quality criteria for dissolved oxygen and pH in the Salmon Creek watershed.
Parameter Classification Criteria
Salmon Creek and tributaries from mouth to latitude 45.7176, longitude -122.6958 (~RM 3)
pH Salmonid Spawning, Rearing, and Migration
pH shall be within the range of 6.5 to 8.5 with a human-caused variation within the above range of less than 0.5 units.
DO Lowest 1-day minimum = 8.0 mg/L Temperature 7 day average daily maximum < 17.5°C
Salmon Creek and tributaries upstream of latitude 45.7176, longitude -122.6958 (~RM 3)
pH Core Summer Salmonid Habitat
pH shall be within the range of 6.5 to 8.5, with a human-caused variation within the above range of less than 0.2 units.
DO Lowest 1-day minimum = 9.5 mg/L Temperature 7 day average daily maximum < 16°C
RM: River mile
Watershed Description The Salmon Creek watershed (Figure 1), located in Clark County of southwest Washington, drains an area of approximately 93 square miles immediately north of the city of Vancouver. Salmon Creek originates on the slopes of Elkhorn Mountain (elevation = 2230 ft) and flows approximately 26 river miles to its confluence with Lake River (elevation = ~10 ft). Land use varies throughout the watershed, with commercial timberland and rural residences dominating the upper watershed. Urbanization increases moving downstream through the watershed, with fairly developed commercial and residential areas in the lower watershed. The city of Battle Ground (population of 17,571), located at the north end of the middle of the Salmon Creek watershed, is the largest urban center. Some small communities are scattered throughout the mid and upper watershed. The majority of the lower watershed falls within the City of Vancouver urban growth area. The mild, wet, maritime weather regime, typical of lower elevation areas of western Washington, dominates the local climate. The air temperatures in Battle Ground reach an average daily high of 79°F (26°C) in July and August with the average daily low dropping to 31°F (-0.6°C) in January (WRCC, 2011). The watershed receives an average of 58 inches of precipitation annually, over half of which falls from November through February. Winter precipitation in southwestern Washington typically ranges in pH from 4.8 to 5.5 with a median of 5.11.
1 Based on data collected for the National Atmospheric Deposition Program at two National Trend Network stations: La Grande (WA21) and the Columbia River Gorge (WA98). Data collection range: Months= November to February; Years= 1988-2004 (NADP, 2011).
Page 11
The geology of the watershed is characterized by older consolidated bedrock that has been filled, particularly at lower elevations, by a series of younger sedimentary deposits (Mundorff, 1964). Hydrogeologic units of Clark County have been identified by R.D. Swanson, amongst others, and summarized in a U.S. Geological Survey (USGS) report (Turney, 1990). In general, the surficial geology consists of the older bedrock unit in the Upper Salmon Creek watershed and an unconsolidated sedimentary aquifer in the lower watershed. Due to its productivity, the Troutdale gravel aquifer unit is the primary source of groundwater in Clark County. This unit begins in the Middle to Upper Salmon Creek watershed as the surface unit and is present throughout the rest of the watershed (downgradient), immediately beneath the unconsolidated sedimentary aquifer unit. A more detailed description of geology and hydrogeology in the watershed can be found in Mundorff (1964) and Turney (1990).
Comparison of the Jones and Upper Salmon Basins Jones Creek, located approximately 5 miles north of the City of Washougal, is a tributary to the Little Washougal River. Jones Creek served as a relatively low-impact control site for the study. The extent of human development and resource management in the lower elevation basins of Western Washington make it difficult to locate an appropriate reference/control basin for Salmon Creek. Ecology compared characteristics of the Jones Creek basin and the Upper Salmon Creek basin to assess similarities and the level of anthropogenic impact in each basin. For the purpose of this report, the ‘Jones basin’ refers to the area that drains to the sampling location Jones (JON010) and the ‘Upper Salmon basin’ refers to the area that drains to the sampling location Upper Salmon (SMN086). The two basins exhibit fairly similar physical (geography, climate, geology) and land use characteristics with a few notable differences (Table 2). The Jones basin is slightly smaller, wetter, steeper, and higher in elevation with primarily Olympic clay loam soils. A similar soil type, Olympic stony clay loam covers the majority of the Upper Salmon basin. The Olympic series typically drains well and produces slow to medium runoff; soil acidity ranges from slightly acidic (pH~6.2), at shallow soil horizons, to very strongly acidic (pH~4.8), at deeper soil horizons (USDA, 2012). An older basalt bedrock unit dominates the surficial geology of both basins. Presumably, the surficial bedrock and acidic soil type contribute to the poor buffering capacity of both Jones and Upper Salmon Creeks. Approximately 85% of the Upper Salmon basin is forested land (private managed, public managed, or private undeveloped), whereas 100% of the Jones basin is forested. Most of the remaining land in the Upper Salmon basin (12.9%) is low-density rural residential with on-site septic systems. Approximately one-third of the Jones basin is owned by the City of Camas and protected as a municipal drinking water source.
Page 12
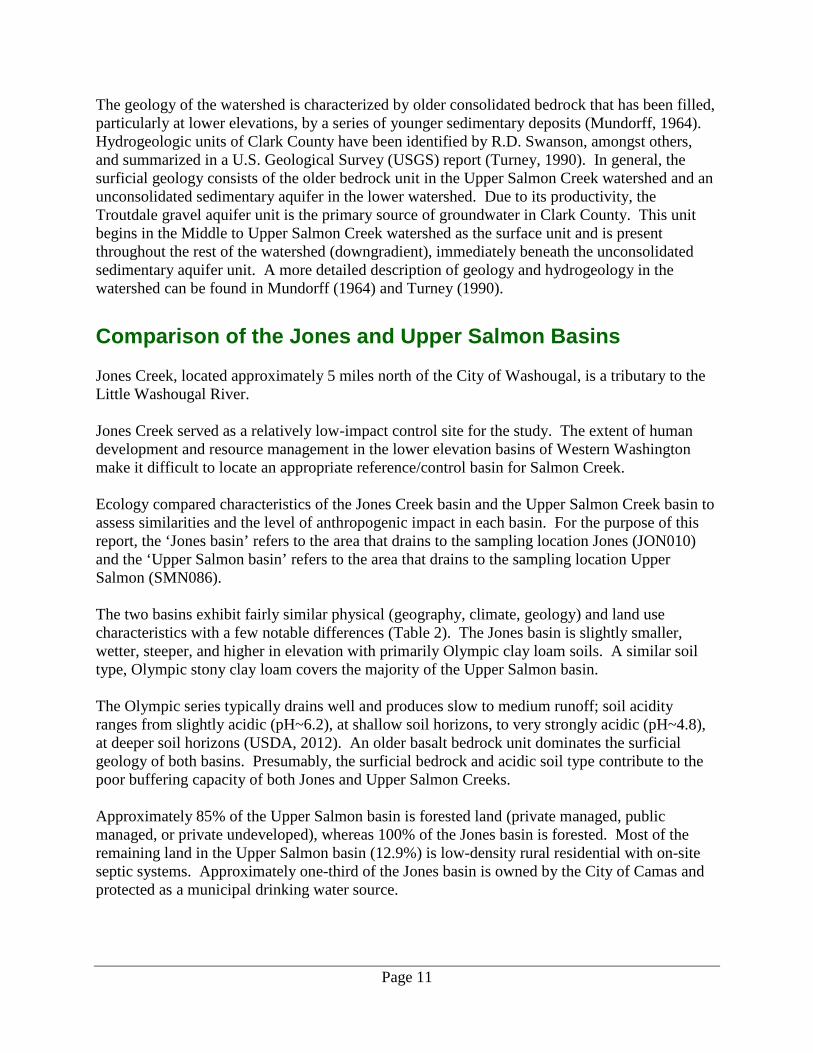
Table 2. Comparison of the Jones and Upper Salmon basins.
JON010 SMN086
General Drainage area (square miles) 2.99 4.13 Elevation (ft) 714 506 Basin relief (ft) 2430 1720 Average slope 24.7% 17.6% Average precipitation (in/yr) 82 76 Dominant soil type Ol Om Surficial geology BR BR Land Use % Commercial Timber Forest 30.7% 64.0% % Public Forest 35.9% 8.8% % Protected Watershed* 33.4% 0.0% % Residential 0.0% 12.9% % Undeveloped 0.0% 13.0% % Agriculture 0.0% 0.0% % Impervious 0.1% 0.3% Acres of Wetlands 26.18 2.88 Acres of Lakes and Ponds 0.13 3.82 Miles of Road (digitized from 2011 orthophotos) 10.1 21.2 Road Density 3.39 5.14
BR: Older bedrock unit Ol: Olympic clay loam (3% -60% slopes) Om: Olympic stony clay loam (3% -60% slopes) * The City of Camas protects a portion of the Jones Creek watershed as a drinking water supply.
Logging poses the only potential anthropogenic impact to water quality within the Jones basin. Several human activities within the Upper Salmon basin could potentially impact water quality including logging, on-site septic systems, residential fertilizer application, man-made water features (e.g., ponds), and domestic pets or livestock. Any logging impact would likely be greater in the Upper Salmon basin, given that it contains more acres of managed forest (1,942 vs. 1,271), more miles of road, and a greater road density. However, the steeper topography of the Jones basin may increase the efficiency of transportation of sediments and organic material from logging roads and harvested areas. The Jones basin contains nearly 10 times the Upper Salmon basin wetland acreage (26.18 vs 2.88) and almost no acreage with lakes or ponds (0.13). The Upper Salmon basin contains 3.82 acres of, mostly man-made, ponds or small lakes. Wetland processes could present a significant natural influence in the Jones basin but are unlikely to significantly impact the Upper Salmon basin.
Page 13
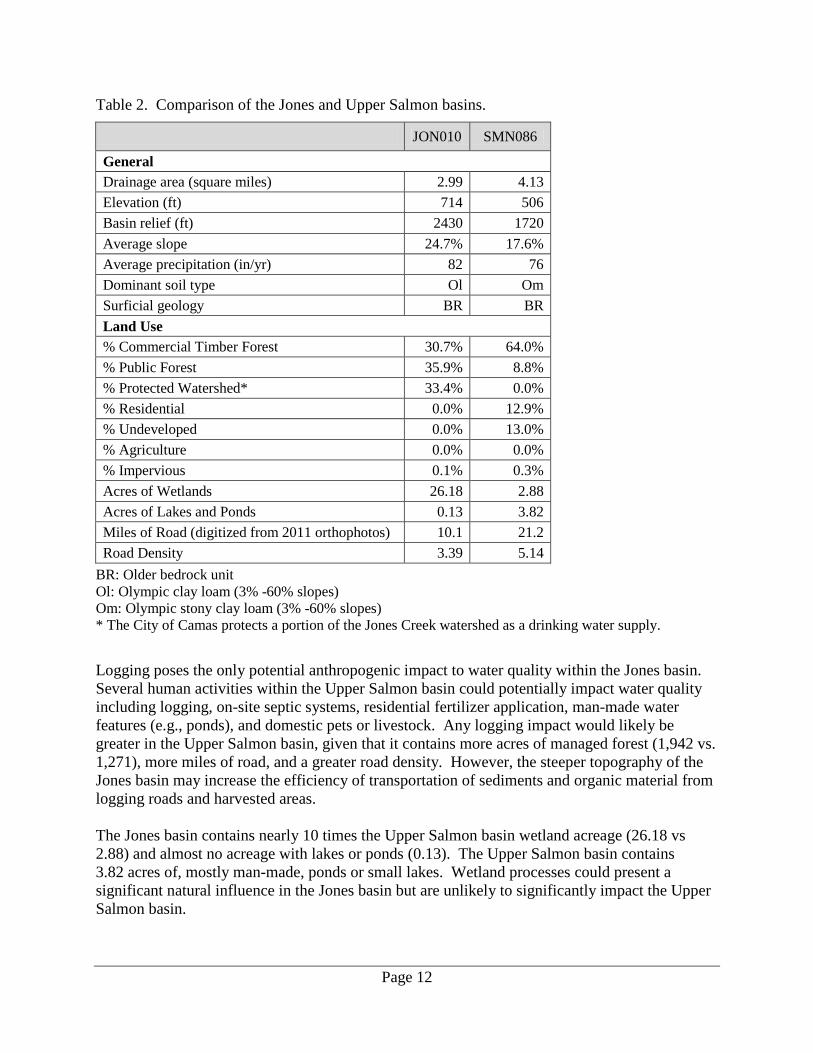
Methods Staff from Ecology’s Environmental Assessment Program collected all measurements and samples for the study following well established and documented protocols. Ecology’s Manchester Environmental Laboratory performed all laboratory analysis, with the exception of periphyton and macroinvertebrate identification, which was performed by Rhithron Associates, Inc. The QA Project Plan provides a more detailed description of field, laboratory, and quality control methods (Mathieu, 2011).
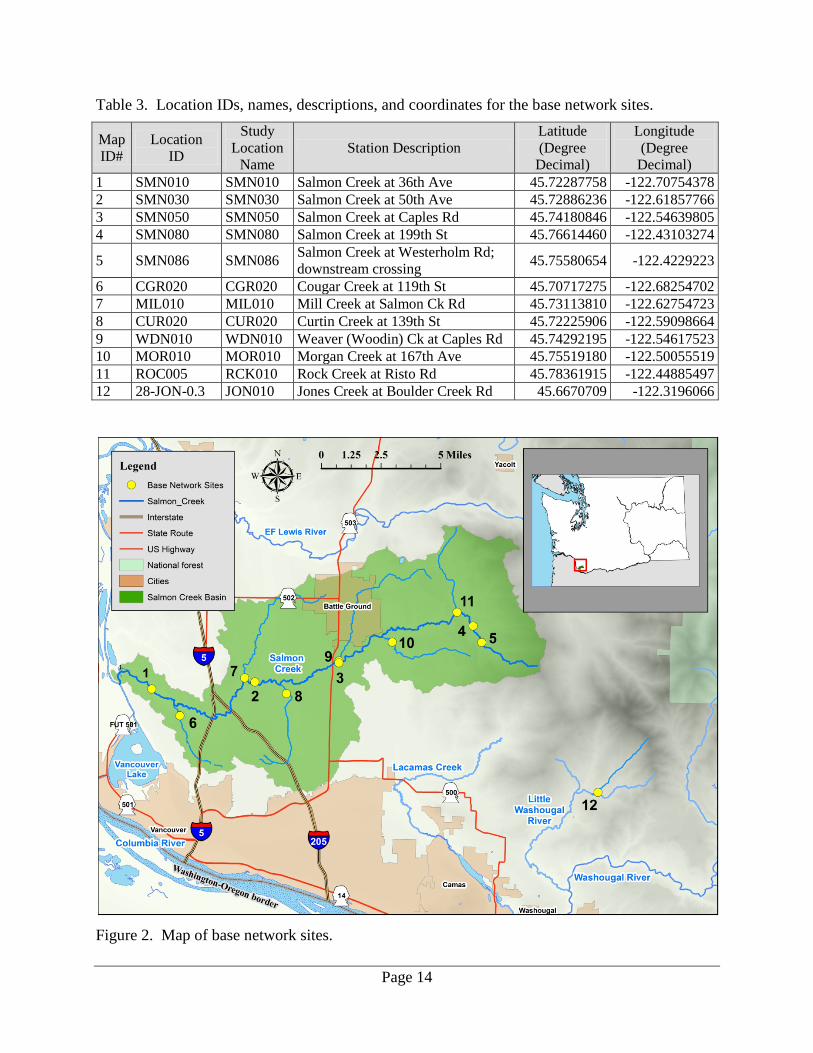
Sampling Locations and Dates Field staff collected data from two networks of monitoring locations, the base network and the extended network. The base network consisted of 11 stations throughout the Salmon Creek watershed and one reference/control basin outside the watershed, Jones Creek at Boulder Creek Road (JON010) (Table 3 and Figure 2). Several differences in sample location and naming convention exist between the base network locations table in the QA Project Plan and this report. Location IDs were already established in Ecology’s Environmental Information Management (EIM) database for most of the sites, so Ecology changed the Location IDs for this study to match. In addition, the location of Salmon Creek at end of Westerholm (SMN095) was moved downstream to Salmon Creek at Westerholm (SMN086) because Ecology was unable to obtain access on the private timberland at the desired upstream location (SMN095). When referencing locations within this report, the author has used an abbreviation of the station description, followed by the study location name in parentheses, to provide multiple references to station location:
• For example, Salmon Creek at 36th Ave becomes Salmon at 36th (SMN010), and Salmon Creek at Westerholm Rd becomes Upper Salmon (SMN086).
The number in the study location name refers to the approximate percent of the total stream length in reference to the mouth.
• For example, the distance from the mouth of Salmon Creek to SMN010 is approximately 10% of the total length of Salmon Creek.
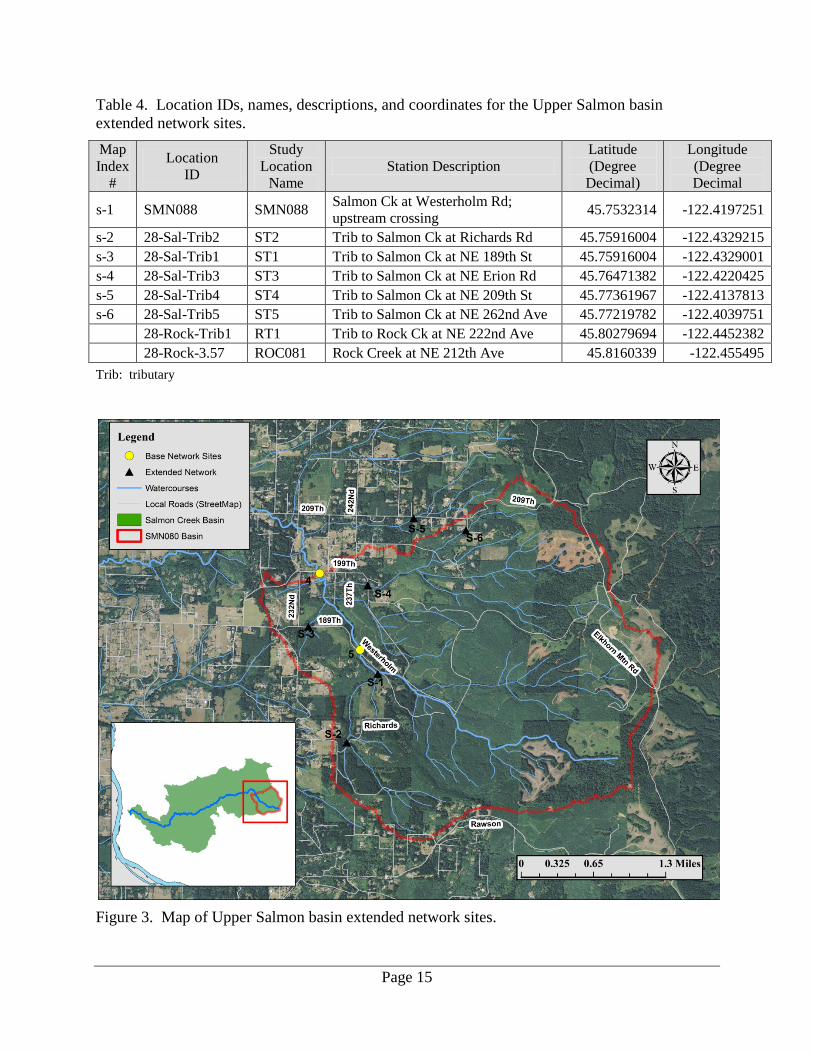
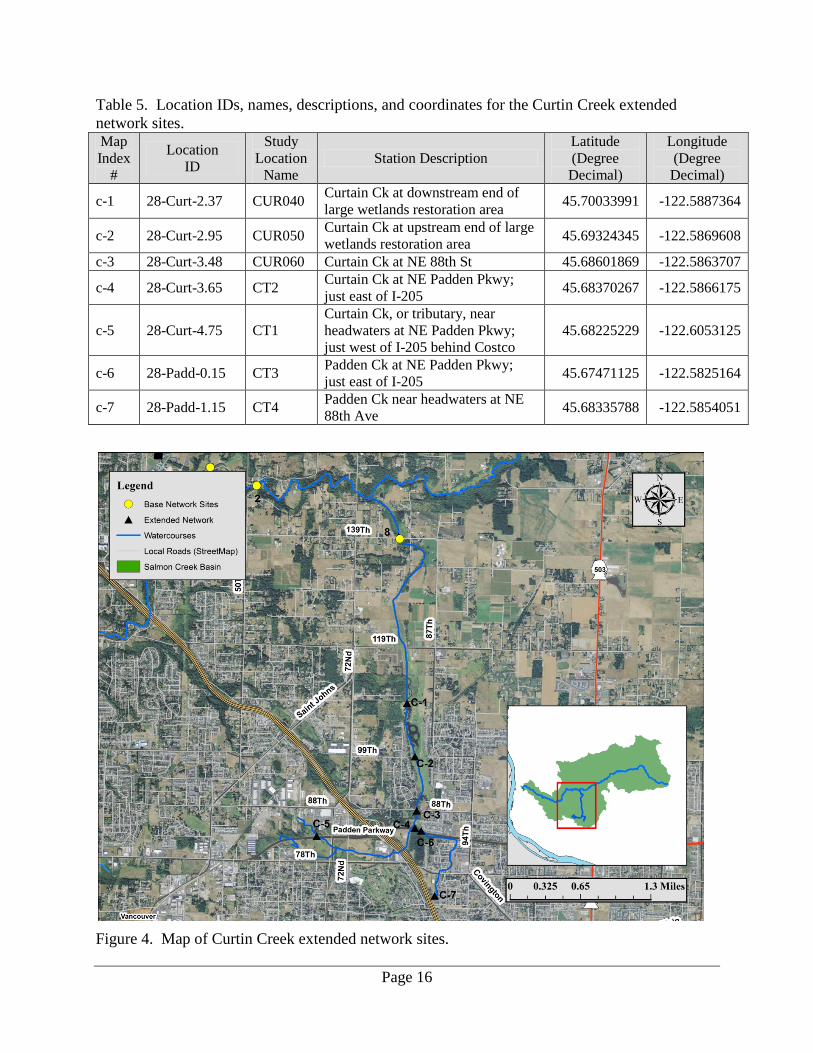
The extended network consisted of additional locations concentrated in the Upper Salmon and Curtin Creek watersheds (Tables 4-5; Figures 3-4).
Page 14
Table 3. Location IDs, names, descriptions, and coordinates for the base network sites.
Map ID#
Location ID
Study Location
Name Station Description
Latitude (Degree Decimal)
Longitude (Degree Decimal)
1 SMN010 SMN010 Salmon Creek at 36th Ave 45.72287758 -122.70754378 2 SMN030 SMN030 Salmon Creek at 50th Ave 45.72886236 -122.61857766 3 SMN050 SMN050 Salmon Creek at Caples Rd 45.74180846 -122.54639805 4 SMN080 SMN080 Salmon Creek at 199th St 45.76614460 -122.43103274
5 SMN086 SMN086 Salmon Creek at Westerholm Rd; downstream crossing 45.75580654 -122.4229223
6 CGR020 CGR020 Cougar Creek at 119th St 45.70717275 -122.68254702 7 MIL010 MIL010 Mill Creek at Salmon Ck Rd 45.73113810 -122.62754723 8 CUR020 CUR020 Curtin Creek at 139th St 45.72225906 -122.59098664 9 WDN010 WDN010 Weaver (Woodin) Ck at Caples Rd 45.74292195 -122.54617523 10 MOR010 MOR010 Morgan Creek at 167th Ave 45.75519180 -122.50055519 11 ROC005 RCK010 Rock Creek at Risto Rd 45.78361915 -122.44885497 12 28-JON-0.3 JON010 Jones Creek at Boulder Creek Rd 45.6670709 -122.3196066
Figure 2. Map of base network sites.
Page 15
Table 4. Location IDs, names, descriptions, and coordinates for the Upper Salmon basin extended network sites. Map Index
#
Location ID
Study Location
Name Station Description
Latitude (Degree Decimal)
Longitude (Degree Decimal
s-1 SMN088 SMN088 Salmon Ck at Westerholm Rd; upstream crossing 45.7532314 -122.4197251
s-2 28-Sal-Trib2 ST2 Trib to Salmon Ck at Richards Rd 45.75916004 -122.4329215 s-3 28-Sal-Trib1 ST1 Trib to Salmon Ck at NE 189th St 45.75916004 -122.4329001 s-4 28-Sal-Trib3 ST3 Trib to Salmon Ck at NE Erion Rd 45.76471382 -122.4220425 s-5 28-Sal-Trib4 ST4 Trib to Salmon Ck at NE 209th St 45.77361967 -122.4137813 s-6 28-Sal-Trib5 ST5 Trib to Salmon Ck at NE 262nd Ave 45.77219782 -122.4039751
28-Rock-Trib1 RT1 Trib to Rock Ck at NE 222nd Ave 45.80279694 -122.4452382
28-Rock-3.57 ROC081 Rock Creek at NE 212th Ave 45.8160339 -122.455495 Trib: tributary
Figure 3. Map of Upper Salmon basin extended network sites.
Page 16
Table 5. Location IDs, names, descriptions, and coordinates for the Curtin Creek extended network sites. Map Index
#
Location ID
Study Location
Name Station Description
Latitude (Degree Decimal)
Longitude (Degree Decimal)
c-1 28-Curt-2.37 CUR040 Curtain Ck at downstream end of large wetlands restoration area 45.70033991 -122.5887364
c-2 28-Curt-2.95 CUR050 Curtain Ck at upstream end of large wetlands restoration area 45.69324345 -122.5869608
c-3 28-Curt-3.48 CUR060 Curtain Ck at NE 88th St 45.68601869 -122.5863707
c-4 28-Curt-3.65 CT2 Curtain Ck at NE Padden Pkwy; just east of I-205 45.68370267 -122.5866175
c-5 28-Curt-4.75 CT1 Curtain Ck, or tributary, near headwaters at NE Padden Pkwy; just west of I-205 behind Costco
45.68225229 -122.6053125
c-6 28-Padd-0.15 CT3 Padden Ck at NE Padden Pkwy; just east of I-205 45.67471125 -122.5825164
c-7 28-Padd-1.15 CT4 Padden Ck near headwaters at NE 88th Ave 45.68335788 -122.5854051
Figure 4. Map of Curtin Creek extended network sites.
Page 17
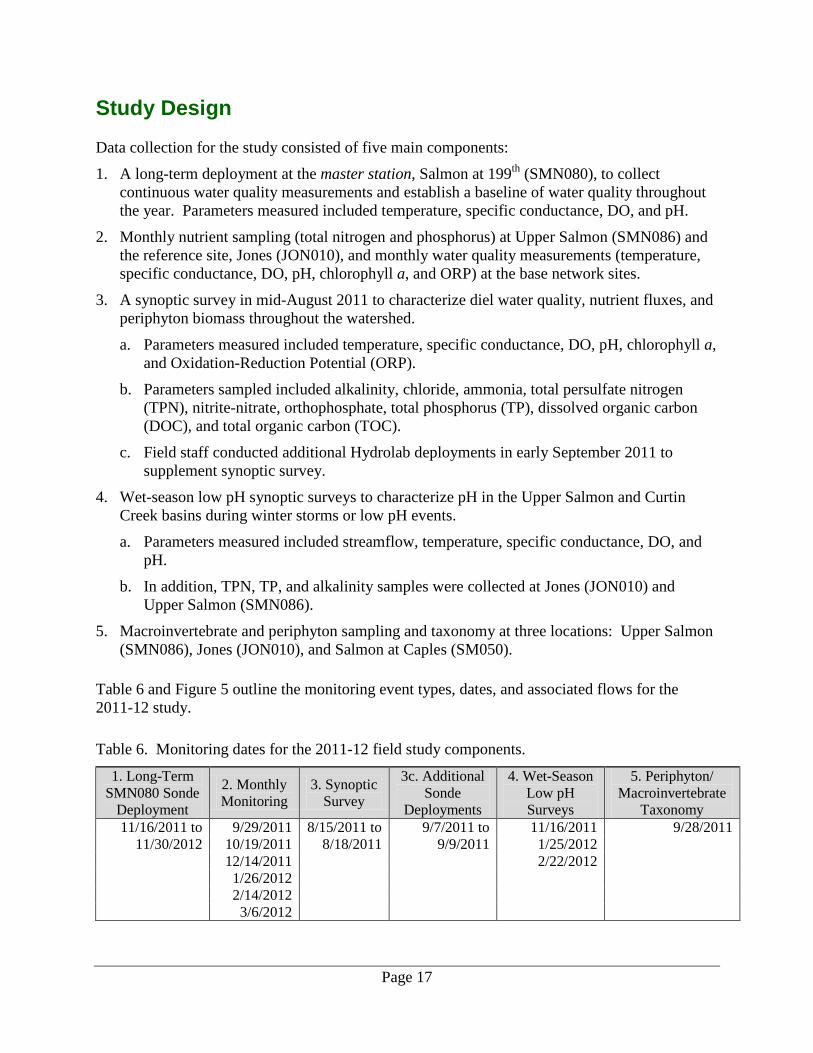
Study Design Data collection for the study consisted of five main components:
1. A long-term deployment at the master station, Salmon at 199th (SMN080), to collect continuous water quality measurements and establish a baseline of water quality throughout the year. Parameters measured included temperature, specific conductance, DO, and pH.
2. Monthly nutrient sampling (total nitrogen and phosphorus) at Upper Salmon (SMN086) and the reference site, Jones (JON010), and monthly water quality measurements (temperature, specific conductance, DO, pH, chlorophyll a, and ORP) at the base network sites.
3. A synoptic survey in mid-August 2011 to characterize diel water quality, nutrient fluxes, and periphyton biomass throughout the watershed.
a. Parameters measured included temperature, specific conductance, DO, pH, chlorophyll a, and Oxidation-Reduction Potential (ORP).
b. Parameters sampled included alkalinity, chloride, ammonia, total persulfate nitrogen (TPN), nitrite-nitrate, orthophosphate, total phosphorus (TP), dissolved organic carbon (DOC), and total organic carbon (TOC).
c. Field staff conducted additional Hydrolab deployments in early September 2011 to supplement synoptic survey.
4. Wet-season low pH synoptic surveys to characterize pH in the Upper Salmon and Curtin Creek basins during winter storms or low pH events.
a. Parameters measured included streamflow, temperature, specific conductance, DO, and pH.
b. In addition, TPN, TP, and alkalinity samples were collected at Jones (JON010) and Upper Salmon (SMN086).
5. Macroinvertebrate and periphyton sampling and taxonomy at three locations: Upper Salmon (SMN086), Jones (JON010), and Salmon at Caples (SM050).
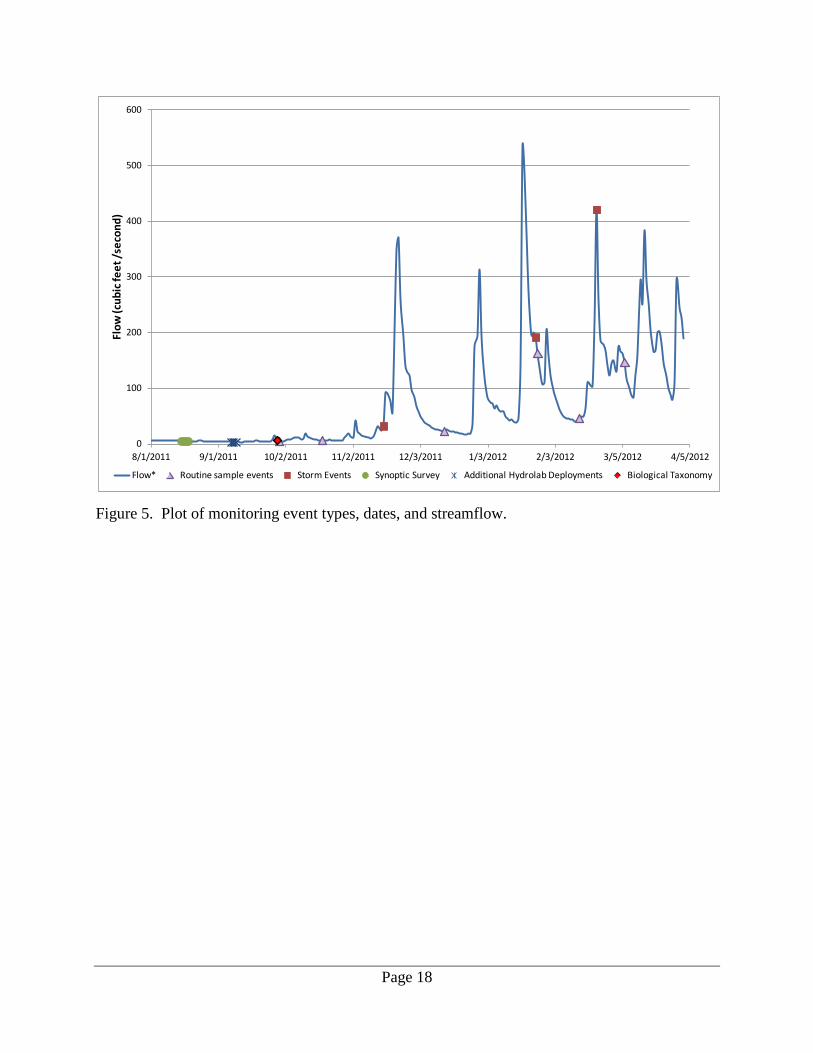
Table 6 and Figure 5 outline the monitoring event types, dates, and associated flows for the 2011-12 study.
Table 6. Monitoring dates for the 2011-12 field study components.
1. Long-Term SMN080 Sonde
Deployment
2. Monthly Monitoring
3. Synoptic Survey
3c. Additional Sonde
Deployments
4. Wet-Season Low pH Surveys
5. Periphyton/ Macroinvertebrate
Taxonomy 11/16/2011 to 9/29/2011 8/15/2011 to 9/7/2011 to 11/16/2011 9/28/2011
11/30/2012 10/19/2011 8/18/2011 9/9/2011 1/25/2012 12/14/2011
2/22/2012 1/26/2012 2/14/2012
3/6/2012
Page 18
Figure 5. Plot of monitoring event types, dates, and streamflow.
0
100
200
300
400
500
600
8/1/2011 9/1/2011 10/2/2011 11/2/2011 12/3/2011 1/3/2012 2/3/2012 3/5/2012 4/5/2012
Flow
(cub
ic fe
et /s
econ
d)
Flow* Routine sample events Storm Events Synoptic Survey Additional Hydrolab Deployments Biological Taxonomy

Page 19
Results
Data Quality Results Completeness In 2011, the Washington State Department of Labor and Industries began requiring a permit for solar panel installations; a permit was not previously required for this type of station installation. The permit requirement delayed the installation of the continuous water quality station at Salmon at 199th until November 2011. The permit also required that the station be grounded in a specific way. The grounding method resulted in electrical interference to the pH sensor that caused unstable readings and rapid drift. After several months of working to identify the problem and troubleshoot a solution, the issue was resolved and the pH readings stabilized. As a result, Ecology did not obtain quality continuous pH data until early February 2012. To compensate for the lack of continuous data collected to-date, the station installation was extended through the end of October 2012 to capture continuous water quality during an entire summer. Due to these complications with the continuous water quality station, the project completeness goal of successfully collecting greater than 95% of the data described in the QA Project Plan was not met; however, with the extended deployment, Ecology collected continuous water quality throughout an entire summer (June –September 2012), as well as during several consecutive months of the winter low pH season (February to April 2012). This revised data collection plan is sufficient to meet the project goals and objectives. Field and Laboratory Quality Control Procedures and MQOs All laboratory and field duplicates samples, with results greater than five times the reporting limit, passed their respective measurement quality objectives (MQOs). The project manager reviewed all duplicates with results less than five times the reporting limit and deemed the result quality acceptable. Field duplicate measurements met their respective MQOs. All field blank results fell below their respective method reporting limits. All but two lab blank results fell below the reporting limits. The two errant lab blanks resulted in volatile organic matter (ash-free dry weight) results of 5.05 and 4 mg/L respectively (reporting limit of 1 mg/L). The potential contamination level was equal to approximately 3% of the lowest reported result for the study, which met the MQO for acceptable bias. All matrix spike and laboratory control sample recoveries fell within Manchester Laboratory’s acceptance limits as well as MQOs outlined in the QA Project Plan (MEL, 2012).
Page 20
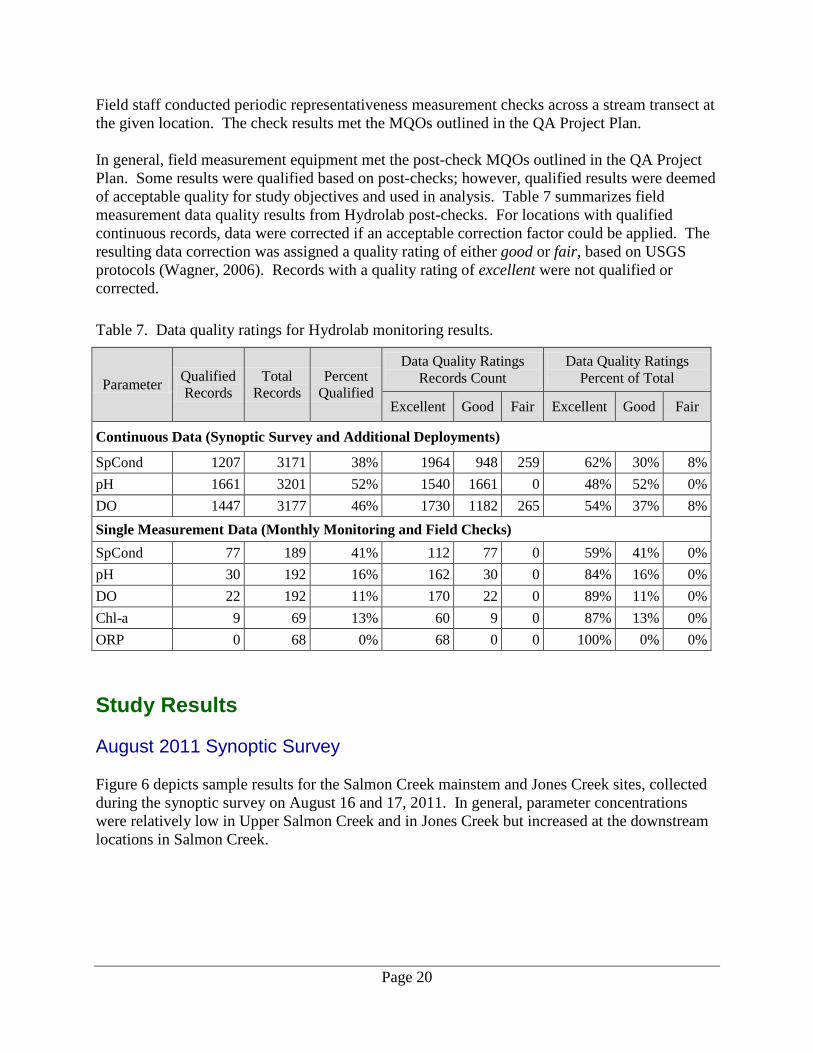
Field staff conducted periodic representativeness measurement checks across a stream transect at the given location. The check results met the MQOs outlined in the QA Project Plan. In general, field measurement equipment met the post-check MQOs outlined in the QA Project Plan. Some results were qualified based on post-checks; however, qualified results were deemed of acceptable quality for study objectives and used in analysis. Table 7 summarizes field measurement data quality results from Hydrolab post-checks. For locations with qualified continuous records, data were corrected if an acceptable correction factor could be applied. The resulting data correction was assigned a quality rating of either good or fair, based on USGS protocols (Wagner, 2006). Records with a quality rating of excellent were not qualified or corrected.
Table 7. Data quality ratings for Hydrolab monitoring results.
Parameter Qualified Records
Total Records
Percent Qualified
Data Quality Ratings Records Count
Data Quality Ratings Percent of Total
Excellent Good Fair Excellent Good Fair
Continuous Data (Synoptic Survey and Additional Deployments)
SpCond 1207 3171 38% 1964 948 259 62% 30% 8% pH 1661 3201 52% 1540 1661 0 48% 52% 0% DO 1447 3177 46% 1730 1182 265 54% 37% 8% Single Measurement Data (Monthly Monitoring and Field Checks) SpCond 77 189 41% 112 77 0 59% 41% 0% pH 30 192 16% 162 30 0 84% 16% 0% DO 22 192 11% 170 22 0 89% 11% 0% Chl-a 9 69 13% 60 9 0 87% 13% 0% ORP 0 68 0% 68 0 0 100% 0% 0%
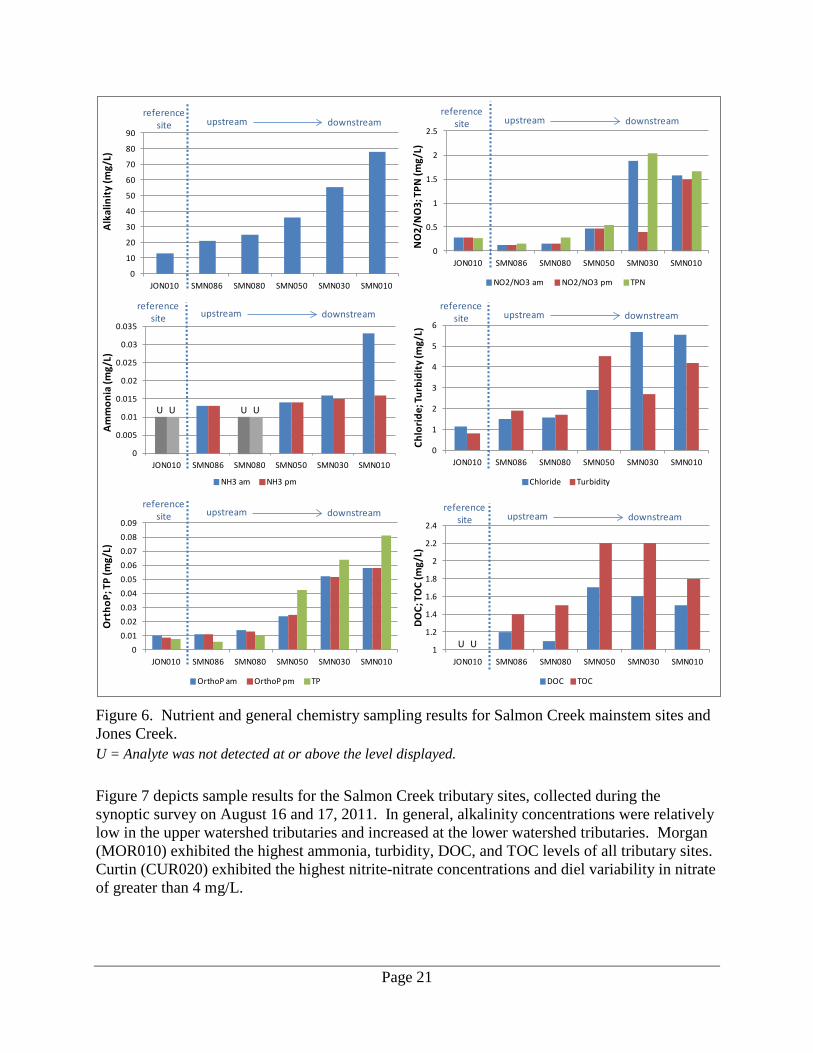
Study Results August 2011 Synoptic Survey Figure 6 depicts sample results for the Salmon Creek mainstem and Jones Creek sites, collected during the synoptic survey on August 16 and 17, 2011. In general, parameter concentrations were relatively low in Upper Salmon Creek and in Jones Creek but increased at the downstream locations in Salmon Creek.
Page 21
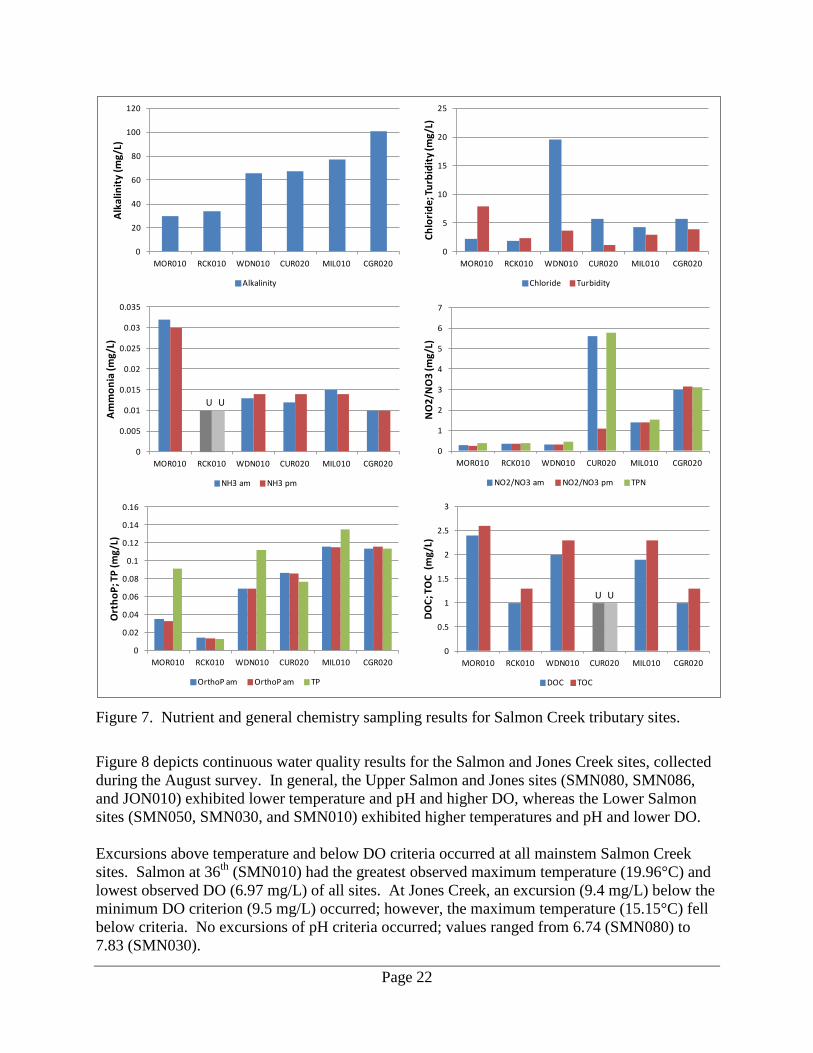
Figure 6. Nutrient and general chemistry sampling results for Salmon Creek mainstem sites and Jones Creek. U = Analyte was not detected at or above the level displayed. Figure 7 depicts sample results for the Salmon Creek tributary sites, collected during the synoptic survey on August 16 and 17, 2011. In general, alkalinity concentrations were relatively low in the upper watershed tributaries and increased at the lower watershed tributaries. Morgan (MOR010) exhibited the highest ammonia, turbidity, DOC, and TOC levels of all tributary sites. Curtin (CUR020) exhibited the highest nitrite-nitrate concentrations and diel variability in nitrate of greater than 4 mg/L.
0
10
20
30
40
50
60
70
80
90
JON010 SMN086 SMN080 SMN050 SMN030 SMN010
Alka
linity
(mg/
L)reference
site upstream downstream
0
0.005
0.01
0.015
0.02
0.025
0.03
0.035
JON010 SMN086 SMN080 SMN050 SMN030 SMN010
Amm
onia
(mg/
L)
NH3 am NH3 pm
U UU U
reference site upstream downstream
0
0.5
1
1.5
2
2.5
JON010 SMN086 SMN080 SMN050 SMN030 SMN010
NO
2/N
O3;
TPN
(mg/
L)
NO2/NO3 am NO2/NO3 pm TPN
reference site upstream downstream
00.010.020.030.040.050.060.070.080.09
JON010 SMN086 SMN080 SMN050 SMN030 SMN010
Ort
hoP;
TP
(mg/
L)
OrthoP am OrthoP pm TP
reference site upstream downstream
1
1.2
1.4
1.6
1.8
2
2.2
2.4
JON010 SMN086 SMN080 SMN050 SMN030 SMN010
DOC;
TO
C (m
g/L)
DOC TOC
U U
reference site upstream downstream
0
1
2
3
4
5
6
JON010 SMN086 SMN080 SMN050 SMN030 SMN010
Chlo
ride;
Turb
idity
(mg/
L)
Chloride Turbidity
reference site upstream downstream
Page 22
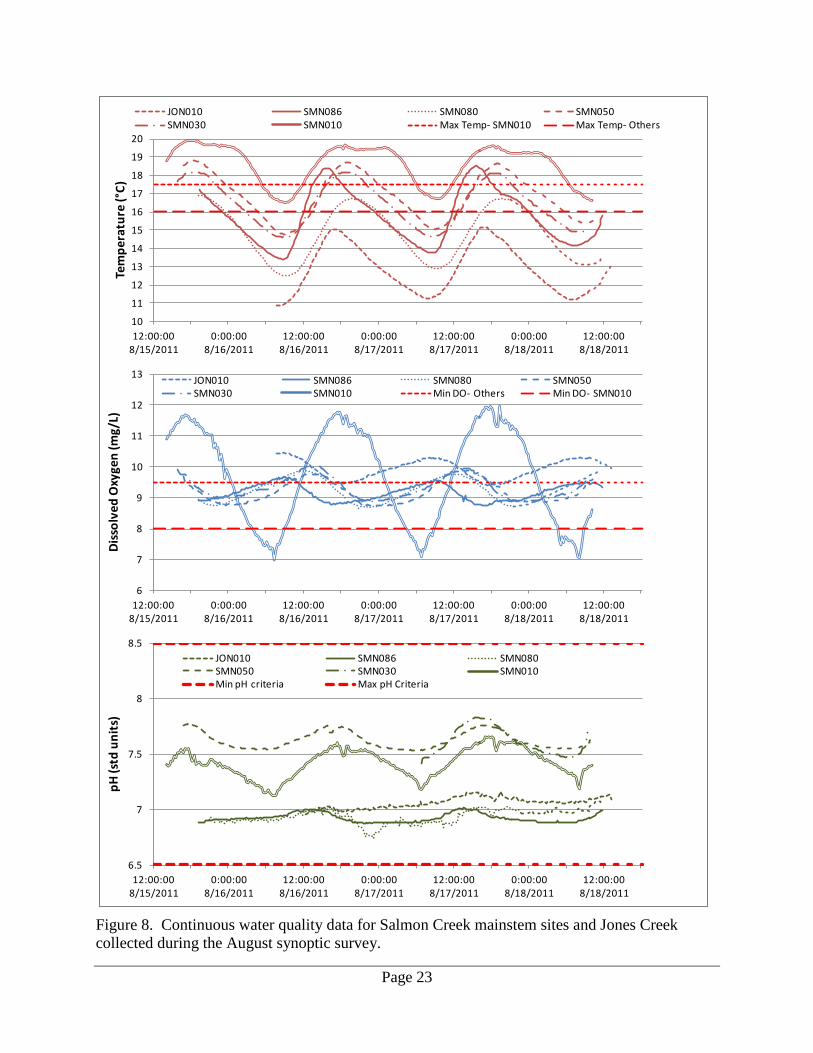
Figure 7. Nutrient and general chemistry sampling results for Salmon Creek tributary sites. Figure 8 depicts continuous water quality results for the Salmon and Jones Creek sites, collected during the August survey. In general, the Upper Salmon and Jones sites (SMN080, SMN086, and JON010) exhibited lower temperature and pH and higher DO, whereas the Lower Salmon sites (SMN050, SMN030, and SMN010) exhibited higher temperatures and pH and lower DO. Excursions above temperature and below DO criteria occurred at all mainstem Salmon Creek sites. Salmon at 36th (SMN010) had the greatest observed maximum temperature (19.96°C) and lowest observed DO (6.97 mg/L) of all sites. At Jones Creek, an excursion (9.4 mg/L) below the minimum DO criterion (9.5 mg/L) occurred; however, the maximum temperature (15.15°C) fell below criteria. No excursions of pH criteria occurred; values ranged from 6.74 (SMN080) to 7.83 (SMN030).
0
20
40
60
80
100
120
MOR010 RCK010 WDN010 CUR020 MIL010 CGR020
Alka
linity
(mg/
L)
Alkalinity
0
0.005
0.01
0.015
0.02
0.025
0.03
0.035
MOR010 RCK010 WDN010 CUR020 MIL010 CGR020
Amm
onia
(mg/
L)
NH3 am NH3 pm
U U
0
1
2
3
4
5
6
7
MOR010 RCK010 WDN010 CUR020 MIL010 CGR020
NO
2/N
O3
(mg/
L)
NO2/NO3 am NO2/NO3 pm TPN
0
0.02
0.04
0.06
0.08
0.1
0.12
0.14
0.16
MOR010 RCK010 WDN010 CUR020 MIL010 CGR020
Ort
hoP;
TP
(mg/
L)
OrthoP am OrthoP am TP
0
0.5
1
1.5
2
2.5
3
MOR010 RCK010 WDN010 CUR020 MIL010 CGR020
DOC;
TO
C (m
g/L)
DOC TOC
U U
0
5
10
15
20
25
MOR010 RCK010 WDN010 CUR020 MIL010 CGR020
Chlo
ride;
Turb
idity
(mg/
L)
Chloride Turbidity
Page 23
Figure 8. Continuous water quality data for Salmon Creek mainstem sites and Jones Creek collected during the August synoptic survey.
6.5
7
7.5
8
8.5
12:00:008/15/2011
0:00:008/16/2011
12:00:008/16/2011
0:00:008/17/2011
12:00:008/17/2011
0:00:008/18/2011
12:00:008/18/2011
pH (s
td u
nits
)
JON010 SMN086 SMN080SMN050 SMN030 SMN010Min pH criteria Max pH Criteria
6
7
8
9
10
11
12
13
12:00:008/15/2011
0:00:008/16/2011
12:00:008/16/2011
0:00:008/17/2011
12:00:008/17/2011
0:00:008/18/2011
12:00:008/18/2011
Diss
olve
d O
xyge
n (m
g/L)
JON010 SMN086 SMN080 SMN050SMN030 SMN010 Min DO- Others Min DO- SMN010
10
11
12
13
14
15
16
17
18
19
20
12:00:008/15/2011
0:00:008/16/2011
12:00:008/16/2011
0:00:008/17/2011
12:00:008/17/2011
0:00:008/18/2011
12:00:008/18/2011
Tem
pera
ture
(°C)
JON010 SMN086 SMN080 SMN050SMN030 SMN010 Max Temp- SMN010 Max Temp- Others
Page 24
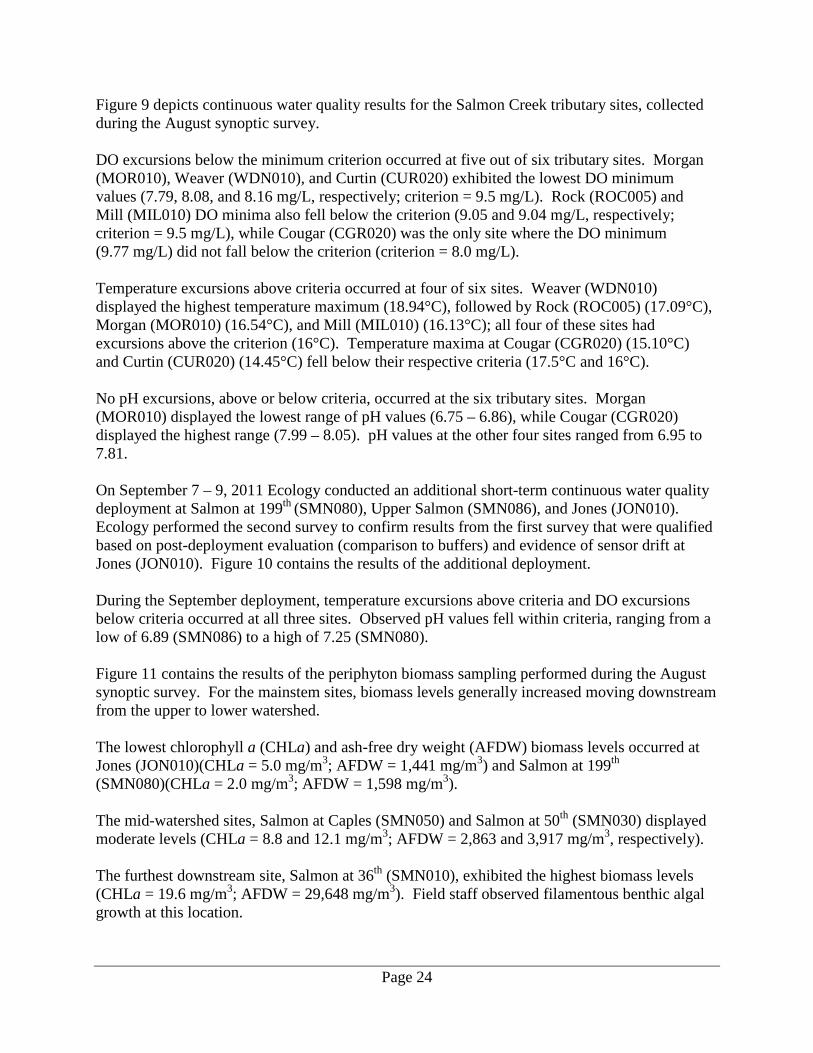
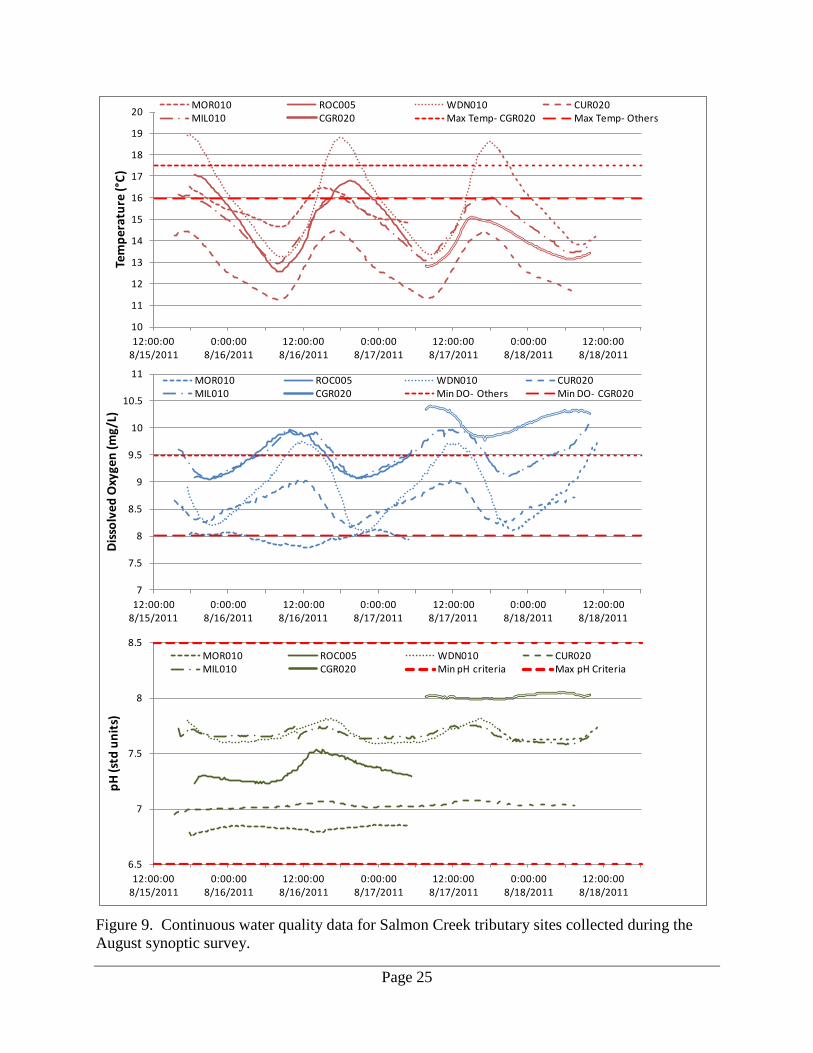
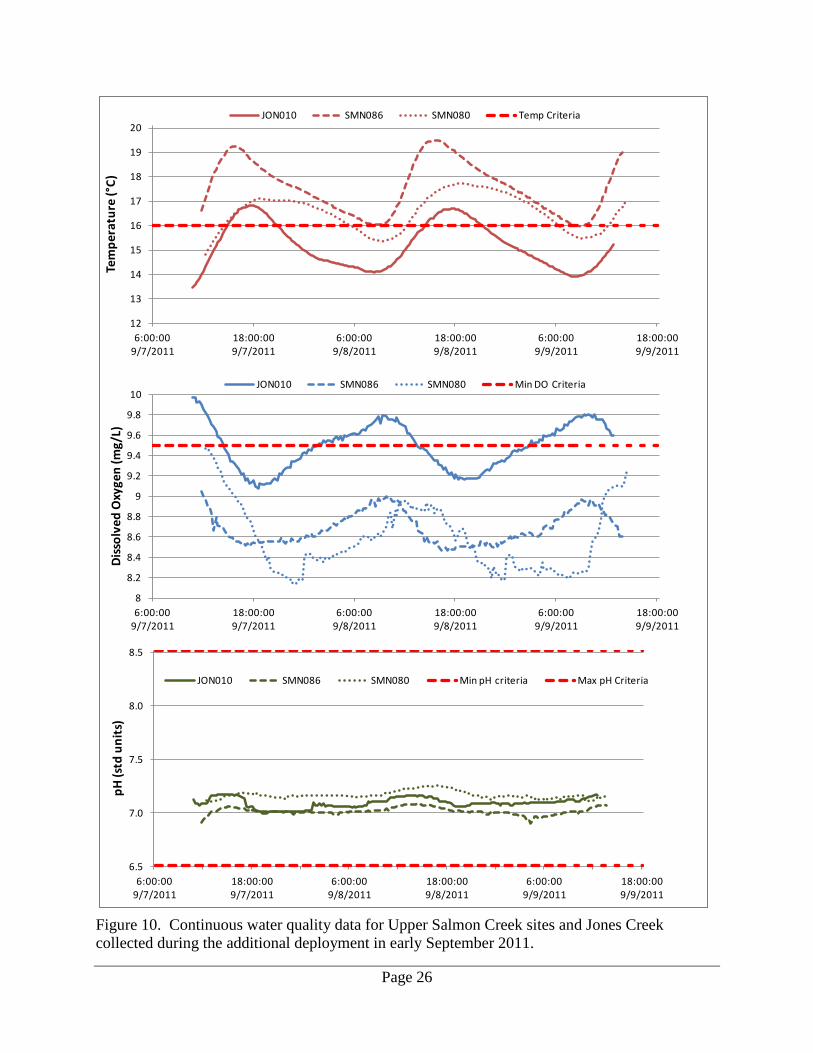
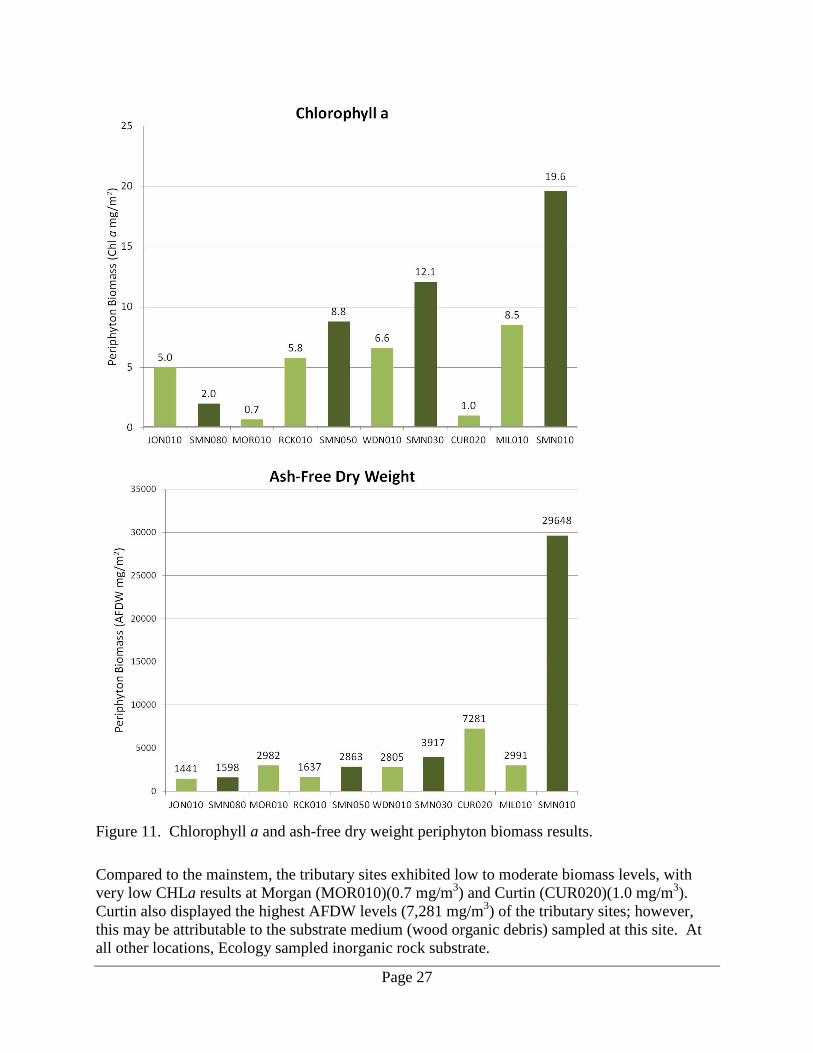
Figure 9 depicts continuous water quality results for the Salmon Creek tributary sites, collected during the August synoptic survey. DO excursions below the minimum criterion occurred at five out of six tributary sites. Morgan (MOR010), Weaver (WDN010), and Curtin (CUR020) exhibited the lowest DO minimum values (7.79, 8.08, and 8.16 mg/L, respectively; criterion = 9.5 mg/L). Rock (ROC005) and Mill (MIL010) DO minima also fell below the criterion (9.05 and 9.04 mg/L, respectively; criterion = 9.5 mg/L), while Cougar (CGR020) was the only site where the DO minimum (9.77 mg/L) did not fall below the criterion (criterion = 8.0 mg/L). Temperature excursions above criteria occurred at four of six sites. Weaver (WDN010) displayed the highest temperature maximum (18.94°C), followed by Rock (ROC005) (17.09°C), Morgan (MOR010) (16.54°C), and Mill (MIL010) (16.13°C); all four of these sites had excursions above the criterion (16°C). Temperature maxima at Cougar (CGR020) (15.10°C) and Curtin (CUR020) (14.45°C) fell below their respective criteria (17.5°C and 16°C). No pH excursions, above or below criteria, occurred at the six tributary sites. Morgan (MOR010) displayed the lowest range of pH values (6.75 – 6.86), while Cougar (CGR020) displayed the highest range (7.99 – 8.05). pH values at the other four sites ranged from 6.95 to 7.81. On September 7 – 9, 2011 Ecology conducted an additional short-term continuous water quality deployment at Salmon at 199th (SMN080), Upper Salmon (SMN086), and Jones (JON010). Ecology performed the second survey to confirm results from the first survey that were qualified based on post-deployment evaluation (comparison to buffers) and evidence of sensor drift at Jones (JON010). Figure 10 contains the results of the additional deployment. During the September deployment, temperature excursions above criteria and DO excursions below criteria occurred at all three sites. Observed pH values fell within criteria, ranging from a low of 6.89 (SMN086) to a high of 7.25 (SMN080). Figure 11 contains the results of the periphyton biomass sampling performed during the August synoptic survey. For the mainstem sites, biomass levels generally increased moving downstream from the upper to lower watershed. The lowest chlorophyll a (CHLa) and ash-free dry weight (AFDW) biomass levels occurred at Jones (JON010)(CHLa = 5.0 mg/m3; AFDW = 1,441 mg/m3) and Salmon at 199th (SMN080)(CHLa = 2.0 mg/m3; AFDW = 1,598 mg/m3). The mid-watershed sites, Salmon at Caples (SMN050) and Salmon at 50th (SMN030) displayed moderate levels (CHLa = 8.8 and 12.1 mg/m3; AFDW = 2,863 and 3,917 mg/m3, respectively). The furthest downstream site, Salmon at 36th (SMN010), exhibited the highest biomass levels (CHLa = 19.6 mg/m3; AFDW = 29,648 mg/m3). Field staff observed filamentous benthic algal growth at this location.
Page 25
Figure 9. Continuous water quality data for Salmon Creek tributary sites collected during the August synoptic survey.
10
11
12
13
14
15
16
17
18
19
20
12:00:008/15/2011
0:00:008/16/2011
12:00:008/16/2011
0:00:008/17/2011
12:00:008/17/2011
0:00:008/18/2011
12:00:008/18/2011
Tem
pera
ture
(°C)
MOR010 ROC005 WDN010 CUR020MIL010 CGR020 Max Temp- CGR020 Max Temp- Others
7
7.5
8
8.5
9
9.5
10
10.5
11
12:00:008/15/2011
0:00:008/16/2011
12:00:008/16/2011
0:00:008/17/2011
12:00:008/17/2011
0:00:008/18/2011
12:00:008/18/2011
Diss
olve
d O
xyge
n (m
g/L)
MOR010 ROC005 WDN010 CUR020MIL010 CGR020 Min DO- Others Min DO- CGR020
6.5
7
7.5
8
8.5
12:00:008/15/2011
0:00:008/16/2011
12:00:008/16/2011
0:00:008/17/2011
12:00:008/17/2011
0:00:008/18/2011
12:00:008/18/2011
pH (s
td u
nits
)
MOR010 ROC005 WDN010 CUR020MIL010 CGR020 Min pH criteria Max pH Criteria
Page 26
Figure 10. Continuous water quality data for Upper Salmon Creek sites and Jones Creek collected during the additional deployment in early September 2011.
12
13
14
15
16
17
18
19
20
6:00:009/7/2011
18:00:009/7/2011
6:00:009/8/2011
18:00:009/8/2011
6:00:009/9/2011
18:00:009/9/2011
Tem
pera
ture
(°C)
JON010 SMN086 SMN080 Temp Criteria
8
8.2
8.4
8.6
8.8
9
9.2
9.4
9.6
9.8
10
6:00:009/7/2011
18:00:009/7/2011
6:00:009/8/2011
18:00:009/8/2011
6:00:009/9/2011
18:00:009/9/2011
Diss
olve
d O
xyge
n (m
g/L)
JON010 SMN086 SMN080 Min DO Criteria
6.5
7.0
7.5
8.0
8.5
6:00:009/7/2011
18:00:009/7/2011
6:00:009/8/2011
18:00:009/8/2011
6:00:009/9/2011
18:00:009/9/2011
pH (s
td u
nits
)
JON010 SMN086 SMN080 Min pH criteria Max pH Criteria
Page 27
Figure 11. Chlorophyll a and ash-free dry weight periphyton biomass results. Compared to the mainstem, the tributary sites exhibited low to moderate biomass levels, with very low CHLa results at Morgan (MOR010)(0.7 mg/m3) and Curtin (CUR020)(1.0 mg/m3). Curtin also displayed the highest AFDW levels (7,281 mg/m3) of the tributary sites; however, this may be attributable to the substrate medium (wood organic debris) sampled at this site. At all other locations, Ecology sampled inorganic rock substrate.
Page 28
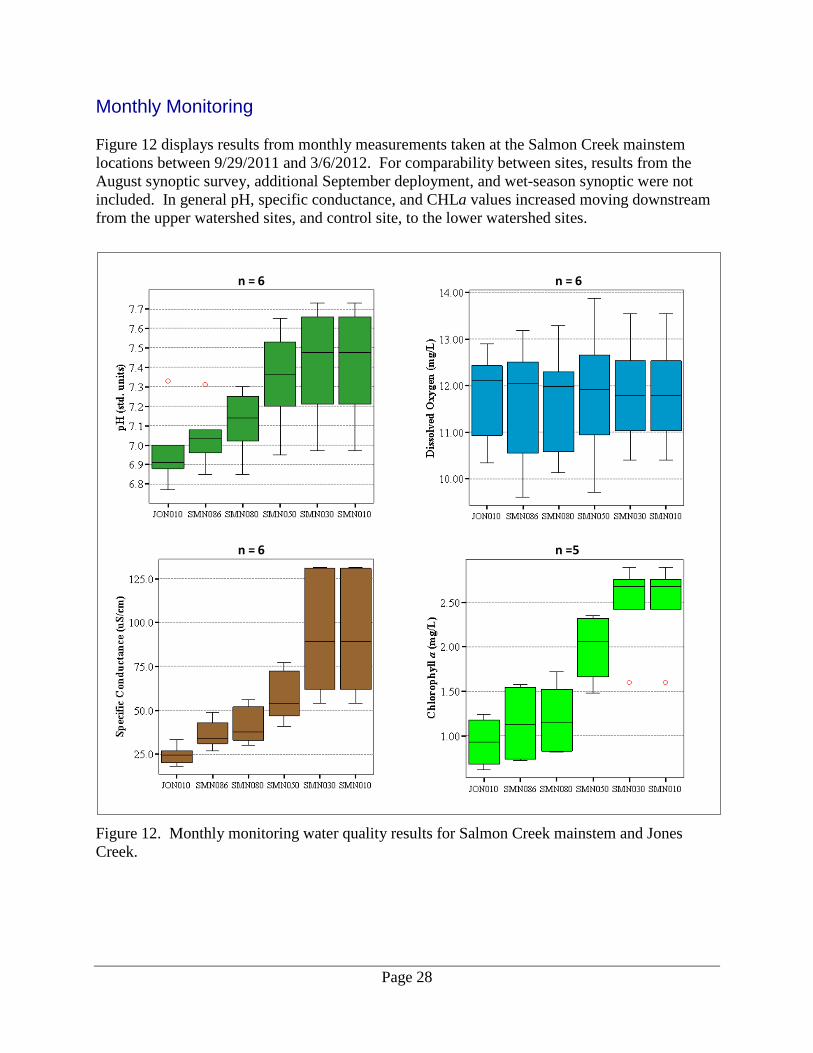
Monthly Monitoring Figure 12 displays results from monthly measurements taken at the Salmon Creek mainstem locations between 9/29/2011 and 3/6/2012. For comparability between sites, results from the August synoptic survey, additional September deployment, and wet-season synoptic were not included. In general pH, specific conductance, and CHLa values increased moving downstream from the upper watershed sites, and control site, to the lower watershed sites.
Figure 12. Monthly monitoring water quality results for Salmon Creek mainstem and Jones Creek.
n = 6 n = 6
n = 6 n =5
Page 29
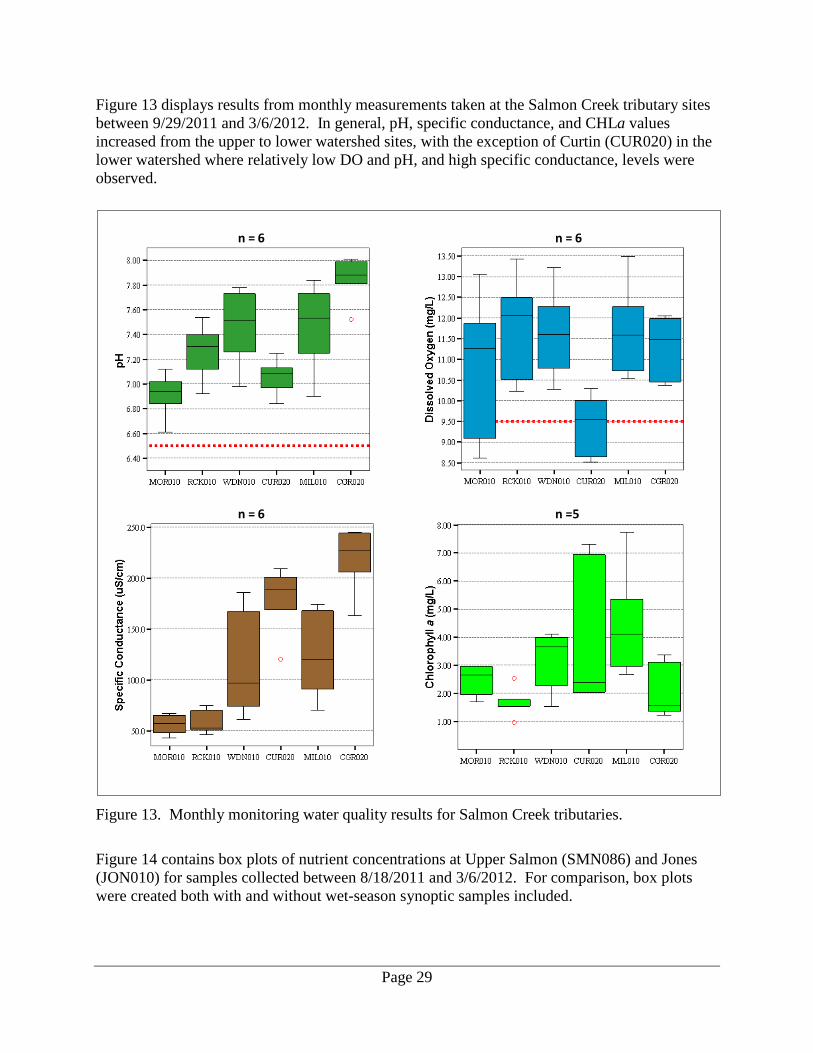
Figure 13 displays results from monthly measurements taken at the Salmon Creek tributary sites between 9/29/2011 and 3/6/2012. In general, pH, specific conductance, and CHLa values increased from the upper to lower watershed sites, with the exception of Curtin (CUR020) in the lower watershed where relatively low DO and pH, and high specific conductance, levels were observed.
Figure 13. Monthly monitoring water quality results for Salmon Creek tributaries.
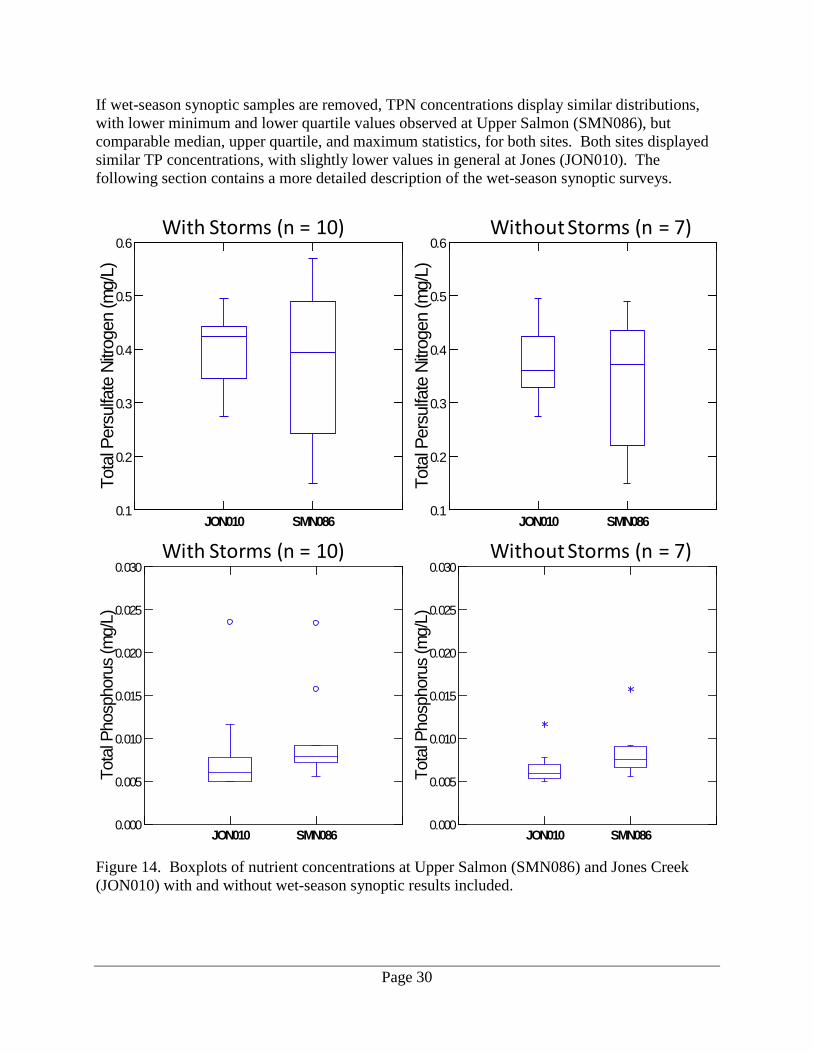
Figure 14 contains box plots of nutrient concentrations at Upper Salmon (SMN086) and Jones (JON010) for samples collected between 8/18/2011 and 3/6/2012. For comparison, box plots were created both with and without wet-season synoptic samples included.
n = 6 n = 6
n = 6 n =5
Page 30
If wet-season synoptic samples are removed, TPN concentrations display similar distributions, with lower minimum and lower quartile values observed at Upper Salmon (SMN086), but comparable median, upper quartile, and maximum statistics, for both sites. Both sites displayed similar TP concentrations, with slightly lower values in general at Jones (JON010). The following section contains a more detailed description of the wet-season synoptic surveys.
Figure 14. Boxplots of nutrient concentrations at Upper Salmon (SMN086) and Jones Creek (JON010) with and without wet-season synoptic results included.
With Storms (n = 10)
With Storms (n = 10)
Without Storms (n = 7)
Without Storms (n = 7)
JON010 SMN0860.000
0.005
0.010
0.015
0.020
0.025
0.030
Tota
l Pho
spho
rus
(mg/
L)
JON010 SMN0860.000
0.005
0.010
0.015
0.020
0.025
0.030
Tota
l Pho
spho
rus
(mg/
L)
JON010 SMN0860.1
0.2
0.3
0.4
0.5
0.6
Tota
l Per
sulfa
te N
itrog
en (m
g/L)
JON010 SMN0860.1
0.2
0.3
0.4
0.5
0.6
Tota
l Per
sulfa
te N
itrog
en (m
g/L)
Page 31
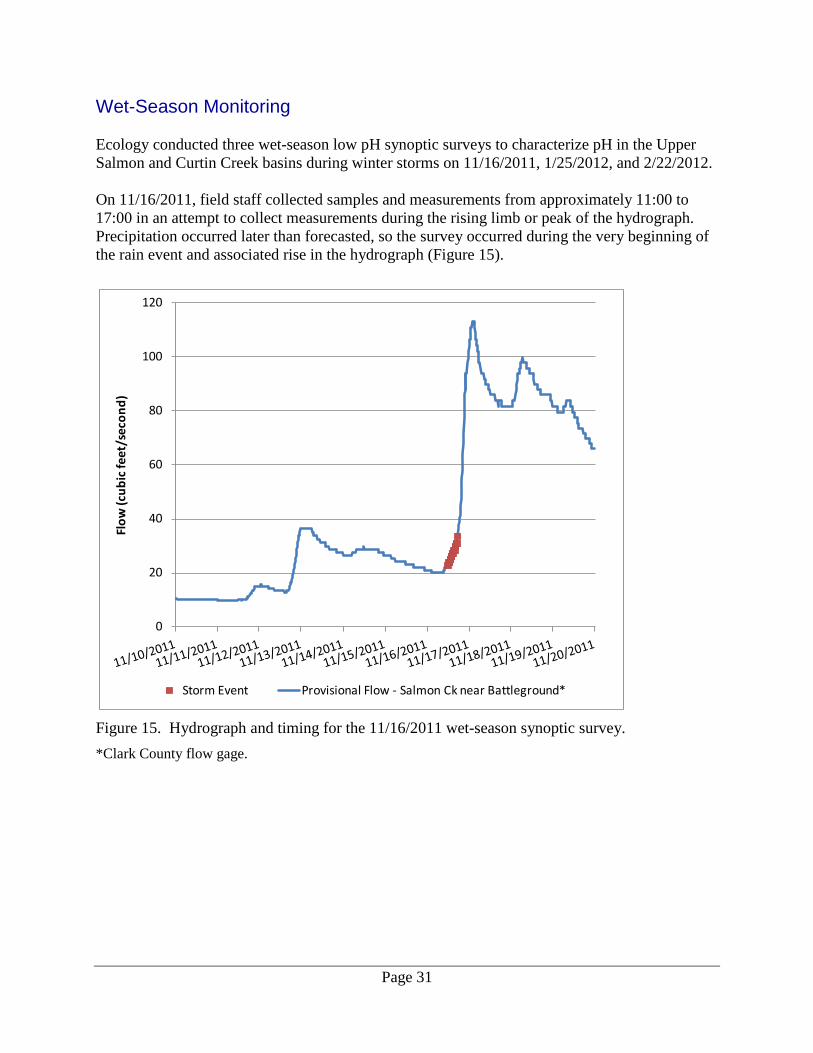
Wet-Season Monitoring Ecology conducted three wet-season low pH synoptic surveys to characterize pH in the Upper Salmon and Curtin Creek basins during winter storms on 11/16/2011, 1/25/2012, and 2/22/2012. On 11/16/2011, field staff collected samples and measurements from approximately 11:00 to 17:00 in an attempt to collect measurements during the rising limb or peak of the hydrograph. Precipitation occurred later than forecasted, so the survey occurred during the very beginning of the rain event and associated rise in the hydrograph (Figure 15).
Figure 15. Hydrograph and timing for the 11/16/2011 wet-season synoptic survey. *Clark County flow gage.
0
20
40
60
80
100
120
Flow
(cub
ic fe
et/s
econ
d)
Storm Event Provisional Flow - Salmon Ck near Battleground*

Page 32
Figure 16 illustrates pH and streamflow levels measured at stations in the extended Upper Salmon and Curtin Creek sub-basins during the 11/16/2011 survey. Curtin/trib near Headwaters (CT1), Curtin at 139th (CUR020), and Salmon at 199th (SMN080) exhibited the lowest pH values (6.58, 6.68, and 6.58, respectively). The observed nutrient concentrations on 11/16/2011 at Upper Salmon (SMN086) (TPN= 0.359 mg/L, TP=0.0075 mg/L) fell within the interquartile range for all samples collected at this site. The observed nutrient concentrations on 11/16/2011 at Jones (JON010) (TPN= 0.430 mg/L, TP=0.0061 mg/L) fell within the interquartile range for all samples collected at this site (see Figure 14 With Storms box plots).
Figure 16. pH and streamflow at extended network sites during the 11/16/2011 wet-season synoptic survey.
8.9 15.00.7 3.6
27.3
6.1 4.2 0.1 0.6 1.7 0.6 0.20
50
100
150
200
250
300
350
400
450
500
6.2
6.3
6.4
6.5
6.6
6.7
6.8
6.9
7.0
7.1
7.2
7.3
Stre
amflo
w (c
ubic
feet
/sec
ond)
pH (s
tand
ard
units
)
pH Flow
Minimum pH Criteria
* * *
*No flow measured due to logistical constraints
Page 33
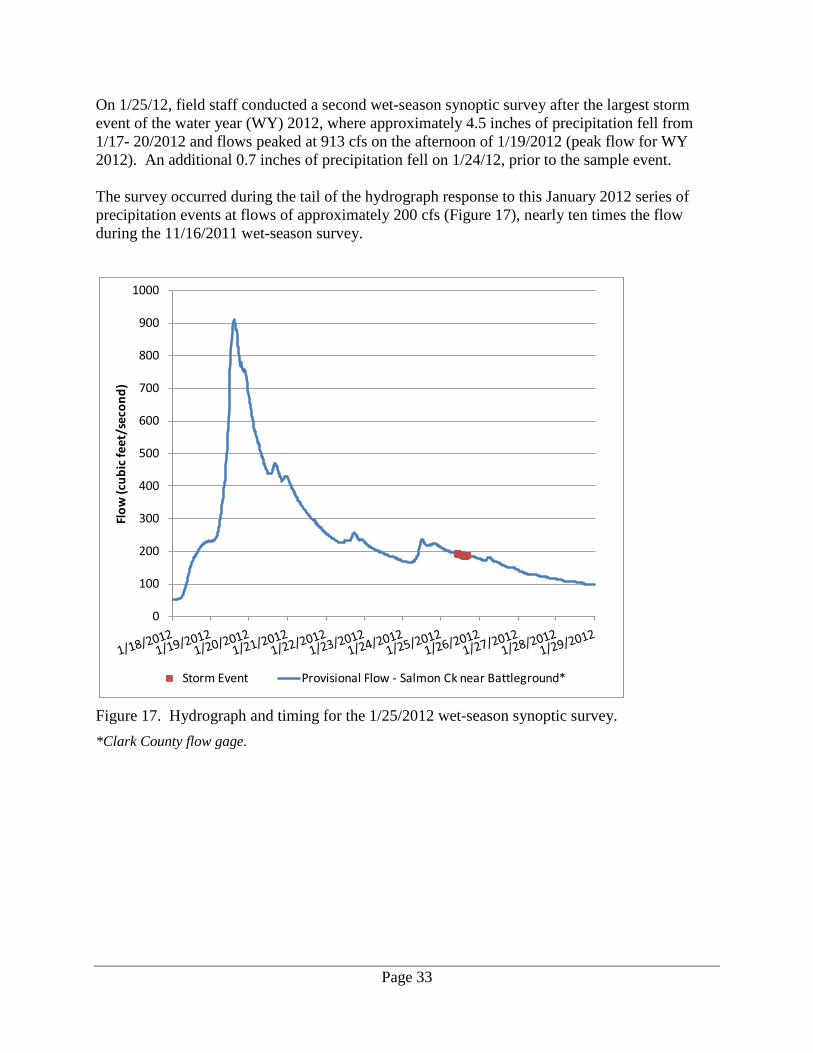
On 1/25/12, field staff conducted a second wet-season synoptic survey after the largest storm event of the water year (WY) 2012, where approximately 4.5 inches of precipitation fell from 1/17- 20/2012 and flows peaked at 913 cfs on the afternoon of 1/19/2012 (peak flow for WY 2012). An additional 0.7 inches of precipitation fell on 1/24/12, prior to the sample event. The survey occurred during the tail of the hydrograph response to this January 2012 series of precipitation events at flows of approximately 200 cfs (Figure 17), nearly ten times the flow during the 11/16/2011 wet-season survey.
Figure 17. Hydrograph and timing for the 1/25/2012 wet-season synoptic survey. *Clark County flow gage.
0
100
200
300
400
500
600
700
800
900
1000
Flow
(cub
ic fe
et/s
econ
d)
Storm Event Provisional Flow - Salmon Ck near Battleground*
Page 34
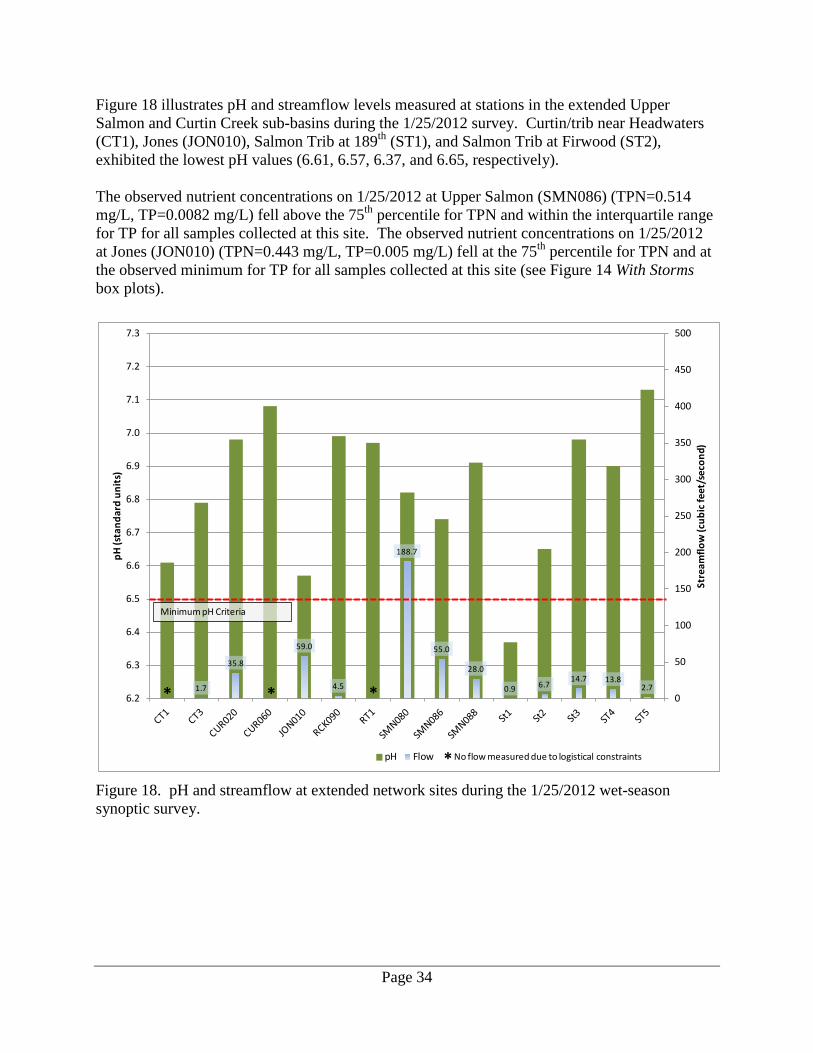
Figure 18 illustrates pH and streamflow levels measured at stations in the extended Upper Salmon and Curtin Creek sub-basins during the 1/25/2012 survey. Curtin/trib near Headwaters (CT1), Jones (JON010), Salmon Trib at 189th (ST1), and Salmon Trib at Firwood (ST2), exhibited the lowest pH values (6.61, 6.57, 6.37, and 6.65, respectively). The observed nutrient concentrations on 1/25/2012 at Upper Salmon (SMN086) (TPN=0.514 mg/L, TP=0.0082 mg/L) fell above the 75th percentile for TPN and within the interquartile range for TP for all samples collected at this site. The observed nutrient concentrations on 1/25/2012 at Jones (JON010) (TPN=0.443 mg/L, TP=0.005 mg/L) fell at the 75th percentile for TPN and at the observed minimum for TP for all samples collected at this site (see Figure 14 With Storms box plots).
Figure 18. pH and streamflow at extended network sites during the 1/25/2012 wet-season synoptic survey.
1.7
35.8
59.0
4.5
188.7
55.0
28.0
0.9 6.714.7 13.8
2.70
50
100
150
200
250
300
350
400
450
500
6.2
6.3
6.4
6.5
6.6
6.7
6.8
6.9
7.0
7.1
7.2
7.3
Stre
amflo
w (c
ubic
feet
/sec
ond)
pH (s
tand
ard
units
)
pH Flow
Minimum pH Criteria
* **
*No flow measured due to logistical constraints
Page 35
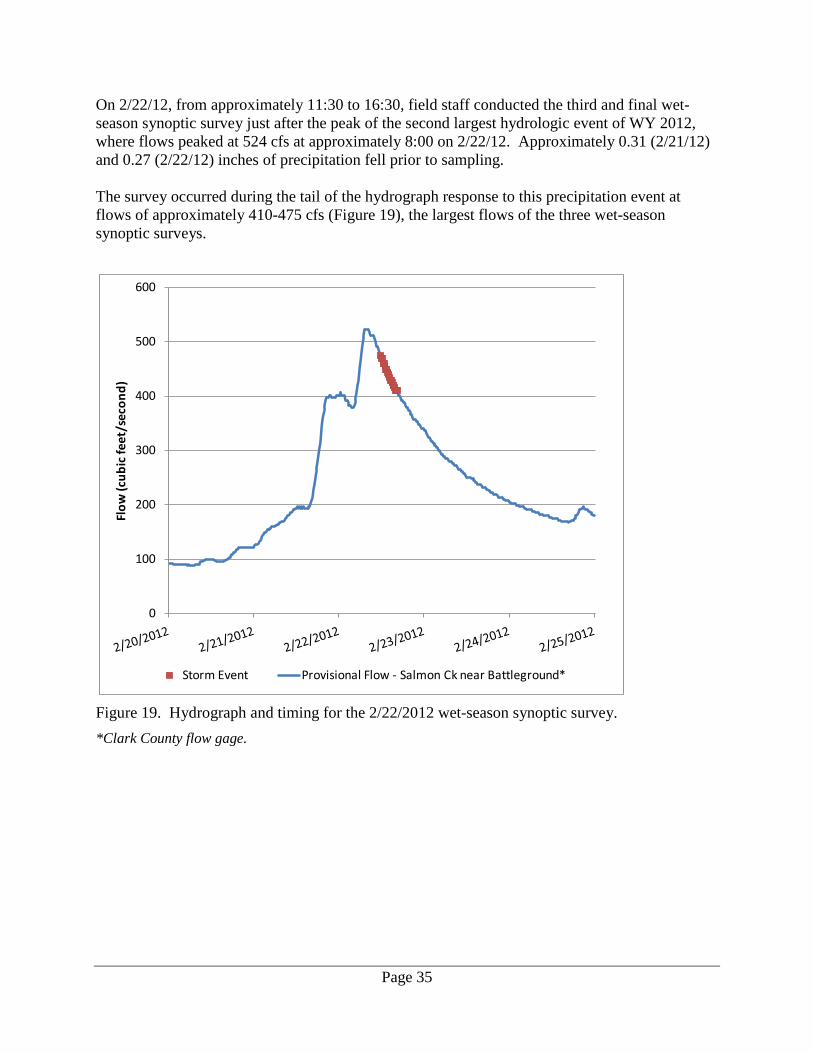
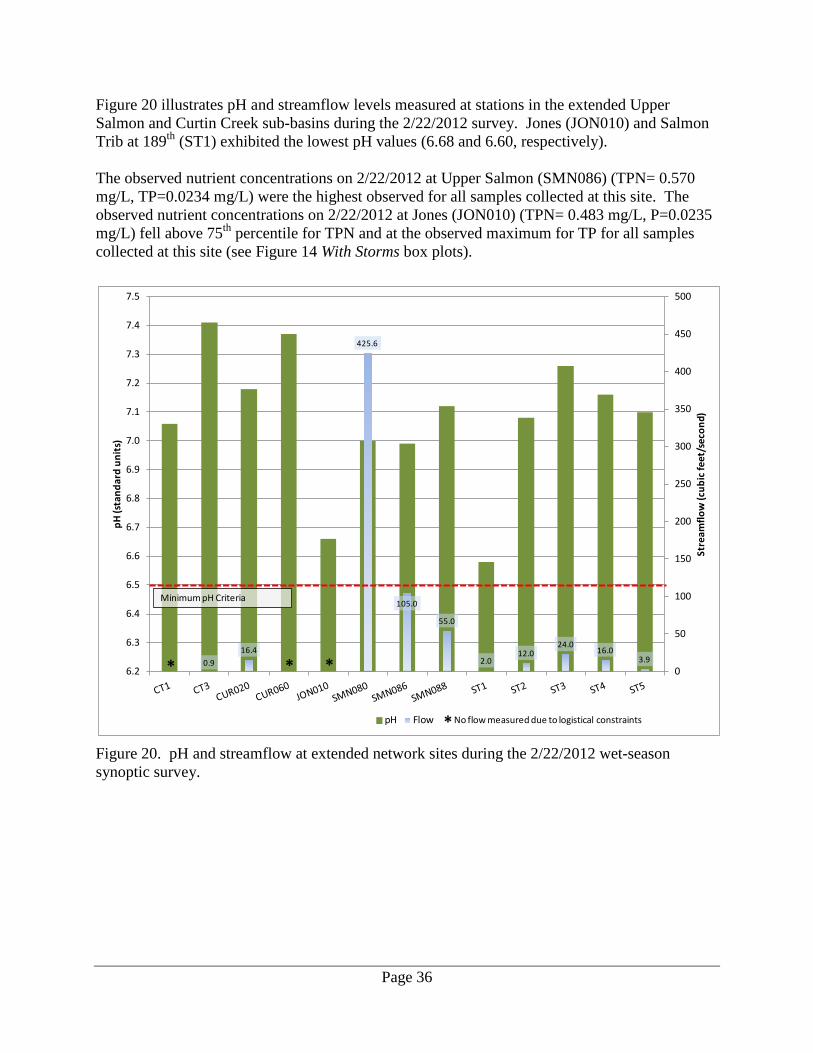
On 2/22/12, from approximately 11:30 to 16:30, field staff conducted the third and final wet-season synoptic survey just after the peak of the second largest hydrologic event of WY 2012, where flows peaked at 524 cfs at approximately 8:00 on 2/22/12. Approximately 0.31 (2/21/12) and 0.27 (2/22/12) inches of precipitation fell prior to sampling. The survey occurred during the tail of the hydrograph response to this precipitation event at flows of approximately 410-475 cfs (Figure 19), the largest flows of the three wet-season synoptic surveys.
Figure 19. Hydrograph and timing for the 2/22/2012 wet-season synoptic survey. *Clark County flow gage.
0
100
200
300
400
500
600
Flow
(cub
ic fe
et/s
econ
d)
Storm Event Provisional Flow - Salmon Ck near Battleground*
Page 36
Figure 20 illustrates pH and streamflow levels measured at stations in the extended Upper Salmon and Curtin Creek sub-basins during the 2/22/2012 survey. Jones (JON010) and Salmon Trib at 189th (ST1) exhibited the lowest pH values (6.68 and 6.60, respectively). The observed nutrient concentrations on 2/22/2012 at Upper Salmon (SMN086) (TPN= 0.570 mg/L, TP=0.0234 mg/L) were the highest observed for all samples collected at this site. The observed nutrient concentrations on 2/22/2012 at Jones (JON010) (TPN= 0.483 mg/L, P=0.0235 mg/L) fell above 75th percentile for TPN and at the observed maximum for TP for all samples collected at this site (see Figure 14 With Storms box plots).
Figure 20. pH and streamflow at extended network sites during the 2/22/2012 wet-season synoptic survey.
0.916.4
425.6
105.0
55.0
2.012.0
24.016.0
3.90
50
100
150
200
250
300
350
400
450
500
6.2
6.3
6.4
6.5
6.6
6.7
6.8
6.9
7.0
7.1
7.2
7.3
7.4
7.5
Stre
amflo
w (c
ubic
feet
/sec
ond)
pH (s
tand
ard
units
)
pH Flow
Minimum pH Criteria
* **
*No flow measured due to logistical constraints
Page 37
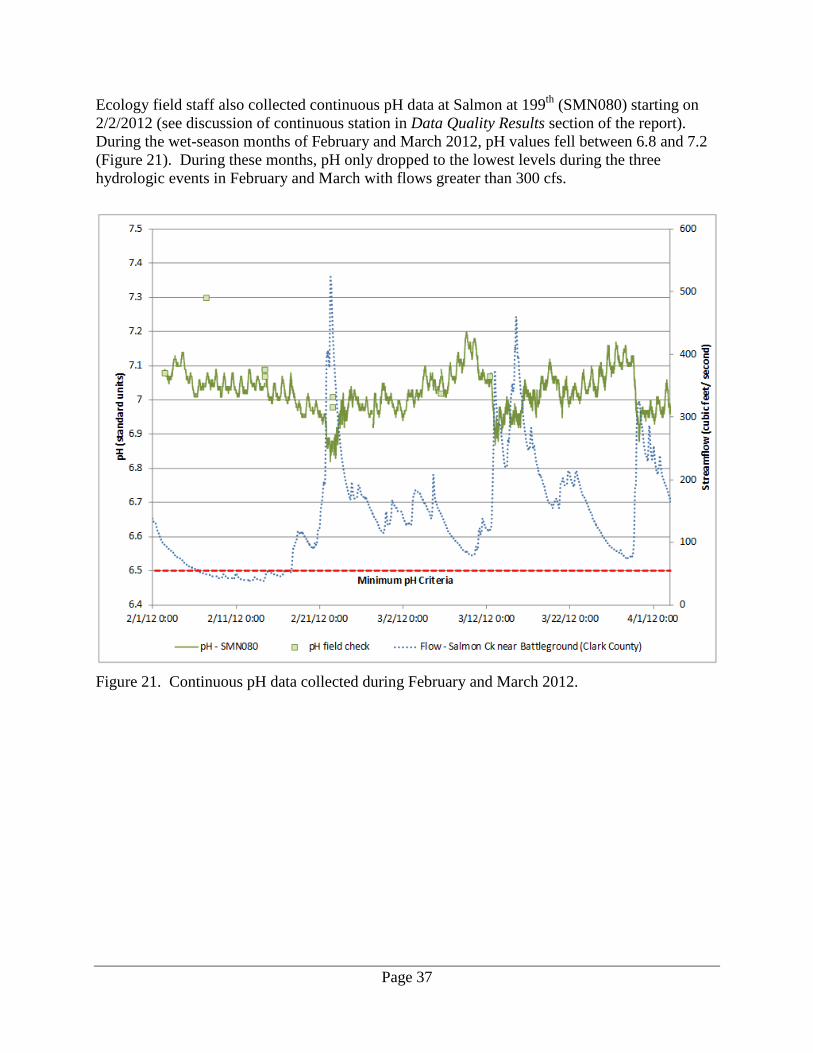
Ecology field staff also collected continuous pH data at Salmon at 199th (SMN080) starting on 2/2/2012 (see discussion of continuous station in Data Quality Results section of the report). During the wet-season months of February and March 2012, pH values fell between 6.8 and 7.2 (Figure 21). During these months, pH only dropped to the lowest levels during the three hydrologic events in February and March with flows greater than 300 cfs.
Figure 21. Continuous pH data collected during February and March 2012.
Page 38
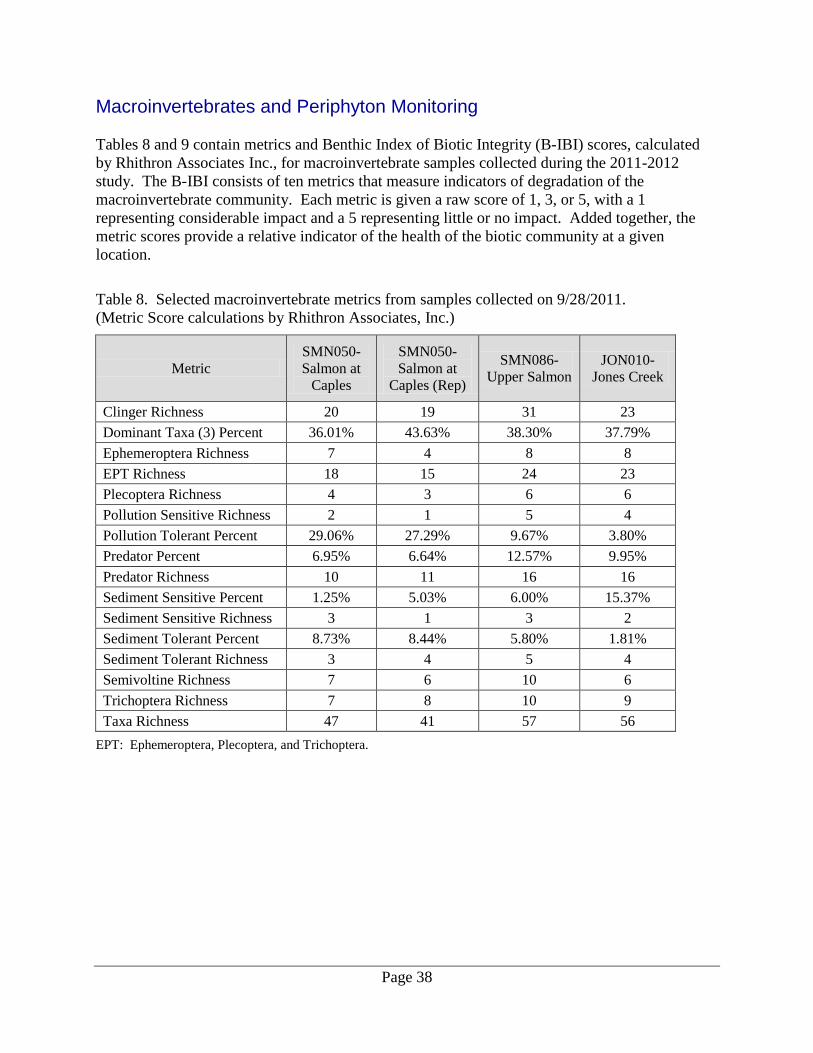
Macroinvertebrates and Periphyton Monitoring Tables 8 and 9 contain metrics and Benthic Index of Biotic Integrity (B-IBI) scores, calculated by Rhithron Associates Inc., for macroinvertebrate samples collected during the 2011-2012 study. The B-IBI consists of ten metrics that measure indicators of degradation of the macroinvertebrate community. Each metric is given a raw score of 1, 3, or 5, with a 1 representing considerable impact and a 5 representing little or no impact. Added together, the metric scores provide a relative indicator of the health of the biotic community at a given location.
Table 8. Selected macroinvertebrate metrics from samples collected on 9/28/2011. (Metric Score calculations by Rhithron Associates, Inc.)
Metric SMN050- Salmon at
Caples
SMN050- Salmon at
Caples (Rep)
SMN086- Upper Salmon
JON010- Jones Creek
Clinger Richness 20 19 31 23 Dominant Taxa (3) Percent 36.01% 43.63% 38.30% 37.79% Ephemeroptera Richness 7 4 8 8 EPT Richness 18 15 24 23 Plecoptera Richness 4 3 6 6 Pollution Sensitive Richness 2 1 5 4 Pollution Tolerant Percent 29.06% 27.29% 9.67% 3.80% Predator Percent 6.95% 6.64% 12.57% 9.95% Predator Richness 10 11 16 16 Sediment Sensitive Percent 1.25% 5.03% 6.00% 15.37% Sediment Sensitive Richness 3 1 3 2 Sediment Tolerant Percent 8.73% 8.44% 5.80% 1.81% Sediment Tolerant Richness 3 4 5 4 Semivoltine Richness 7 6 10 6 Trichoptera Richness 7 8 10 9 Taxa Richness 47 41 57 56
EPT: Ephemeroptera, Plecoptera, and Trichoptera.
Page 39
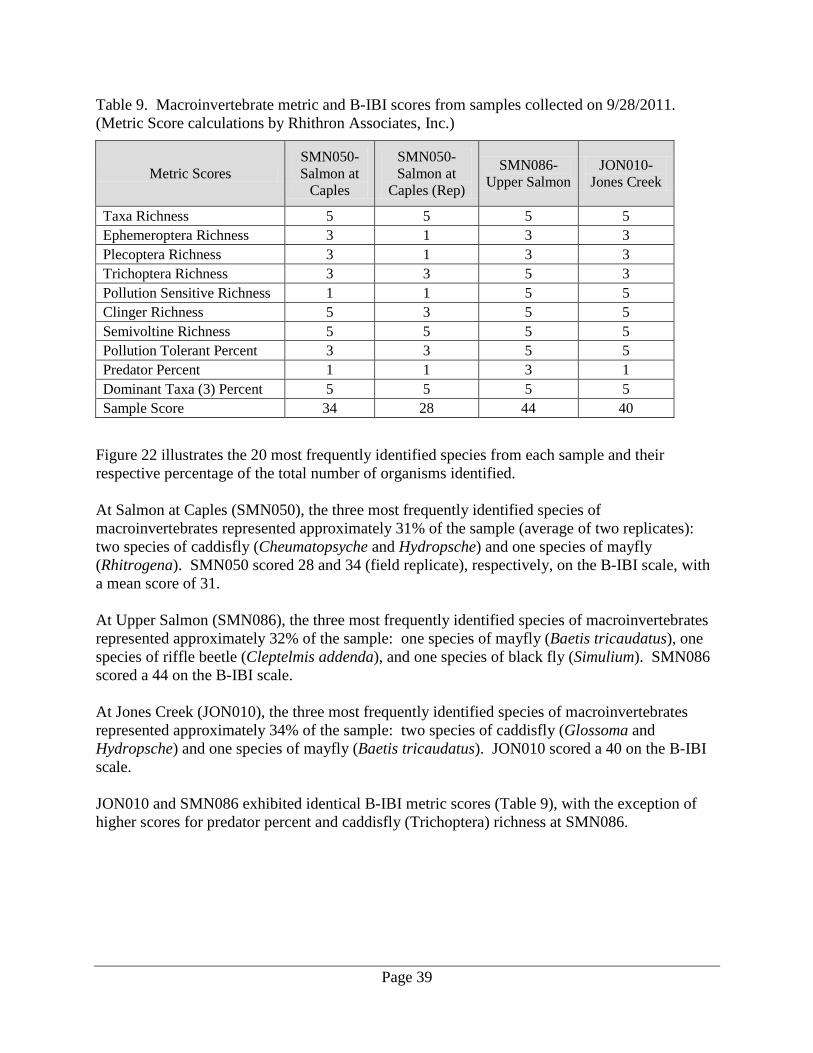
Table 9. Macroinvertebrate metric and B-IBI scores from samples collected on 9/28/2011. (Metric Score calculations by Rhithron Associates, Inc.)
Metric Scores SMN050- Salmon at
Caples
SMN050- Salmon at
Caples (Rep)
SMN086- Upper Salmon
JON010- Jones Creek
Taxa Richness 5 5 5 5 Ephemeroptera Richness 3 1 3 3 Plecoptera Richness 3 1 3 3 Trichoptera Richness 3 3 5 3 Pollution Sensitive Richness 1 1 5 5 Clinger Richness 5 3 5 5 Semivoltine Richness 5 5 5 5 Pollution Tolerant Percent 3 3 5 5 Predator Percent 1 1 3 1 Dominant Taxa (3) Percent 5 5 5 5 Sample Score 34 28 44 40
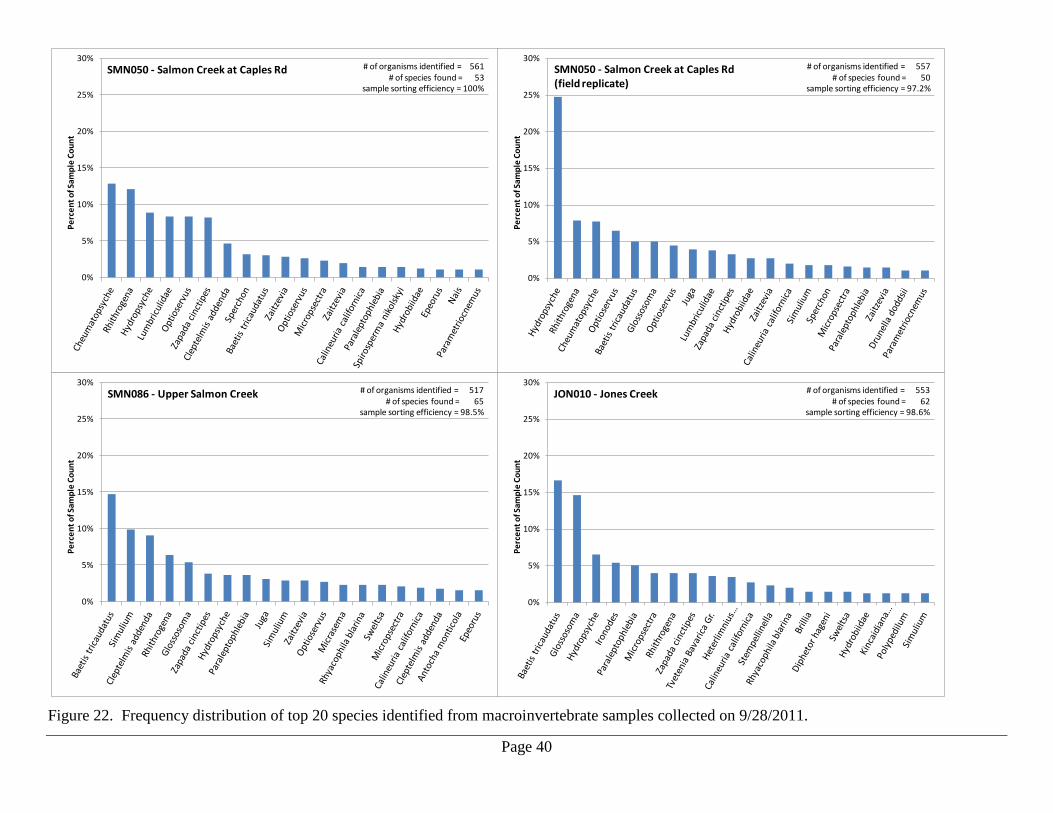
Figure 22 illustrates the 20 most frequently identified species from each sample and their respective percentage of the total number of organisms identified. At Salmon at Caples (SMN050), the three most frequently identified species of macroinvertebrates represented approximately 31% of the sample (average of two replicates): two species of caddisfly (Cheumatopsyche and Hydropsche) and one species of mayfly (Rhitrogena). SMN050 scored 28 and 34 (field replicate), respectively, on the B-IBI scale, with a mean score of 31. At Upper Salmon (SMN086), the three most frequently identified species of macroinvertebrates represented approximately 32% of the sample: one species of mayfly (Baetis tricaudatus), one species of riffle beetle (Cleptelmis addenda), and one species of black fly (Simulium). SMN086 scored a 44 on the B-IBI scale. At Jones Creek (JON010), the three most frequently identified species of macroinvertebrates represented approximately 34% of the sample: two species of caddisfly (Glossoma and Hydropsche) and one species of mayfly (Baetis tricaudatus). JON010 scored a 40 on the B-IBI scale. JON010 and SMN086 exhibited identical B-IBI metric scores (Table 9), with the exception of higher scores for predator percent and caddisfly (Trichoptera) richness at SMN086.
Page 40
Figure 22. Frequency distribution of top 20 species identified from macroinvertebrate samples collected on 9/28/2011.
0%
5%
10%
15%
20%
25%
30%Pe
rcen
t of S
ampl
e Co
unt
# of organisms identified = 561 # of species found = 53
sample sorting efficiency = 100%
SMN050 - Salmon Creek at Caples Rd
0%
5%
10%
15%
20%
25%
30%
Perc
ent o
f Sam
ple
Coun
t
SMN050 - Salmon Creek at Caples Rd (field replicate)
# of organisms identified = 557 # of species found = 50
sample sorting efficiency = 97.2%
0%
5%
10%
15%
20%
25%
30%
Perc
ent o
f Sam
ple
Coun
t
# of organisms identified = 517 # of species found = 65
sample sorting efficiency = 98.5%
SMN086 - Upper Salmon Creek
0%
5%
10%
15%
20%
25%
30%
Perc
ent o
f Sam
ple
Coun
t
# of organisms identified = 553 # of species found = 62
sample sorting efficiency = 98.6%
JON010 - Jones Creek

Page 41
Table 10 presents diatom metrics, calculated by Rhithron Associates Inc., for periphyton samples collected during the study. Appendix A contains more detailed macroinvertebrate and diatom taxonomy results.
Table 10. Selected periphyton metrics for samples collected on 9/28/2011. (Metric Score calculations by Rhithron Associates, Inc.)
Group Metric SMN050 SMN050-R SMN086 JON010
Diversity Shannon H (log2) 2.90 3.46 3.26 3.26 Species Richness 34 39 41 33
Dominance % Dominant Taxon 42.83% 34.33% 40.17% 26.67% Autotrophism % Nitrogen Autotroph Taxa 40.83% 63.33% 62.67% 59.67% Trophic State % Eutraphentic Taxa 35.17% 52.17% 12.17% 32.00% Acid Tolerance % Acidophilous Taxa 0.67% 0.17% 1.00% 1.50% Heterotrophism % Nitrogen Heterotroph Taxa 0.67% 1.67% 3.17% 2.00% Oxidation % Low DO Taxa 0.17% 0.67% 2.50% 1.67%
Page 42
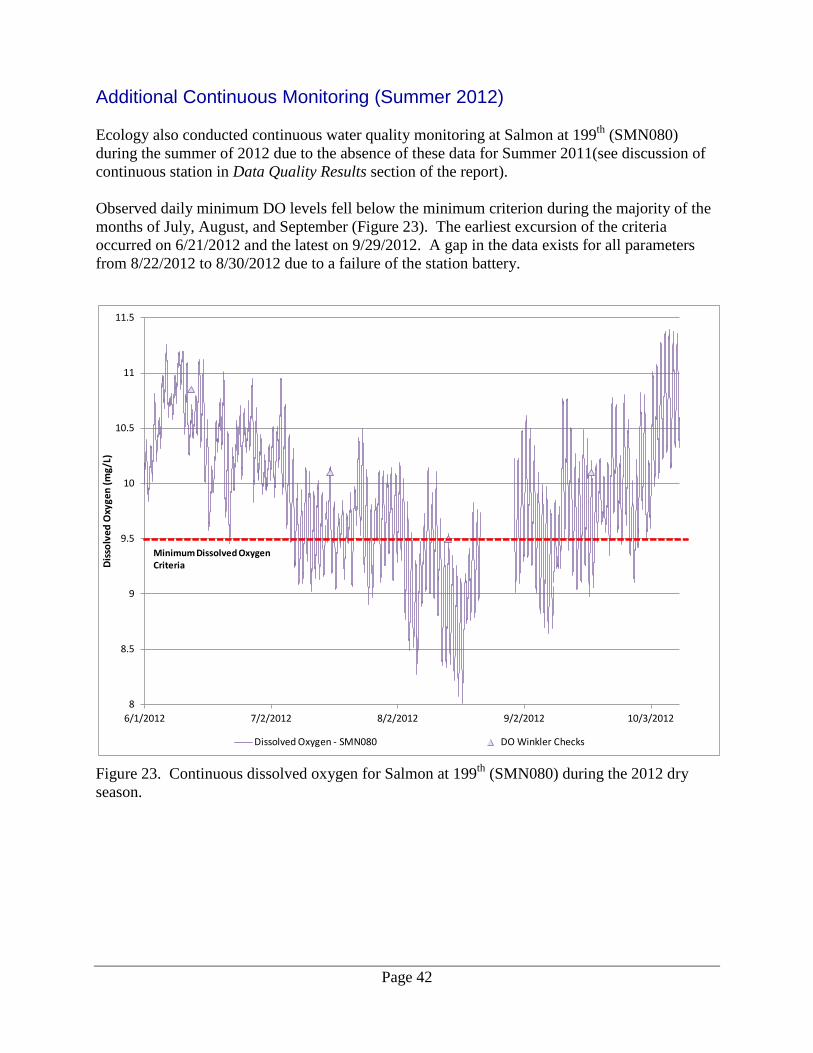
Additional Continuous Monitoring (Summer 2012) Ecology also conducted continuous water quality monitoring at Salmon at 199th (SMN080) during the summer of 2012 due to the absence of these data for Summer 2011(see discussion of continuous station in Data Quality Results section of the report). Observed daily minimum DO levels fell below the minimum criterion during the majority of the months of July, August, and September (Figure 23). The earliest excursion of the criteria occurred on 6/21/2012 and the latest on 9/29/2012. A gap in the data exists for all parameters from 8/22/2012 to 8/30/2012 due to a failure of the station battery.
Figure 23. Continuous dissolved oxygen for Salmon at 199th (SMN080) during the 2012 dry season.
8
8.5
9
9.5
10
10.5
11
11.5
6/1/2012 7/2/2012 8/2/2012 9/2/2012 10/3/2012
Diss
olve
d O
xyge
n (m
g/L)
Dissolved Oxygen - SMN080 DO Winkler Checks
Minimum Dissolved Oxygen Criteria

Page 43
Observed pH levels fell within the criteria for the entire deployment, ranging between 6.9 and 7.5 for the months of July, August, and September (Figure 24). pH levels steadily increased from early July until the first significant rain event of the dry season on 10/14/2012.
Figure 24. Continuous pH for Salmon at 199th (SMN080) during the 2012 dry season.
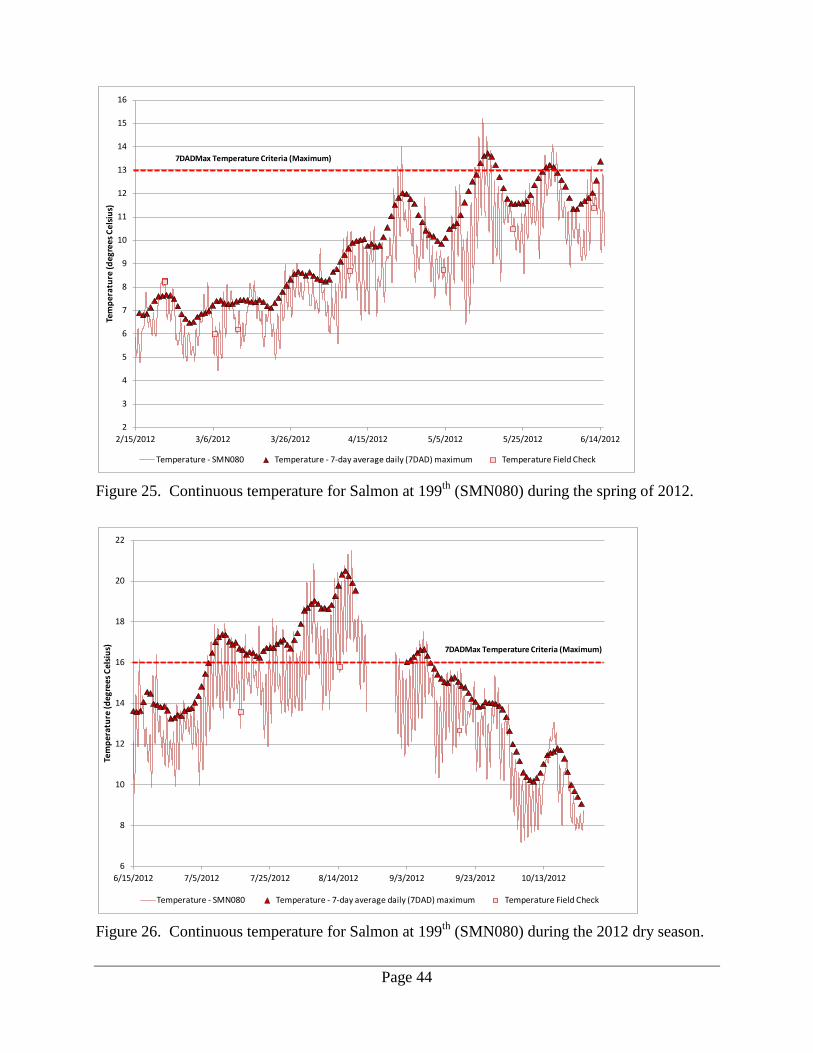
The calculated 7-day average of the daily maximum temperatures (7-DADMax) values fell above the maximum criterion (16°C) during the summer between 7/8/12 and 9/9/12 (Figure 25). 7-DADMax values also exceeded supplemental spawning criteria (13°C) on nine days between 5/14/2012 and 6/15/2012 (Figure 26).
6.36.46.56.66.76.86.9
77.17.27.37.47.57.67.77.87.9
88.18.28.38.48.58.68.7
6/30/12 0:00 7/20/12 0:00 8/9/12 0:00 8/29/12 0:00 9/18/12 0:00 10/8/12 0:00
pH (s
tand
ard
units
)
pH - SMN080 (final) pH field check
Minimum pH Criteria
Maximum pH Criteria
Page 44
Figure 25. Continuous temperature for Salmon at 199th (SMN080) during the spring of 2012.
Figure 26. Continuous temperature for Salmon at 199th (SMN080) during the 2012 dry season.
2
3
4
5
6
7
8
9
10
11
12
13
14
15
16
2/15/2012 3/6/2012 3/26/2012 4/15/2012 5/5/2012 5/25/2012 6/14/2012
Tem
pera
ture
(deg
rees
Cel
sius)
Temperature - SMN080 Temperature - 7-day average daily (7DAD) maximum Temperature Field Check
7DADMax Temperature Criteria (Maximum)
6
8
10
12
14
16
18
20
22
6/15/2012 7/5/2012 7/25/2012 8/14/2012 9/3/2012 9/23/2012 10/13/2012
Tem
pera
ture
(deg
rees
Cel
sius)
Temperature - SMN080 Temperature - 7-day average daily (7DAD) maximum Temperature Field Check
7DADMax Temperature Criteria (Maximum)
Page 45
Discussion This study provides a characterization of continuous DO and pH throughout the watershed under varying seasonal and hydrologic conditions. Low DO excursions occurred throughout the watershed, confirming results from previous studies (Hutton and Hoxeng, 2007; Cusimano and Giglio, 1995). No pH excursions occurred throughout the watershed, with the exception of one small tributary, Salmon Trib at 189th (ST1), where a pH of 6.37 was observed on 1/25/2012.
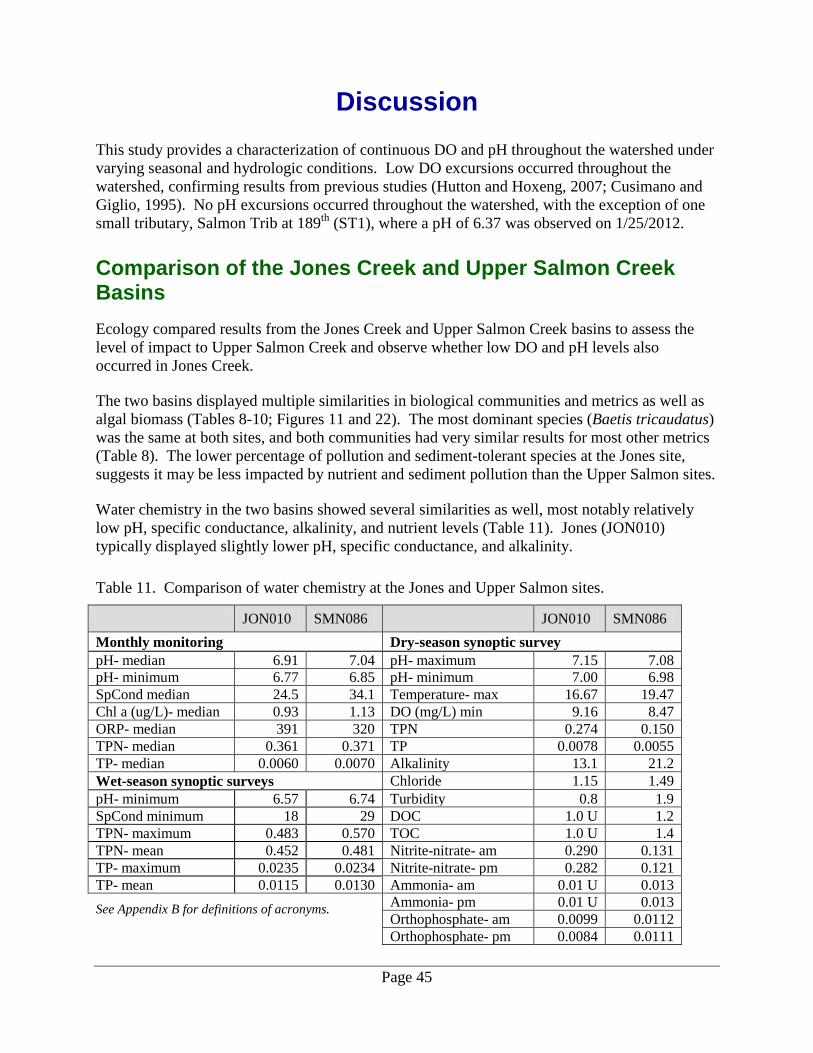
Comparison of the Jones Creek and Upper Salmon Creek Basins Ecology compared results from the Jones Creek and Upper Salmon Creek basins to assess the level of impact to Upper Salmon Creek and observe whether low DO and pH levels also occurred in Jones Creek. The two basins displayed multiple similarities in biological communities and metrics as well as algal biomass (Tables 8-10; Figures 11 and 22). The most dominant species (Baetis tricaudatus) was the same at both sites, and both communities had very similar results for most other metrics (Table 8). The lower percentage of pollution and sediment-tolerant species at the Jones site, suggests it may be less impacted by nutrient and sediment pollution than the Upper Salmon sites. Water chemistry in the two basins showed several similarities as well, most notably relatively low pH, specific conductance, alkalinity, and nutrient levels (Table 11). Jones (JON010) typically displayed slightly lower pH, specific conductance, and alkalinity.
Table 11. Comparison of water chemistry at the Jones and Upper Salmon sites.
JON010 SMN086 JON010 SMN086 Monthly monitoring Dry-season synoptic survey pH- median 6.91 7.04 pH- maximum 7.15 7.08 pH- minimum 6.77 6.85 pH- minimum 7.00 6.98 SpCond median 24.5 34.1 Temperature- max 16.67 19.47 Chl a (ug/L)- median 0.93 1.13 DO (mg/L) min 9.16 8.47 ORP- median 391 320 TPN 0.274 0.150 TPN- median 0.361 0.371 TP 0.0078 0.0055 TP- median 0.0060 0.0070 Alkalinity 13.1 21.2 Wet-season synoptic surveys Chloride 1.15 1.49 pH- minimum 6.57 6.74 Turbidity 0.8 1.9 SpCond minimum 18 29 DOC 1.0 U 1.2 TPN- maximum 0.483 0.570 TOC 1.0 U 1.4 TPN- mean 0.452 0.481 Nitrite-nitrate- am 0.290 0.131 TP- maximum 0.0235 0.0234 Nitrite-nitrate- pm 0.282 0.121 TP- mean 0.0115 0.0130 Ammonia- am 0.01 U 0.013 See Appendix B for definitions of acronyms. Ammonia- pm 0.01 U 0.013
Orthophosphate- am 0.0099 0.0112 Orthophosphate- pm 0.0084 0.0111
Page 46
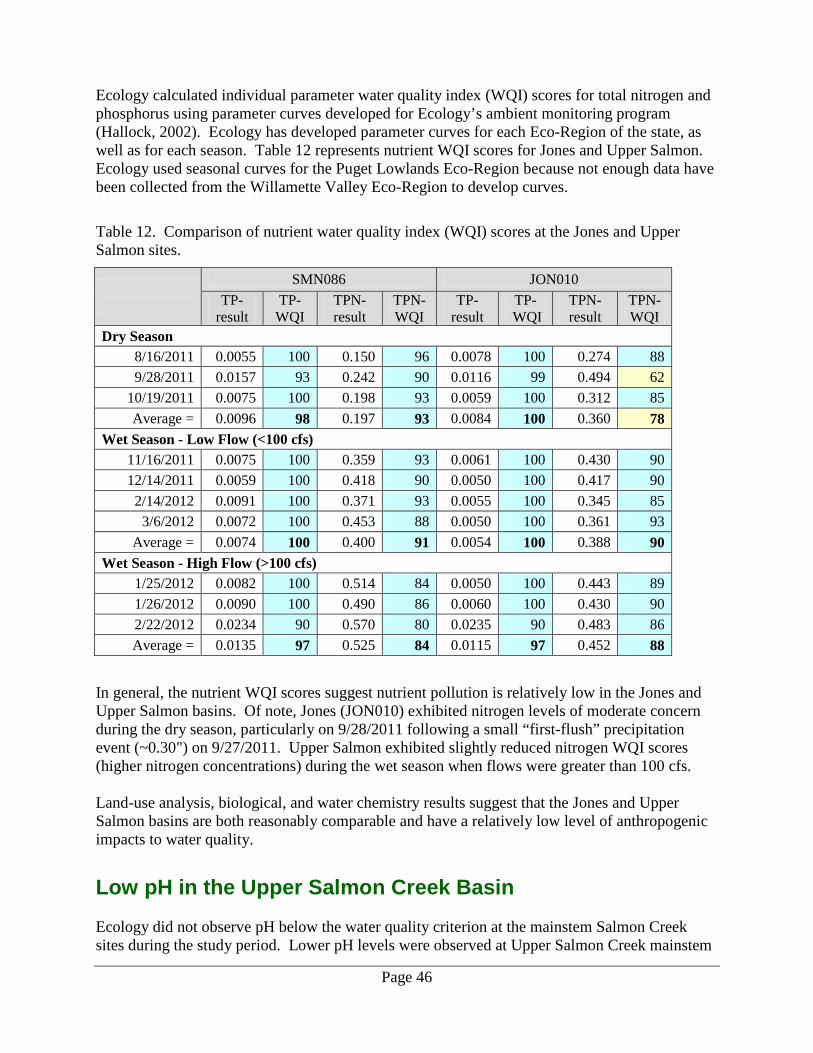
Ecology calculated individual parameter water quality index (WQI) scores for total nitrogen and phosphorus using parameter curves developed for Ecology’s ambient monitoring program (Hallock, 2002). Ecology has developed parameter curves for each Eco-Region of the state, as well as for each season. Table 12 represents nutrient WQI scores for Jones and Upper Salmon. Ecology used seasonal curves for the Puget Lowlands Eco-Region because not enough data have been collected from the Willamette Valley Eco-Region to develop curves.
Table 12. Comparison of nutrient water quality index (WQI) scores at the Jones and Upper Salmon sites.
SMN086 JON010 TP-
result TP- WQI
TPN- result
TPN-WQI
TP- result
TP- WQI
TPN- result
TPN-WQI
Dry Season 8/16/2011 0.0055 100 0.150 96 0.0078 100 0.274 88 9/28/2011 0.0157 93 0.242 90 0.0116 99 0.494 62
10/19/2011 0.0075 100 0.198 93 0.0059 100 0.312 85 Average = 0.0096 98 0.197 93 0.0084 100 0.360 78
Wet Season - Low Flow (<100 cfs) 11/16/2011 0.0075 100 0.359 93 0.0061 100 0.430 90 12/14/2011 0.0059 100 0.418 90 0.0050 100 0.417 90
2/14/2012 0.0091 100 0.371 93 0.0055 100 0.345 85 3/6/2012 0.0072 100 0.453 88 0.0050 100 0.361 93
Average = 0.0074 100 0.400 91 0.0054 100 0.388 90 Wet Season - High Flow (>100 cfs)
1/25/2012 0.0082 100 0.514 84 0.0050 100 0.443 89 1/26/2012 0.0090 100 0.490 86 0.0060 100 0.430 90 2/22/2012 0.0234 90 0.570 80 0.0235 90 0.483 86 Average = 0.0135 97 0.525 84 0.0115 97 0.452 88
In general, the nutrient WQI scores suggest nutrient pollution is relatively low in the Jones and Upper Salmon basins. Of note, Jones (JON010) exhibited nitrogen levels of moderate concern during the dry season, particularly on 9/28/2011 following a small “first-flush” precipitation event (~0.30") on 9/27/2011. Upper Salmon exhibited slightly reduced nitrogen WQI scores (higher nitrogen concentrations) during the wet season when flows were greater than 100 cfs. Land-use analysis, biological, and water chemistry results suggest that the Jones and Upper Salmon basins are both reasonably comparable and have a relatively low level of anthropogenic impacts to water quality.
Low pH in the Upper Salmon Creek Basin Ecology did not observe pH below the water quality criterion at the mainstem Salmon Creek sites during the study period. Lower pH levels were observed at Upper Salmon Creek mainstem

Page 47
sites compared to locations lower in the watershed (Figures 8 and 12). A Wilcoxon Signed Rank test between Salmon Creek mainstem sites found that pH significantly increased between Salmon at 199th (SMN080) and Salmon at Caples (SMN050) (p=0.03), and between SMN050 and Salmon at 50th (SMN030)(p=0.03). Decreases in pH occurred during high flows and associated precipitation events in February and March of 2012 (Figure 21), as well as October 2012 (Figure 24). All available information suggests that low pH in the Upper Salmon basin occurs infrequently and is likely a result of the combination of large wet-season precipitation events, the acidity of rainfall and shallow groundwater, and the poor buffering capacity of the stream and surrounding landscape. The observed slightly lower wet-season pH levels in the Jones Creek basin, which has lower alkalinity and specific conductance (less buffering capacity), supports this theory. Anthropogenic influences do not reasonably explain the reduced pH during these events, particularly given that Upper Salmon basin has relatively low impacts and Jones Creek, which has fewer land uses and anthropogenic impacts, has slightly lower pH levels. Historic low pH data below 6.5, measured during previous studies, could be the result of several possibilities, including timing of and magnitude of the preceding precipitation events, improper maintenance or calibration of pH sensors, or inherent difficulty of measuring pH in cold, low-ionic strength waters. A multi-parameter TMDL developed for the Tualatin basin in northwest Oregon found “…that improper calibration and/or maintenance of field pH meters, coupled with the difficulty of measuring pH in low ionic strength surface waters, [likely] resulted in erroneously low pH values” and that a pH TMDL should not be established for low pH listings on several creeks in the basin (Oregon DEQ, 2001). Flushing of acidic water stored in wetlands is another potential mechanism that causes low pH in streams. Decomposition of organic matter within the wetlands results in the production and accumulation of humic acids. Under this scenario, low pH events would be expected following late summer or early fall “first-flush” precipitation events, given that decomposition would actively occur during warmer months and build up in wetlands during dry periods when flushing is reduced or eliminated. A study of the Sammamish River found that DO and pH were lowest following a small “first-flush” precipitation event in early September (King County, 2005). Subsequent precipitation events of greater magnitude did not have as significant of an effect on DO and pH. Following a small “first-flush” precipitation event on 9/27/2011, Salmon at 199th (SMN080), Upper Salmon (SMN086), and Jones (JON010) exhibited the highest observed pH values for these sites during the study on 9/28/2011 (7.30, 7.31 and 7.33, respectively). It is possible that little runoff was generated from this event given the antecedent dry conditions; however, nutrient concentrations were elevated on 9/28/2011, suggesting runoff as a potential source (see previous section).
Page 48
At Salmon at 199th (SMN080), the lowest observed pH value (6.58) for the Salmon Creek mainstem sites occurred on 11/16/11 during the leading edge of the first larger precipitation event of the season. Curiously, Jones (JON010) and Upper Salmon (SMN086) did not exhibit comparably low pH during this event (6.83 and 6.88 respectively). This pattern was reversed during subsequent precipitation events in January and February when pH was lower at SMN086 and JON010 compared to SMN080. One possibility is that the pH value of 6.58 was due to flushing of wetlands immediately adjacent to Salmon at 199th (SMN080). According to the National Wetlands Inventory GIS data, approximately 26.3 acres of wetlands exist in the upstream drainage area within a half-mile radius of SMN080; these wetlands drain to SMN080 downstream of Upper Salmon (SMN086).
Low DO in the Upper Salmon Creek Basin Lower DO concentrations in the Upper Salmon basin occur during the summer and early fall months when flows are lowest, temperatures are highest, and instream productivity is, theoretically, greatest. DO saturation levels displayed relatively muted fluctuations, ranging between 96 – 103%, suggesting that low DO concentrations may be the result of a combination of natural DO concentrations and temperature fluctuations. In addition, the DO maxima occurred in the early morning, when temperatures were the lowest, and the DO minima occurred in the late afternoon, when temperatures were the highest. Gross primary productivity typically peaks during the day, increasing instream DO concentrations as benthic algae release oxygen; the diel DO curve at Upper Salmon did not display evidence of this influence from productivity. Ecology has developed a tool for estimating gross primary productivity (GPP), ecosystem respiration (ER), and DO reaeration coefficients using continuous water quality data called the River Metabolism Analyzer (RMA) tool (Ecology, 2013). The RMA tool estimated daily average GPP (2.4-2.7 g/O2/m2/day) and ER (20.2-20.6 g/O2/m2/day) based on the results of the August and September 2011 deployments at Upper Salmon (SMN086). This low GPP:ER ratio (~0.12-0.13) suggests that Upper Salmon Creek is likely a heterotrophic system, with little autotrophic benthic productivity. The low algal biomass observed at this site further supports the evidence indicating little gross primary productivity at this site (Figure 11).
Low pH in the Curtin Creek Basin The study did not observe pH levels below 6.5 in the Curtin Creek watershed. The lowest pH values (6.68 and 6.58, respectively) occurred at Curtin at 139th (CUR020) and Curtin/trib near Headwaters (CT1) during the 11/16/11 wet-season synoptic event. Interestingly, the next upstream station from CUR020, Curtin at 88th (CUR060), exhibited a relatively high pH of 7.19 on 11/16/11. During subsequent wet-season events in January and February, pH dropped between CUR060 and CUR020, but less drastically (0.1 – 0.2 standard units).
Page 49
Two possibilities explain the large drop on 11/16/11 between Curtin at 88th (CUR060) and Curtin at 139th (CUR020). Acidic groundwater inputs between the sites could account for the change in pH. Curtin Creek is influenced by groundwater (Clark County, 2008), particularly at low flows when the proportion of groundwater to surface water is greater. Another possibility is the influence of a large complex of wetlands located between these two sites within a Clark County habitat restoration site. Similar to the possible scenario at Salmon at 199th (SMN080), a “first-flush” of acidic material in the wetland could be responsible for the drop in pH.
Low DO in the Curtin Creek Basin Clark County has documented low DO in Curtin Creek and the year-round influence of groundwater on the system (Clark County, 2008). Water chemistry results indicate a groundwater signature in Curtin Creek, particularly compared to nearby tributaries, with relatively low temperature, DO, pH, and organic matter (TOC/DOC) as well as high specific conductance and nitrates (Figures 7, 9, and 13). Sands dominate the substrate at Curtin at 139th (CUR020), and little benthic algal growth was measured or observed during the study (Figure 11). However, field staff observed significant duckweed growth at this location during the summer and fall of 2011. In addition, a large daily fluctuation in nitrate concentrations occurred during the August synoptic survey (Figure 7). Nutrient uptake by floating macrophytes or attached epiphytic algae could potentially be responsible for the large change in nitrate concentrations; however, the lack of diel change in phosphorus concentrations and the small amount of residual ammonia at this site do not support this theory. The change in nitrate could also have resulted from natural variability of nitrogen loading within the basin. A diel swing in DO concentration of 0.8 mg/L occurred at CUR020 during the August synoptic survey, with saturation levels consistently under-saturated (79-86%). The DO maxima occurred near noon each day, while DO minima occurred in the evening several hours after the temperature peaked. This pattern suggests relatively high DO reaeration rates, significant DO effects from instream productivity, and/or naturally low groundwater DO levels may influence the diel DO curve at this site. Low DO concentrations (9.48 – 10.29 mg/L) persisted at Curtin at 139th (CUR020) during the wet-season monthly monitoring, with generally lower concentrations occurring during wet-season synoptic events (8.72 – 9.69 mg/L). DO saturation levels also remained consistently under-saturated throughout the wet season. Naturally low groundwater DO levels are likely an influence on Curtin Creek DO year-round; however, the high nitrate concentrations, observed diel DO swings, and observed macrophyte growth suggest that anthropogenic sources could potentially lower DO levels further during the dry season. A calibrated water quality model is likely needed to determine whether the anthropogenic influence causes a reduction of DO greater than 0.2 mg/L.
Page 50
Previously developed models of the Curtin Creek basin (MGS, 2004; WEST, 2005) could potentially provide channel geometry and nutrient loading inputs to a water quality model of the basin.
Low DO and pH in the Lower and Mid-Salmon Creek Basin Salmon Creek Mainstem Observed pH values fell within water quality criteria at all three Lower Salmon Creek locations: Salmon at Caples (SMN050), Salmon at 50th (SMN030), and Salmon at 36th (SMN010). Wet-season pH at these lowers sites remained consistently higher than upstream values (Figures 8 and 12). Observed DO levels fell below the water quality criterion at Salmon at Caples (SMN050), Salmon at 50th (SMN030), and Salmon at 36th (SMN010) during the August 2011 synoptic survey. Increased stream temperatures likely heavily influence DO levels and diel swings at these sites; however, some evidence of potential productivity, due to anthropogenic nutrient eutrophication, does exist. Relatively large diel DO fluctuations, daytime DO maxima, increased periphyton biomass levels, and significant diel nutrient fluctuations occurred at SMN030 (nitrate) and SMN010 (ammonia). Similar to Curtin Creek, the lack of significant diel change in phosphorus concentrations and the small amount of residual ammonia are contrary to the theory that the dissolved inorganic nitrogen fluctuations are the result of primary productivity. Best management practices (BMPs) and increased riparian shading, implemented as part of the approved temperature and bacteria TMDLs, should reduce instream temperatures and will likely increase DO levels throughout the watershed. Salmon Creek Tributaries, Excluding Curtin Creek Observed pH values fell within water quality criteria at all Salmon Creek tributaries. The lowest tributary pH values, excluding Curtin Creek, occurred at Morgan Creek (MOR010), an upper watershed tributary that drains a mix of agricultural, residential, and undeveloped land. DO and pH daily signals (Figure 9) were relatively muted at Morgan (MOR010), and benthic algal biomass (Figure 11) was very low, suggesting that source waters in this basin may have low pH and DO. The lowest pH (6.61) occurred at the highest observed flow (39 cfs), and significant negative correlation occurred (Pearson’s r = -0.90; p=0.01) between pH and flow at this site. MOR010 also exhibited relatively high ammonia levels (Figure 8) suggesting agricultural or septic waste may be present in the stream or groundwater. DO levels at the remaining tributaries fell below the water quality criterion during the August 2011 survey. These tributaries exhibited temperatures above criteria and moderate diel DO swings.
Page 51
Conclusions Results of this 2011-12 study support the following conclusions:
• Ecology did not observe pH excursions, above or below water quality criteria, in Salmon Creek or its major tributaries.
• The lowest observed pH levels, approaching the minimum criterion, occurred during wet-season precipitation or high-flow events. Decreasing pH was correlated to increasing flow at nearly all stations, particularly those in the upper watershed.
• Localized wetland flushing, during “first-flush” precipitation events in the fall, may influence (lower) pH levels at Salmon Creek at 199th (SMN080) and Curtin Creek at 139th (CUR020). Further investigation is needed to confirm this phenomenon.
• Wet-season continuous pH levels at Salmon at 199th (SMN080) dropped infrequently and for a short duration during high-flow events.
• Land-use analysis, biological assessment, and water chemistry results suggest that the Jones Creek and Upper Salmon Creek basins are both reasonably comparable and have a relatively low level of anthropogenic impacts to water quality.
• Low pH levels in the Upper Salmon Creek basin likely result from a natural condition, where large influxes of acidic precipitation, combined with poorly buffered soils, surficial geology, and stream water, result in decreases in instream pH.
• Dissolved oxygen (DO) levels fell below the minimum criterion at all locations, with the exception of Cougar Creek at 139th (CGR020).
• Temperature levels above the maximum criterion occurred at all sites, with the exception of the Cougar (CGR020) and Curtin Creek (CUR020) sites. Elevated temperature levels are partly responsible for low DO levels at these sites.
• Evidence suggests anthropogenic influences on DO, not related to temperature, are likely minimal in the Upper Salmon and Jones Creek basins, but could be significant at all other study locations.
• High nutrient concentrations, macrophyte growth, and relatively large diel DO swings at Curtin Creek at 139th (CUR020) suggest anthropogenic influence may further lower the naturally low DO levels in this heavily developed, groundwater-influenced system.
Page 52
Recommendations Results of this 2011-12 study support the following recommendations:
• Low pH should be removed from the 303(d) list of impaired waters based on data from Salmon at 199th (SMN080) (Listing ID 22066). Available information likely meets EPA criteria for category 1 determination due to natural conditions.
• Low pH should be removed from the 303(d) list of impaired waters based on data from Salmon at 36th (SMN010) (Listing ID 22063), Salmon at Caples (SMN050) (Listing ID 22065), Curtin at 139th (SMN080) (Listing ID 22061), and Weaver (WDN010) (Listing ID 22067).
o Recent low pH values at these locations occurred during large wet-season precipitation events when pH was also low in the low-impacted areas of the upper watershed.
o Decreasing pH was significantly correlated to increasing flow at these locations.
o These locations should be changed to category 2, Waters of Concern, since they drain more heavily developed areas.
• If these pH listings cannot be removed from the 303(d) list, these listings should be ranked as very low priority for TMDL development.
o In these waterbodies, low pH has rarely been observed during recent years and decreased pH occurs during very infrequent, short-duration events.
o An effective pH TMDL would likely be very difficult to develop.
• The dissolved oxygen (DO) listings should remain on the 303(d) list, but should be assigned as low priority for TMDL development.
o Anthropogenic influences could potentially lower DO in the watershed.
o BMPs implemented as part of the Salmon Creek Temperature TMDL should significantly increase DO levels in the watershed, with the exception of Curtin Creek where temperatures are already below the maximum criterion.
• A water quality model of the Curtin Creek basin during the low-flow critical season is necessary to develop a TMDL in this watershed. The model would need to determine the degree to which anthropogenic eutrophication effects naturally occurring low DO levels.
• The Curtin Creek DO listing should also be assigned a relatively low priority. o Given the complexity of this groundwater and wetland influenced system, significant
resources would be necessary to develop and calibrate a TMDL to address a single listing on a very small waterbody.
o Available resources would likely be better spent first addressing other impaired waterbodies with multiple parameters and listings.
Page 53
References Clark County, 2008. Curtin Creek Subwatershed Needs Assessment Report. 2007 Stormwater Needs Assessment Program. Clark County Public Works: Water Resources Section. Vancouver, WA. Collyard, S., 2009. Salmon Creek Nonpoint Source Pollution Total Maximum Daily Load: Water Quality Effectiveness Monitoring Report. Washington State Department of Ecology, Olympia, WA. Publication No. 09-03-042. https://fortress.wa.gov/ecy/publications/SummaryPages/0903042.html Cusimano, R.F. and D. Giglio, 1995. Salmon Creek Nonpoint Source Pollution TMDL. Washington State Department of Ecology, Olympia, WA. Publication No. 95-355. https://fortress.wa.gov/ecy/publications/SummaryPages/95355.html Ecology, 2013. River Metabolism Analyzer (RMA). Developed by Greg Pelletier, Environmental Assessment Program. Washington State Department of Ecology. Olympia, WA. http://www.ecy.wa.gov/programs/eap/models.html. Hallock, D., 2002. A Water Quality Index for Ecology's Stream Monitoring Program. Washington State Department of Ecology, Olympia, WA. Publication No. 02-03-052. https://fortress.wa.gov/ecy/publications/SummaryPages/0203052.html Hutton, R. and C. Hoxeng, 2007. Clark County Long-term Index Site and Salmon Creek Monitoring Projects’ Status and Trends Based on Oregon Water Quality Indices and Turbidity. Clark County Public Works: Water Resources Section. Vancouver, WA. King County, 2005. Sammamish River Diel pH and Dissolved Oxygen Study. Prepared by Curtis DeGasperi, King County Water and Land Resources Division. Department of Natural Resources and Parks. Seattle, WA. Mathieu, N., 2011. Quality Assurance Project Plan: Salmon Creek Watershed Low Dissolved Oxygen and pH Characterization Study. Washington State Department of Ecology, Olympia, WA. Publication No. 11-03-110. https://fortress.wa.gov/ecy/publications/SummaryPages/1103110.html MEL, 2012. Manchester Environmental Laboratory Quality Assurance Manual. Manchester Environmental Laboratory, Washington State Department of Ecology, Manchester, WA. MGS Engineering Consulting, Inc., October 2002. Hydrologic Analysis of the Salmon Creek Watershed using the HSPF Model. Mundorff, M.J., 1964. Geology and ground-water conditions of Clark County, Washington, with a description of a major alluvial aquifer along the Columbia River. U.S. Geological Survey. Water Supply Paper 1600.
Page 54
Oregon DEQ, 2001. Tualatin Subbasin Total Maximum Daily Load (TMDL). Appendix E: Low pH Discussion. Oregon Department of Environmental Quality. Portland, OR. Turney, G.L., 1990. Quality of Groundwater in Clark County, Washington, 1988. United States Geological Survey. Water Resource Investigation Report 90-4149. Tacoma, WA. USDA, 2012. Soil Series Classification Database. Soil Survey Staff, Natural Resources Conservation Service, United States Department of Agriculture. Accessed December 2012. http://soils.usda.gov/technical/classification/scfile/index.html WAC 173-201A. Water Quality Standards for Surface Waters in the State of Washington Washington State Department of Ecology, Olympia, WA. www.ecy.wa.gov/laws-rules/ecywac.html Wagner, R.J., R.W. Boulger, Jr., C.J. Oblinger, B.A. Smith, 2006. Guidelines and standard procedures for continuous water-quality monitors: station operation, record computation, and data reporting. US Geological Survey Techniques and Methods 1-D3. WEST Consultants, Inc. (WEST), 2005. HEC-RAS hydraulic models of Gee Creek and Padden Creek, Developed for the Preliminary FEMA Flood Insurance Study of Clark County Washington and Incorporated Areas, September 2006. Western Regional Climate Center (WRCC), 2011. Data summary for Battle Ground, Washington COOP site (#450482). Period of Record 5/27/1928 to 12/31/10. Accessed on 6/16/2011. www.wrcc.dri.edu/summary/Climsmwa.html

Page 55
Appendices

Page 56
This page is purposely left blank

Page 57
Appendix A. Detailed Biological Results

This page is purposely left blank
1
Analysis of biological samples: Technical summary of methods and quality assurance procedures
Prepared for Washington Department of Ecology Karen Adams and Scott Collyard, Project Managers
May 4, 2012
by W. Bollman, Chief Biologist Rhithron Associates, Inc.
Missoula, Montana
METHODS Sample processing Twelve macroinvertebrate samples and 14 periphyton samples collected for the Deschutes Monitoring Project were delivered to Rhithron’s laboratory facility in Missoula, Montana on November 3, 2011. All samples arrived in good condition. A chain of custody document containing sample identification information was provided by the Washington Department of Ecology (WADOE) Project Managers. Upon arrival, samples were unpacked and examined, and checked against the WADOE chain of custody. An inventory spreadsheet was created and sent to the WADOE Project Managers. This spreadsheet included project code and internal laboratory identification numbers and was verified by the WADOE Project Managers prior to upload into the Rhithron database.
Standard sorting protocols (Plotnikoff and Wiseman 2001) were applied to achieve representative subsamples of a minimum of 500 organisms. Caton sub-sampling devices (Caton 1991), divided into 30 grids, each approximately 5 cm by 6 cm were used. Each individual sample was thoroughly mixed in its jar(s), poured out and evenly spread into the Caton tray, and individual grids were randomly selected. The contents of each grid were examined under stereoscopic microscopes using 10x-30x magnification. All aquatic invertebrates from each selected grid were sorted from the substrate, and placed in 95% ethanol for subsequent identification. Grid selection, examination, and sorting continued until at least 500 organisms were sorted. The final grid was completely sorted of all organisms. After the target number of organisms was obtained in the subsample, a large/rare search was performed: the Caton tray was scanned for additional organisms that were not collected in the subsample. These organisms were placed in a separate vial and labeled as “Large/Rare Organisms”. As requested by the WADOE Project Manager, the large/rare search also included adult aquatic invertebrates. All unsorted sample fractions were retained and stored at the Rhithron laboratory.
Organisms were individually examined by certified taxonomists, using 10x – 80x stereoscopic dissecting scopes (Leica S8E and S6E) and identified to target taxonomic levels specified by the WADOE Project Manager (Appendix A and B of the Request for Quote), using appropriate published taxonomic references and keys.
Midges and worms were carefully morphotyped using 10x – 80x stereoscopic dissecting microscopes (Leica S8E and S6E) and representative specimens were slide mounted and examined at 200x – 1000x magnification using an Olympus BX 51 compound microscope.
Identification, counts, life stages, and information about the condition of specimens were recorded on bench sheets. Organisms that could not be identified to the taxonomic targets because of immaturity, poor condition, or lack of complete current regionally-applicable published keys were either left at appropriate taxonomic levels that were coarser than those specified or aggregated following procedures provided in Appendix C of the Request for Quote. Organisms designated as “unique” were those that could be definitively distinguished from other organisms in the sample. Large/Rare organisms were identified, and these were recorded with a count of “1”. Identified organisms, separated by taxon, were preserved in 95% ethanol in voucher labeled vials. Large/Rare organisms were placed in separate labeled vials. Voucher specimens, large/rare
2
organisms and slide mounted organisms were shipped to the Orma J. Smith Museum of Natural History upon completion of the project.
A number of taxonomic nomenclature changes went into effect during the 2011 calendar year. Taxonomic name changes that have relevance to the WADOE data set are described in the table below.
Taxon (current) Synonym (past data)
Antocha monticola Antocha sp. Ephemerella excrucians Ephemerella inermis Ephemerella dorothea Ephemerella infrequens Ephemerella tibialis Serratella tibialis Hydrozoa Hydra sp. Labiobaetis sp. Pseudocloeon sp. Matriella teresa Serratella teresa Nemata Nematoda Ochrotrichia sp. Hydroptilidae sp. (RAI Taxon # 0001) Tvetenia tshernovskii Tvetenia vitracies
The periphyton samples, preserved with Lugol’s solution, were topped-off upon arrival at
the laboratory. The samples were thoroughly mixed by shaking. Permanent diatom slides were prepared: subsamples were taken and treated with concentrated H2SO4 and 30% H2O2. The samples were neutralized by rinses with distilled water, and subsample volumes were adjusted to obtain adequate densities. Small amounts of the samples were dried onto 22-mm square coverslips. Coverslips were mounted on slides using Naphrax diatom mount. To ensure a high quality mount for identification and to make replicates available for archives, 3 slide mounts were made from each sample. One of the replicates was selected from each sample batch for identification. A diamond scribe mark was made to define a transect line on the cover slip, and a minimum of 600 diatom valves were identified along the transect mark. A Leica DM 2500 compound microscope, Nomarski contrast, and 1000x magnification were used for identifications. Diatoms were identified to the lowest possible taxonomic level, generally species, following standard taxonomic references.
For the soft-bodied (non-diatom) algae samples, the raw periphyton sample was manually homogenized and emptied into a porcelain evaporating dish. A small, random sub-sample of algal material was pipetted onto a standard glass microscope slide using a disposable dropper or soda straw. Visible (macroscopic) algae were also sub-sampled, in proportion to their estimated importance relative to the total volume of algal material in the sample, and added to the liquid fraction on the slide. The wet mount was then covered with a 22X30 mm cover slip.
Soft-bodied (non-diatom) algae were identified to genus using an Olympus BHT compound microscope under 200X and 400X. The relative abundance of each algal genus (and of all diatom genera collectively) was estimated for comparative purposes, and abundances were expressed according to the following system:
• rare (r): represented by a single occurrence in the sub-sample • occasional (o): multiple occurrences, but infrequently seen • common (c): multiple occurrences, regularly seen • frequent (f): present in nearly every field of view • abundant (a): multiple occurrences in every field of view, but well within limits of
enumeration • dominant (d): multiple occurrences in every field of view, but generally beyond practical
limits of enumeration
3
Soft-bodied genera (and the diatom component) were also ranked according to their estimated contribution to the total algal biovolume present in the sample. Quality control procedures
Quality control procedures for initial sample processing and subsampling involved checking sorting efficiency. These checks were conducted on 100% of the samples by independent observers who microscopically re-examined at least 20% of sorted substrate from each sample. Quality control procedures for each sample proceeded as follows:
The quality control technician poured the sorted substrate from a processed sample out into a Caton tray, redistributing the substrate so that 20% of it could be accurately lifted out by removing entire grids in a random fashion. Grids were selected, and re-examined until 20% of the substrate was re-sorted. All organisms that were missed were counted and this number was added to the total number obtained in the original sort. Sorting efficiency was evaluated by applying the following calculation:
10021
1 ×+
=nn
nSE
where: SE is the sorting efficiency, expressed as a percentage, n1 is the total number of specimens in the first sort, and n 2 is the total number of specimens expected in the second sort, based on the results of the re-sorted 20%.
Quality control procedures for taxonomic determinations of invertebrates involved checking accuracy, precision and enumeration. Two samples were randomly selected and all organisms re-identified and counted by an independent taxonomist. Taxa lists and enumerations were compared by calculating a Bray-Curtis similarity statistic (Bray and Curtis 1957) for each selected sample. Routinely, discrepancies between the original identifications and the QC identifications are discussed among the taxonomists, and necessary rectifications to the data are made. Discrepancies that cannot be rectified by discussions are routinely sent out to taxonomic specialists for identification.
Quality control procedures for periphyton taxonomy involved the re-identification of diatoms and non-diatom algae from 2 randomly selected samples by independent taxonomists. Re-identifications of diatoms and non-diatom algae were made internally at Rhithron. Bray-Curtis similarity statistics were generated by comparing the original identifications with the re-identifications, and adjustments to taxonomy were made where appropriate. Discrepancies in identifications were discussed, and rectifications were made to the data. Data analysis Taxa and counts for each sample were entered into Rhithron’s customized database software. Standard metric calculations for aquatic invertebrate and periphyton assemblages were made using Rhithron’s customized database software. Final invertebrate data including sample identifiers, taxon names, counts, life stages, uniqueness designations, qualifiers, and proportion of sample sorted was compiled in Microsoft Excel. Non-diatom algae identifications, relative abundances and biovolume rankings were also compiled in Microsoft Excel.
Rhithron's customized database application was also used to produce species lists and counts in upload files for the King County Macroinvertebrate Data Management System.
RESULTS Quality Control Procedures
Results of quality control procedures for subsampling and taxonomy are given in Table 1. Sorting efficiency averaged 98.82% for macroinvertebrate samples, taxonomic precision for identification and enumeration averaged 95.00% for the randomly selected macroinvertebrate QA samples, and data entry efficiency averaged 100% for the project. Taxonomic precision for identification and enumeration averaged 93.25% for the randomly selected periphyton QA
4
samples. These similarity statistics fall within acceptable industry criteria (aquatic invertebrates: Stribling et al. 2003; periphyton: Bahls pers. comm.) Data analysis Taxa lists and counts, and values and scores for various standard bioassessment metrics and indices calculated by Rhithron are given in the Appendix. Electronic spreadsheets were provided to the WADOE Project Managers via e-mail. Appropriate data files were uploaded to the Puget Sound Stream Benthos website. The complete, verified invertebrate voucher collections were shipped to the Orma J. Smith Museum. Diatom slides were shipped to the WADOE Project Managers. REFERENCES Bray, J. R. and J. T. Curtis. 1957. An ordination of upland forest communities of southern Wisconsin. Ecological Monographs 27: 325-349. Caton, L. W. 1991. Improving subsampling methods for the EPA’s “Rapid Bioassessment” benthic protocols. Bulletin of the North American Benthological Society. 8(3): 317-319. Plotnikoff, R. and C. Wiseman. 2001. Benthic Macroinvertebrate Biological Monitoring Protocols for Rivers and Streams: 2001 Revision. Washington Department of Ecology. Olympia. Stribling, J.B., S.R Moulton II and G.T. Lester. 2003. Determining the quality of taxonomic data. J.N. Am. Benthol. Soc. 22(4): 621-631.

6
APPENDIX
Invertebrate taxa lists and metric summaries Diatom taxa lists and metric summaries
Non-diatom algae identifications
Deschutes Monitoring
2011
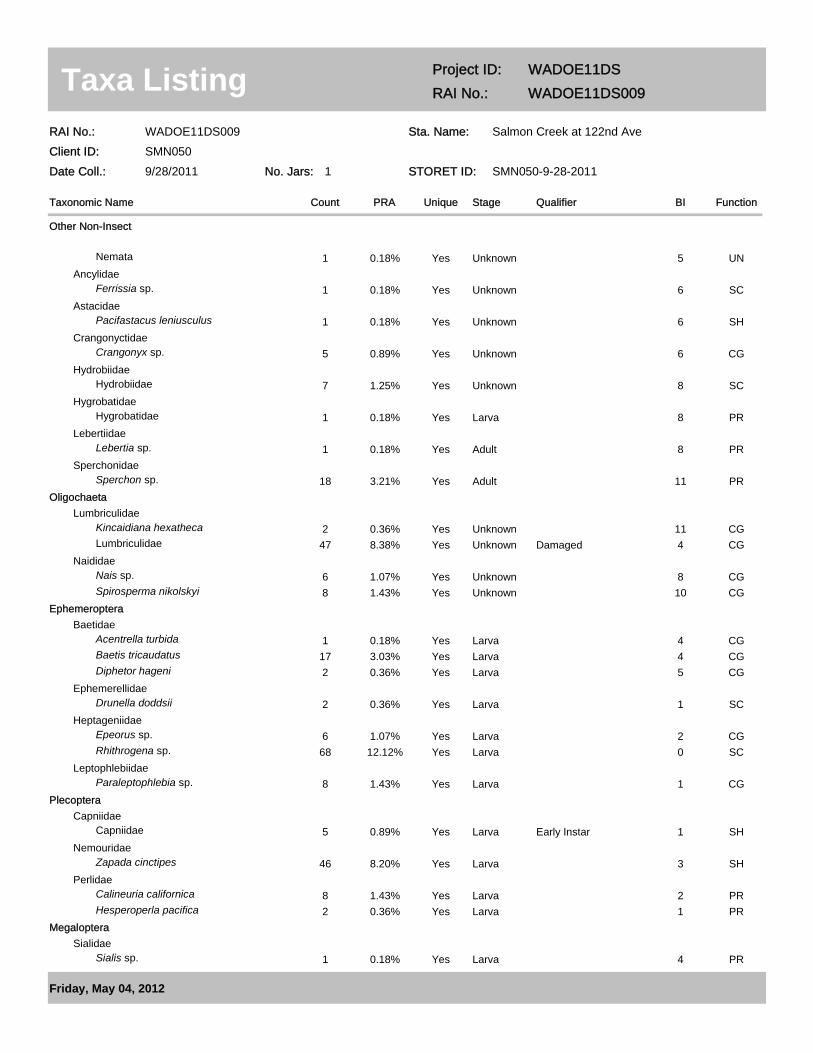
Taxa Listing Project ID: WADOE11DSRAI No.: WADOE11DS009
Sta. Name: Salmon Creek at 122nd AveClient ID: SMN050
STORET ID: SMN050-9-28-2011No. Jars: 1Date Coll.: 9/28/2011
Stage QualifierUniqueCountTaxonomic Name
RAI No.: WADOE11DS009
PRA FunctionBI
Other Non-Insect
Nemata 1 0.18% UN5Yes UnknownAncylidae
Ferrissia sp. 1 0.18% SC6Yes UnknownAstacidae
Pacifastacus leniusculus 1 0.18% SH6Yes UnknownCrangonyctidae
Crangonyx sp. 5 0.89% CG6Yes UnknownHydrobiidae
Hydrobiidae 7 1.25% SC8Yes UnknownHygrobatidae
Hygrobatidae 1 0.18% PR8Yes LarvaLebertiidae
Lebertia sp. 1 0.18% PR8Yes AdultSperchonidae
Sperchon sp. 18 3.21% PR11Yes AdultOligochaeta
LumbriculidaeKincaidiana hexatheca 2 0.36% CG11Yes UnknownLumbriculidae 47 8.38% CG4Yes Unknown Damaged
NaididaeNais sp. 6 1.07% CG8Yes UnknownSpirosperma nikolskyi 8 1.43% CG10Yes Unknown
EphemeropteraBaetidae
Acentrella turbida 1 0.18% CG4Yes LarvaBaetis tricaudatus 17 3.03% CG4Yes LarvaDiphetor hageni 2 0.36% CG5Yes Larva
EphemerellidaeDrunella doddsii 2 0.36% SC1Yes Larva
HeptageniidaeEpeorus sp. 6 1.07% CG2Yes LarvaRhithrogena sp. 68 12.12% SC0Yes Larva
LeptophlebiidaeParaleptophlebia sp. 8 1.43% CG1Yes Larva
PlecopteraCapniidae
Capniidae 5 0.89% SH1Yes Larva Early InstarNemouridae
Zapada cinctipes 46 8.20% SH3Yes LarvaPerlidae
Calineuria californica 8 1.43% PR2Yes LarvaHesperoperla pacifica 2 0.36% PR1Yes Larva
MegalopteraSialidae
Sialis sp. 1 0.18% PR4Yes Larva
Friday, May 04, 2012
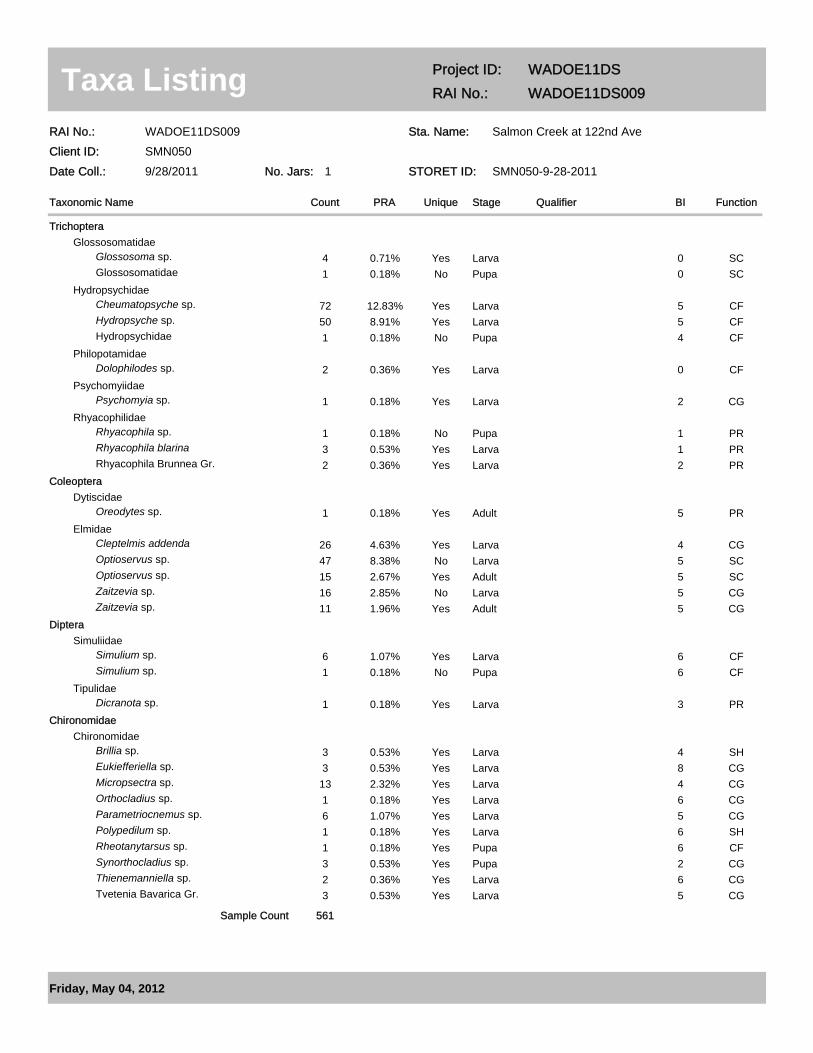
Taxa Listing Project ID: WADOE11DSRAI No.: WADOE11DS009
Sta. Name: Salmon Creek at 122nd AveClient ID: SMN050
STORET ID: SMN050-9-28-2011No. Jars: 1Date Coll.: 9/28/2011
Stage QualifierUniqueCountTaxonomic Name
RAI No.: WADOE11DS009
PRA FunctionBI
TrichopteraGlossosomatidae
Glossosoma sp. 4 0.71% SC0Yes LarvaGlossosomatidae 1 0.18% SC0No Pupa
HydropsychidaeCheumatopsyche sp. 72 12.83% CF5Yes LarvaHydropsyche sp. 50 8.91% CF5Yes LarvaHydropsychidae 1 0.18% CF4No Pupa
PhilopotamidaeDolophilodes sp. 2 0.36% CF0Yes Larva
PsychomyiidaePsychomyia sp. 1 0.18% CG2Yes Larva
RhyacophilidaeRhyacophila sp. 1 0.18% PR1No PupaRhyacophila blarina 3 0.53% PR1Yes LarvaRhyacophila Brunnea Gr. 2 0.36% PR2Yes Larva
ColeopteraDytiscidae
Oreodytes sp. 1 0.18% PR5Yes AdultElmidae
Cleptelmis addenda 26 4.63% CG4Yes LarvaOptioservus sp. 47 8.38% SC5No LarvaOptioservus sp. 15 2.67% SC5Yes AdultZaitzevia sp. 16 2.85% CG5No LarvaZaitzevia sp. 11 1.96% CG5Yes Adult
DipteraSimuliidae
Simulium sp. 6 1.07% CF6Yes LarvaSimulium sp. 1 0.18% CF6No Pupa
TipulidaeDicranota sp. 1 0.18% PR3Yes Larva
ChironomidaeChironomidae
Brillia sp. 3 0.53% SH4Yes LarvaEukiefferiella sp. 3 0.53% CG8Yes LarvaMicropsectra sp. 13 2.32% CG4Yes LarvaOrthocladius sp. 1 0.18% CG6Yes LarvaParametriocnemus sp. 6 1.07% CG5Yes LarvaPolypedilum sp. 1 0.18% SH6Yes LarvaRheotanytarsus sp. 1 0.18% CF6Yes PupaSynorthocladius sp. 3 0.53% CG2Yes PupaThienemanniella sp. 2 0.36% CG6Yes LarvaTvetenia Bavarica Gr. 3 0.53% CG5Yes Larva
561Sample Count
Friday, May 04, 2012
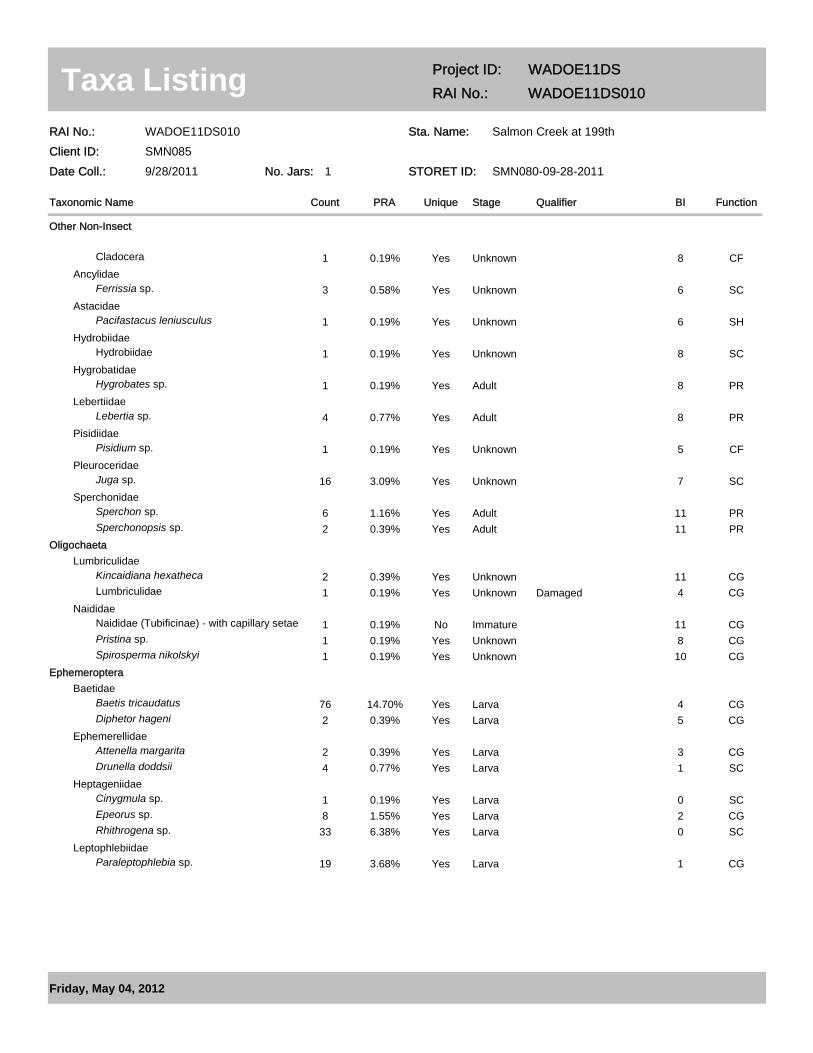
Taxa Listing Project ID: WADOE11DSRAI No.: WADOE11DS010
Sta. Name: Salmon Creek at 199thClient ID: SMN085
STORET ID: SMN080-09-28-2011No. Jars: 1Date Coll.: 9/28/2011
Stage QualifierUniqueCountTaxonomic Name
RAI No.: WADOE11DS010
PRA FunctionBI
Other Non-Insect
Cladocera 1 0.19% CF8Yes UnknownAncylidae
Ferrissia sp. 3 0.58% SC6Yes UnknownAstacidae
Pacifastacus leniusculus 1 0.19% SH6Yes UnknownHydrobiidae
Hydrobiidae 1 0.19% SC8Yes UnknownHygrobatidae
Hygrobates sp. 1 0.19% PR8Yes AdultLebertiidae
Lebertia sp. 4 0.77% PR8Yes AdultPisidiidae
Pisidium sp. 1 0.19% CF5Yes UnknownPleuroceridae
Juga sp. 16 3.09% SC7Yes UnknownSperchonidae
Sperchon sp. 6 1.16% PR11Yes AdultSperchonopsis sp. 2 0.39% PR11Yes Adult
OligochaetaLumbriculidae
Kincaidiana hexatheca 2 0.39% CG11Yes UnknownLumbriculidae 1 0.19% CG4Yes Unknown Damaged
NaididaeNaididae (Tubificinae) - with capillary setae 1 0.19% CG11No ImmaturePristina sp. 1 0.19% CG8Yes UnknownSpirosperma nikolskyi 1 0.19% CG10Yes Unknown
EphemeropteraBaetidae
Baetis tricaudatus 76 14.70% CG4Yes LarvaDiphetor hageni 2 0.39% CG5Yes Larva
EphemerellidaeAttenella margarita 2 0.39% CG3Yes LarvaDrunella doddsii 4 0.77% SC1Yes Larva
HeptageniidaeCinygmula sp. 1 0.19% SC0Yes LarvaEpeorus sp. 8 1.55% CG2Yes LarvaRhithrogena sp. 33 6.38% SC0Yes Larva
LeptophlebiidaeParaleptophlebia sp. 19 3.68% CG1Yes Larva
Friday, May 04, 2012

Taxa Listing Project ID: WADOE11DSRAI No.: WADOE11DS010
Sta. Name: Salmon Creek at 199thClient ID: SMN085
STORET ID: SMN080-09-28-2011No. Jars: 1Date Coll.: 9/28/2011
Stage QualifierUniqueCountTaxonomic Name
RAI No.: WADOE11DS010
PRA FunctionBI
PlecopteraChloroperlidae
Sweltsa sp. 12 2.32% PR0Yes LarvaLeuctridae
Leuctridae 2 0.39% SH0Yes Larva Early InstarNemouridae
Zapada cinctipes 20 3.87% SH3Yes LarvaPeltoperlidae
Yoraperla sp. 4 0.77% SH0Yes LarvaPerlidae
Calineuria californica 10 1.93% PR2Yes LarvaHesperoperla pacifica 4 0.77% PR1Yes Larva
TrichopteraBrachycentridae
Micrasema sp. 12 2.32% SH1Yes LarvaGlossosomatidae
Glossosoma sp. 28 5.42% SC0Yes LarvaHydropsychidae
Hydropsyche sp. 19 3.68% CF5Yes LarvaPhilopotamidae
Wormaldia sp. 2 0.39% CF0Yes LarvaPsychomyiidae
Psychomyia sp. 1 0.19% CG2Yes LarvaRhyacophilidae
Rhyacophila sp. 1 0.19% PR1Yes Larva Early InstarRhyacophila Betteni Gr. 3 0.58% PR0Yes LarvaRhyacophila blarina 12 2.32% PR1Yes LarvaRhyacophila Brunnea Gr. 4 0.77% PR2Yes LarvaRhyacophila narvae 1 0.19% PR0Yes Larva
ColeopteraElmidae
Cleptelmis addenda 47 9.09% CG4No LarvaCleptelmis addenda 9 1.74% CG4Yes AdultNarpus concolor 1 0.19% CG2No LarvaNarpus concolor 1 0.19% CG2Yes AdultOptioservus sp. 14 2.71% SC5Yes AdultOptioservus sp. 2 0.39% SC5No LarvaZaitzevia sp. 15 2.90% CG5Yes Adult
HydraenidaeHydraena sp. 1 0.19% PR5Yes Adult
PsephenidaeEctopria sp. 1 0.19% SC4Yes Larva
Friday, May 04, 2012
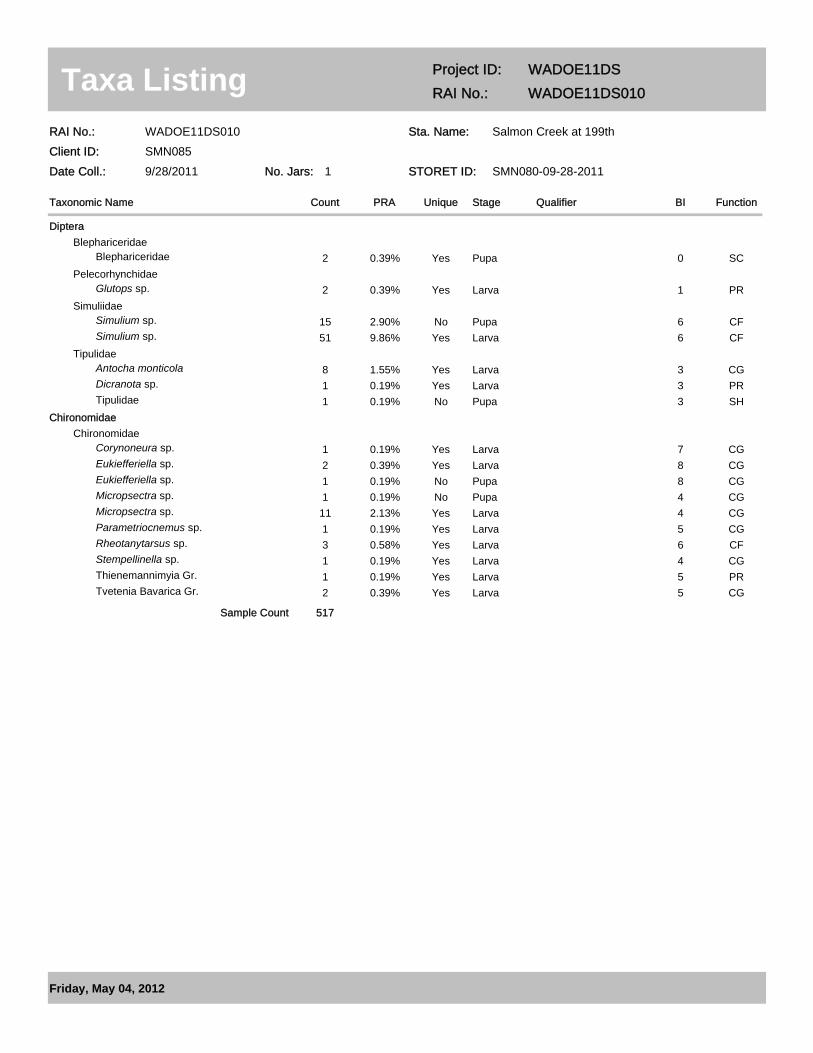
Taxa Listing Project ID: WADOE11DSRAI No.: WADOE11DS010
Sta. Name: Salmon Creek at 199thClient ID: SMN085
STORET ID: SMN080-09-28-2011No. Jars: 1Date Coll.: 9/28/2011
Stage QualifierUniqueCountTaxonomic Name
RAI No.: WADOE11DS010
PRA FunctionBI
DipteraBlephariceridae
Blephariceridae 2 0.39% SC0Yes PupaPelecorhynchidae
Glutops sp. 2 0.39% PR1Yes LarvaSimuliidae
Simulium sp. 15 2.90% CF6No PupaSimulium sp. 51 9.86% CF6Yes Larva
TipulidaeAntocha monticola 8 1.55% CG3Yes LarvaDicranota sp. 1 0.19% PR3Yes LarvaTipulidae 1 0.19% SH3No Pupa
ChironomidaeChironomidae
Corynoneura sp. 1 0.19% CG7Yes LarvaEukiefferiella sp. 2 0.39% CG8Yes LarvaEukiefferiella sp. 1 0.19% CG8No PupaMicropsectra sp. 1 0.19% CG4No PupaMicropsectra sp. 11 2.13% CG4Yes LarvaParametriocnemus sp. 1 0.19% CG5Yes LarvaRheotanytarsus sp. 3 0.58% CF6Yes LarvaStempellinella sp. 1 0.19% CG4Yes LarvaThienemannimyia Gr. 1 0.19% PR5Yes LarvaTvetenia Bavarica Gr. 2 0.39% CG5Yes Larva
517Sample Count
Friday, May 04, 2012
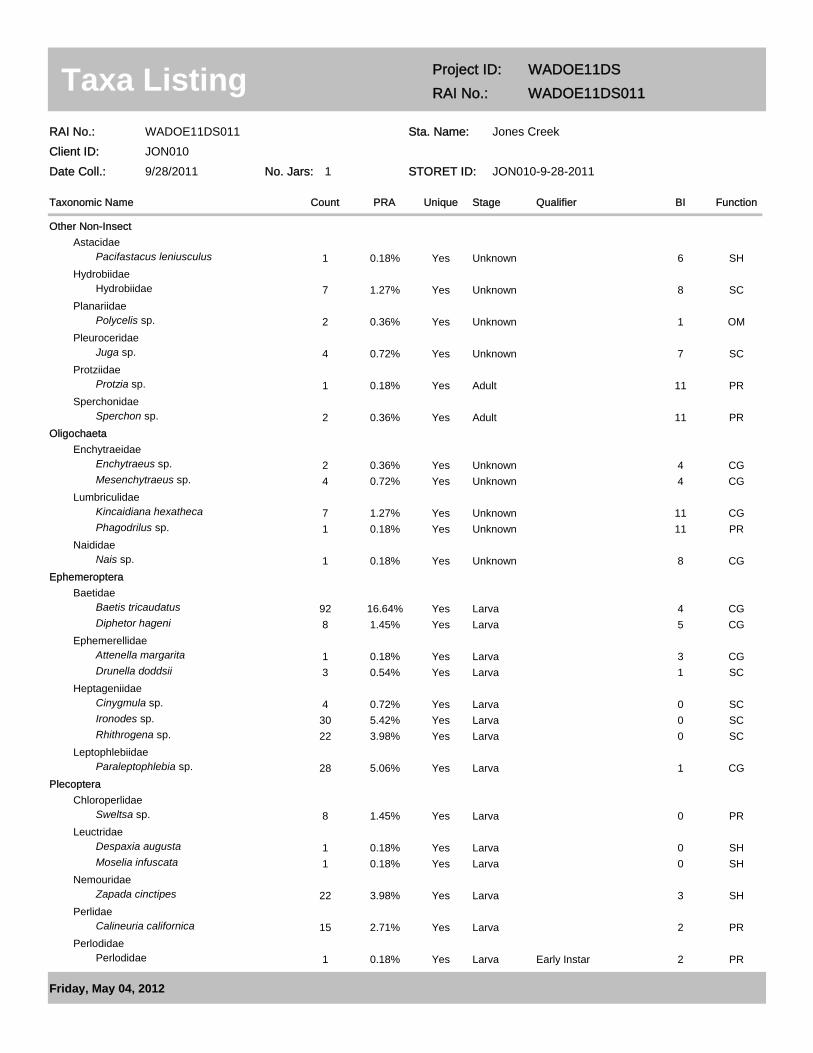
Taxa Listing Project ID: WADOE11DSRAI No.: WADOE11DS011
Sta. Name: Jones CreekClient ID: JON010
STORET ID: JON010-9-28-2011No. Jars: 1Date Coll.: 9/28/2011
Stage QualifierUniqueCountTaxonomic Name
RAI No.: WADOE11DS011
PRA FunctionBI
Other Non-InsectAstacidae
Pacifastacus leniusculus 1 0.18% SH6Yes UnknownHydrobiidae
Hydrobiidae 7 1.27% SC8Yes UnknownPlanariidae
Polycelis sp. 2 0.36% OM1Yes UnknownPleuroceridae
Juga sp. 4 0.72% SC7Yes UnknownProtziidae
Protzia sp. 1 0.18% PR11Yes AdultSperchonidae
Sperchon sp. 2 0.36% PR11Yes AdultOligochaeta
EnchytraeidaeEnchytraeus sp. 2 0.36% CG4Yes UnknownMesenchytraeus sp. 4 0.72% CG4Yes Unknown
LumbriculidaeKincaidiana hexatheca 7 1.27% CG11Yes UnknownPhagodrilus sp. 1 0.18% PR11Yes Unknown
NaididaeNais sp. 1 0.18% CG8Yes Unknown
EphemeropteraBaetidae
Baetis tricaudatus 92 16.64% CG4Yes LarvaDiphetor hageni 8 1.45% CG5Yes Larva
EphemerellidaeAttenella margarita 1 0.18% CG3Yes LarvaDrunella doddsii 3 0.54% SC1Yes Larva
HeptageniidaeCinygmula sp. 4 0.72% SC0Yes LarvaIronodes sp. 30 5.42% SC0Yes LarvaRhithrogena sp. 22 3.98% SC0Yes Larva
LeptophlebiidaeParaleptophlebia sp. 28 5.06% CG1Yes Larva
PlecopteraChloroperlidae
Sweltsa sp. 8 1.45% PR0Yes LarvaLeuctridae
Despaxia augusta 1 0.18% SH0Yes LarvaMoselia infuscata 1 0.18% SH0Yes Larva
NemouridaeZapada cinctipes 22 3.98% SH3Yes Larva
PerlidaeCalineuria californica 15 2.71% PR2Yes Larva
PerlodidaePerlodidae 1 0.18% PR2Yes Larva Early Instar
Friday, May 04, 2012
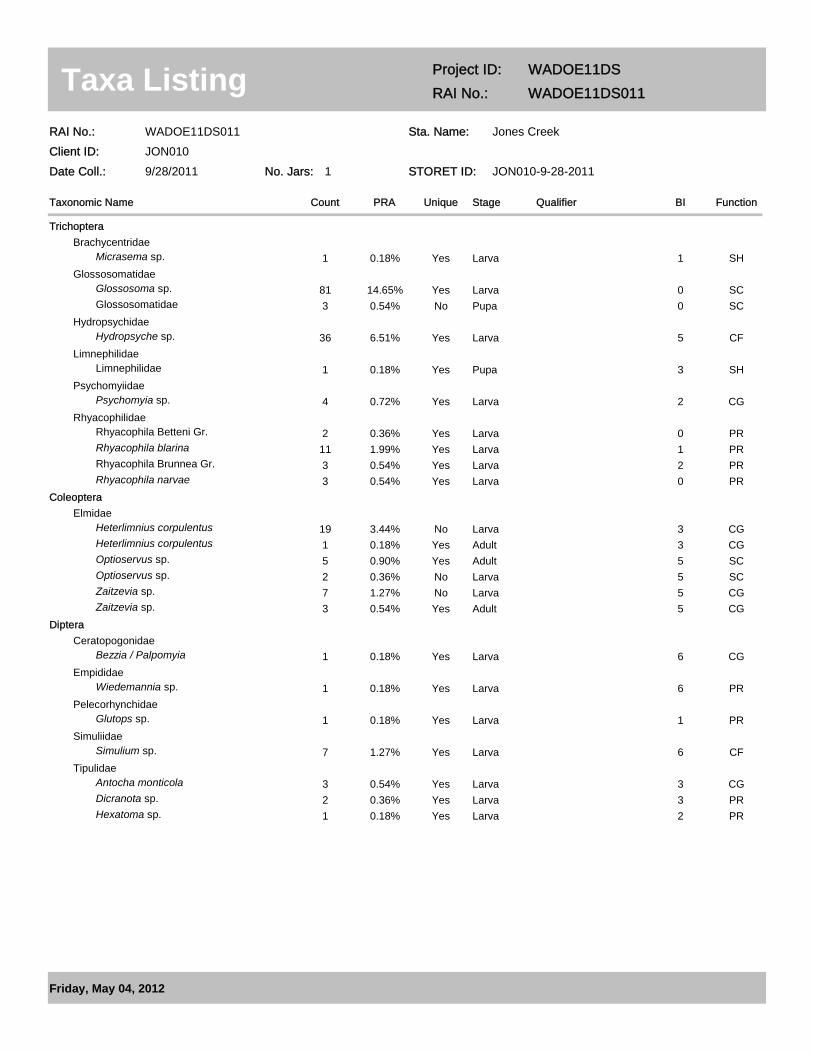
Taxa Listing Project ID: WADOE11DSRAI No.: WADOE11DS011
Sta. Name: Jones CreekClient ID: JON010
STORET ID: JON010-9-28-2011No. Jars: 1Date Coll.: 9/28/2011
Stage QualifierUniqueCountTaxonomic Name
RAI No.: WADOE11DS011
PRA FunctionBI
TrichopteraBrachycentridae
Micrasema sp. 1 0.18% SH1Yes LarvaGlossosomatidae
Glossosoma sp. 81 14.65% SC0Yes LarvaGlossosomatidae 3 0.54% SC0No Pupa
HydropsychidaeHydropsyche sp. 36 6.51% CF5Yes Larva
LimnephilidaeLimnephilidae 1 0.18% SH3Yes Pupa
PsychomyiidaePsychomyia sp. 4 0.72% CG2Yes Larva
RhyacophilidaeRhyacophila Betteni Gr. 2 0.36% PR0Yes LarvaRhyacophila blarina 11 1.99% PR1Yes LarvaRhyacophila Brunnea Gr. 3 0.54% PR2Yes LarvaRhyacophila narvae 3 0.54% PR0Yes Larva
ColeopteraElmidae
Heterlimnius corpulentus 19 3.44% CG3No LarvaHeterlimnius corpulentus 1 0.18% CG3Yes AdultOptioservus sp. 5 0.90% SC5Yes AdultOptioservus sp. 2 0.36% SC5No LarvaZaitzevia sp. 7 1.27% CG5No LarvaZaitzevia sp. 3 0.54% CG5Yes Adult
DipteraCeratopogonidae
Bezzia / Palpomyia 1 0.18% CG6Yes LarvaEmpididae
Wiedemannia sp. 1 0.18% PR6Yes LarvaPelecorhynchidae
Glutops sp. 1 0.18% PR1Yes LarvaSimuliidae
Simulium sp. 7 1.27% CF6Yes LarvaTipulidae
Antocha monticola 3 0.54% CG3Yes LarvaDicranota sp. 2 0.36% PR3Yes LarvaHexatoma sp. 1 0.18% PR2Yes Larva
Friday, May 04, 2012
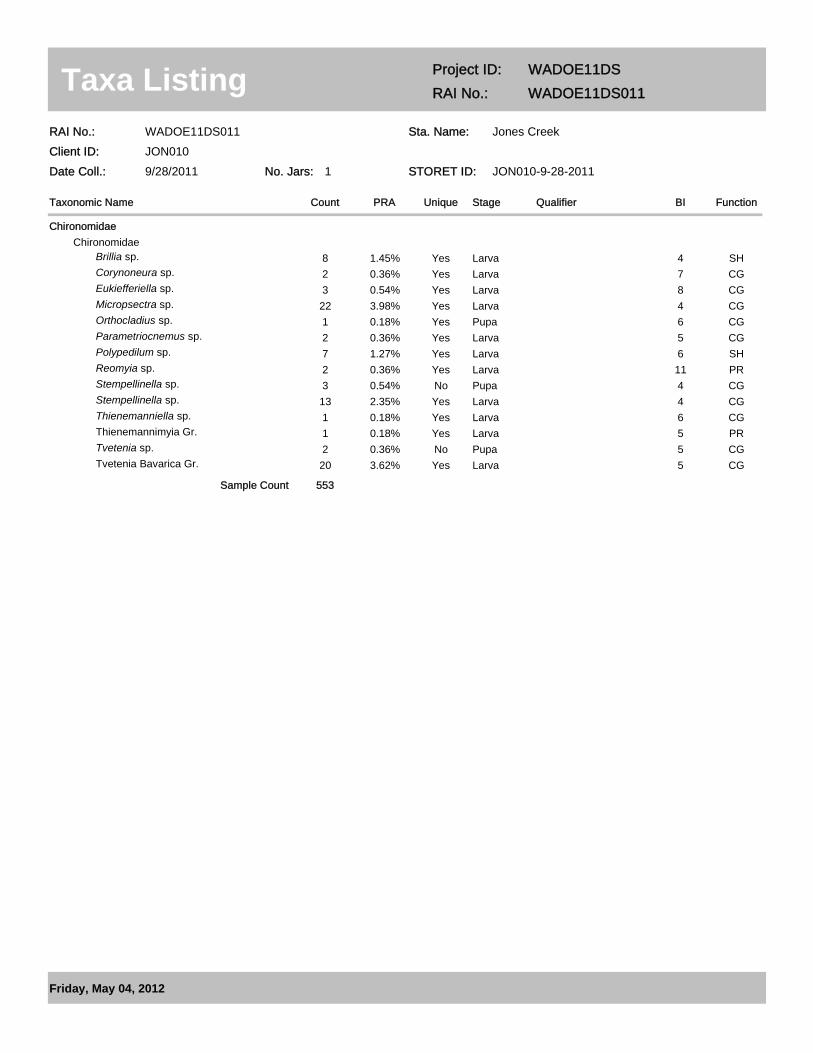
Taxa Listing Project ID: WADOE11DSRAI No.: WADOE11DS011
Sta. Name: Jones CreekClient ID: JON010
STORET ID: JON010-9-28-2011No. Jars: 1Date Coll.: 9/28/2011
Stage QualifierUniqueCountTaxonomic Name
RAI No.: WADOE11DS011
PRA FunctionBI
ChironomidaeChironomidae
Brillia sp. 8 1.45% SH4Yes LarvaCorynoneura sp. 2 0.36% CG7Yes LarvaEukiefferiella sp. 3 0.54% CG8Yes LarvaMicropsectra sp. 22 3.98% CG4Yes LarvaOrthocladius sp. 1 0.18% CG6Yes PupaParametriocnemus sp. 2 0.36% CG5Yes LarvaPolypedilum sp. 7 1.27% SH6Yes LarvaReomyia sp. 2 0.36% PR11Yes LarvaStempellinella sp. 3 0.54% CG4No PupaStempellinella sp. 13 2.35% CG4Yes LarvaThienemanniella sp. 1 0.18% CG6Yes LarvaThienemannimyia Gr. 1 0.18% PR5Yes LarvaTvetenia sp. 2 0.36% CG5No PupaTvetenia Bavarica Gr. 20 3.62% CG5Yes Larva
553Sample Count
Friday, May 04, 2012
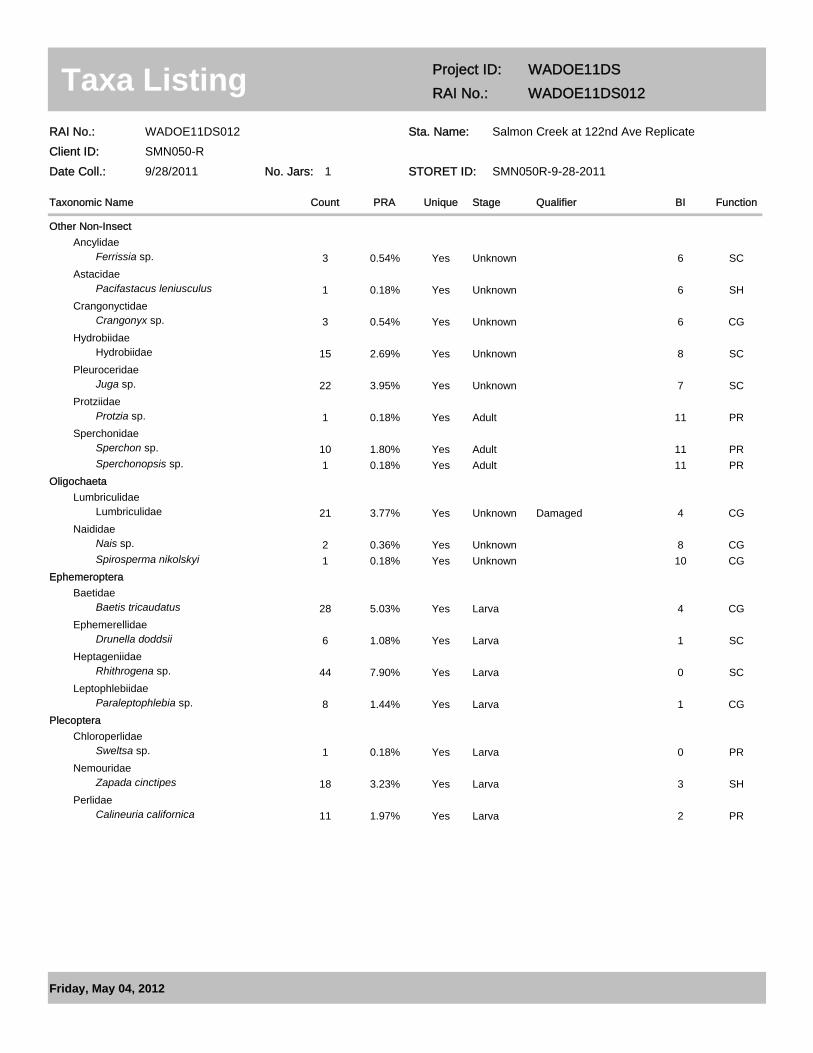
Taxa Listing Project ID: WADOE11DSRAI No.: WADOE11DS012
Sta. Name: Salmon Creek at 122nd Ave ReplicateClient ID: SMN050-R
STORET ID: SMN050R-9-28-2011No. Jars: 1Date Coll.: 9/28/2011
Stage QualifierUniqueCountTaxonomic Name
RAI No.: WADOE11DS012
PRA FunctionBI
Other Non-InsectAncylidae
Ferrissia sp. 3 0.54% SC6Yes UnknownAstacidae
Pacifastacus leniusculus 1 0.18% SH6Yes UnknownCrangonyctidae
Crangonyx sp. 3 0.54% CG6Yes UnknownHydrobiidae
Hydrobiidae 15 2.69% SC8Yes UnknownPleuroceridae
Juga sp. 22 3.95% SC7Yes UnknownProtziidae
Protzia sp. 1 0.18% PR11Yes AdultSperchonidae
Sperchon sp. 10 1.80% PR11Yes AdultSperchonopsis sp. 1 0.18% PR11Yes Adult
OligochaetaLumbriculidae
Lumbriculidae 21 3.77% CG4Yes Unknown DamagedNaididae
Nais sp. 2 0.36% CG8Yes UnknownSpirosperma nikolskyi 1 0.18% CG10Yes Unknown
EphemeropteraBaetidae
Baetis tricaudatus 28 5.03% CG4Yes LarvaEphemerellidae
Drunella doddsii 6 1.08% SC1Yes LarvaHeptageniidae
Rhithrogena sp. 44 7.90% SC0Yes LarvaLeptophlebiidae
Paraleptophlebia sp. 8 1.44% CG1Yes LarvaPlecoptera
ChloroperlidaeSweltsa sp. 1 0.18% PR0Yes Larva
NemouridaeZapada cinctipes 18 3.23% SH3Yes Larva
PerlidaeCalineuria californica 11 1.97% PR2Yes Larva
Friday, May 04, 2012
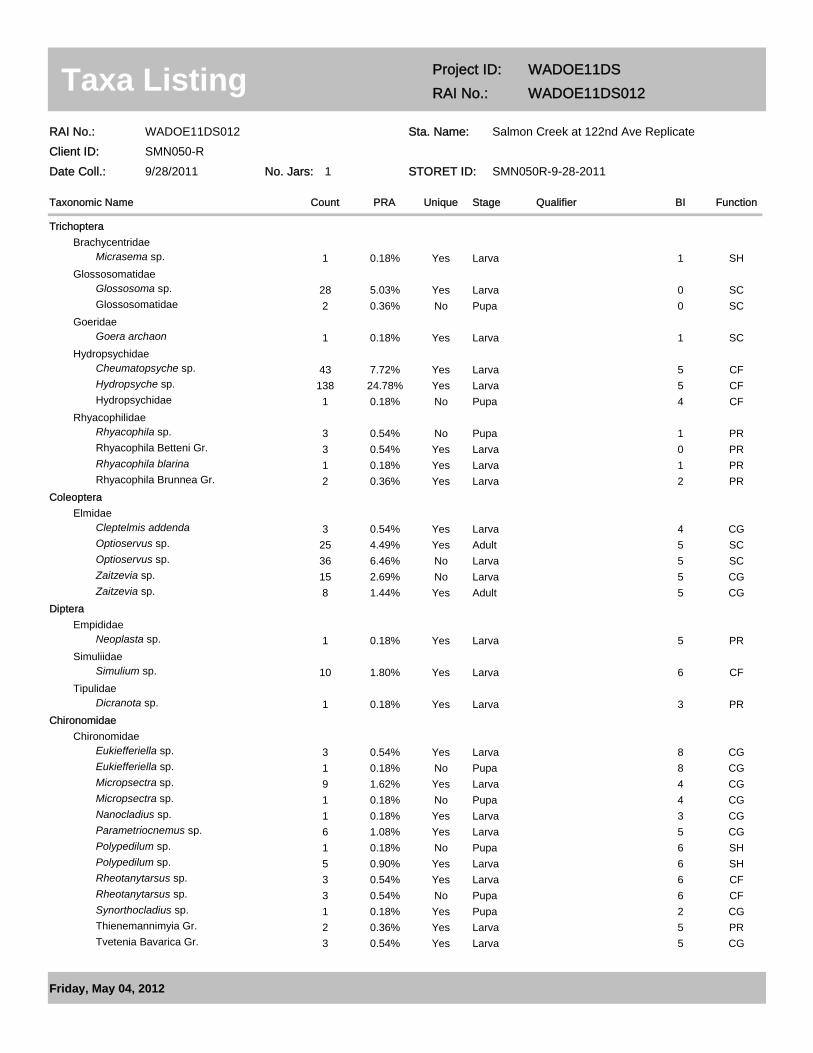
Taxa Listing Project ID: WADOE11DSRAI No.: WADOE11DS012
Sta. Name: Salmon Creek at 122nd Ave ReplicateClient ID: SMN050-R
STORET ID: SMN050R-9-28-2011No. Jars: 1Date Coll.: 9/28/2011
Stage QualifierUniqueCountTaxonomic Name
RAI No.: WADOE11DS012
PRA FunctionBI
TrichopteraBrachycentridae
Micrasema sp. 1 0.18% SH1Yes LarvaGlossosomatidae
Glossosoma sp. 28 5.03% SC0Yes LarvaGlossosomatidae 2 0.36% SC0No Pupa
GoeridaeGoera archaon 1 0.18% SC1Yes Larva
HydropsychidaeCheumatopsyche sp. 43 7.72% CF5Yes LarvaHydropsyche sp. 138 24.78% CF5Yes LarvaHydropsychidae 1 0.18% CF4No Pupa
RhyacophilidaeRhyacophila sp. 3 0.54% PR1No PupaRhyacophila Betteni Gr. 3 0.54% PR0Yes LarvaRhyacophila blarina 1 0.18% PR1Yes LarvaRhyacophila Brunnea Gr. 2 0.36% PR2Yes Larva
ColeopteraElmidae
Cleptelmis addenda 3 0.54% CG4Yes LarvaOptioservus sp. 25 4.49% SC5Yes AdultOptioservus sp. 36 6.46% SC5No LarvaZaitzevia sp. 15 2.69% CG5No LarvaZaitzevia sp. 8 1.44% CG5Yes Adult
DipteraEmpididae
Neoplasta sp. 1 0.18% PR5Yes LarvaSimuliidae
Simulium sp. 10 1.80% CF6Yes LarvaTipulidae
Dicranota sp. 1 0.18% PR3Yes LarvaChironomidae
ChironomidaeEukiefferiella sp. 3 0.54% CG8Yes LarvaEukiefferiella sp. 1 0.18% CG8No PupaMicropsectra sp. 9 1.62% CG4Yes LarvaMicropsectra sp. 1 0.18% CG4No PupaNanocladius sp. 1 0.18% CG3Yes LarvaParametriocnemus sp. 6 1.08% CG5Yes LarvaPolypedilum sp. 1 0.18% SH6No PupaPolypedilum sp. 5 0.90% SH6Yes LarvaRheotanytarsus sp. 3 0.54% CF6Yes LarvaRheotanytarsus sp. 3 0.54% CF6No PupaSynorthocladius sp. 1 0.18% CG2Yes PupaThienemannimyia Gr. 2 0.36% PR5Yes LarvaTvetenia Bavarica Gr. 3 0.54% CG5Yes Larva
Friday, May 04, 2012

Taxa Listing Project ID: WADOE11DSRAI No.: WADOE11DS012
Sta. Name: Salmon Creek at 122nd Ave ReplicateClient ID: SMN050-R
STORET ID: SMN050R-9-28-2011No. Jars: 1Date Coll.: 9/28/2011
Stage QualifierUniqueCountTaxonomic Name
RAI No.: WADOE11DS012
PRA FunctionBI
557Sample Count
Friday, May 04, 2012
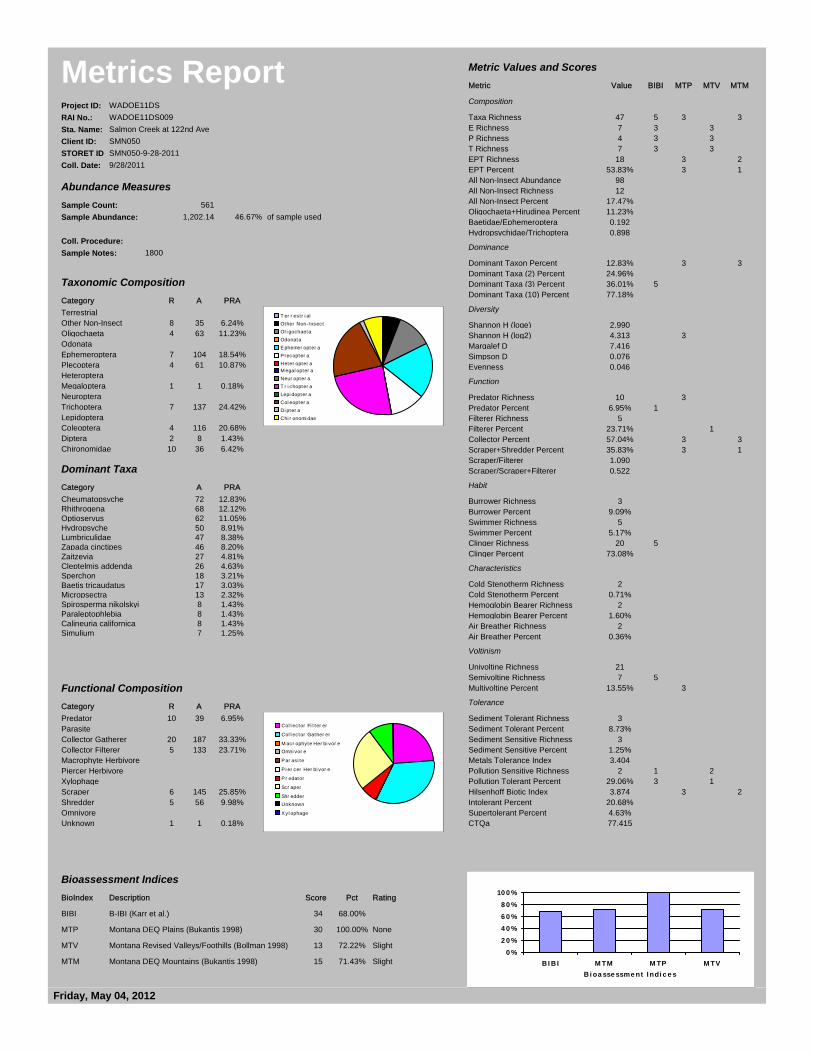
WADOE11DS009Salmon Creek at 122nd AveSMN050SMN050-9-28-20119/28/2011
WADOE11DS
Metrics ReportProject ID:RAI No.:Sta. Name:Client ID:STORET IDColl. Date:
Sample Count: 561Sample Abundance: 1,202.14 46.67%
T er r est r i alOther Non-InsectOl i gochaetaOdonataEphemer opter aP l ecopter aHeter opter aM egal opter aNeur opter aT r i chopter aLepi dopter aCol eopter aDi pter aChi r onomi dae
Abundance Measures
Taxonomic Composition
of sample used
Coll. Procedure:Sample Notes: 1800
Metric Values and Scores
Dominant Taxa
Functional Composition
Col l ector Fi l ter er
Col l ector Gather er
M acr ophyte Her bi vor eOmni vor e
Par asi te
P i er cer Her bi vor e
Pr edator
Scr aper
Shr edderUnknown
Xyl ophage
Bioassessment Indices
0 %2 0 %4 0 %6 0 %8 0 %
10 0 %
BI B I M TM M TP M TVBi oa sse ssme nt I ndi c e s
Category R A PRATerrestrialOther Non-Insect 8 35 6.24%Oligochaeta 4 63 11.23%OdonataEphemeroptera 7 104 18.54%Plecoptera 4 61 10.87%HeteropteraMegaloptera 1 1 0.18%NeuropteraTrichoptera 7 137 24.42%LepidopteraColeoptera 4 116 20.68%Diptera 2 8 1.43%Chironomidae 10 36 6.42%
Metric Value BIBI MTP MTV MTM
Composition
Taxa Richness 47 5 3 3E Richness 7 3 3P Richness 4 3 3T Richness 7 3 3EPT Richness 18 3 2EPT Percent 53.83% 3 1All Non-Insect Abundance 98All Non-Insect Richness 12All Non-Insect Percent 17.47%Oligochaeta+Hirudinea Percent 11.23%Baetidae/Ephemeroptera 0.192Hydropsychidae/Trichoptera 0.898
Dominance
Dominant Taxon Percent 12.83% 3 3Dominant Taxa (2) Percent 24.96%Dominant Taxa (3) Percent 36.01% 5Dominant Taxa (10) Percent 77.18%
Diversity
Shannon H (loge) 2.990Shannon H (log2) 4.313 3Margalef D 7.416Simpson D 0.076Evenness 0.046
Function
Predator Richness 10 3Predator Percent 6.95% 1Filterer Richness 5Filterer Percent 23.71% 1Collector Percent 57.04% 3 3Scraper+Shredder Percent 35.83% 3 1Scraper/Filterer 1.090Scraper/Scraper+Filterer 0.522
Habit
Burrower Richness 3Burrower Percent 9.09%Swimmer Richness 5Swimmer Percent 5.17%Clinger Richness 20 5Clinger Percent 73.08%
Characteristics
Cold Stenotherm Richness 2Cold Stenotherm Percent 0.71%Hemoglobin Bearer Richness 2Hemoglobin Bearer Percent 1.60%Air Breather Richness 2Air Breather Percent 0.36%
Voltinism
Univoltine Richness 21Semivoltine Richness 7 5Multivoltine Percent 13.55% 3
Tolerance
Sediment Tolerant Richness 3Sediment Tolerant Percent 8.73%Sediment Sensitive Richness 3Sediment Sensitive Percent 1.25%Metals Tolerance Index 3.404Pollution Sensitive Richness 2 1 2Pollution Tolerant Percent 29.06% 3 1Hilsenhoff Biotic Index 3.874 3 2Intolerant Percent 20.68%Supertolerant Percent 4.63%CTQa 77.415
Category A PRACheumatopsyche 72 12.83%Rhithrogena 68 12.12%Optioservus 62 11.05%Hydropsyche 50 8.91%Lumbriculidae 47 8.38%Zapada cinctipes 46 8.20%Zaitzevia 27 4.81%Cleptelmis addenda 26 4.63%Sperchon 18 3.21%Baetis tricaudatus 17 3.03%Micropsectra 13 2.32%Spirosperma nikolskyi 8 1.43%Paraleptophlebia 8 1.43%Calineuria californica 8 1.43%Simulium 7 1.25%
Category R A PRAPredator 10 39 6.95%ParasiteCollector Gatherer 20 187 33.33%Collector Filterer 5 133 23.71%Macrophyte HerbivorePiercer HerbivoreXylophageScraper 6 145 25.85%Shredder 5 56 9.98%OmnivoreUnknown 1 1 0.18%
BioIndex Description Score Pct Rating
BIBI B-IBI (Karr et al.) 34 68.00%
MTP Montana DEQ Plains (Bukantis 1998) 30 100.00% None
MTV Montana Revised Valleys/Foothills (Bollman 1998) 13 72.22% Slight
MTM Montana DEQ Mountains (Bukantis 1998) 15 71.43% Slight
Friday, May 04, 2012
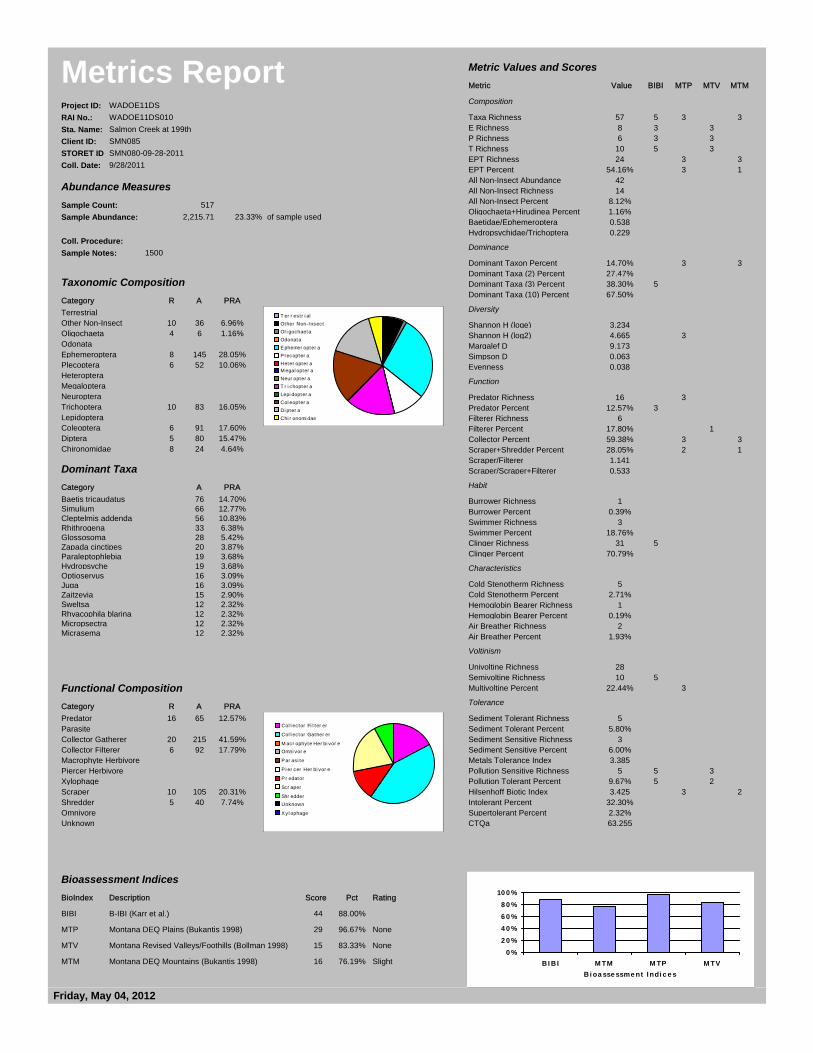
WADOE11DS010Salmon Creek at 199thSMN085SMN080-09-28-20119/28/2011
WADOE11DS
Metrics ReportProject ID:RAI No.:Sta. Name:Client ID:STORET IDColl. Date:
Sample Count: 517Sample Abundance: 2,215.71 23.33%
T er r est r i alOther Non-InsectOl i gochaetaOdonataEphemer opter aP l ecopter aHeter opter aM egal opter aNeur opter aT r i chopter aLepi dopter aCol eopter aDi pter aChi r onomi dae
Abundance Measures
Taxonomic Composition
of sample used
Coll. Procedure:Sample Notes: 1500
Metric Values and Scores
Dominant Taxa
Functional Composition
Col l ector Fi l ter er
Col l ector Gather er
M acr ophyte Her bi vor eOmni vor e
Par asi te
P i er cer Her bi vor e
Pr edator
Scr aper
Shr edderUnknown
Xyl ophage
Bioassessment Indices
0 %2 0 %4 0 %6 0 %8 0 %
10 0 %
BI B I M TM M TP M TVBi oa sse ssme nt I ndi c e s
Category R A PRATerrestrialOther Non-Insect 10 36 6.96%Oligochaeta 4 6 1.16%OdonataEphemeroptera 8 145 28.05%Plecoptera 6 52 10.06%HeteropteraMegalopteraNeuropteraTrichoptera 10 83 16.05%LepidopteraColeoptera 6 91 17.60%Diptera 5 80 15.47%Chironomidae 8 24 4.64%
Metric Value BIBI MTP MTV MTM
Composition
Taxa Richness 57 5 3 3E Richness 8 3 3P Richness 6 3 3T Richness 10 5 3EPT Richness 24 3 3EPT Percent 54.16% 3 1All Non-Insect Abundance 42All Non-Insect Richness 14All Non-Insect Percent 8.12%Oligochaeta+Hirudinea Percent 1.16%Baetidae/Ephemeroptera 0.538Hydropsychidae/Trichoptera 0.229
Dominance
Dominant Taxon Percent 14.70% 3 3Dominant Taxa (2) Percent 27.47%Dominant Taxa (3) Percent 38.30% 5Dominant Taxa (10) Percent 67.50%
Diversity
Shannon H (loge) 3.234Shannon H (log2) 4.665 3Margalef D 9.173Simpson D 0.063Evenness 0.038
Function
Predator Richness 16 3Predator Percent 12.57% 3Filterer Richness 6Filterer Percent 17.80% 1Collector Percent 59.38% 3 3Scraper+Shredder Percent 28.05% 2 1Scraper/Filterer 1.141Scraper/Scraper+Filterer 0.533
Habit
Burrower Richness 1Burrower Percent 0.39%Swimmer Richness 3Swimmer Percent 18.76%Clinger Richness 31 5Clinger Percent 70.79%
Characteristics
Cold Stenotherm Richness 5Cold Stenotherm Percent 2.71%Hemoglobin Bearer Richness 1Hemoglobin Bearer Percent 0.19%Air Breather Richness 2Air Breather Percent 1.93%
Voltinism
Univoltine Richness 28Semivoltine Richness 10 5Multivoltine Percent 22.44% 3
Tolerance
Sediment Tolerant Richness 5Sediment Tolerant Percent 5.80%Sediment Sensitive Richness 3Sediment Sensitive Percent 6.00%Metals Tolerance Index 3.385Pollution Sensitive Richness 5 5 3Pollution Tolerant Percent 9.67% 5 2Hilsenhoff Biotic Index 3.425 3 2Intolerant Percent 32.30%Supertolerant Percent 2.32%CTQa 63.255
Category A PRABaetis tricaudatus 76 14.70%Simulium 66 12.77%Cleptelmis addenda 56 10.83%Rhithrogena 33 6.38%Glossosoma 28 5.42%Zapada cinctipes 20 3.87%Paraleptophlebia 19 3.68%Hydropsyche 19 3.68%Optioservus 16 3.09%Juga 16 3.09%Zaitzevia 15 2.90%Sweltsa 12 2.32%Rhyacophila blarina 12 2.32%Micropsectra 12 2.32%Micrasema 12 2.32%
Category R A PRAPredator 16 65 12.57%ParasiteCollector Gatherer 20 215 41.59%Collector Filterer 6 92 17.79%Macrophyte HerbivorePiercer HerbivoreXylophageScraper 10 105 20.31%Shredder 5 40 7.74%OmnivoreUnknown
BioIndex Description Score Pct Rating
BIBI B-IBI (Karr et al.) 44 88.00%
MTP Montana DEQ Plains (Bukantis 1998) 29 96.67% None
MTV Montana Revised Valleys/Foothills (Bollman 1998) 15 83.33% None
MTM Montana DEQ Mountains (Bukantis 1998) 16 76.19% Slight
Friday, May 04, 2012
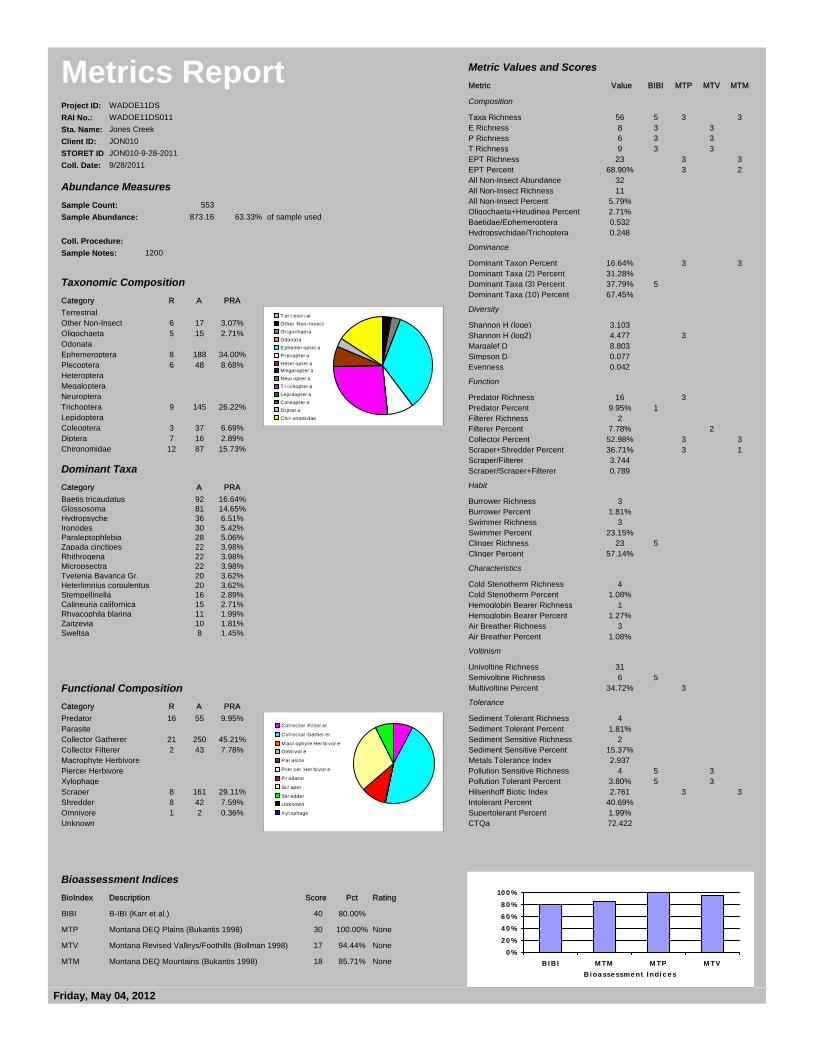
WADOE11DS011Jones CreekJON010JON010-9-28-20119/28/2011
WADOE11DS
Metrics ReportProject ID:RAI No.:Sta. Name:Client ID:STORET IDColl. Date:
Sample Count: 553Sample Abundance: 873.16 63.33%
T er r est r i alOther Non-InsectOl i gochaetaOdonataEphemer opter aP l ecopter aHeter opter aM egal opter aNeur opter aT r i chopter aLepi dopter aCol eopter aDi pter aChi r onomi dae
Abundance Measures
Taxonomic Composition
of sample used
Coll. Procedure:Sample Notes: 1200
Metric Values and Scores
Dominant Taxa
Functional Composition
Col l ector Fi l ter er
Col l ector Gather er
M acr ophyte Her bi vor eOmni vor e
Par asi te
P i er cer Her bi vor e
Pr edator
Scr aper
Shr edderUnknown
Xyl ophage
Bioassessment Indices
0 %2 0 %4 0 %6 0 %8 0 %
10 0 %
BI B I M TM M TP M TVBi oa sse ssme nt I ndi c e s
Category R A PRATerrestrialOther Non-Insect 6 17 3.07%Oligochaeta 5 15 2.71%OdonataEphemeroptera 8 188 34.00%Plecoptera 6 48 8.68%HeteropteraMegalopteraNeuropteraTrichoptera 9 145 26.22%LepidopteraColeoptera 3 37 6.69%Diptera 7 16 2.89%Chironomidae 12 87 15.73%
Metric Value BIBI MTP MTV MTM
Composition
Taxa Richness 56 5 3 3E Richness 8 3 3P Richness 6 3 3T Richness 9 3 3EPT Richness 23 3 3EPT Percent 68.90% 3 2All Non-Insect Abundance 32All Non-Insect Richness 11All Non-Insect Percent 5.79%Oligochaeta+Hirudinea Percent 2.71%Baetidae/Ephemeroptera 0.532Hydropsychidae/Trichoptera 0.248
Dominance
Dominant Taxon Percent 16.64% 3 3Dominant Taxa (2) Percent 31.28%Dominant Taxa (3) Percent 37.79% 5Dominant Taxa (10) Percent 67.45%
Diversity
Shannon H (loge) 3.103Shannon H (log2) 4.477 3Margalef D 8.803Simpson D 0.077Evenness 0.042
Function
Predator Richness 16 3Predator Percent 9.95% 1Filterer Richness 2Filterer Percent 7.78% 2Collector Percent 52.98% 3 3Scraper+Shredder Percent 36.71% 3 1Scraper/Filterer 3.744Scraper/Scraper+Filterer 0.789
Habit
Burrower Richness 3Burrower Percent 1.81%Swimmer Richness 3Swimmer Percent 23.15%Clinger Richness 23 5Clinger Percent 57.14%
Characteristics
Cold Stenotherm Richness 4Cold Stenotherm Percent 1.08%Hemoglobin Bearer Richness 1Hemoglobin Bearer Percent 1.27%Air Breather Richness 3Air Breather Percent 1.08%
Voltinism
Univoltine Richness 31Semivoltine Richness 6 5Multivoltine Percent 34.72% 3
Tolerance
Sediment Tolerant Richness 4Sediment Tolerant Percent 1.81%Sediment Sensitive Richness 2Sediment Sensitive Percent 15.37%Metals Tolerance Index 2.937Pollution Sensitive Richness 4 5 3Pollution Tolerant Percent 3.80% 5 3Hilsenhoff Biotic Index 2.761 3 3Intolerant Percent 40.69%Supertolerant Percent 1.99%CTQa 72.422
Category A PRABaetis tricaudatus 92 16.64%Glossosoma 81 14.65%Hydropsyche 36 6.51%Ironodes 30 5.42%Paraleptophlebia 28 5.06%Zapada cinctipes 22 3.98%Rhithrogena 22 3.98%Micropsectra 22 3.98%Tvetenia Bavarica Gr. 20 3.62%Heterlimnius corpulentus 20 3.62%Stempellinella 16 2.89%Calineuria californica 15 2.71%Rhyacophila blarina 11 1.99%Zaitzevia 10 1.81%Sweltsa 8 1.45%
Category R A PRAPredator 16 55 9.95%ParasiteCollector Gatherer 21 250 45.21%Collector Filterer 2 43 7.78%Macrophyte HerbivorePiercer HerbivoreXylophageScraper 8 161 29.11%Shredder 8 42 7.59%Omnivore 1 2 0.36%Unknown
BioIndex Description Score Pct Rating
BIBI B-IBI (Karr et al.) 40 80.00%
MTP Montana DEQ Plains (Bukantis 1998) 30 100.00% None
MTV Montana Revised Valleys/Foothills (Bollman 1998) 17 94.44% None
MTM Montana DEQ Mountains (Bukantis 1998) 18 85.71% None
Friday, May 04, 2012
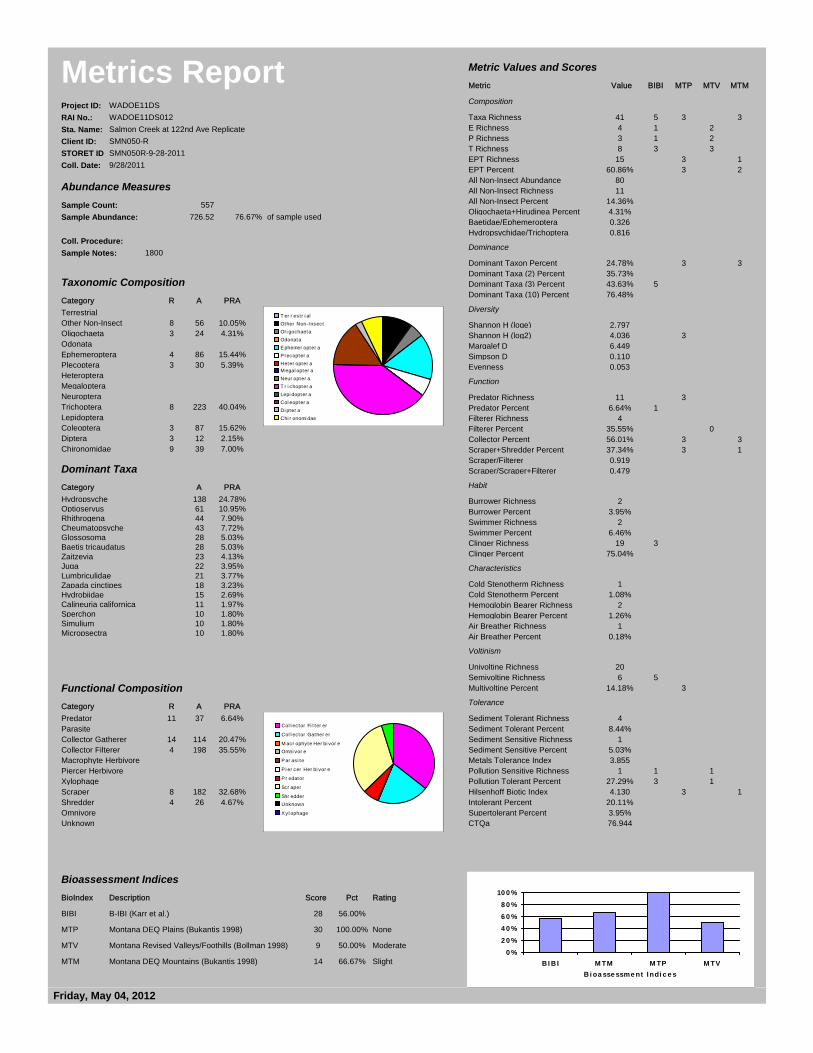
WADOE11DS012Salmon Creek at 122nd Ave ReplicateSMN050-RSMN050R-9-28-20119/28/2011
WADOE11DS
Metrics ReportProject ID:RAI No.:Sta. Name:Client ID:STORET IDColl. Date:
Sample Count: 557Sample Abundance: 726.52 76.67%
T er r est r i alOther Non-InsectOl i gochaetaOdonataEphemer opter aP l ecopter aHeter opter aM egal opter aNeur opter aT r i chopter aLepi dopter aCol eopter aDi pter aChi r onomi dae
Abundance Measures
Taxonomic Composition
of sample used
Coll. Procedure:Sample Notes: 1800
Metric Values and Scores
Dominant Taxa
Functional Composition
Col l ector Fi l ter er
Col l ector Gather er
M acr ophyte Her bi vor eOmni vor e
Par asi te
P i er cer Her bi vor e
Pr edator
Scr aper
Shr edderUnknown
Xyl ophage
Bioassessment Indices
0 %2 0 %4 0 %6 0 %8 0 %
10 0 %
BI B I M TM M TP M TVBi oa sse ssme nt I ndi c e s
Category R A PRATerrestrialOther Non-Insect 8 56 10.05%Oligochaeta 3 24 4.31%OdonataEphemeroptera 4 86 15.44%Plecoptera 3 30 5.39%HeteropteraMegalopteraNeuropteraTrichoptera 8 223 40.04%LepidopteraColeoptera 3 87 15.62%Diptera 3 12 2.15%Chironomidae 9 39 7.00%
Metric Value BIBI MTP MTV MTM
Composition
Taxa Richness 41 5 3 3E Richness 4 1 2P Richness 3 1 2T Richness 8 3 3EPT Richness 15 3 1EPT Percent 60.86% 3 2All Non-Insect Abundance 80All Non-Insect Richness 11All Non-Insect Percent 14.36%Oligochaeta+Hirudinea Percent 4.31%Baetidae/Ephemeroptera 0.326Hydropsychidae/Trichoptera 0.816
Dominance
Dominant Taxon Percent 24.78% 3 3Dominant Taxa (2) Percent 35.73%Dominant Taxa (3) Percent 43.63% 5Dominant Taxa (10) Percent 76.48%
Diversity
Shannon H (loge) 2.797Shannon H (log2) 4.036 3Margalef D 6.449Simpson D 0.110Evenness 0.053
Function
Predator Richness 11 3Predator Percent 6.64% 1Filterer Richness 4Filterer Percent 35.55% 0Collector Percent 56.01% 3 3Scraper+Shredder Percent 37.34% 3 1Scraper/Filterer 0.919Scraper/Scraper+Filterer 0.479
Habit
Burrower Richness 2Burrower Percent 3.95%Swimmer Richness 2Swimmer Percent 6.46%Clinger Richness 19 3Clinger Percent 75.04%
Characteristics
Cold Stenotherm Richness 1Cold Stenotherm Percent 1.08%Hemoglobin Bearer Richness 2Hemoglobin Bearer Percent 1.26%Air Breather Richness 1Air Breather Percent 0.18%
Voltinism
Univoltine Richness 20Semivoltine Richness 6 5Multivoltine Percent 14.18% 3
Tolerance
Sediment Tolerant Richness 4Sediment Tolerant Percent 8.44%Sediment Sensitive Richness 1Sediment Sensitive Percent 5.03%Metals Tolerance Index 3.855Pollution Sensitive Richness 1 1 1Pollution Tolerant Percent 27.29% 3 1Hilsenhoff Biotic Index 4.130 3 1Intolerant Percent 20.11%Supertolerant Percent 3.95%CTQa 76.944
Category A PRAHydropsyche 138 24.78%Optioservus 61 10.95%Rhithrogena 44 7.90%Cheumatopsyche 43 7.72%Glossosoma 28 5.03%Baetis tricaudatus 28 5.03%Zaitzevia 23 4.13%Juga 22 3.95%Lumbriculidae 21 3.77%Zapada cinctipes 18 3.23%Hydrobiidae 15 2.69%Calineuria californica 11 1.97%Sperchon 10 1.80%Simulium 10 1.80%Micropsectra 10 1.80%
Category R A PRAPredator 11 37 6.64%ParasiteCollector Gatherer 14 114 20.47%Collector Filterer 4 198 35.55%Macrophyte HerbivorePiercer HerbivoreXylophageScraper 8 182 32.68%Shredder 4 26 4.67%OmnivoreUnknown
BioIndex Description Score Pct Rating
BIBI B-IBI (Karr et al.) 28 56.00%
MTP Montana DEQ Plains (Bukantis 1998) 30 100.00% None
MTV Montana Revised Valleys/Foothills (Bollman 1998) 9 50.00% Moderate
MTM Montana DEQ Mountains (Bukantis 1998) 14 66.67% Slight
Friday, May 04, 2012
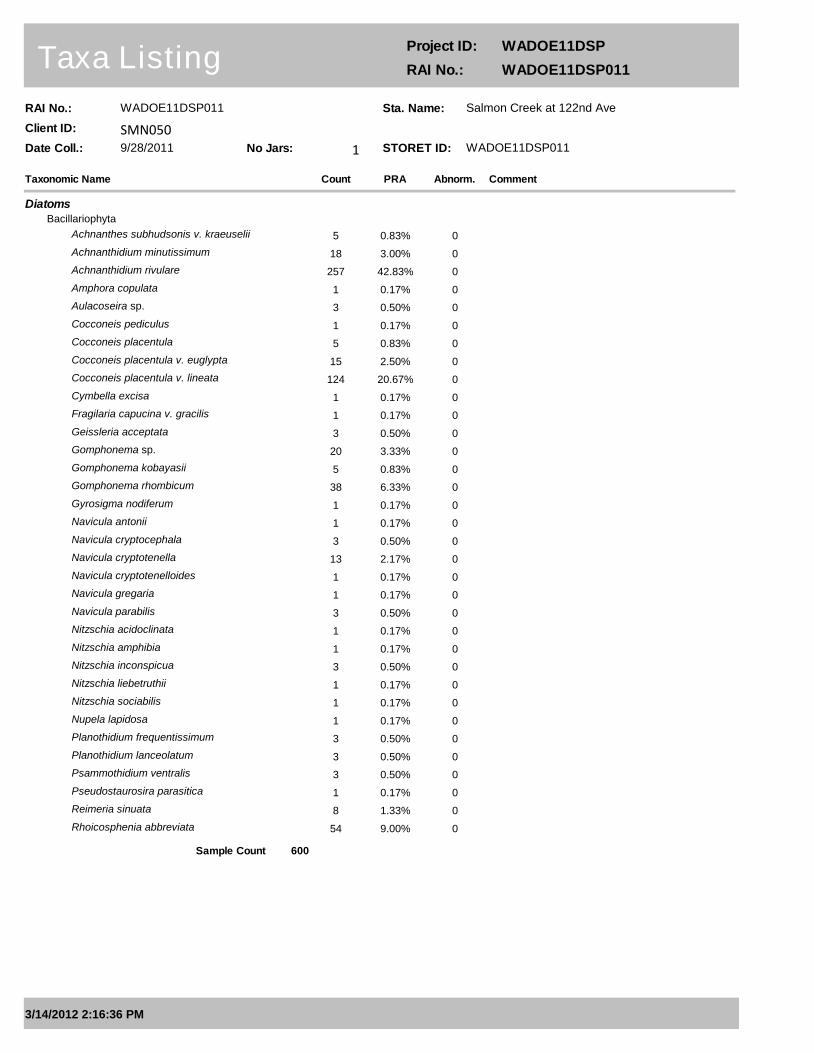
RAI No.: WADOE11DSP011
Client ID: SMN050Date Coll.: 9/28/2011 No Jars: 1
Taxonomic Name Count
Taxa ListingProject ID: WADOE11DSP
RAI No.: WADOE11DSP011
PRA Abnorm. Comment
Sta. Name: Salmon Creek at 122nd Ave
STORET ID: WADOE11DSP011
Diatoms
Bacillariophyta
Achnanthes subhudsonis v. kraeuselii 5 0.83% 0
Achnanthidium minutissimum 18 3.00% 0
Achnanthidium rivulare 257 42.83% 0
Amphora copulata 1 0.17% 0
Aulacoseira sp. 3 0.50% 0
Cocconeis pediculus 1 0.17% 0
Cocconeis placentula 5 0.83% 0
Cocconeis placentula v. euglypta 15 2.50% 0
Cocconeis placentula v. lineata 124 20.67% 0
Cymbella excisa 1 0.17% 0
Fragilaria capucina v. gracilis 1 0.17% 0
Geissleria acceptata 3 0.50% 0
Gomphonema sp. 20 3.33% 0
Gomphonema kobayasii 5 0.83% 0
Gomphonema rhombicum 38 6.33% 0
Gyrosigma nodiferum 1 0.17% 0
Navicula antonii 1 0.17% 0
Navicula cryptocephala 3 0.50% 0
Navicula cryptotenella 13 2.17% 0
Navicula cryptotenelloides 1 0.17% 0
Navicula gregaria 1 0.17% 0
Navicula parabilis 3 0.50% 0
Nitzschia acidoclinata 1 0.17% 0
Nitzschia amphibia 1 0.17% 0
Nitzschia inconspicua 3 0.50% 0
Nitzschia liebetruthii 1 0.17% 0
Nitzschia sociabilis 1 0.17% 0
Nupela lapidosa 1 0.17% 0
Planothidium frequentissimum 3 0.50% 0
Planothidium lanceolatum 3 0.50% 0
Psammothidium ventralis 3 0.50% 0
Pseudostaurosira parasitica 1 0.17% 0
Reimeria sinuata 8 1.33% 0
Rhoicosphenia abbreviata 54 9.00% 0
Sample Count 600
3/14/2012 2:16:36 PM
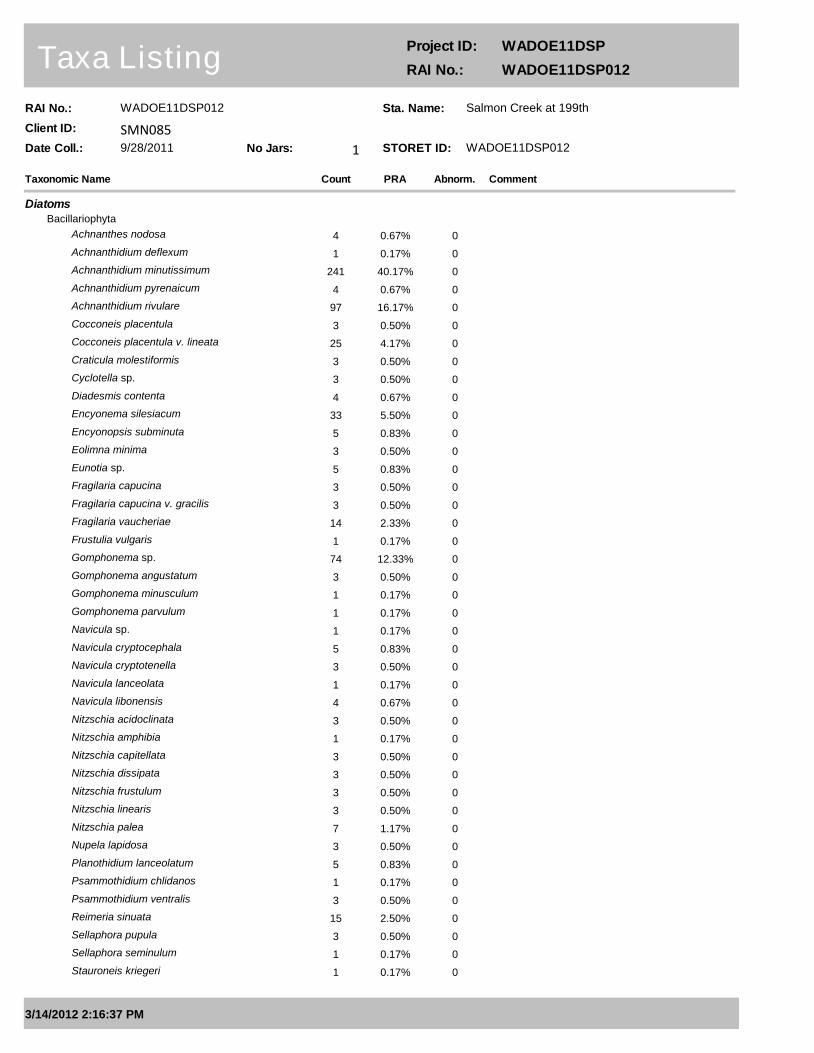
RAI No.: WADOE11DSP012
Client ID: SMN085Date Coll.: 9/28/2011 No Jars: 1
Taxonomic Name Count
Taxa ListingProject ID: WADOE11DSP
RAI No.: WADOE11DSP012
PRA Abnorm. Comment
Sta. Name: Salmon Creek at 199th
STORET ID: WADOE11DSP012
Diatoms
Bacillariophyta
Achnanthes nodosa 4 0.67% 0
Achnanthidium deflexum 1 0.17% 0
Achnanthidium minutissimum 241 40.17% 0
Achnanthidium pyrenaicum 4 0.67% 0
Achnanthidium rivulare 97 16.17% 0
Cocconeis placentula 3 0.50% 0
Cocconeis placentula v. lineata 25 4.17% 0
Craticula molestiformis 3 0.50% 0
Cyclotella sp. 3 0.50% 0
Diadesmis contenta 4 0.67% 0
Encyonema silesiacum 33 5.50% 0
Encyonopsis subminuta 5 0.83% 0
Eolimna minima 3 0.50% 0
Eunotia sp. 5 0.83% 0
Fragilaria capucina 3 0.50% 0
Fragilaria capucina v. gracilis 3 0.50% 0
Fragilaria vaucheriae 14 2.33% 0
Frustulia vulgaris 1 0.17% 0
Gomphonema sp. 74 12.33% 0
Gomphonema angustatum 3 0.50% 0
Gomphonema minusculum 1 0.17% 0
Gomphonema parvulum 1 0.17% 0
Navicula sp. 1 0.17% 0
Navicula cryptocephala 5 0.83% 0
Navicula cryptotenella 3 0.50% 0
Navicula lanceolata 1 0.17% 0
Navicula libonensis 4 0.67% 0
Nitzschia acidoclinata 3 0.50% 0
Nitzschia amphibia 1 0.17% 0
Nitzschia capitellata 3 0.50% 0
Nitzschia dissipata 3 0.50% 0
Nitzschia frustulum 3 0.50% 0
Nitzschia linearis 3 0.50% 0
Nitzschia palea 7 1.17% 0
Nupela lapidosa 3 0.50% 0
Planothidium lanceolatum 5 0.83% 0
Psammothidium chlidanos 1 0.17% 0
Psammothidium ventralis 3 0.50% 0
Reimeria sinuata 15 2.50% 0
Sellaphora pupula 3 0.50% 0
Sellaphora seminulum 1 0.17% 0
Stauroneis kriegeri 1 0.17% 0
3/14/2012 2:16:37 PM

RAI No.: WADOE11DSP012
Client ID: SMN085Date Coll.: 9/28/2011 No Jars: 1
Taxonomic Name Count
Taxa ListingProject ID: WADOE11DSP
RAI No.: WADOE11DSP012
PRA Abnorm. Comment
Sta. Name: Salmon Creek at 199th
STORET ID: WADOE11DSP012
Sample Count 600
3/14/2012 2:16:37 PM
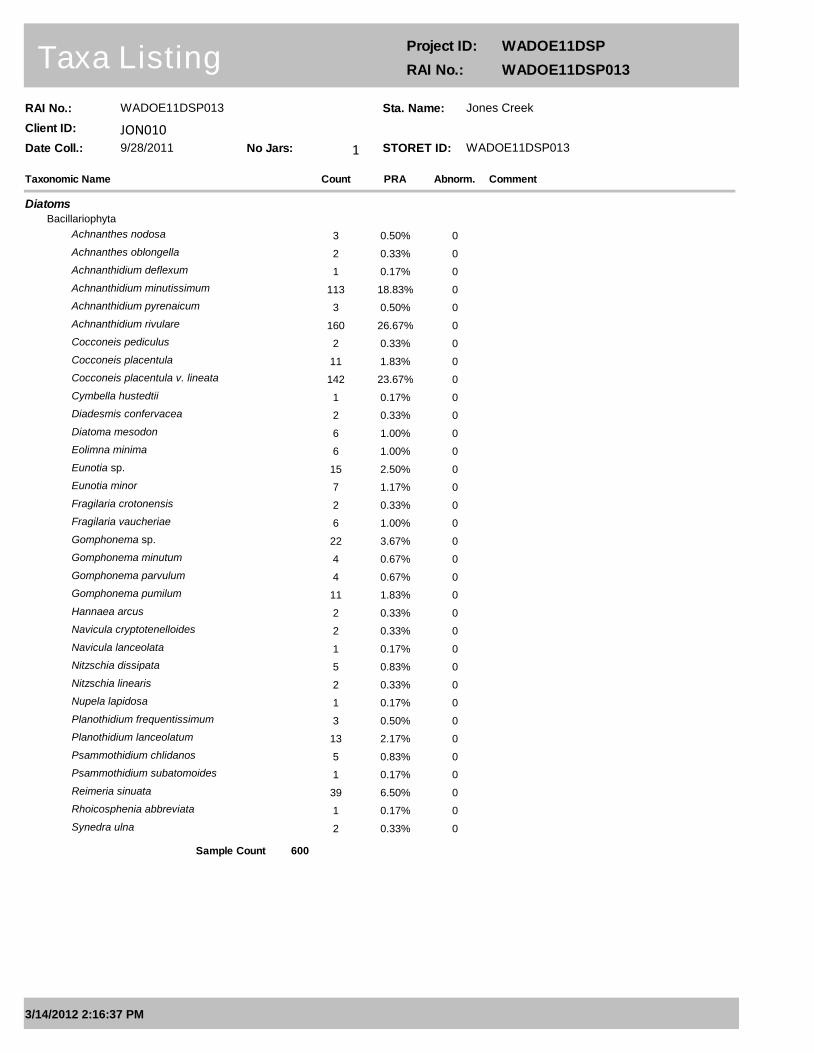
RAI No.: WADOE11DSP013
Client ID: JON010Date Coll.: 9/28/2011 No Jars: 1
Taxonomic Name Count
Taxa ListingProject ID: WADOE11DSP
RAI No.: WADOE11DSP013
PRA Abnorm. Comment
Sta. Name: Jones Creek
STORET ID: WADOE11DSP013
Diatoms
Bacillariophyta
Achnanthes nodosa 3 0.50% 0
Achnanthes oblongella 2 0.33% 0
Achnanthidium deflexum 1 0.17% 0
Achnanthidium minutissimum 113 18.83% 0
Achnanthidium pyrenaicum 3 0.50% 0
Achnanthidium rivulare 160 26.67% 0
Cocconeis pediculus 2 0.33% 0
Cocconeis placentula 11 1.83% 0
Cocconeis placentula v. lineata 142 23.67% 0
Cymbella hustedtii 1 0.17% 0
Diadesmis confervacea 2 0.33% 0
Diatoma mesodon 6 1.00% 0
Eolimna minima 6 1.00% 0
Eunotia sp. 15 2.50% 0
Eunotia minor 7 1.17% 0
Fragilaria crotonensis 2 0.33% 0
Fragilaria vaucheriae 6 1.00% 0
Gomphonema sp. 22 3.67% 0
Gomphonema minutum 4 0.67% 0
Gomphonema parvulum 4 0.67% 0
Gomphonema pumilum 11 1.83% 0
Hannaea arcus 2 0.33% 0
Navicula cryptotenelloides 2 0.33% 0
Navicula lanceolata 1 0.17% 0
Nitzschia dissipata 5 0.83% 0
Nitzschia linearis 2 0.33% 0
Nupela lapidosa 1 0.17% 0
Planothidium frequentissimum 3 0.50% 0
Planothidium lanceolatum 13 2.17% 0
Psammothidium chlidanos 5 0.83% 0
Psammothidium subatomoides 1 0.17% 0
Reimeria sinuata 39 6.50% 0
Rhoicosphenia abbreviata 1 0.17% 0
Synedra ulna 2 0.33% 0
Sample Count 600
3/14/2012 2:16:37 PM
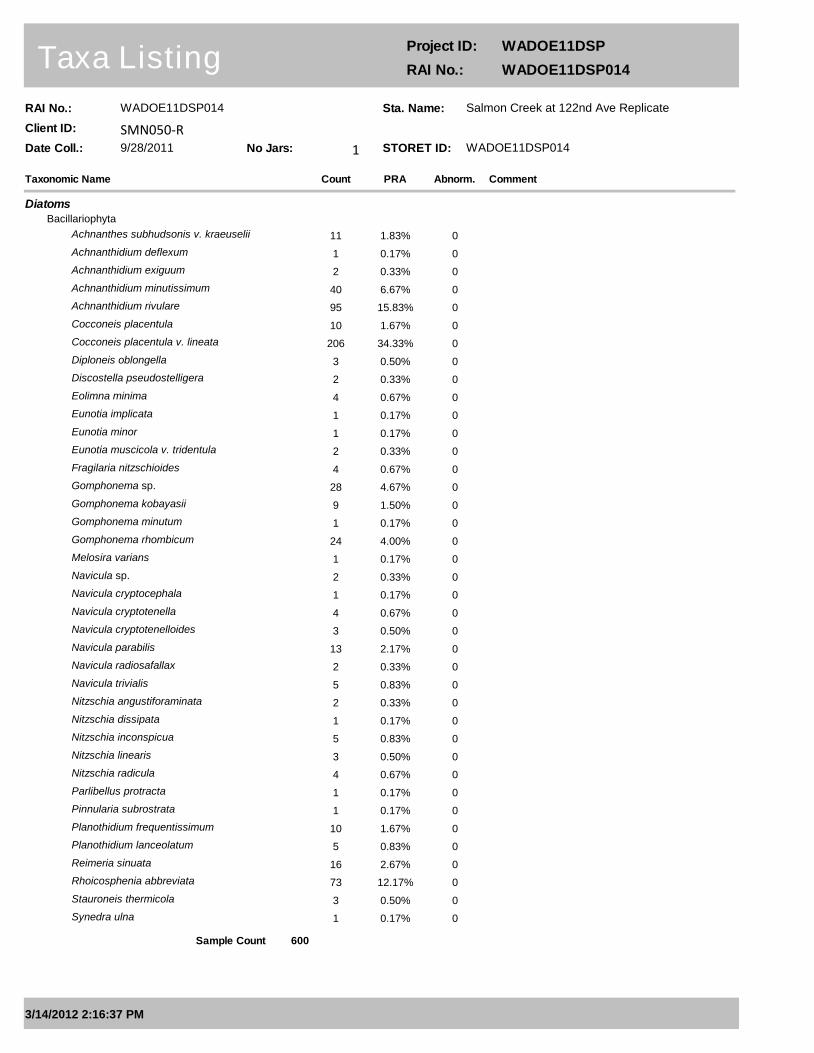
RAI No.: WADOE11DSP014
Client ID: SMN050-RDate Coll.: 9/28/2011 No Jars: 1
Taxonomic Name Count
Taxa ListingProject ID: WADOE11DSP
RAI No.: WADOE11DSP014
PRA Abnorm. Comment
Sta. Name: Salmon Creek at 122nd Ave Replicate
STORET ID: WADOE11DSP014
Diatoms
Bacillariophyta
Achnanthes subhudsonis v. kraeuselii 11 1.83% 0
Achnanthidium deflexum 1 0.17% 0
Achnanthidium exiguum 2 0.33% 0
Achnanthidium minutissimum 40 6.67% 0
Achnanthidium rivulare 95 15.83% 0
Cocconeis placentula 10 1.67% 0
Cocconeis placentula v. lineata 206 34.33% 0
Diploneis oblongella 3 0.50% 0
Discostella pseudostelligera 2 0.33% 0
Eolimna minima 4 0.67% 0
Eunotia implicata 1 0.17% 0
Eunotia minor 1 0.17% 0
Eunotia muscicola v. tridentula 2 0.33% 0
Fragilaria nitzschioides 4 0.67% 0
Gomphonema sp. 28 4.67% 0
Gomphonema kobayasii 9 1.50% 0
Gomphonema minutum 1 0.17% 0
Gomphonema rhombicum 24 4.00% 0
Melosira varians 1 0.17% 0
Navicula sp. 2 0.33% 0
Navicula cryptocephala 1 0.17% 0
Navicula cryptotenella 4 0.67% 0
Navicula cryptotenelloides 3 0.50% 0
Navicula parabilis 13 2.17% 0
Navicula radiosafallax 2 0.33% 0
Navicula trivialis 5 0.83% 0
Nitzschia angustiforaminata 2 0.33% 0
Nitzschia dissipata 1 0.17% 0
Nitzschia inconspicua 5 0.83% 0
Nitzschia linearis 3 0.50% 0
Nitzschia radicula 4 0.67% 0
Parlibellus protracta 1 0.17% 0
Pinnularia subrostrata 1 0.17% 0
Planothidium frequentissimum 10 1.67% 0
Planothidium lanceolatum 5 0.83% 0
Reimeria sinuata 16 2.67% 0
Rhoicosphenia abbreviata 73 12.17% 0
Stauroneis thermicola 3 0.50% 0
Synedra ulna 1 0.17% 0
Sample Count 600
3/14/2012 2:16:37 PM
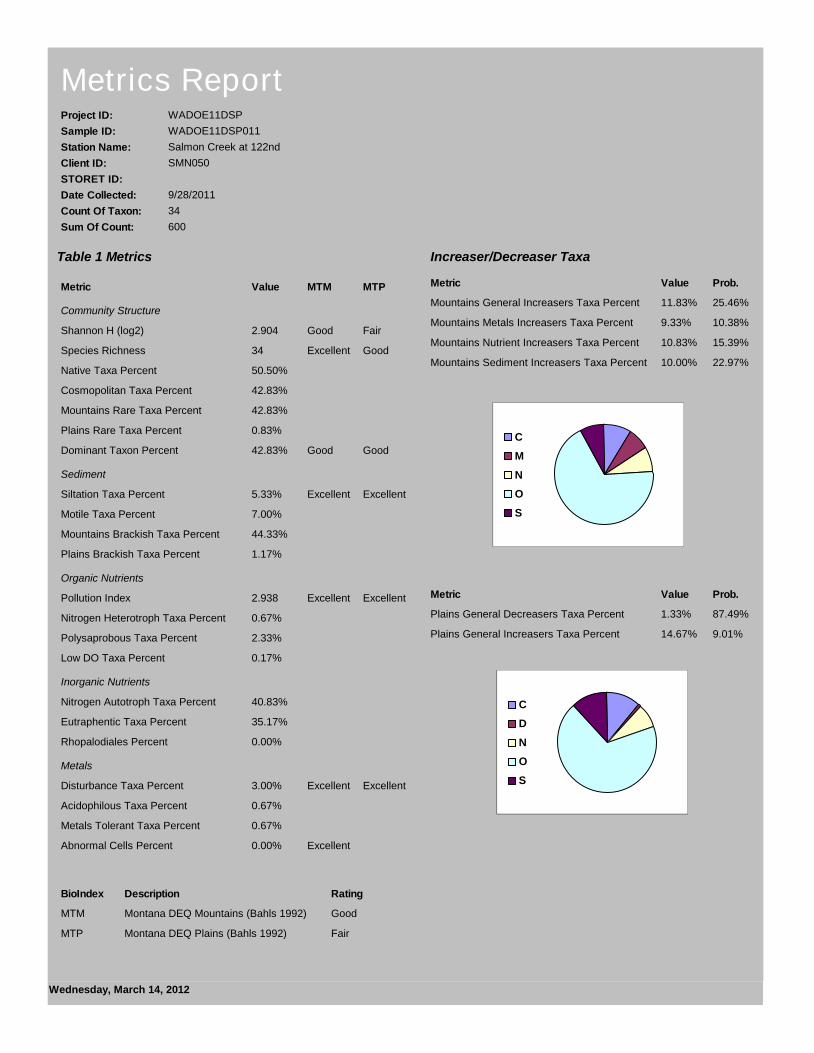
Project ID: WADOE11DSP
Sample ID: WADOE11DSP011
Station Name: Salmon Creek at 122nd
Client ID: SMN050
STORET ID:
Date Collected: 9/28/2011
Count Of Taxon: 34
Sum Of Count: 600
C
M
N
O
S
Metrics Report
Increaser/Decreaser TaxaTable 1 Metrics
C
D
N
O
S
Metric Value Prob.
Mountains General Increasers Taxa Percent 11.83% 25.46%
Mountains Metals Increasers Taxa Percent 9.33% 10.38%
Mountains Nutrient Increasers Taxa Percent 10.83% 15.39%
Mountains Sediment Increasers Taxa Percent 10.00% 22.97%
Metric Value MTM MTP
Community Structure
Shannon H (log2) 2.904 Good Fair
Species Richness 34 Excellent Good
Native Taxa Percent 50.50%
Cosmopolitan Taxa Percent 42.83%
Mountains Rare Taxa Percent 42.83%
Plains Rare Taxa Percent 0.83%
Dominant Taxon Percent 42.83% Good Good
Sediment
Siltation Taxa Percent 5.33% Excellent Excellent
Motile Taxa Percent 7.00%
Mountains Brackish Taxa Percent 44.33%
Plains Brackish Taxa Percent 1.17%
Organic Nutrients
Pollution Index 2.938 Excellent Excellent
Nitrogen Heterotroph Taxa Percent 0.67%
Polysaprobous Taxa Percent 2.33%
Low DO Taxa Percent 0.17%
Inorganic Nutrients
Nitrogen Autotroph Taxa Percent 40.83%
Eutraphentic Taxa Percent 35.17%
Rhopalodiales Percent 0.00%
Metals
Disturbance Taxa Percent 3.00% Excellent Excellent
Acidophilous Taxa Percent 0.67%
Metals Tolerant Taxa Percent 0.67%
Abnormal Cells Percent 0.00% Excellent
BioIndex Description Rating
MTM Montana DEQ Mountains (Bahls 1992) Good
MTP Montana DEQ Plains (Bahls 1992) Fair
Metric Value Prob.
Plains General Decreasers Taxa Percent 1.33% 87.49%
Plains General Increasers Taxa Percent 14.67% 9.01%
Wednesday, March 14, 2012
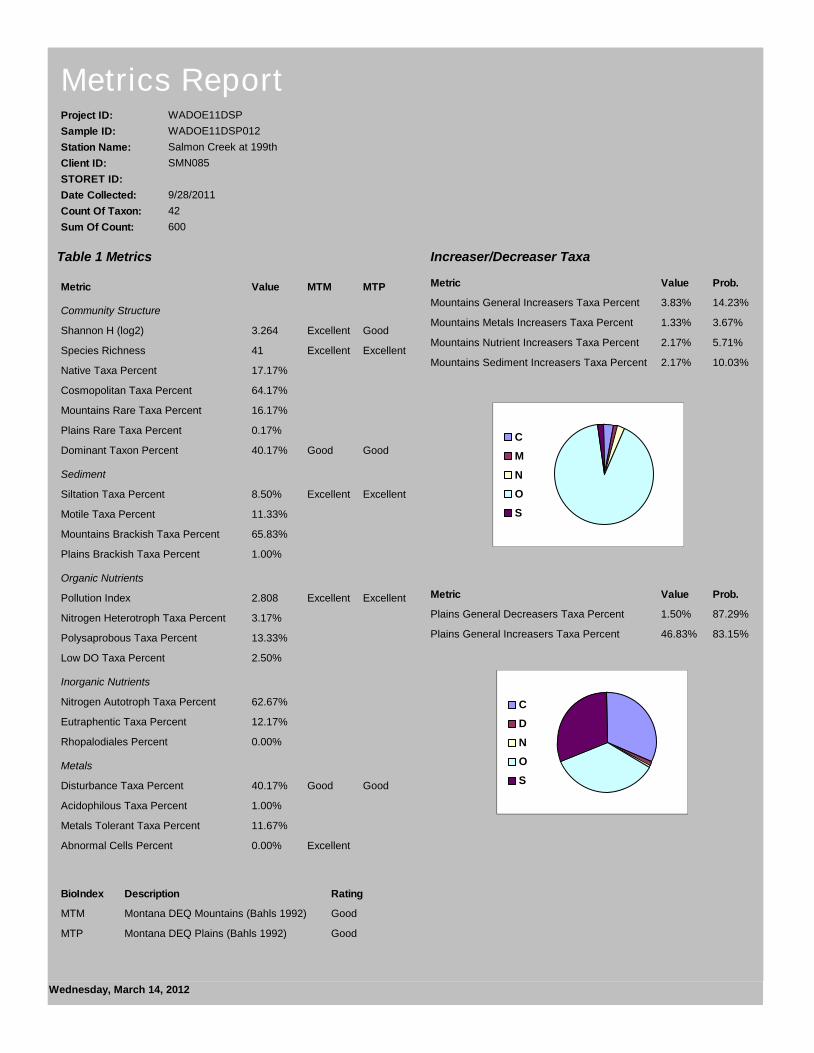
Project ID: WADOE11DSP
Sample ID: WADOE11DSP012
Station Name: Salmon Creek at 199th
Client ID: SMN085
STORET ID:
Date Collected: 9/28/2011
Count Of Taxon: 42
Sum Of Count: 600
C
M
N
O
S
Metrics Report
Increaser/Decreaser TaxaTable 1 Metrics
C
D
N
O
S
Metric Value Prob.
Mountains General Increasers Taxa Percent 3.83% 14.23%
Mountains Metals Increasers Taxa Percent 1.33% 3.67%
Mountains Nutrient Increasers Taxa Percent 2.17% 5.71%
Mountains Sediment Increasers Taxa Percent 2.17% 10.03%
Metric Value MTM MTP
Community Structure
Shannon H (log2) 3.264 Excellent Good
Species Richness 41 Excellent Excellent
Native Taxa Percent 17.17%
Cosmopolitan Taxa Percent 64.17%
Mountains Rare Taxa Percent 16.17%
Plains Rare Taxa Percent 0.17%
Dominant Taxon Percent 40.17% Good Good
Sediment
Siltation Taxa Percent 8.50% Excellent Excellent
Motile Taxa Percent 11.33%
Mountains Brackish Taxa Percent 65.83%
Plains Brackish Taxa Percent 1.00%
Organic Nutrients
Pollution Index 2.808 Excellent Excellent
Nitrogen Heterotroph Taxa Percent 3.17%
Polysaprobous Taxa Percent 13.33%
Low DO Taxa Percent 2.50%
Inorganic Nutrients
Nitrogen Autotroph Taxa Percent 62.67%
Eutraphentic Taxa Percent 12.17%
Rhopalodiales Percent 0.00%
Metals
Disturbance Taxa Percent 40.17% Good Good
Acidophilous Taxa Percent 1.00%
Metals Tolerant Taxa Percent 11.67%
Abnormal Cells Percent 0.00% Excellent
BioIndex Description Rating
MTM Montana DEQ Mountains (Bahls 1992) Good
MTP Montana DEQ Plains (Bahls 1992) Good
Metric Value Prob.
Plains General Decreasers Taxa Percent 1.50% 87.29%
Plains General Increasers Taxa Percent 46.83% 83.15%
Wednesday, March 14, 2012
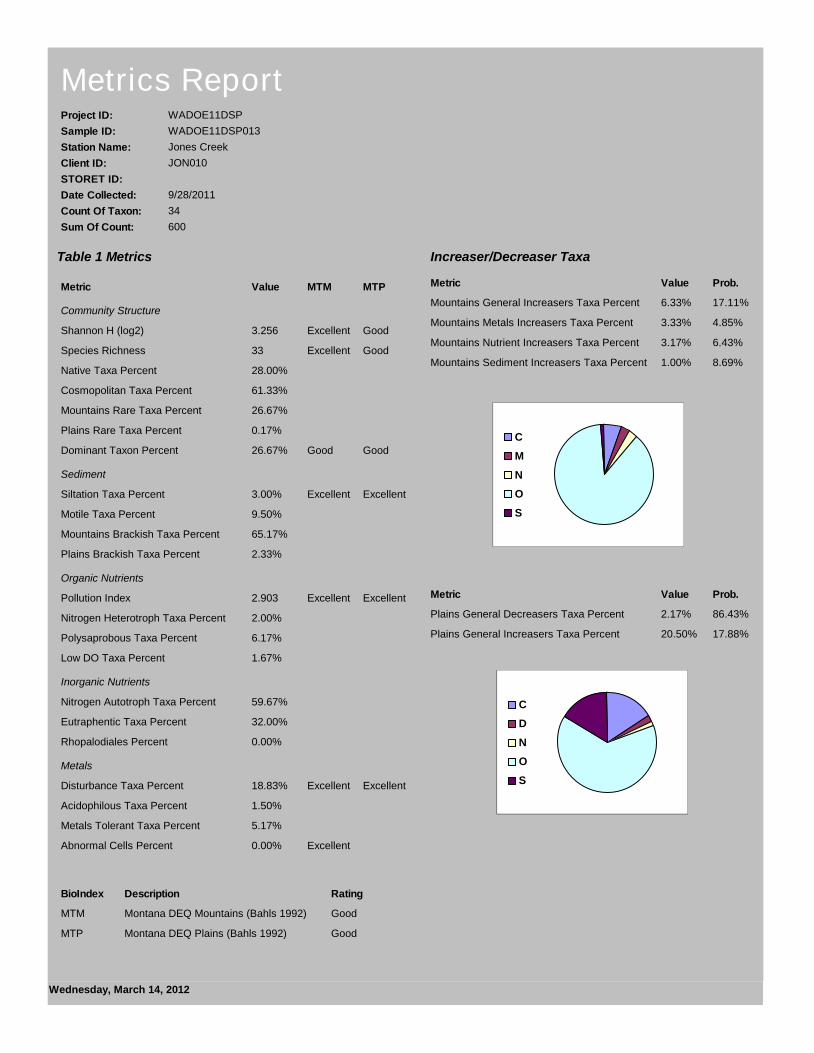
Project ID: WADOE11DSP
Sample ID: WADOE11DSP013
Station Name: Jones Creek
Client ID: JON010
STORET ID:
Date Collected: 9/28/2011
Count Of Taxon: 34
Sum Of Count: 600
C
M
N
O
S
Metrics Report
Increaser/Decreaser TaxaTable 1 Metrics
C
D
N
O
S
Metric Value Prob.
Mountains General Increasers Taxa Percent 6.33% 17.11%
Mountains Metals Increasers Taxa Percent 3.33% 4.85%
Mountains Nutrient Increasers Taxa Percent 3.17% 6.43%
Mountains Sediment Increasers Taxa Percent 1.00% 8.69%
Metric Value MTM MTP
Community Structure
Shannon H (log2) 3.256 Excellent Good
Species Richness 33 Excellent Good
Native Taxa Percent 28.00%
Cosmopolitan Taxa Percent 61.33%
Mountains Rare Taxa Percent 26.67%
Plains Rare Taxa Percent 0.17%
Dominant Taxon Percent 26.67% Good Good
Sediment
Siltation Taxa Percent 3.00% Excellent Excellent
Motile Taxa Percent 9.50%
Mountains Brackish Taxa Percent 65.17%
Plains Brackish Taxa Percent 2.33%
Organic Nutrients
Pollution Index 2.903 Excellent Excellent
Nitrogen Heterotroph Taxa Percent 2.00%
Polysaprobous Taxa Percent 6.17%
Low DO Taxa Percent 1.67%
Inorganic Nutrients
Nitrogen Autotroph Taxa Percent 59.67%
Eutraphentic Taxa Percent 32.00%
Rhopalodiales Percent 0.00%
Metals
Disturbance Taxa Percent 18.83% Excellent Excellent
Acidophilous Taxa Percent 1.50%
Metals Tolerant Taxa Percent 5.17%
Abnormal Cells Percent 0.00% Excellent
BioIndex Description Rating
MTM Montana DEQ Mountains (Bahls 1992) Good
MTP Montana DEQ Plains (Bahls 1992) Good
Metric Value Prob.
Plains General Decreasers Taxa Percent 2.17% 86.43%
Plains General Increasers Taxa Percent 20.50% 17.88%
Wednesday, March 14, 2012

Project ID: WADOE11DSP
Sample ID: WADOE11DSP014
Station Name: Salmon Creek at 122nd
Client ID: SMN050-R
STORET ID:
Date Collected: 9/28/2011
Count Of Taxon: 39
Sum Of Count: 600
C
M
N
O
S
Metrics Report
Increaser/Decreaser TaxaTable 1 Metrics
C
D
N
O
S
Metric Value Prob.
Mountains General Increasers Taxa Percent 17.00% 34.46%
Mountains Metals Increasers Taxa Percent 12.83% 15.39%
Mountains Nutrient Increasers Taxa Percent 15.33% 22.97%
Mountains Sediment Increasers Taxa Percent 13.17% 30.15%
Metric Value MTM MTP
Community Structure
Shannon H (log2) 3.462 Excellent Good
Species Richness 39 Excellent Good
Native Taxa Percent 23.50%
Cosmopolitan Taxa Percent 65.50%
Mountains Rare Taxa Percent 15.83%
Plains Rare Taxa Percent 1.67%
Dominant Taxon Percent 34.33% Good Good
Sediment
Siltation Taxa Percent 8.33% Excellent Excellent
Motile Taxa Percent 12.17%
Mountains Brackish Taxa Percent 66.17%
Plains Brackish Taxa Percent 0.17%
Organic Nutrients
Pollution Index 2.870 Excellent Excellent
Nitrogen Heterotroph Taxa Percent 1.67%
Polysaprobous Taxa Percent 5.67%
Low DO Taxa Percent 0.67%
Inorganic Nutrients
Nitrogen Autotroph Taxa Percent 63.33%
Eutraphentic Taxa Percent 52.17%
Rhopalodiales Percent 0.00%
Metals
Disturbance Taxa Percent 6.67% Excellent Excellent
Acidophilous Taxa Percent 0.17%
Metals Tolerant Taxa Percent 1.67%
Abnormal Cells Percent 0.00% Excellent
BioIndex Description Rating
MTM Montana DEQ Mountains (Bahls 1992) Good
MTP Montana DEQ Plains (Bahls 1992) Good
Metric Value Prob.
Plains General Decreasers Taxa Percent 2.83% 85.54%
Plains General Increasers Taxa Percent 19.83% 16.60%
Wednesday, March 14, 2012

This page is purposely left blank
Appendix B. Glossary, Acronyms, and Abbreviations Glossary Anthropogenic: Human-caused.
Basin: A drainage area in which all land and water areas drain or flow toward a central collector such as a stream, river, or lake at a lower elevation. Synonymous with the term watershed.
Clean Water Act: A federal act passed in 1972 that contains provisions to restore and maintain the quality of the nation’s waters. Section 303(d) of the Clean Water Act establishes the TMDL program.
Diel: Of, or pertaining to, a 24-hour period.
Dissolved oxygen (DO): A measure of the amount of oxygen dissolved in water.
Hydrograph: A graph showing the discharge of a river over a period of time.
Hydrologic: Relating to the scientific study of the waters of the earth, especially with relation to the effects of precipitation and evaporation upon the occurrence and character of water in streams, lakes, and on or below the land surface.
Nonpoint source: Pollution that enters any waters of the state from any dispersed land-based or water-based activities, including but not limited to atmospheric deposition, surface-water runoff from agricultural lands, urban areas, or forest lands, subsurface or underground sources, or discharges from boats or marine vessels not otherwise regulated under the National Pollutant Discharge Elimination System (NPDES) program. Generally, any unconfined and diffuse source of contamination. Legally, any source of water pollution that does not meet the legal definition of “point source” in section 502(14) of the Clean Water Act.
Oxidation-Reduction Potential (ORP) (also known as Redox) is a measurement of the voltage at an inert electrode, reflecting the extent of oxidation of a water sample. The more positive the ORP of a solution, the more oxidized the chemical components of the water (less positive indicates less oxidized, or more reduced).
Parameter: Water quality constituent being measured (analyte). A physical, chemical, or biological property whose values determine environmental characteristics or behavior.
Periphyton: A complex mixture of algae, cyanobacteria, heterotrophic microbes, and detritus that is attached to submerged surfaces.
pH: A measure of the acidity or alkalinity of water. A low pH value (0 to 7) indicates that an acidic condition is present, while a high pH (7 to 14) indicates a basic or alkaline condition. A pH of 7 is considered to be neutral. Since the pH scale is logarithmic, a water sample with a pH of 8 is ten times more basic than one with a pH of 7.
Point source: Sources of pollution that discharge at a specific location from pipes, outfalls, and conveyance channels to a surface water. Examples of point source discharges include municipal wastewater treatment plants, municipal stormwater systems, industrial waste treatment facilities, and construction sites that clear more than 5 acres of land.
Pollution: Contamination or other alteration of the physical, chemical, or biological properties of any waters of the state. This includes change in temperature, taste, color, turbidity, or odor of the waters. It also includes discharge of any liquid, gaseous, solid, radioactive, or other substance into any waters of the state. This definition assumes that these changes will, or are likely to, create a nuisance or render such waters harmful, detrimental, or injurious to (1) public health, safety, or welfare, or (2) domestic, commercial, industrial, agricultural, recreational, or other legitimate beneficial uses, or (3) livestock, wild animals, birds, fish, or other aquatic life.
Synoptic survey: Data collected simultaneously or over a short period of time.
Total Maximum Daily Load (TMDL): Water cleanup plan. A distribution of a substance in a waterbody designed to protect it from not meeting (exceeding) water quality standards. A TMDL is equal to the sum of all of the following: (1) individual wasteload allocations for point sources, (2) the load allocations for nonpoint sources, (3) the contribution of natural sources, and (4) a Margin of Safety to allow for uncertainty in the wasteload determination. A reserve for future growth is also generally provided.
Watershed: A drainage area or basin in which all land and water areas drain or flow toward a central collector such as a stream, river, or lake at a lower elevation.
Water year (WY): October 1 through September 30. For example, WY12 is October 1, 2011 through September 30, 2012.
303(d) list: Section 303(d) of the federal Clean Water Act requires Washington State to periodically prepare a list of all surface waters in the state for which beneficial uses of the water – such as for drinking, recreation, aquatic habitat, and industrial use – are impaired by pollutants. These are water quality-limited estuaries, lakes, and streams that fall short of state surface water quality standards and are not expected to improve within the next two years.
7-DADMax or 7-day average of the daily maximum temperatures: The arithmetic average of seven consecutive measures of daily maximum temperatures. The 7-DADMax for any individual day is calculated by averaging that day's daily maximum temperature with the daily maximum temperatures of the three days prior and the three days after that date. Acronyms and Abbreviations AFDW Ash-free dry weight B-IBI Benthic Index of Biotic Integrity BMP Best management practice CHLa Chlorophyll a DO Dissolved oxygen DOC Dissolved organic carbon Ecology Washington State Department of Ecology
EIM Environmental Information Management database EPA U.S. Environmental Protection Agency GIS Geographic Information System software MQO Measurement quality objective n number ORP (See Glossary above) QA Quality assurance RM River mile SOP Standard operating procedures SpCond Specific conductance TMDL (See Glossary above) TOC Total organic carbon TP Total phosphorus TPN Total persulfate nitrogen WAC Washington Administrative Code Units of Measurement °C degrees centigrade cfs cubic feet per second ft feet g gram, a unit of mass m meter mg milligrams mg/L milligrams per liter (parts per million) s.u. standard units ug/L micrograms per liter (parts per billion) uS/cm microSiemens per centimeter