
Sales Analytics © Stephan Sorger 2013 ; Marketing Analytics: Sales Analytics 11.1.
34
Sales Analytics phan Sorger 2013 www.StephanSorger.com ; Marketing Analytics: Sales Analytics
-
Upload
lucinda-gibbs -
Category
Documents
-
view
231 -
download
2
Transcript of Sales Analytics © Stephan Sorger 2013 ; Marketing Analytics: Sales Analytics 11.1.

Sales Analytics
© Stephan Sorger 2013 www.StephanSorger.com; Marketing Analytics: Sales Analytics 11.1

Consumer Sales Process
© Stephan Sorger 2013 www.StephanSorger.com; Marketing Analytics: Sales Analytics 11.2
5 Steps in Consumer Sales Process

© Stephan Sorger 2013 www.StephanSorger.com; Marketing Analytics: Sales Analytics 11.3
SURVEY
Part 2Topic 4: Rating…..
Topic 6: Selection
Topic 5: Answer: _____________
A B
Part 3Topic 7: Rating…..
Topic 9: Selection
Topic 8: Answer: _____________
A B
Part 1Topic 1: Rating…..
Topic 3: Selection
Topic 2: Answer: _____________
A B
Consumer Sales Process
Survey to Gather Information on Usage Scenarios/ Associations
Step 1: Problem Description

© Stephan Sorger 2013 www.StephanSorger.com; Marketing Analytics: Sales Analytics 11.4
Consumer Sales Process
Step 2: Information Search
Topic Description
Personal Individuals known by consumerExamples: Friends and acquaintances
Commercial Information provided by companiesExamples: Websites and advertising
Public Material from mass media and rating organizationsExamples: Magazines and television
Experiential Feedback from direct trial of product or serviceTest drive at dealer

© Stephan Sorger 2013 www.StephanSorger.com; Marketing Analytics: Sales Analytics 11.5
Consumer Sales Process
Altering Importance Weights
Focus on Neglected Attributes
Changing Consumer Ideals
Real Re-positioning
Psychological Re-positioning
Competitive De-positioning
ImprovingConsumer
Evaluations
Step 3: Evaluation of Alternatives

© Stephan Sorger 2013 www.StephanSorger.com; Marketing Analytics: Sales Analytics 11.6
Consumer Sales Process
Step 3: Evaluation of Alternatives

© Stephan Sorger 2013 www.StephanSorger.com; Marketing Analytics: Sales Analytics 11.7
Consumer Sales Process
PurchaseSub-Decisions
Timing
Payment Method
Quantity
Brand
Dealer
Step 4: Purchase Decision

© Stephan Sorger 2013 www.StephanSorger.com; Marketing Analytics: Sales Analytics 11.8
Consumer Sales Process
Step 4: Purchase Decision

© Stephan Sorger 2013 www.StephanSorger.com; Marketing Analytics: Sales Analytics 11.9
Consumer Sales Process
Step 5: Post-Purchase Behavior
Topic Description
After Sale Consumers continue to evaluate purchase after sale
Urgent Many products/services come with 30 day return periodMust decide quickly if they like it or not
PPD Post-Purchase DissonanceConflict between initial assessment and actual ownership
Satisfaction Companies take active steps to assess satisfactionSurveys to gauge attributes, quality, experience, overallSeek to understand “tipping point”

Ecommerce Sales Model
© Stephan Sorger 2013 www.StephanSorger.com; Marketing Analytics: Sales Analytics 11.10
EcommerceSales Model
Average revenue per orderSales predictions by segment
Budget requirement
INPUTS OUTPUTS
Campaign sales split
Campaign conversion rate
Cost per response
Spend/Sales ratio
Segment sales split
Sales forecast
Model to Estimate Sales for Ecommerce Campaigns

© Stephan Sorger 2013 www.StephanSorger.com; Marketing Analytics: Sales Analytics 11.11
Ecommerce Sales Model
Model Inputs

© Stephan Sorger 2013 www.StephanSorger.com; Marketing Analytics: Sales Analytics 11.12
Ecommerce Sales Model
Model Outputs

© Stephan Sorger 2013 www.StephanSorger.com; Marketing Analytics: Sales Analytics 11.13
Ecommerce Sales Model
Model Governing Equations
© Stephan Sorger 2013 www.StephanSorger.com; Marketing Analytics: Sales Analytics 11.14
Ecommerce Sales Model
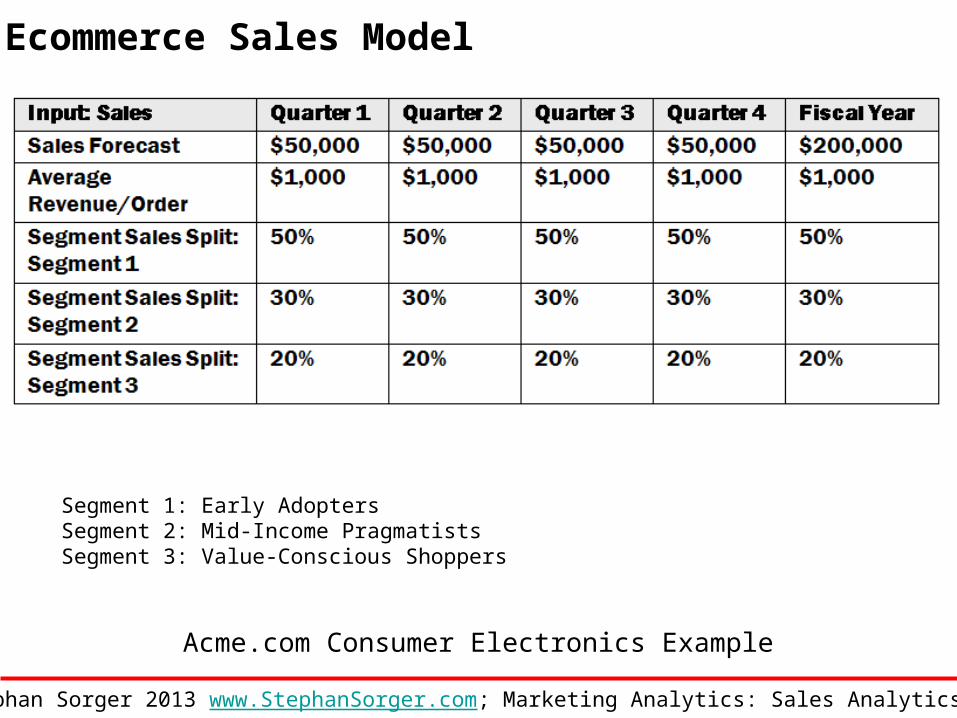
Acme.com Consumer Electronics Example
Segment 1: Early AdoptersSegment 2: Mid-Income PragmatistsSegment 3: Value-Conscious Shoppers

© Stephan Sorger 2013 www.StephanSorger.com; Marketing Analytics: Sales Analytics 11.15
Ecommerce Sales Model
Acme.com Example: Campaign Input Data

© Stephan Sorger 2013 www.StephanSorger.com; Marketing Analytics: Sales Analytics 11.16
Ecommerce Sales Model
Acme.com Example: Results for Segment 1Orders = (Sales Forecast) / (Revenue / Order)= ($200,000) / ($1,000) = 200
Orders by Segment = (Total Orders) * (Segment Sales Split)= (200) * (50%) = 100
Orders for Campaign A= (Orders for Segment 1) * (Campaign Sales Split, Campaign A)= (100) * (40%) = 40
Responses = (Orders) / (Conversion Rate)Responses, Campaign A = (40) / (2.0%) = 2,000
Budget = (Responses) * (Cost per Response)Budget, Campaign A = (2,000) * ($2.20) = $4,400
Sales, Segment 1, Campaign A = [(Sales, Segment 1)] * (Campaign Sales Split, Campaign A)= [($200,000) * (50%)] * (40%) = $40,000

© Stephan Sorger 2013 www.StephanSorger.com; Marketing Analytics: Sales Analytics 11.17
Ecommerce Sales Model
Acme.com Example: Results for Segment 1
Acme.com Example: Results for All Segments
© Stephan Sorger 2013 www.StephanSorger.com; Marketing Analytics: Sales Analytics 11.18
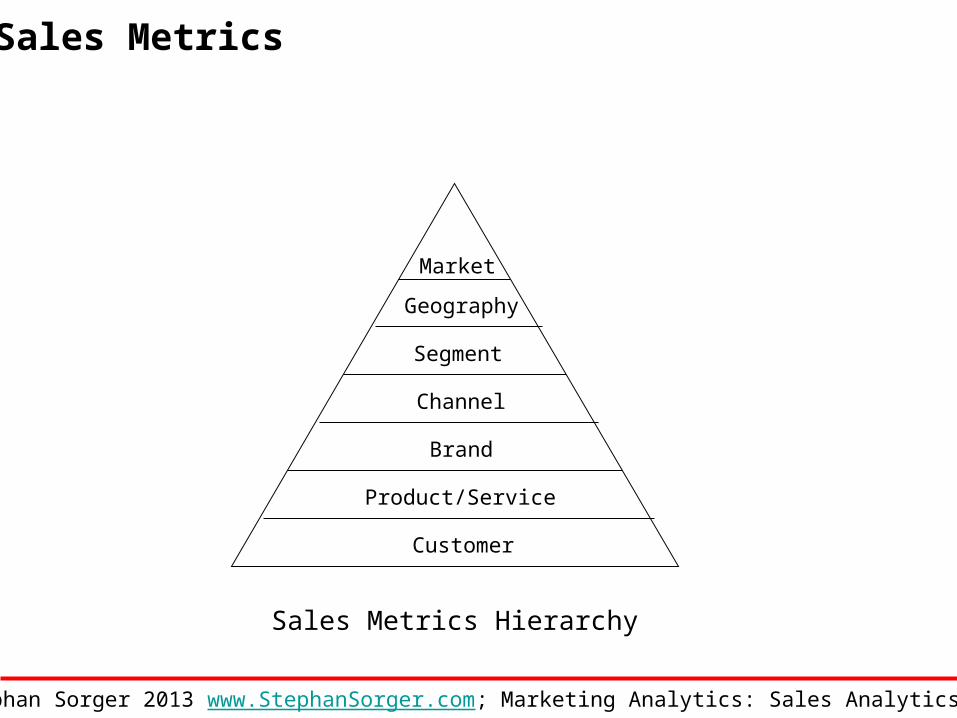
Sales Metrics
Geography
Channel
Segment
Market
Brand
Product/Service
Customer
Sales Metrics Hierarchy

© Stephan Sorger 2013 www.StephanSorger.com; Marketing Analytics: Sales Analytics 11.19
A
A
B
Market Share, Company APercent of Total Market
Market ShareCompany A & Company B
MarketShare
Sales Metrics
Sales at Market Level
Market Share = (Company Sales Revenue) / (Total Market Sales Revenue)
Relative Market Share = (Company Market Share) / (Largest Competitor’s Market Share)

© Stephan Sorger 2013 www.StephanSorger.com; Marketing Analytics: Sales Analytics 11.20
Sales Metrics
Sales at Geography Level
Sales by Geography = (Sales into Geography 1, Geography 2, etc.) (Overall Sales)
Growth Rate, Sales by Geography = [(Sales into Geography at End of Year) – (Sales into Geography at Beginning of Year)]
(Sales into Geography at Beginning of Year)
East Bay
South Bay
Peninsula
SF
North Bay
Assess sales performanceinto different geographical areas

© Stephan Sorger 2013 www.StephanSorger.com; Marketing Analytics: Sales Analytics 11.21
Sales Metrics
Sales at Segment Level
Sales by Segment = (Sales into Segment 1, Segment 2, etc.) (Overall Sales)
Growth Rate, Sales by Segment
= [ (Sales into Segment at End of Year) – (Sales into Segment at Beginning of Year) ] (Sales into Segment at Beginning of Year)
Understand how different market segments respond to our offerings

© Stephan Sorger 2013 www.StephanSorger.com; Marketing Analytics: Sales Analytics 11.22
Sales Metrics
Sales at Channel Level
Sales by Channel = (Sales by Distribution Channel 1, Channel 2, etc.) (Overall Sales)
Growth Rate, Sales by Channel
= [(Sales by Channel at End of Year) – (Sales by Channel at Beginning of Year)] (Sales by Channel at Beginning of Year)
Compare effectiveness of different distribution channels-Company retail stores-General retail stores-eCommerce sites-Direct sales forces

© Stephan Sorger 2013 www.StephanSorger.com; Marketing Analytics: Sales Analytics 11.23
Sales Metrics
Sales at Brand Level
Sales by Brand = (Sales by Brand 1, Brand 2, etc.) (Overall Sales)
Brand Penetration = (Customers Purchasing Brand 1, Brand 2, etc.) (People in Target Market)
Understand how resources invested in brands translates into sales

© Stephan Sorger 2013 www.StephanSorger.com; Marketing Analytics: Sales Analytics 11.24
Sales Metrics
AB
CD
E
AB
C
D
E
Sales Revenue by Product/ ServicePercent of Total Sales
Sales Revenue by Product/ ServiceIndividual Sales Levels
Sales at Product/Service Level
Sales Revenue by Product/Service = (Sales Revenue of Product 1, Product 2, etc.) (Overall Sales Revenue)
Unit Sales by Product/Service = (Unit Sales of Product 1, Product 2, etc.) (Overall Units Sold)

© Stephan Sorger 2013 www.StephanSorger.com; Marketing Analytics: Sales Analytics 11.25
Sales Metrics
Value
EquivalentValueToday
Today Year 1 Year 2 Year 3 etc…..
Cash Flow Discounted at Cost of Capital
Cash Flowfrom Year 1
Sales at Customer Level
Customer Lifetime Value
Customer Lifetime Value (CLV) = Margin * (Retention Rate) .[1 + (Discount Rate) – (Retention Rate)]
Margin: Amount of money contributed to the organization with each saleRetention Rate: Degree to which organization can keep customersDiscount Rate: Cost of capital used by companies to discount future cash flows

© Stephan Sorger 2013 www.StephanSorger.com; Marketing Analytics: Sales Analytics 11.26
Sales Metrics

© Stephan Sorger 2013 www.StephanSorger.com; Marketing Analytics: Sales Analytics 11.27
Profitability Metrics
Profitability Metrics Hierarchy
Company
Channel
Product/Service
Customer

© Stephan Sorger 2013 www.StephanSorger.com; Marketing Analytics: Sales Analytics 11.28
Profitability Metrics
Profitability at Company Level
Company Gross Margin Amount = (Total Sales) – (Total Cost of Sales)
Cost of Sales: Total amount of direct material, direct labor, and company overhead involved in producing company products and services
Company Gross Margin Percentage = (Company Gross Margin Amount) / (Total Sales)
Marketers are most often interested in gross margin, as opposed to straight profitability due to little direct control over certain operating expenses and cost allocations

© Stephan Sorger 2013 www.StephanSorger.com; Marketing Analytics: Sales Analytics 11.29
Profitability Metrics
Profitability at Channel Level
Governing Equations:
Customer Selling Price = (Supplier Selling Price) / [1 – (Customer Margin Percentage)]
Customer Selling Price = (Supplier Selling Price) + (Customer Margin Amount)
Supplier Selling Price = (Customer Selling Price) – (Customer Margin Amount)
Companies with networks of distribution channels, such as manufacturers of consumer goods,benefit by monitoring and evaluating profitability at the channel level
--Customer Selling Price: The price for which the distribution channel member sells its products to the next member in the distribution chain (its customer).
--Supplier Selling Price: The price the distribution channel member pays to acquire the product.
--Customer Margin Amount: The monetary amount (such as dollars or Euros) the channel member charges to move the product through their channel.
--Customer Margin Percentage: The percentage markup the channel member charges to move the product through their channel.
© Stephan Sorger 2013 www.StephanSorger.com; Marketing Analytics: Sales Analytics 11.30
Profitability Metrics
Profitability at Channel Level
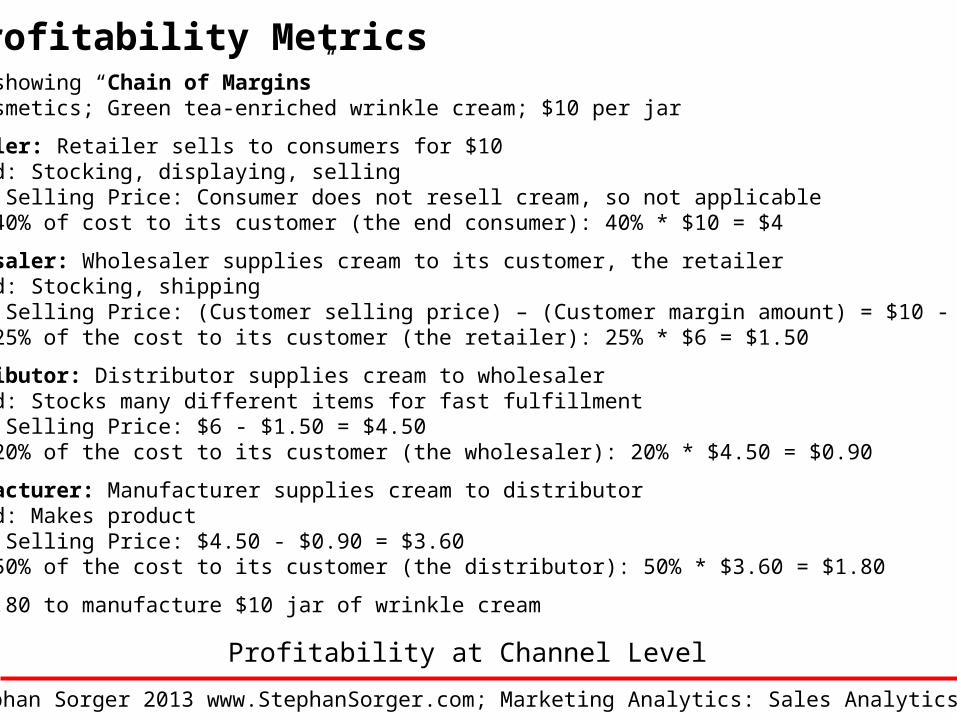
Example showing “Chain of Margins” Acme Cosmetics; Green tea-enriched wrinkle cream; $10 per jar
1. Retailer: Retailer sells to consumers for $10Value-add: Stocking, displaying, sellingSupplier Selling Price: Consumer does not resell cream, so not applicableMargin: 40% of cost to its customer (the end consumer): 40% * $10 = $4
2. Wholesaler: Wholesaler supplies cream to its customer, the retailerValue-add: Stocking, shippingSupplier Selling Price: (Customer selling price) – (Customer margin amount) = $10 - $4 = $6Margin: 25% of the cost to its customer (the retailer): 25% * $6 = $1.50
3. Distributor: Distributor supplies cream to wholesalerValue-add: Stocks many different items for fast fulfillmentSupplier Selling Price: $6 - $1.50 = $4.50Margin: 20% of the cost to its customer (the wholesaler): 20% * $4.50 = $0.90
4. Manufacturer: Manufacturer supplies cream to distributorValue-add: Makes productSupplier Selling Price: $4.50 - $0.90 = $3.60Margin: 50% of the cost to its customer (the distributor): 50% * $3.60 = $1.80
Costs $1.80 to manufacture $10 jar of wrinkle cream

© Stephan Sorger 2013 www.StephanSorger.com; Marketing Analytics: Sales Analytics 11.31
Profitability Metrics
Profitability at Product/ Service Level
In monetary terms (U.S. Dollars, Euros, etc.):Unit Margin Amount = (Selling Price per Unit) – (Cost per Unit)
In percentage terms (%):Unit Margin Percentage = (Unit Margin Amount) / (Selling Price per Unit)
Sales per product/ service is routinely measured at many organizationsNeed to team sales with cost to get profitabilityWe use the term unit margin to define the contribution each unit of product or service makes to profit.

© Stephan Sorger 2013 www.StephanSorger.com; Marketing Analytics: Sales Analytics 11.32
Profitability Metrics
Top
Middle
Bottom
High Profitability
Medium Profitability
Low Profitability
Profitability at Customer Level
Customer Profit = (Customer Revenue) – (Customer Cost)
Companies seeking to benefit from long-term relationships with customersneed to understand profitability at the customer level.
Tier Goal Airlines Loyalty Program Example
Top Reward Free upgrades; Customer loungeMiddle Grow Remind of perks in Top TierBottom Charge Baggage fees; Internet fees

© Stephan Sorger 2013 www.StephanSorger.com; Marketing Analytics: Sales Analytics 11.33
Support Metrics
Satisfaction Score Comments
Very Satisfied Marketers refer to this score as the “Top Box”Somewhat Satisfied “Top Two Boxes” (along with Very Satisfied)Neither Satisfied nor Dissatisfied Neutral; some surveys use even number of choicesSomewhat Dissatisfied Fair amount of dissonanceVery Dissatisfied Major problems
Customer Satisfaction

© Stephan Sorger 2013 www.StephanSorger.com; Marketing Analytics: Sales Analytics 11.34
Support Metrics
1 2 3 4 5 6 7 8 9 10
Detractors Passives Promoters
Net Promoter Score
Net Promoter ScoreDeveloped by Fred ReichheldSingle number to capture customer satisfactionSingle question: Would you be willing to recommend this to others?
Promoters: Those highly likely to recommendDetractors: Those highly unlikely to recommendPassives: Everyone else
Net Promoter Score = (Percentage of Promoters) – (Percentage of Detractors)


