Salary Index - media.monsterindia.com
20
Prepared by Tomas Kabina, Central European Labour Studies Institute, Bratislava Biju Varkkey, Paycheck India and Indian Institute of Management Ahmedabad Rupa Korde, Paycheck India Peter Bizik, Central European Labour Studies Institute, Bratislava and WageIndicator Foundation, Amsterdam A joint initiative of Monster India & Paycheck.in with IIM-Ahmedabad as Research Partner Salary Index INDIAN BFSI SECTOR © WageIndicator Foundation Bibliographic Information WageIndicator Foundation Kabina, T., Bizik, P . (2015). WageIndex Report India: Wages and working conditions in the IT sector. Acknowledgements This paper uses data collected on behalf of the agreement between Monster India and WageIndicator Foundation. The data have been used with the permission of the WageIndicator Foundation. We thank Martin Kahanec (CELSI), Khushi Mehta (Paycheck.in), Paulien Osse (WageIndicator Foundation) and Priyanka Sharma (MonsterIndia.com) for invaluable comments and suggestion on earlier drafts of this report. The usual disclaimer applies. Confidential document, accusable exclusively to the founders of the WageIndicator Foundation.
Transcript of Salary Index - media.monsterindia.com

Prepared byTomas Kabina, Central European Labour Studies Institute, Bratislava Biju Varkkey, Paycheck India and Indian Institute of Management AhmedabadRupa Korde, Paycheck IndiaPeter Bizik, Central European Labour Studies Institute, Bratislava andWageIndicator Foundation, Amsterdam
A joint initiative of Monster India & Paycheck.in with IIM-Ahmedabad as Research Partner
Salary IndexINDIAN BFSI SECTOR
© WageIndicator Foundation
Bibliographic InformationWageIndicator Foundation Kabina, T., Bizik, P. (2015). WageIndex Report India: Wages and working conditions in the IT sector.
AcknowledgementsThis paper uses data collected on behalf of the agreement between Monster India and WageIndicator Foundation. The data have been used with the permission of the WageIndicator Foundation.
We thank Martin Kahanec (CELSI), Khushi Mehta (Paycheck.in), Paulien Osse (WageIndicator Foundation) and Priyanka Sharma (MonsterIndia.com) for invaluable comments and suggestion on earlier drafts of this report. The usual disclaimer applies.
Confidential document, accusable exclusively to the founders of the WageIndicator Foundation.

MONSTER SALARY INDEXMonster Salary Index is a joint initiative of Monster India and Paycheck.in with IIM-Ahmedabad as a Research Partner. The MSI (Monster Salary Index) has successfully empowered job seekers with benchmarking to compare their salaries with other anonymous profiles across a broad spectrum of industry domains, experience and functional groups, both in India and other global markets.
For Employers, MSI has an online Salary Survey which is run along with WageIndicator Foundation, Netherlands and Paycheck.in, and IIMA as Research Partner. It aims to provide employers with practical information and helps them make informed decisions by analyzing the salary market and optimizing employee remuneration.

ABOUT THE TEAM
2-3MONSTER SALARY INDEX

IIMA RESEARCH PARTNER
WAGEINDICATOR FOUNDATION OWNER OF SALARY INDEX CONCEPT AND FORMULA
PAYCHECK INDIASALARY INDEX INTERFACE RESIDING ON MONSTER INDIA
MONSTER INDIAwww.monsterindia.comMonster India, India’s leading online career and recruitment resource with its cutting edge technology provides relevant profiles to employers and relevant jobs to jobseekers across industry verticals, experience levels and geographies. More than 200 million people have registered on the Monster Worldwide network. Today, with operations in more than 40 countries, Monster
Monster.com was voted Product of the Year under the ‘Online Job Portals category’ in a survey of over 18000 people by Nielsen. Back in 2014, Monster mPower Search was voted Product of the Year under the ‘Online Job Portals category’ in the same survey. Monster India and DishTV partnered in convergence of the Internet and TV medium to make job services accessible to TV viewers across all cities, bridging the unmet need of the audience for whom access to the internet is limited. This first ever job search initiative is called ‘Monsterjobs Active’.
provides the widest and most sophisticated job seeking, career management, recruitment and talent management capabilities globally. Monster India started its operations in 2001. Headquartered in Hyderabad, the company has presence in 11 other cities of India viz., Mumbai, Delhi, Bangalore, Chennai, Pune, Kolkata, Ahmedabad, Baroda, Chandigarh, Jaipur and Cochin.
The Indian Air Force Placement Cell (IAFPC) selected Monster India for a collaboration to provide a robust platform to assist retired and shortly retiring Air Warriors seek suitable second career opportunities in the corporate world. Monster also initiated ‘Rozgarduniya.com’ - a job
Indian Institute of Management, Ahmedabad (IIMA) – www.iimahd.ernet.in IIMA is the leading school of management in India and one of the top rated management schools in Asia. It offers long duration programs in management, agri-business, executive management and faculty development programs. IIMA also conducts doctoral level research program in management and public systems. The institute
The WageIndicator Foundation started in 2001 to contribute to a more transparent labour market for workers and employers. It collects, compares and shares labour market information through (online & face-face) surveys and desk research. It serves as an online library for wage information, Labour Law and career advice.
The WageIndicator Foundation is assisted by world-renowned universities, trade unions and employers’ organisations and currently operates in 80
Paycheck India a research initiative at Indian Institute of Management Ahmedabad is part of WageIndicator, an organization that collects and shares data about wages, labour law and career in more than 80 countries. Paycheck India aims to bring transparency
portal exclusively for jobseekers in rural India to enable employers in corporate India to connect with rural talent, thus removing the traditional barriers they face in this process.
www.monsterindia.com
www.facebook.com/monsterindia
www.twitter.com/monster_india
Indian Institute of Management Ahmedabadwww.iimahd.ernet.in
has contributed significantly to management education of working executives, government and policy makers and armed forces. Faculty members participate in governance of firms and organisations by providing advisory, capacity building support as well as taking roles in boards and trusts. IIMA hosts Paycheck India and was the first Asian B School to be part of WageIndicator.
countries. Their international staff consists of some 100 specialists spread over the whole world. The foundation has strong relationships with Monster since 2003. The WageIndicator Foundation is a global organization reaching millions on a monthly basis. For more information please visit: WageIndicator.org.WageIndicator Foundation has offices in Amsterdam (HQ), Ahmedabad, Bratislava, Buenos Aires, Cape Town, Dar es Salaam, Maputo and Minsk.
in the labour market by providing salary predictions for 1600 occupations in India through its Salary Checker. It also provides regular updates on state wise minimum wages in India, living wage calculation, labour laws and career advice.
WageIndicator Foundation Roetersstraat 25-351018 WB AmsterdamThe [email protected]
Paycheck India [email protected] www.paycheck.in
4-5MONSTER SALARY INDEX

FOREWORD
6-7MONSTER SALARY INDEX
Monster India is pleased to present to you the 2015 edition of Monster Salary Index Report for BFSI Sector. After a great response to The Monster Employment Index (MEI) which is a very quoted and credible industry benchmark for hiring activity across sectors, we launched the Salary Index in April 2013, as another point of reference for the industry. We partnered with WageIndex Foundation, Netherlands and IIM Ahmedabad as our reliable partners on this journey.
Is salary truly the most compelling tool for employee acquisition and retention, remains to be a topic for debate and deliberation amongst employers. The deliberation is intriguing as well as valid and may carry on, but salary definitely makes for one of the key fundamentals for talent acquisition.
Our customer research and market studies over the years indicated a strong need for a yardstick that provides both employers and jobseekers with comprehensive information pertaining to job market and salary trends from a single source. The MSI (Monster Salary Index) has successfully empowered jobseekers with benchmarking to compare their salaries with other anonymous profiles across a broad spectrum of industry, domains, experience, functional groups both in India and other global markets.
For Employers, Monster has an online Index which is run along with Wage Indicator Foundation Netherlands and Paycheck.in, with IIM-A as research partner. The index also features in a dynamic intelligent tool on Monster.com called Monster Analytics. Monster Analytics helps employers make informed decisions to manage their human capital effectively. It provides insights to employers with industry and salary trends.
You are holding a copy of the MSI survey capturing the highlights of the BFSI sector covering sector-specific salaries and workers satisfaction by education, ownership of the company and gender amongst other factors. It aims to provide employers with practical information and help them make better decisions by analyzing the salary market and optimizing employee remuneration thereby fostering a stronger work force.
There are some insightful findings in this report that would help you find, retain and manage better talent.
Many Thanks
Sanjay Modi Managing Director Monster.com India, Middle East, Southeast Asia, Hong Kong
`

ACKNOWLEDGEMENTCENTRAL EUROPEAN LABOUR STUDIES INSTITUTE (CELSI) WWW.CELSI.SK
CELSI is an independent non-profit research institute based in Bratislava, Slovakia. It fosters multidisciplinary research about the functioning of labour markets and institutions, work and organizations, business and society, and ethnicity and migration in the economic, social, and political life of modern societies. Supported by its network of Research Fellows and Affiliates and a new Discussion Paper series, CELSI makes a contribution to the cutting-edge international scientific discourse. Hosting the Bratislava Office of the international WageIndicator project, CELSI provides expert data services.
8-9MONSTER SALARY INDEX

1. INDIAN FINANCE SECTOR: KEY FINDINGS 12
2. FINANCE SECTOR PERFORMANCE REVIEW 14
3. WAGES AND WORKING CONDITIONS IN INDIAN FINANCIAL SECTOR 18 3.1 IMPACT OF GENDER 22 3.2 IMPACT OF SUPERVISORY POSITION 23 3.3 IMPACT OF TENURE 24 3.4 IMPACT OF CONTRACT TYPE 26 3.5 IMPACT OF OWNERSHIP 26 3.6 IMPACT OF COMPANY SIZE 27 3.7 OVERTIME WORK 28 3.8 BONUS STRUCTURE 29 3.9 SATISFACTION 30
4. APPENDIX 32 ABOUT THE DATASET AND DEFINITION 32
5. BIBLIOGRAPHY 34
CO
NTEN
TS
CONTENTS
10-11MONSTER SALARY INDEX
12MONSTER SALARYINDEX
13MONSTER
SALARYINDEX
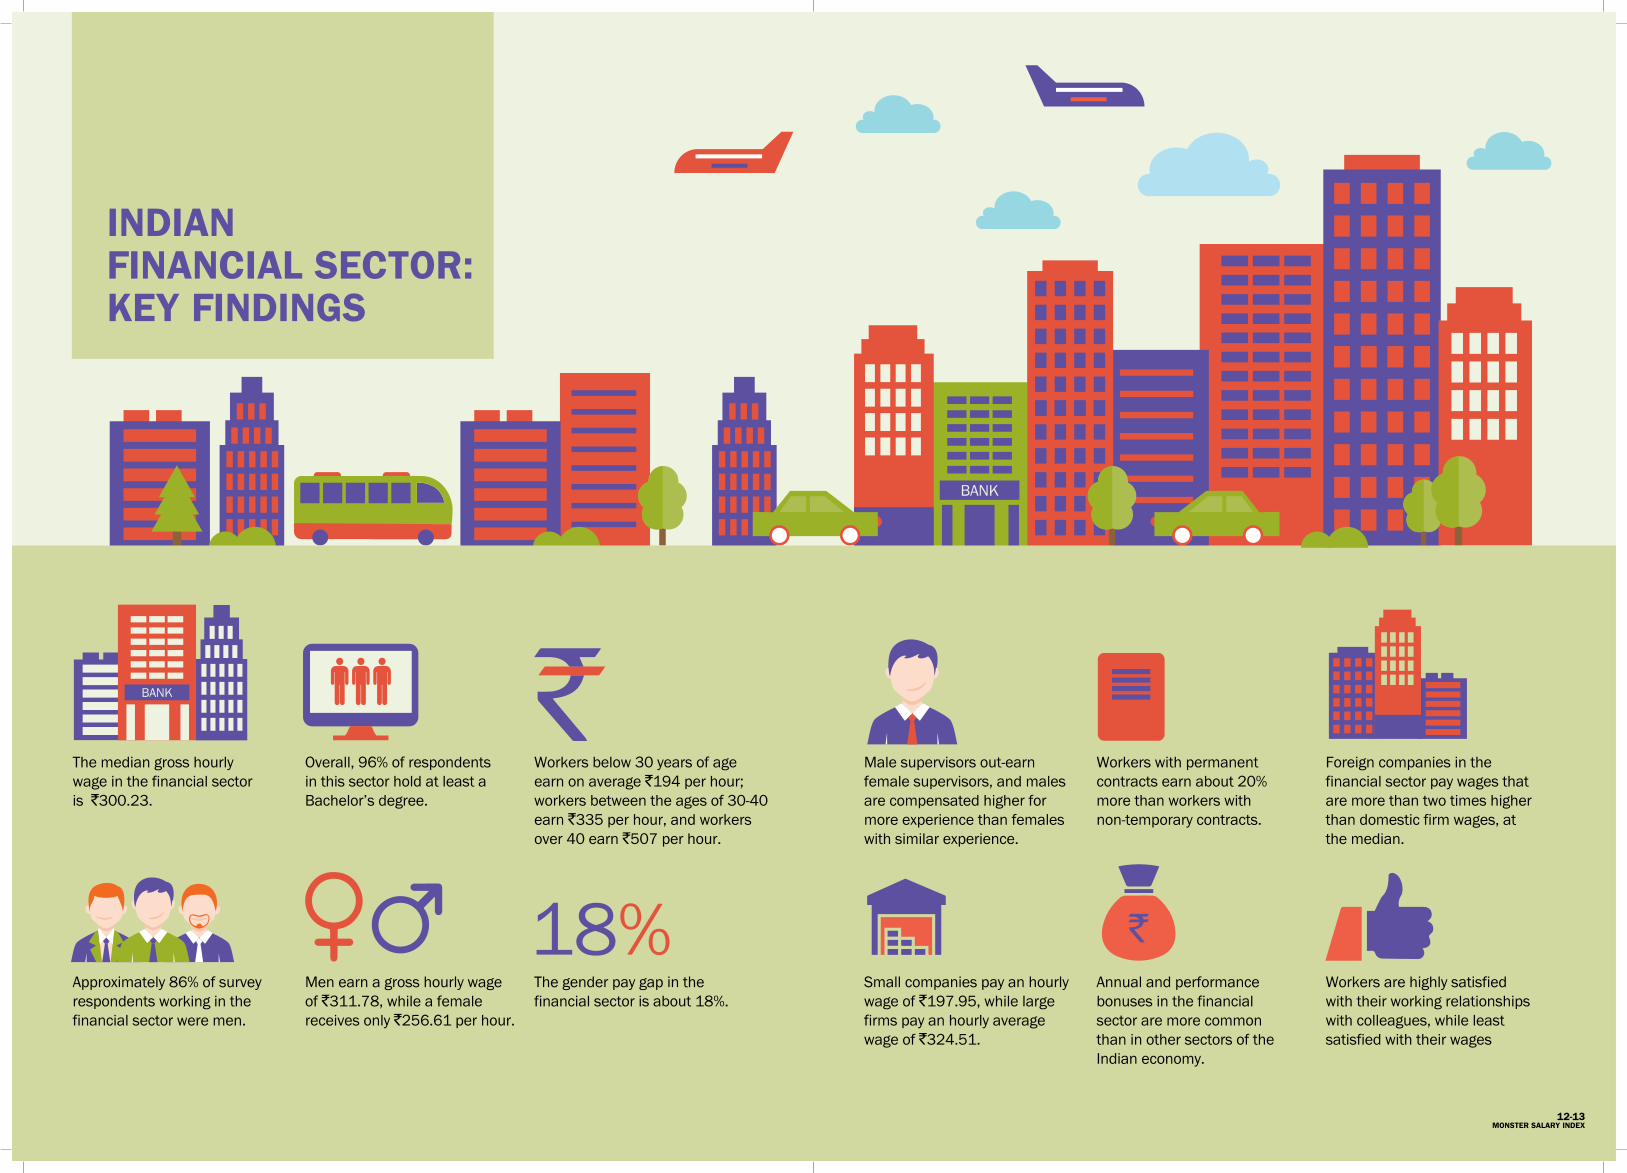
INDIAN FINANCIAL SECTOR: KEY FINDINGS
The median gross hourly wage in the financial sector is `300.23.
Overall, 96% of respondents in this sector hold at least a Bachelor’s degree.
Workers below 30 years of age earn on average `194 per hour; workers between the ages of 30-40 earn `335 per hour, and workers over 40 earn `507 per hour.
Approximately 86% of survey respondents working in the financial sector were men.
Men earn a gross hourly wage of `311.78, while a female receives only `256.61 per hour.
The gender pay gap in the financial sector is about 18%.
Male supervisors out-earn female supervisors, and males are compensated higher for more experience than females with similar experience.
Workers with permanent contracts earn about 20% more than workers with non-temporary contracts.
Foreign companies in the financial sector pay wages that are more than two times higher than domestic firm wages, at the median.
Small companies pay an hourly wage of `197.95, while large firms pay an hourly average wage of `324.51.
Annual and performance bonuses in the financial sector are more common than in other sectors of the Indian economy.
Workers are highly satisfied with their working relationships with colleagues, while least satisfied with their wages
12-13 MONSTER SALARY INDEX

FINANCIAL SECTOR PERFORMANCE OVERVIEW
14-15MONSTER SALARY INDEX

FINANCIAL SECTOR PERFORMANCE OVERVIEW
The financial sector in India is one of the biggest in the world in terms of assets3, with further potential for growth. The services industry in India accounts for 58% of total Gross Domestic Product4 (GDP), with financial services playing a big part. Banks represent the largest institutions (by assets) in this sector followed by other institutions such as pension funds, mutual funds, and insurance companies. This sector also accounts for a significant amount of the nation’s employment, with a promising forecast for future job creation.
Recent changes in financial regulation by India’s government are expected to increase the total number of banking institutions in operation, thus creating job opportunities. The Indian retail market is expected to grow at a rate of 12% per annum in the next five years, rising from to US$ 600 billion in 2015 to US$ 1 trillion by 2020. This growth is driven by income growth, urbanization
and attitudinal shifts. The Indian banking industry alone is expected to create approximately two million jobs throughout the next five to ten years, making this one of the fastest growing sectors in the country.
Additionally, India’s technological advancements have had a beneficial impact on banking. The increase in banking activity via the internet, mobile devices, and automatic transaction machines (ATMs) has allowed expanding services to reach rural areas throughout the country, especially those in eastern and north-eastern parts of India. Still, less than 30% of the Indian population has access to banking services, indicating that the potential of inducing growth in rural areas is enormous.
India’s growing economy, rising personal income, and financial product innovation should increase the demand for financial services, especially for investments and insurance. One of the fastest growing industries in the world belongs to
India’s asset management segment, where mutual funds accumulated a growth rate of almost 17% for the period 2007-2013.
Significant growth is projected for the insurance segment of India’s economy. For 2013, total market size culminated to USD $66 billion, with an estimate of USD $350 billion by 2020. There are currently 52 insurance companies in India, of which 24 are life insurance companies and 28 are non-life insurers. The general insurance business in India is currently at `77,000 crore (US$ 12.41 billion) premium per annum industry and is growing at a healthy rate of 17 percent.
Some of the biggest banks5 in India are SBI and Associate Banks, ICICI Bank, Punjab National Bank and HDFC Bank, Allahabad UP Gramin Bank, Deutsche Bank, Credit Suisse, and HSBC. Large financial firms include SBI Capital Markets, Bajaj Capital, DSP Merrill Lynch, and LIC Finance.
16-17MONSTER SALARY INDEX
3International Monetary Fund (IMF)4CIA World Fact Book5Federal Reserve Bank of India

18-19MONSTER SALARY INDEX
WAGES AND WORKING CONDITIONS IN THE INDIAN FINANCIAL SECTOR

Source: WageIndicator Foundation
WAGES AND WORKING CONDITIONS IN THE INDIAN FINANCIAL SECTOR
The average gross hourly wage in the industry is `300.23.
The financial sector has the second highest median wage paid in India. This relatively high level of remuneration reflects that workers in the field are highly educated – nearly all of them reported having 16-17 years of schooling, which amounts to a college degree.
55% of the sample had Bachelor’s degree and 41% had a Master’s
degree. Overall, 96% of respondents hold at least a Bachelor’s degree. The premium for Master’s degree, in terms of wages was approximately `35 per hour.
Table 3.1 below shows that workers in the financial sector tend to be quite young – about 46% of our respondents are below the age of 30 and about 48% belong to the 30-40 age group; with the remaining 6% being over 40 years of age. When it comes to wages, young workers
below 30 earn on average `194; workers in the 30-40 age category earn `335, and workers over 40 earn `507.
3.1. AVERAGE EARNINGS OF MEN AND WOMEN IN THE INDIAN FINANCIAL SECTOR PER AGE GROUP
MEDIAN GROSS HOURLY WAGE
₹334.87AGE GROUP 30-39
MEDIAN GROSS HOURLY WAGE
₹506.60AGE GROUP >= 40
MEDIAN GROSS HOURLY WAGE
₹194.37AGE GROUP <30
20-21MONSTER SALARY INDEX
PERCENTAGE OF SAMPLE 46.1%
6.1%
47.7%

IMPACT OF GENDER
Respondents of the survey in the financial sector were predominantly male. Approximately 86% of survey respondents working in the financial sector were men. Male workers in this sector also receive higher wage compensation than their female counterparts. A male in the financial sector receives a gross hourly wage of `311.78, while a female receives only `256.61 per hour. The gender pay gap in the financial sector is roughly about
17.7%. Although western countries have tried to reduce or eliminate the gender pay gap, it is worth noting that no country has been able to close down the gender pay gap completely (Tijdens & Klaveren, 2012), but further effort to indeed eliminate the gap should strongly persist.
The gender inequality can further be explored by looking at the frequency of supervisory positions held by gender. 50% of males responded to holding a supervisory position, while
only 39% of women did so. In relation to wage inequality, male supervisors earned a median gross hourly wage of `392.6, compared to an hourly wage of `354.5 for women. This represents a 10% gap between male and female supervisors, leading to believe that more experienced women often face higher inequality in pay (Duraisamy & Duraisamy, 1998).
6Bergmann’s crowding model (1974).7Becker (1957) had developed a model for race discrimination followed by employers, employees and customers. But the theory behind the model has been used by other economists and Becker himself to explain gender discrimination in employment.8The average age of marriage in India is 18.3(UNICEF, 2001) (though it has been increasing over the years with social and cultural reforms).
IMPACT OF SUPERVISORY POSITION
There are major differences between wages received by supervisors and non-supervisors, as summarized in Table 3.2 below. On average, supervisor positions in the financial sector receive an hourly wage of `384.9, while hourly median wage for non-supervisor roles is `236.1. Breaking down the supervisory role per gender, we see that the hourly wage for male non-supervisors is `241.9, and for female non-supervisors `205.3. Again, male supervisors earn `392.6 per hour while female supervisors earn `354.5 per hour. The gender pay gap is significantly lower for people working in supervisory positions (9.7%) than for people without supervisory positions (15.1%). This means that part of the gender inequality can be explained by the fact that men get promoted to supervisory position more often than women.
The possible explanations for this could be (1) Socio-cultural factors: In Indian society, some male workers may become disgruntled when obligated to work with or take orders from women. And therefore, in the interest of productivity and profits, employers may decide to segregate men and women employees on the job, (2) Employer’s perspective: Many employers have preconceived notions about the job capabilities of women and (3) Marital Status: a promotion or a supervisory role is offered to an employee only after certain years of experience on the job. In India, the average age of marriage for women in 19 years.
Employers feel that with marriage comes an additional responsibility for women, and hence they may not be able to devote the same amount of time to work (Varkkey, Korde, & Anand, 2012). Thus, it is often seen
that women are not preferred for promotion to higher designations in the occupational hierarchy. This may result in most women crowding at the lower end of the occupational hierarchy.
3.2. AVERAGE EARNINGS FOR MEN AND WOMEN IN THE FINANCIAL INDUSTRY, FOR THE WHOLE SECTOR AND BROKEN DOWN PER GENDER HAS A SUPERVISORY POSITION• NO •YES • %AGE & MEDIAN GROSS HOURLY WAGE
50%`241.92PER HOUR
50%`392.61PER HOUR
52%`236.08PER HOUR
48%`384.91PER HOUR
61%`205.29PER HOUR
39%`354.47PER HOUR
Source: WageIndicator Foundation
86% AGE
`311.78MEDIAN GROSS HOURLY WAGE
100% AGE
`300.23MEDIAN GROSS HOURLY WAGE
14% AGE
`256.61MEDIAN GROSS HOURLY WAGE
22-23MONSTER SALARY INDEX
WAGES AND WORKING CONDITIONS IN THE INDIAN FINANCIAL SECTOR

IMPACT OF TENURE
Tenure is another important factor that is positively associated with wages, as shown in Table 3.3 below. The more experienced workers are paid better than those with less experience. While the average worker with less than 3 years of experience earns `144.34 per hour, the average worker with more than 10 years of experience gets `519.63 per hour.
Taking socio-cultural factors into consideration, such as family obligations and late entry into the workforce, women in India are less likely to have accumulated as much tenure as men. However, disparities between women and men in the financial sector are narrower than in other areas of India’s economy. Roughly 14% of men have less than 3 years of experience, indicating either high career progression or career transition in the sector. Women with 0-2 years of experience account for 21% of the respective group. In the category of workers with 3 to 5 years of experience, women make up 33% of the group, while 28% of men do. Meanwhile, 17% of male workers and 12% of female workers have more than 10 years of experience. The female workers in the sample tend to be less experienced than male workers. However, the gender pay gap is much higher for inexperienced workers than for worker with relevant experience. The gender pay gap is 17% for workers with less than 3 years of experience, 8% with workers between 3-5 years of experience, 8% for workers with 6-10 years of experience, and 9% for workers with 11+ years of experience. This narrow, but persistent, gender pay gap reflects the higher likelihood for promotion to supervisory position for men.
The possible explanations for this could be, (1) women in India have to balance multiple roles and this often results in multiple career breaks (could be because of marriage and relocation, child bearing, child rearing, etc). With more number of career breaks in their job history, the bargaining capacity of women in the labour market declines. Hence, men in the same bracket earn a higher
salary compared to women (Goldberg & Hill, 2007) and (2) re-entry to the job market is difficult for women as compared to men and often women are paid less when they decide to enter the labour market again (Education International, 2011).
TENURE (YEARS)
0 1 2 3 4 5 6 7 8 9 10 11 12 13 14 15 16 17 18 19 20
Source: WageIndicator Foundation
TENURE VS. HOURLY GROSSFIGURE 1: GRAPHICAL ILLUSTRATION OF THE RELATIONSHIP BETWEEN TENURE AND WAGE
Source: WageIndicator Foundation
28%`216.51
PER HOUR
17%`529.25
PER HOUR
14%`145.24
PER HOUR
41%`366.23
PER HOUR
28%`213.63
PER HOUR
16%`519.63
PER HOUR
33%`200.15
PER HOUR
12%`482.42
PER HOUR
15%`144.34
PER HOUR
40%`360.85
PER HOUR
21%`120.28
PER HOUR
34%`336.80
PER HOUR
3.3. AVERAGE EARNINGS OF MEN AND WOMEN DEPENDING ON THE LENGTH OF TENURE TENURE GROUPS (YEARS OF SERVICE)• 0-2 •3-5 • 6-10 •11+
1200
800
400
1000
600
200
0
MEDIAN GROSS HOURLY WAGE (`)
24-25MONSTER SALARY INDEX
WAGES AND WORKING CONDITIONS IN THE INDIAN FINANCIAL SECTOR

IMPACT OF CONTRACT TYPE
Table 3.4 provides figures for the type of contracts issued in the financial sector, per gender. Overall, workers with permanent contracts earn about 20% more than workers with non-temporary contracts. The table suggests a slight dual labor market
exists for men and women in the financial sector. This can be seen when we look at the data concerning the working arrangements. 72% of men, but only 66% of women have full time contracts. Both male and female workers with permanent contracts get paid better than those employed for temporary periods. Males with temporary contracts earn 18% more than female workers with similar
contracts. The wage premium for men is also visible in the segment of workers with permanent contracts, where men earning 16% more than women. Women in the sector often prefer or are compelled to take up part-time jobs because it is expected that they fulfill primary responsibility of taking care of household activities and children (Goldberg & Hill, 2007).
Source: WageIndicator Foundation
Source: WageIndicator Foundation
IMPACT OF OWNERSHIP
There are three basic types of company ownership structures in India’s financial sector: wholly domestic owned, partially domestic, and partially foreign owned and
IMPACT OF COMPANY SIZE
Figure 2 below illustrates the relationship between firm size and hourly median wages. First, large companies in the financial sector tend to hire more workers. In India,
wholly foreign owned. Generally the more foreign capital there is in the company, the higher the wages. Foreign companies comprise of 29% of the sample, and pay wages that are more than double than domestic firm wages, at the median.
about 78% of the workforce in the respective sector works in large to mid-sized companies (those with over 200 employees). Similarly, 53% of the sample reported to work in a company with more than 5,000 employees.
While in small companies (with up to 10 employees), the average reported hourly wage was `197.95; workers in companies with more than 5,000 employees received an average wage of `324.51.
MEDIAN GROSS HOURLY WAGE
₹329.10PARTLY DOMESTIC OWNED, PARTLY FOREIGN OWNED
MEDIAN GROSS HOURLY WAGE
₹451.63WHOLLY FOREIGN
OWNED
MEDIAN GROSS HOURLY WAGE
₹197.31WHOLLY DOMESTIC
OWNED3.4. TYPE OF CONTRACTS IN THE FINANCIAL SECTORHAS PERMANENT EMPLOYMENT CONTRACT• NO •YES
3.5. OWNERSHIP STRUCTURE OF THE COMPANY AND WAGES
FIRM SIZE VS. HOURLY GROSSFIGURE 2: GRAPHICAL ILLUSTRATION OF THE RELATIONSHIP BETWEEN SIZE OF COMPANY AND WAGE
350
300
400
250
200
150
100
50
0
1-10 10-50 50-200 200-1000 1000-5000
MEDIAN GROSS HOURLY WAGE (`)
FIRM SIZE (NUMBER OF EMPLOYEES)
5000+
72%`323.33
PER HOUR
28%`282.27
PER HOUR
71%`317.55
PER HOUR
66%`272.00
PER HOUR
29%`265.59
PER HOUR
34%`230.95
PER HOUR
50.9%
28.8%
20.3%
PERCENTAGE OF SAMPLE
26-27MONSTER SALARY INDEX
WAGES AND WORKING CONDITIONS IN THE INDIAN FINANCIAL SECTOR

OVERTIME WORK
Only 15% of surveyed financial sector workers reported receiving extra money for work during night shifts or during
weekends. This is generally in the form of a lump sum payment/allowance. This type of compensation amounted to a monthly median payment `2250. Only 9% of workers received
compensation for working overtime, with the median monthly payment valued at `1750.
Source: WageIndicator Foundation
BONUS STRUCTURE
Workers in the financial sector reported to have received three types of bonuses: annual bonus, profit share and performance bonus. Performance
bonus was the most common, received by 31.6% of workers, 25.6% of financial sector workers received an annual bonus, but only 3.5% of workers benefited from profit sharing. When compared to India’s national average,
more workers in the financial sector enjoy the privilege of receiving the annual and performance bonuses. However the profit share is less common in the financial sector than in India as a whole.
3.6. ALLOWANCES AND OVERTIME PAYMENTS 3.7. BONUS STRUCTURE• PERCENTAGE OF SAMPLE • INDIAN AVERAGE
ANNUAL BONUS
22.7%
25.6%
PROFIT SHARE
3.5% 5.1%
PERFORMANCE BONUS
31.6%26.0%
Source: WageIndicator Foundation
14.7%PERCENTAGE OF SAMPLE
9.1%PERCENTAGE OF SAMPLE
`2,250MONTHLY MEDIAN BENEFIT RECEIVED
`1,750MONTHLY MEDIAN BENEFIT RECEIVED
NIGHT SHIFTS/ WEEKEND ALLOWANCE
OVERTIME PAYMENT
SPECIAL WORK HOURS
SPECIAL WORK HOURS
WAGES AND WORKING CONDITIONS IN THE INDIAN FINANCIAL SECTOR
28-29MONSTER SALARY INDEX

SATISFACTION
Workers in the financial sector were mostly satisfied with the relations with their colleagues (83%), their relationships with their superiors (77%) and their working hours (75%).
On the other hand, only around 52% of respondents were satisfied with their wage. Overall, 60% of workers reported to be satisfied with their life as a whole. The Indian average of satisfaction with job and other related work factors range between 40% -
50%, according to Varkkey & Korde (2013). This implies that workers in the financial sector enjoy higher satisfaction levels when compared to the Indian average.
Source: WageIndicator Foundation
3.8. SATISFACTION OF WORKERS• SATISFACTION WITH • SATISFACTION LEVEL FOR SECTOR
30-31MONSTER SALARY INDEX
JOB WORK ENVIRONMENT72.7% 69.6%
PAY WORKING HOURS52.2% 74.6%
COMMUTING TIME RELATIONSHIP TO COLLEAGUES71.2%
71.2%
82.8%
WORK-LIFE BALANCE RELATIONSHIP TO SUPERIORS70.7% 77.4%
JOB SECURITY LIFE AS-A-WHOLE60.3%
WAGES AND WORKING CONDITIONS IN THE INDIAN FINANCIAL SECTOR

APPENDIX ABOUT THE DATASET AND DEFINITIONS
GENDER PAY GAP
Gender pay gap is computed according to the formula:
1A median is the numeric value separating the upper half of a sample from its lower half. For example, by definition of median wage 50% of the sample earn more and 50% less than median wage. 2These are respondents reporting wages significantly lower or higher than usual.
The analysis presented in this report is based on the WageIndicator dataset covering the period of January 2013 - May 2015. The wage analysis is based on data collected from Paycheck India’s (www.paycheck.in) Salary Calculator and Monster Salary Index from the aforementioned period. The sample used for the analysis consists of 6,726 observations.
GROSS HOURLY WAGE AND BONUSES
Gross hourly wage, for our purposes, is computed based on the hourly
wage calculated on the ground of wage and working hours reported by respondents. We report median1 of gross hourly wage. The calculations are based on dataset cleared from outliers2.
PURCHASING POWER PARITY (PPP)
Is based on differences in prices of goods and services in different country. Using the PPP index we can calculate an “international dollar” that has the same purchasing power as the US dollars have in the USA.
The implied conversion rate used for India is 1:17.6, valid by April 2013 (WEO Database, 2015). For calculation of annual wage, we assume a total of 2000 working hours per year.
PAY GAP 100%
MEDIAN WAGE MALE
MEDIAN WAGE FEMALE
MEDIAN WAGE MALE
32-33MONSTER SALARY INDEX

BIBLIOGRAPHY
Becker, Gary S. 1957. The Economics of Discrimination. Chicago: University of Chicago Press.
Blau and Kahn (2000), ‘Gender Differences in Pay, Working paper’. NBER Working paper 7732, accessed at http://www.nber.org/papers/w7732.pdf?new_window=1
Duraisamy, P., &Duraisamy, M. (1998).Accounting for Wage differentials in an Organized Labour Market in India. The Indian Journal of Labour Economics, 41(4), 934-944.
Education International. (2011, March 3). The Gender Pay Gap - Reasons and Implications. Pay Equity Now. Brussels, Belgium: http://download.ei-ie.org/Docs/WebDepot/feature2 - 100303 - reasons and implications - final EN.pdf.
Goldberg, J. D., & Hill, C. A. (2007). Behind the Pay Gap. Washington, DC: AAUW Educational Foundation.
Tijdens, K. G., & Klaveren, M. V. (2012). Frozen in Time: Gender Pay Gap Unchanged for 10 Years. Brussels: ITUC.
UNICEF. (2001). Age at Marriage - India. Retrieved September 25, 2013, from UNICEF: http://www.unicef.org/india/Media_AGE_AT_MARRIAGE_in.pdf
Varkkey, B., & Korde, R. (2012, June). Minimum WAge Comparison: Asian Countries, Official Representation of Minimum Wages.Wageindicator Publications. Retrieved Dec 20, 2012, from http://www.wageindicator.org/documents/publicationslist/publications-2012/120627Minimum%20Wage%20Comparison_Asian%20Countries_Representation.pdf
Varkkey, B., & Korde, R. (2013, September). Gender Pay Gap in the Formal Sector: 2006 - 13, Preliminary Evidences from Paycheck India Data.Wageindicator Publications. Retrieved March 20, 2014, from http://www.wageindicator.org/documents/publicationslist/publications-2013/gender-pay-gap-in-formal-sector-in-india-2006-2013
Varkkey, B., & Korde, R. (2013, December). Exploring Job Satisfaction in India using Paycheck India Survey Data. Retrieved April 12, 2014, from Wageindicator.org: http://www.wageindicator.org/documents/publicationslist/publications-2013/job-satisfaction-in-india-2013
Varkkey, B., Korde, R., & Anand, L. (2012, October 27).Gender Pay Gap in the Formal Sector: Preliminary Evidence from Paycheck India Data. Retrieved December 7, 2012, from Wageindicator.org: http://www.wageindicator.org/documents/publicationslist/publications-2012/Gender%20Pay%20Gap%20FINAL%20REPORT.pdf
WageIndicator. (2015). World Map Gender Pay Gap. Amsterdam: WageIndicator.Org.
WEO Database. (2015). World Economic Outlook Database. Retrieved 2015, from International Monetary Fund: http://www.imf.org/external/pubs/ft/weo/2015/01/weodata/index.aspx
34-35MONSTER SALARY INDEX