Salary Budget Planning Report - Willis Towers Watson · Salary Budget Planning Report ... •Access...
34
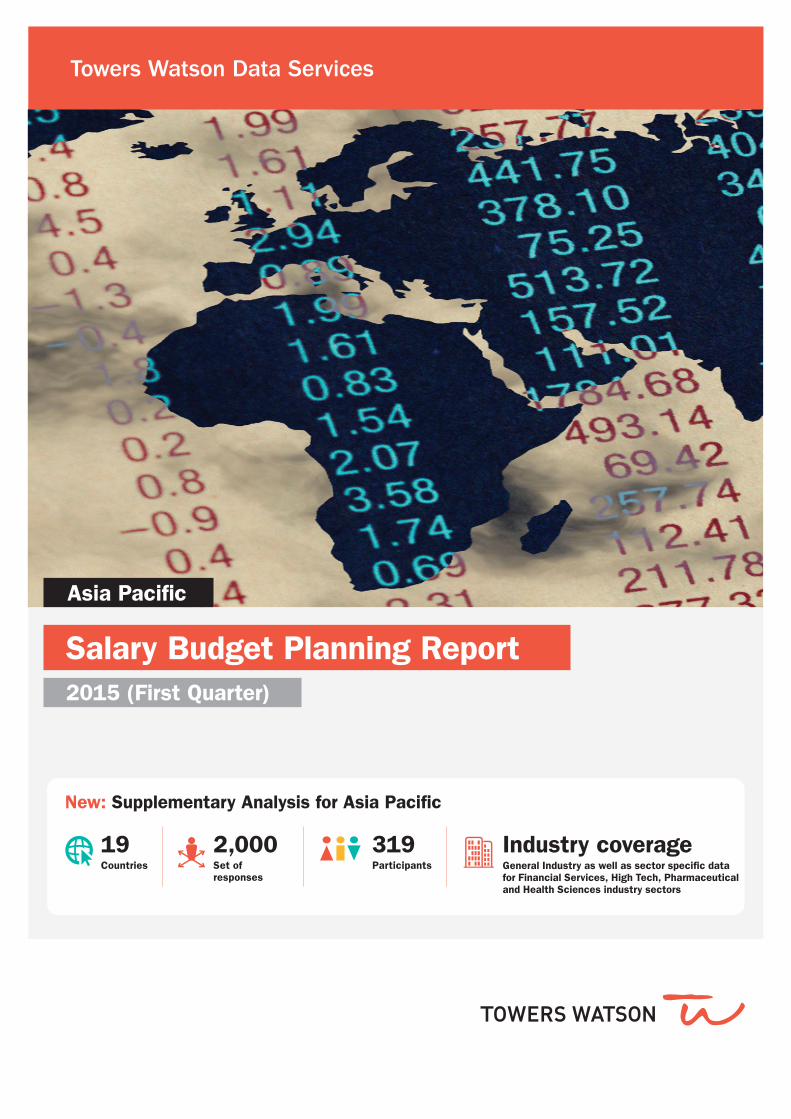
Towers Watson Data Services Asia Pacific 2015 (First Quarter) Salary Budget Planning Report New: Supplementary Analysis for Asia Pacific 19 Countries Industry coverage General Industry as well as sector specific data for Financial Services, High Tech, Pharmaceutical and Health Sciences industry sectors 319 Participants 2,000 Set of responses
Transcript of Salary Budget Planning Report - Willis Towers Watson · Salary Budget Planning Report ... •Access...
Towers Watson Data Services
Asia Pacific
2015 (First Quarter)
Salary Budget Planning Report
New: Supplementary Analysis for Asia Pacific
19Countries
Industry coverageGeneral Industry as well as sector specific data for Financial Services, High Tech, Pharmaceutical and Health Sciences industry sectors
319Participants
2,000Set of responses
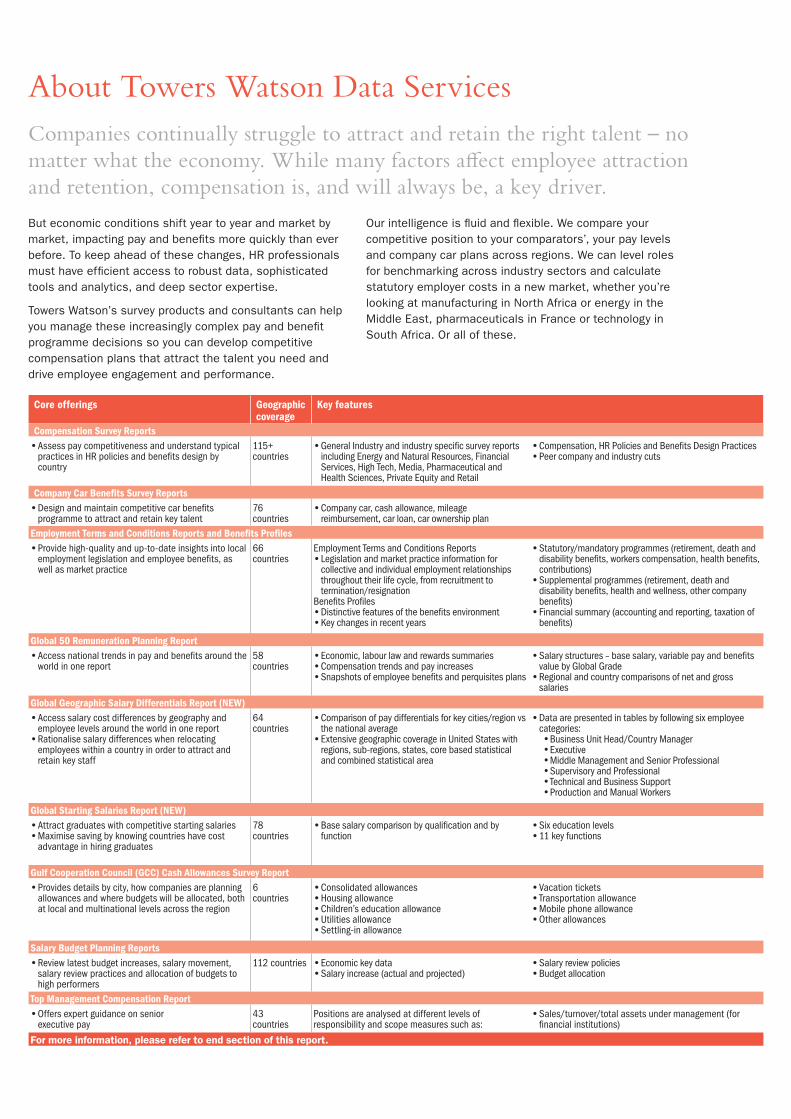
Core offerings Geographic coverage
Key features
Compensation Survey Reports •Assess pay competitiveness and understand typical practices in HR policies and benefits design by country
115+ countries
•General Industry and industry specific survey reports including Energy and Natural Resources, Financial Services, High Tech, Media, Pharmaceutical and Health Sciences, Private Equity and Retail
•Compensation, HR Policies and Benefits Design Practices •Peer company and industry cuts
Company Car Benefits Survey Reports •Design and maintain competitive car benefits programme to attract and retain key talent
76 countries
•Company car, cash allowance, mileage reimbursement, car loan, car ownership plan
Employment Terms and Conditions Reports and Benefits Profiles •Provide high-quality and up-to-date insights into local employment legislation and employee benefits, as well as market practice
66 countries
Employment Terms and Conditions Reports •Legislation and market practice information for collective and individual employment relationships throughout their life cycle, from recruitment to termination/resignation
Benefits Profiles •Distinctive features of the benefits environment •Key changes in recent years
•Statutory/mandatory programmes (retirement, death and disability benefits, workers compensation, health benefits, contributions) •Supplemental programmes (retirement, death and disability benefits, health and wellness, other company benefits) •Financial summary (accounting and reporting, taxation of benefits)
Global 50 Remuneration Planning Report •Access national trends in pay and benefits around the world in one report
58 countries
•Economic, labour law and rewards summaries •Compensation trends and pay increases •Snapshots of employee benefits and perquisites plans
•Salary structures – base salary, variable pay and benefits value by Global Grade •Regional and country comparisons of net and gross salaries
Global Geographic Salary Differentials Report (NEW) •Access salary cost differences by geography and employee levels around the world in one report •Rationalise salary differences when relocating employees within a country in order to attract and retain key staff
64 countries
•Comparison of pay differentials for key cities/region vs the national average •Extensive geographic coverage in United States with regions, sub-regions, states, core based statistical and combined statistical area
•Data are presented in tables by following six employee categories: Business Unit Head/Country Manager Executive Middle Management and Senior Professional Supervisory and Professional Technical and Business Support Production and Manual Workers
Global Starting Salaries Report (NEW) •Attract graduates with competitive starting salaries •Maximise saving by knowing countries have cost advantage in hiring graduates
78 countries
•Base salary comparison by qualification and by function
•Six education levels •11 key functions
Gulf Cooperation Council (GCC) Cash Allowances Survey Report •Provides details by city, how companies are planning allowances and where budgets will be allocated, both at local and multinational levels across the region
6 countries
•Consolidated allowances •Housing allowance •Children’s education allowance •Utilities allowance •Settling-in allowance
•Vacation tickets •Transportation allowance •Mobile phone allowance •Other allowances
Salary Budget Planning Reports •Review latest budget increases, salary movement, salary review practices and allocation of budgets to high performers
112 countries •Economic key data •Salary increase (actual and projected)
•Salary review policies •Budget allocation
Top Management Compensation Report •Offers expert guidance on senior executive pay
43 countries
Positions are analysed at different levels of responsibility and scope measures such as:
•Sales/turnover/total assets under management (for financial institutions)
For more information, please refer to end section of this report.
About Towers Watson Data ServicesCompanies continually struggle to attract and retain the right talent – no matter what the economy. While many factors affect employee attraction and retention, compensation is, and will always be, a key driver.
But economic conditions shift year to year and market by market, impacting pay and benefits more quickly than ever before. To keep ahead of these changes, HR professionals must have efficient access to robust data, sophisticated tools and analytics, and deep sector expertise.
Towers Watson’s survey products and consultants can help you manage these increasingly complex pay and benefit programme decisions so you can develop competitive compensation plans that attract the talent you need and drive employee engagement and performance.
Our intelligence is fluid and flexible. We compare your competitive position to your comparators’, your pay levels and company car plans across regions. We can level roles for benchmarking across industry sectors and calculate statutory employer costs in a new market, whether you’re looking at manufacturing in North Africa or energy in the Middle East, pharmaceuticals in France or technology in South Africa. Or all of these.
Table of content
2015 Salary Budget Planning Report – Asia Pacific (First Quarter)
Section I
Overview 3
2014-2015 Salary increases in comparison with key economic indicators 4
2014-2015 Salary increases by employee group 5
2014-2015 Salary increases by employee group – By industry 6
2016 Salary budget increases by employee group 8
Salary review status 10
Salary budget increase – allocation to high performers 12
Section II
Supplemental report for Asia Pacific 15
Salary increases related to performance ratings 16
Short-Term incentives/bonus granted as % of base pay 17
Staff turnover 18
Recruitment and Hot Jobs 19
Human Capital Costs 20
Business Outlook 21
Participants List 22
About Tower Watson Data Services 25-30
Contact Us
2015 Salary Budget Planning Report – Asia Pacific (First Quarter) I 1
SECTION I
2015 SALARY BUDGET PLANNING REPORT – ASIA PACIFIC (First Quarter)

2015 Salary Budget Planning Report – Asia Pacific (First Quarter) I 2
2015 SALARY BUDGET PLANNING REPORT – ASIA PACIFIC (First Quarter)
GENERAL INDUSTRIES SALARY MOVEMENT This report summarises the findings of Towers Watson’s bi-annual survey on salary movement and review practices as a means of helping companies with their compensation planning for 2015. The survey was conducted on-line in February 2015 amongst companies participating in Towers Watson’s compensation surveys. We received approximately 2,000 sets of responses covering 19 countries across the APAC (Asia Pacific) region. The main sections of this report include actual and projected data for 2014, 2015 and 2016 respectively. Details include: • Graphic overview of results • Salary movement in comparison with key economic indicators • Salary movement by employee group • Salary review status • Allocation of salary budget increase to high performers • List of participants Notes: The salary movement figures provide median salary increases awarded or anticipated overall and for each employee group as a percentage of base salary. They include merit and statutory increases, promotions and cost of living adjustments.
The employee groups are generally defined as: Executive Directors - The most senior executive position in the organisation coordinating the full range of functions. Provides leadership and has overall direction and control of the company’s operations/divisions. Responsible for long-range planning and establishment of basic policy. This position excludes the Chairman with no executive responsibility in the organisation. Senior Management - Is defined as those executives who report directly to the General Management with full responsibility for major departments or functions. They actively participate in developing company policy and closely advise the General Management on strategy. Middle Management - Is defined as those employees who may report directly to the General Management but are not regarded as the top level of management, or alternatively report directly or indirectly to department heads or heads of function. Professionals - Professional employees are personnel who through a specific qualification or a level of skill/competence in a particular discipline are considered as experts in their field e.g. Accountants, Legal Advisors, Key Account Managers, Product Marketing Specialists, Business/Technical Consultants, HR Professionals. Technical/Business Support - Are defined as white collar personnel employed directly by an organisation, either in an office environment or in the field. Managerial levels should not be included here. Production/Operations - Are defined as blue-collar personnel, operators or technicians employed in a plant/factory, as well as basic clerical support roles in an office environment, kitchen staff, security personnel, drivers etc. For this category of personnel, job descriptions often differentiate between highly skilled, skilled, semi-skilled and unskilled personnel.
2015 Salary Budget Planning Report – Asia Pacific (First Quarter) I 3
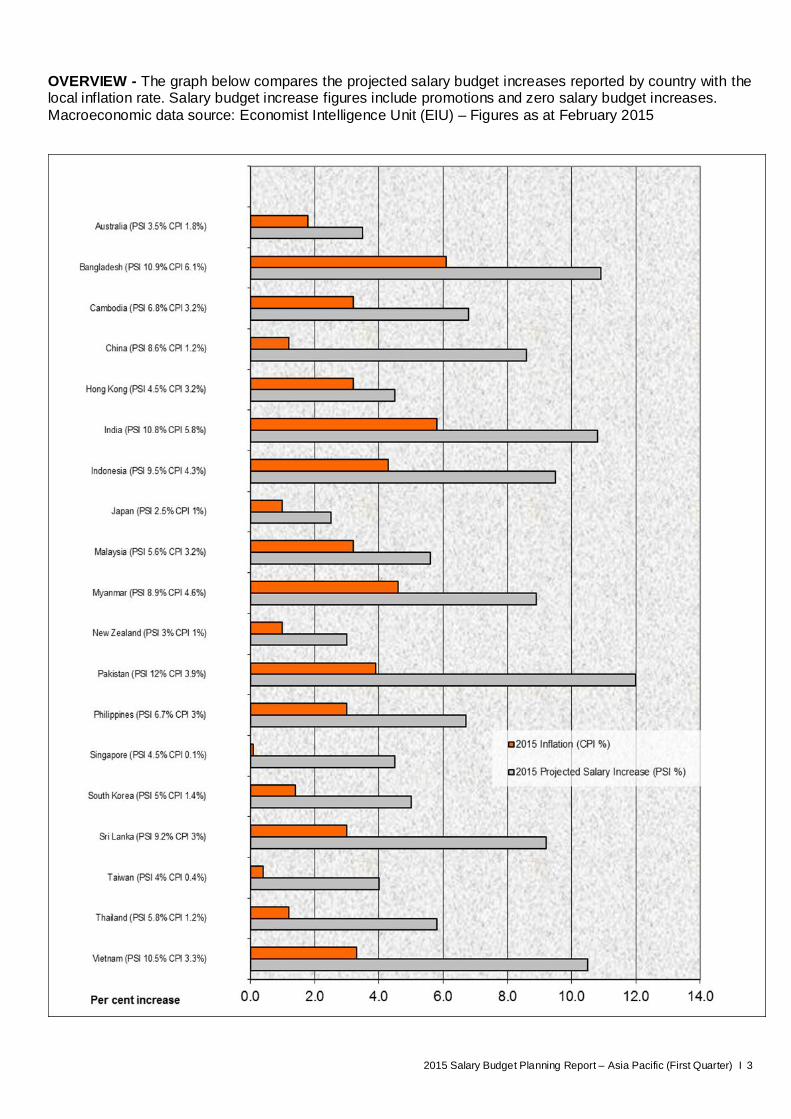
OVERVIEW - The graph below compares the projected salary budget increases reported by country with the local inflation rate. Salary budget increase figures include promotions and zero salary budget increases. Macroeconomic data source: Economist Intelligence Unit (EIU) – Figures as at February 2015
2015 Salary Budget Planning Report – Asia Pacific (First Quarter) I 4
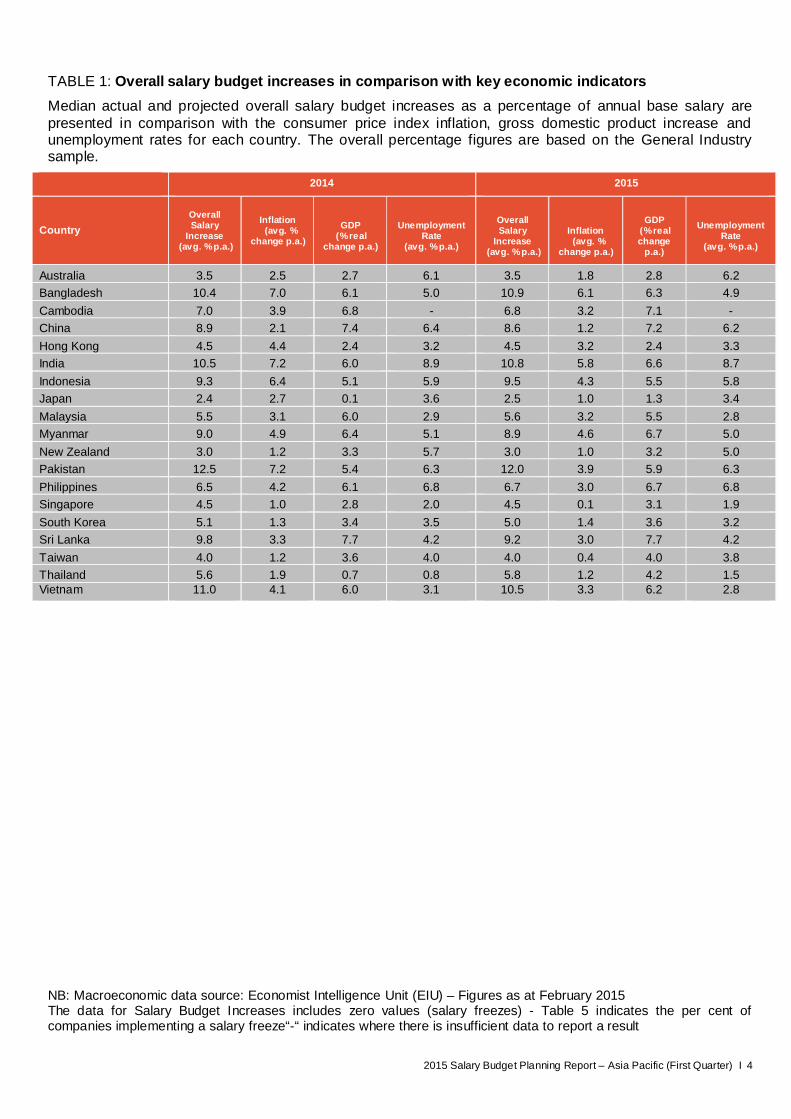
TABLE 1: Overall salary budget increases in comparison with key economic indicators Median actual and projected overall salary budget increases as a percentage of annual base salary are presented in comparison with the consumer price index inflation, gross domestic product increase and unemployment rates for each country. The overall percentage figures are based on the General Industry sample.
2014 2015
Country Overall Salary
Increase (avg. % p.a.)
Inflation (avg. %
change p.a.)
GDP
(% real change p.a.)
Unemployment
Rate (avg. % p.a.)
Overall Salary
Increase (avg. % p.a.)
Inflation (avg. %
change p.a.)
GDP
(% real change
p.a.)
Unemployment
Rate (avg. % p.a.)
Australia 3.5 2.5 2.7 6.1 3.5 1.8 2.8 6.2 Bangladesh 10.4 7.0 6.1 5.0 10.9 6.1 6.3 4.9 Cambodia 7.0 3.9 6.8 - 6.8 3.2 7.1 - China 8.9 2.1 7.4 6.4 8.6 1.2 7.2 6.2 Hong Kong 4.5 4.4 2.4 3.2 4.5 3.2 2.4 3.3 India 10.5 7.2 6.0 8.9 10.8 5.8 6.6 8.7 Indonesia 9.3 6.4 5.1 5.9 9.5 4.3 5.5 5.8 Japan 2.4 2.7 0.1 3.6 2.5 1.0 1.3 3.4 Malaysia 5.5 3.1 6.0 2.9 5.6 3.2 5.5 2.8 Myanmar 9.0 4.9 6.4 5.1 8.9 4.6 6.7 5.0 New Zealand 3.0 1.2 3.3 5.7 3.0 1.0 3.2 5.0 Pakistan 12.5 7.2 5.4 6.3 12.0 3.9 5.9 6.3 Philippines 6.5 4.2 6.1 6.8 6.7 3.0 6.7 6.8 Singapore 4.5 1.0 2.8 2.0 4.5 0.1 3.1 1.9 South Korea 5.1 1.3 3.4 3.5 5.0 1.4 3.6 3.2 Sri Lanka 9.8 3.3 7.7 4.2 9.2 3.0 7.7 4.2 Taiwan 4.0 1.2 3.6 4.0 4.0 0.4 4.0 3.8 Thailand 5.6 1.9 0.7 0.8 5.8 1.2 4.2 1.5 Vietnam 11.0 4.1 6.0 3.1 10.5 3.3 6.2 2.8
NB: Macroeconomic data source: Economist Intelligence Unit (EIU) – Figures as at February 2015 The data for Salary Budget Increases includes zero values (salary freezes) - Table 5 indicates the per cent of companies implementing a salary freeze“-“ indicates where there is insufficient data to report a result

2015 Salary Budget Planning Report – Asia Pacific (First Quarter) I 5
TABLE 2: Salary budget increases by employee group – excluding zero salary budget increases
This table reports the median salary budget increase by employee group. Note: not all companies providing an overall salary increase also provided data broken down by employee group. This resulted in a different sample and sometimes higher or lower statistics. This information is reported by General Industry only.
2014 Actual Salary Increase Budget (%) 2015 Projected Salary Increase Budget (%)
Sector Country
Ove
rall
Exe
cutiv
e D
irect
ors
Seni
or M
anag
emen
t
Mid
dle
Man
agem
ent
Pro
fess
iona
ls
Tech
nica
l Bus
ines
s
Pro
duct
ion
Ove
rall
Exe
cutiv
e D
irect
ors
Seni
or M
anag
emen
t
Mid
dle
Man
agem
ent
Pro
fess
iona
ls
Tech
nica
l Bus
ines
s
Pro
duct
ion
ALL INDUSTRY Australia 3.5 3.6 3.5 3.5 3.5 3.5 3.5 3.5 3.5 3.5 3.5 3.5 3.5 3.5 Bangladesh 10.6 10.8 10.7 10.8 10.6 10.6 10.7 11.1 11.2 11.0 11.0 11.1 11.0 11.0 Cambodia 7.0 6.9 7.0 7.0 7.0 7.0 6.9 6.8 6.8 6.8 6.8 6.8 6.8 6.8 China 8.9 8.3 9.0 9.0 9.4 9.6 9.5 8.6 8.6 8.6 8.6 8.6 8.6 8.6 Hong Kong 4.5 4.8 4.5 4.5 4.5 4.5 4.5 4.5 4.6 4.6 4.5 4.5 4.5 4.5 India 10.6 10.5 10.5 10.6 10.6 10.5 10.6 10.8 10.8 10.8 10.8 10.8 10.8 10.8 Indonesia 9.3 9.5 9.5 9.5 9.3 9.5 9.5 9.5 9.5 9.5 9.5 9.5 9.5 9.5 Japan 2.4 2.4 2.4 2.4 2.4 2.4 2.4 2.5 2.5 2.5 2.5 2.5 2.5 2.5 Malaysia 5.5 5.5 5.5 5.5 5.5 5.5 5.5 5.7 5.7 5.7 5.7 5.7 5.7 5.7 Myanmar 9.0 9.0 9.0 9.0 9.0 9.0 8.5 8.9 8.9 8.9 8.9 8.9 8.9 8.5 New Zealand 3.0 3.0 3.0 3.0 3.0 3.0 3.0 3.0 3.0 3.0 3.0 3.0 3.0 3.0 Pakistan 12.7 12.8 12.8 12.7 12.6 12.6 12.8 12.0 12.0 12.0 12.0 12.0 12.0 12.0 Philippines 6.5 6.5 6.5 6.5 6.5 6.5 6.5 6.8 6.8 6.8 6.8 6.6 6.8 6.5 Singapore 4.5 4.5 4.5 4.5 4.5 4.5 4.5 4.5 4.5 4.5 4.5 4.5 4.5 4.5 South Korea 5.1 5.1 5.1 5.1 5.1 5.1 5.1 5.0 5.0 5.0 5.0 5.0 5.0 5.0 Sri Lanka 9.8 10.0 10.0 9.5 10.0 9.5 10.0 9.5 9.6 9.5 9.5 9.5 9.5 9.6 Taiwan 4.0 4.0 4.0 4.0 4.0 4.0 4.0 4.0 4.0 4.0 4.0 4.0 4.0 4.0 Thailand 5.6 5.7 5.7 5.7 5.7 5.8 5.7 5.9 5.9 5.9 5.9 5.9 5.9 5.8 Vietnam 11.0 11.0 11.0 11.0 11.0 10.8 11.0 10.5 10.6 10.5 10.6 10.5 10.5 10.7
NB: The data for Salary Budget Increases excludes zero values (salary freezes)“-“ indicates where there is insufficient data to report a result
2015 Salary Budget Planning Report – Asia Pacific (First Quarter) I 6
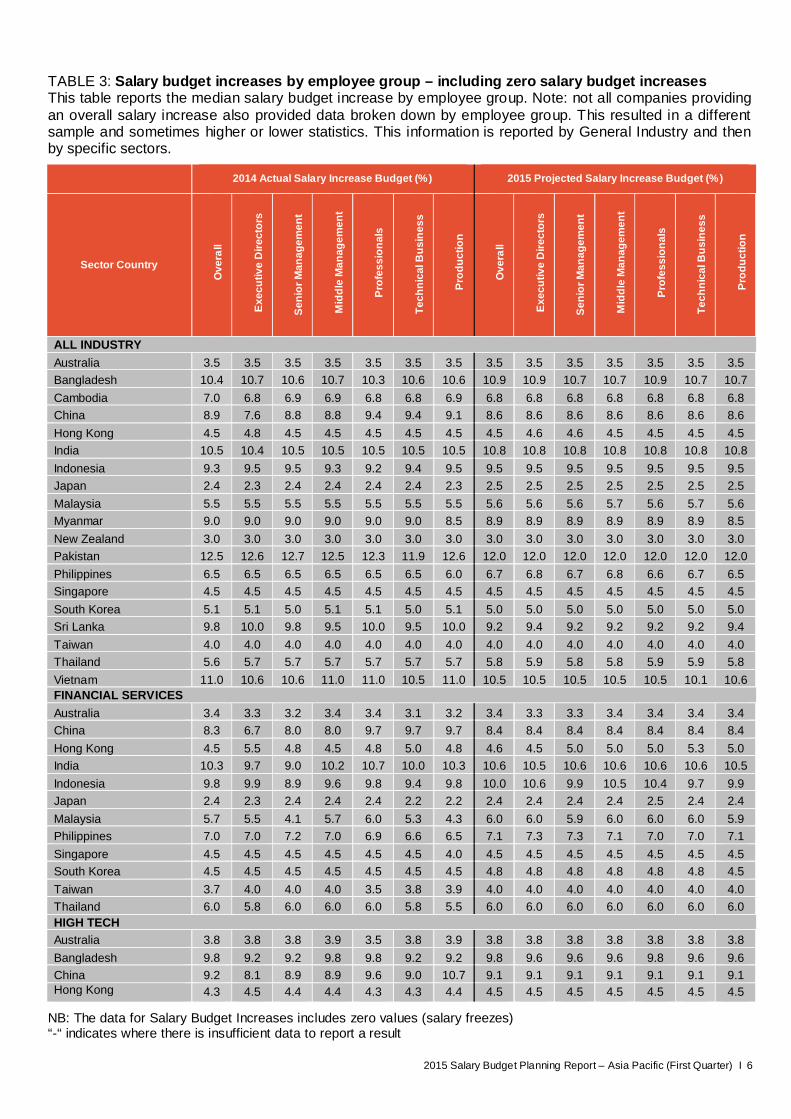
TABLE 3: Salary budget increases by employee group – including zero salary budget increases This table reports the median salary budget increase by employee group. Note: not all companies providing an overall salary increase also provided data broken down by employee group. This resulted in a different sample and sometimes higher or lower statistics. This information is reported by General Industry and then by specific sectors.
2014 Actual Salary Increase Budget (%) 2015 Projected Salary Increase Budget (%)
Sector Country
Ove
rall
Exe
cutiv
e D
irect
ors
Seni
or M
anag
emen
t
Mid
dle
Man
agem
ent
Pro
fess
iona
ls
Tech
nica
l Bus
ines
s
Pro
duct
ion
Ove
rall
Exe
cutiv
e D
irect
ors
Seni
or M
anag
emen
t
Mid
dle
Man
agem
ent
Pro
fess
iona
ls
Tech
nica
l Bus
ines
s
Pro
duct
ion
ALL INDUSTRY Australia 3.5 3.5 3.5 3.5 3.5 3.5 3.5 3.5 3.5 3.5 3.5 3.5 3.5 3.5 Bangladesh 10.4 10.7 10.6 10.7 10.3 10.6 10.6 10.9 10.9 10.7 10.7 10.9 10.7 10.7 Cambodia 7.0 6.8 6.9 6.9 6.8 6.8 6.9 6.8 6.8 6.8 6.8 6.8 6.8 6.8 China 8.9 7.6 8.8 8.8 9.4 9.4 9.1 8.6 8.6 8.6 8.6 8.6 8.6 8.6 Hong Kong 4.5 4.8 4.5 4.5 4.5 4.5 4.5 4.5 4.6 4.6 4.5 4.5 4.5 4.5 India 10.5 10.4 10.5 10.5 10.5 10.5 10.5 10.8 10.8 10.8 10.8 10.8 10.8 10.8 Indonesia 9.3 9.5 9.5 9.3 9.2 9.4 9.5 9.5 9.5 9.5 9.5 9.5 9.5 9.5 Japan 2.4 2.3 2.4 2.4 2.4 2.4 2.3 2.5 2.5 2.5 2.5 2.5 2.5 2.5 Malaysia 5.5 5.5 5.5 5.5 5.5 5.5 5.5 5.6 5.6 5.6 5.7 5.6 5.7 5.6 Myanmar 9.0 9.0 9.0 9.0 9.0 9.0 8.5 8.9 8.9 8.9 8.9 8.9 8.9 8.5 New Zealand 3.0 3.0 3.0 3.0 3.0 3.0 3.0 3.0 3.0 3.0 3.0 3.0 3.0 3.0 Pakistan 12.5 12.6 12.7 12.5 12.3 11.9 12.6 12.0 12.0 12.0 12.0 12.0 12.0 12.0 Philippines 6.5 6.5 6.5 6.5 6.5 6.5 6.0 6.7 6.8 6.7 6.8 6.6 6.7 6.5 Singapore 4.5 4.5 4.5 4.5 4.5 4.5 4.5 4.5 4.5 4.5 4.5 4.5 4.5 4.5 South Korea 5.1 5.1 5.0 5.1 5.1 5.0 5.1 5.0 5.0 5.0 5.0 5.0 5.0 5.0 Sri Lanka 9.8 10.0 9.8 9.5 10.0 9.5 10.0 9.2 9.4 9.2 9.2 9.2 9.2 9.4 Taiwan 4.0 4.0 4.0 4.0 4.0 4.0 4.0 4.0 4.0 4.0 4.0 4.0 4.0 4.0 Thailand 5.6 5.7 5.7 5.7 5.7 5.7 5.7 5.8 5.9 5.8 5.8 5.9 5.9 5.8 Vietnam 11.0 10.6 10.6 11.0 11.0 10.5 11.0 10.5 10.5 10.5 10.5 10.5 10.1 10.6 FINANCIAL SERVICES Australia 3.4 3.3 3.2 3.4 3.4 3.1 3.2 3.4 3.3 3.3 3.4 3.4 3.4 3.4 China 8.3 6.7 8.0 8.0 9.7 9.7 9.7 8.4 8.4 8.4 8.4 8.4 8.4 8.4 Hong Kong 4.5 5.5 4.8 4.5 4.8 5.0 4.8 4.6 4.5 5.0 5.0 5.0 5.3 5.0 India 10.3 9.7 9.0 10.2 10.7 10.0 10.3 10.6 10.5 10.6 10.6 10.6 10.6 10.5 Indonesia 9.8 9.9 8.9 9.6 9.8 9.4 9.8 10.0 10.6 9.9 10.5 10.4 9.7 9.9 Japan 2.4 2.3 2.4 2.4 2.4 2.2 2.2 2.4 2.4 2.4 2.4 2.5 2.4 2.4 Malaysia 5.7 5.5 4.1 5.7 6.0 5.3 4.3 6.0 6.0 5.9 6.0 6.0 6.0 5.9 Philippines 7.0 7.0 7.2 7.0 6.9 6.6 6.5 7.1 7.3 7.3 7.1 7.0 7.0 7.1 Singapore 4.5 4.5 4.5 4.5 4.5 4.5 4.0 4.5 4.5 4.5 4.5 4.5 4.5 4.5 South Korea 4.5 4.5 4.5 4.5 4.5 4.5 4.5 4.8 4.8 4.8 4.8 4.8 4.8 4.5 Taiwan 3.7 4.0 4.0 4.0 3.5 3.8 3.9 4.0 4.0 4.0 4.0 4.0 4.0 4.0 Thailand 6.0 5.8 6.0 6.0 6.0 5.8 5.5 6.0 6.0 6.0 6.0 6.0 6.0 6.0 HIGH TECH Australia 3.8 3.8 3.8 3.9 3.5 3.8 3.9 3.8 3.8 3.8 3.8 3.8 3.8 3.8 Bangladesh 9.8 9.2 9.2 9.8 9.8 9.2 9.2 9.8 9.6 9.6 9.6 9.8 9.6 9.6 China 9.2 8.1 8.9 8.9 9.6 9.0 10.7 9.1 9.1 9.1 9.1 9.1 9.1 9.1 Hong Kong 4.3 4.5 4.4 4.4 4.3 4.3 4.4 4.5 4.5 4.5 4.5 4.5 4.5 4.5
NB: The data for Salary Budget Increases includes zero values (salary freezes) “-“ indicates where there is insufficient data to report a result
2015 Salary Budget Planning Report – Asia Pacific (First Quarter) I 7
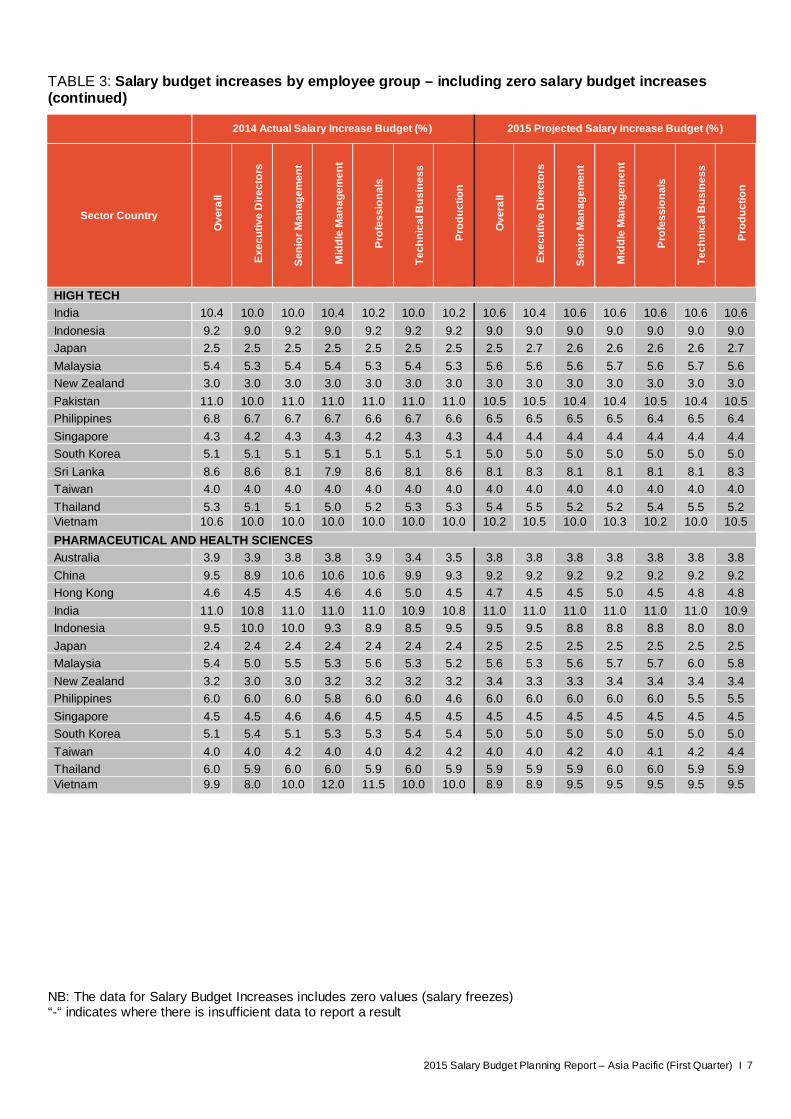
TABLE 3: Salary budget increases by employee group – including zero salary budget increases (continued)
2014 Actual Salary Increase Budget (%) 2015 Projected Salary Increase Budget (%)
Sector Country O
vera
ll
Exe
cutiv
e D
irect
ors
Seni
or M
anag
emen
t
Mid
dle
Man
agem
ent
Pro
fess
iona
ls
Tech
nica
l Bus
ines
s
Pro
duct
ion
Ove
rall
Exe
cutiv
e D
irect
ors
Seni
or M
anag
emen
t
Mid
dle
Man
agem
ent
Pro
fess
iona
ls
Tech
nica
l Bus
ines
s
Pro
duct
ion
HIGH TECH India 10.4 10.0 10.0 10.4 10.2 10.0 10.2 10.6 10.4 10.6 10.6 10.6 10.6 10.6 Indonesia 9.2 9.0 9.2 9.0 9.2 9.2 9.2 9.0 9.0 9.0 9.0 9.0 9.0 9.0 Japan 2.5 2.5 2.5 2.5 2.5 2.5 2.5 2.5 2.7 2.6 2.6 2.6 2.6 2.7 Malaysia 5.4 5.3 5.4 5.4 5.3 5.4 5.3 5.6 5.6 5.6 5.7 5.6 5.7 5.6 New Zealand 3.0 3.0 3.0 3.0 3.0 3.0 3.0 3.0 3.0 3.0 3.0 3.0 3.0 3.0 Pakistan 11.0 10.0 11.0 11.0 11.0 11.0 11.0 10.5 10.5 10.4 10.4 10.5 10.4 10.5 Philippines 6.8 6.7 6.7 6.7 6.6 6.7 6.6 6.5 6.5 6.5 6.5 6.4 6.5 6.4 Singapore 4.3 4.2 4.3 4.3 4.2 4.3 4.3 4.4 4.4 4.4 4.4 4.4 4.4 4.4 South Korea 5.1 5.1 5.1 5.1 5.1 5.1 5.1 5.0 5.0 5.0 5.0 5.0 5.0 5.0 Sri Lanka 8.6 8.6 8.1 7.9 8.6 8.1 8.6 8.1 8.3 8.1 8.1 8.1 8.1 8.3 Taiwan 4.0 4.0 4.0 4.0 4.0 4.0 4.0 4.0 4.0 4.0 4.0 4.0 4.0 4.0 Thailand 5.3 5.1 5.1 5.0 5.2 5.3 5.3 5.4 5.5 5.2 5.2 5.4 5.5 5.2 Vietnam 10.6 10.0 10.0 10.0 10.0 10.0 10.0 10.2 10.5 10.0 10.3 10.2 10.0 10.5 PHARMACEUTICAL AND HEALTH SCIENCES Australia 3.9 3.9 3.8 3.8 3.9 3.4 3.5 3.8 3.8 3.8 3.8 3.8 3.8 3.8 China 9.5 8.9 10.6 10.6 10.6 9.9 9.3 9.2 9.2 9.2 9.2 9.2 9.2 9.2 Hong Kong 4.6 4.5 4.5 4.6 4.6 5.0 4.5 4.7 4.5 4.5 5.0 4.5 4.8 4.8 India 11.0 10.8 11.0 11.0 11.0 10.9 10.8 11.0 11.0 11.0 11.0 11.0 11.0 10.9 Indonesia 9.5 10.0 10.0 9.3 8.9 8.5 9.5 9.5 9.5 8.8 8.8 8.8 8.0 8.0 Japan 2.4 2.4 2.4 2.4 2.4 2.4 2.4 2.5 2.5 2.5 2.5 2.5 2.5 2.5 Malaysia 5.4 5.0 5.5 5.3 5.6 5.3 5.2 5.6 5.3 5.6 5.7 5.7 6.0 5.8 New Zealand 3.2 3.0 3.0 3.2 3.2 3.2 3.2 3.4 3.3 3.3 3.4 3.4 3.4 3.4 Philippines 6.0 6.0 6.0 5.8 6.0 6.0 4.6 6.0 6.0 6.0 6.0 6.0 5.5 5.5 Singapore 4.5 4.5 4.6 4.6 4.5 4.5 4.5 4.5 4.5 4.5 4.5 4.5 4.5 4.5 South Korea 5.1 5.4 5.1 5.3 5.3 5.4 5.4 5.0 5.0 5.0 5.0 5.0 5.0 5.0 Taiwan 4.0 4.0 4.2 4.0 4.0 4.2 4.2 4.0 4.0 4.2 4.0 4.1 4.2 4.4 Thailand 6.0 5.9 6.0 6.0 5.9 6.0 5.9 5.9 5.9 5.9 6.0 6.0 5.9 5.9 Vietnam 9.9 8.0 10.0 12.0 11.5 10.0 10.0 8.9 8.9 9.5 9.5 9.5 9.5 9.5
NB: The data for Salary Budget Increases includes zero values (salary freezes) “-“ indicates where there is insufficient data to report a result
2015 Salary Budget Planning Report – Asia Pacific (First Quarter) I 8
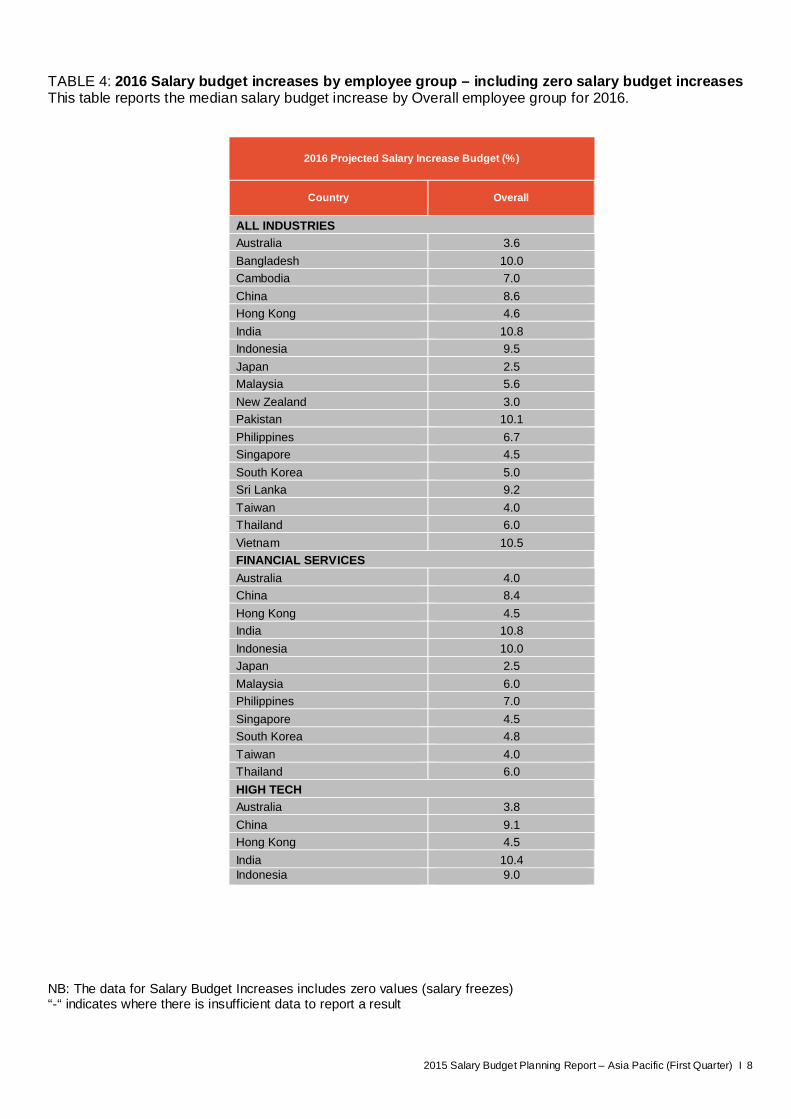
TABLE 4: 2016 Salary budget increases by employee group – including zero salary budget increases This table reports the median salary budget increase by Overall employee group for 2016.
2016 Projected Salary Increase Budget (%)
Country Overall
ALL INDUSTRIES Australia 3.6 Bangladesh 10.0 Cambodia 7.0 China 8.6 Hong Kong 4.6 India 10.8 Indonesia 9.5 Japan 2.5 Malaysia 5.6 New Zealand 3.0 Pakistan 10.1 Philippines 6.7 Singapore 4.5 South Korea 5.0 Sri Lanka 9.2 Taiwan 4.0 Thailand 6.0 Vietnam 10.5 FINANCIAL SERVICES Australia 4.0 China 8.4 Hong Kong 4.5 India 10.8 Indonesia 10.0 Japan 2.5 Malaysia 6.0 Philippines 7.0 Singapore 4.5 South Korea 4.8 Taiwan 4.0 Thailand 6.0 HIGH TECH Australia 3.8 China 9.1 Hong Kong 4.5 India 10.4 Indonesia 9.0
NB: The data for Salary Budget Increases includes zero values (salary freezes) “-“ indicates where there is insufficient data to report a result
2015 Salary Budget Planning Report – Asia Pacific (First Quarter) I 9
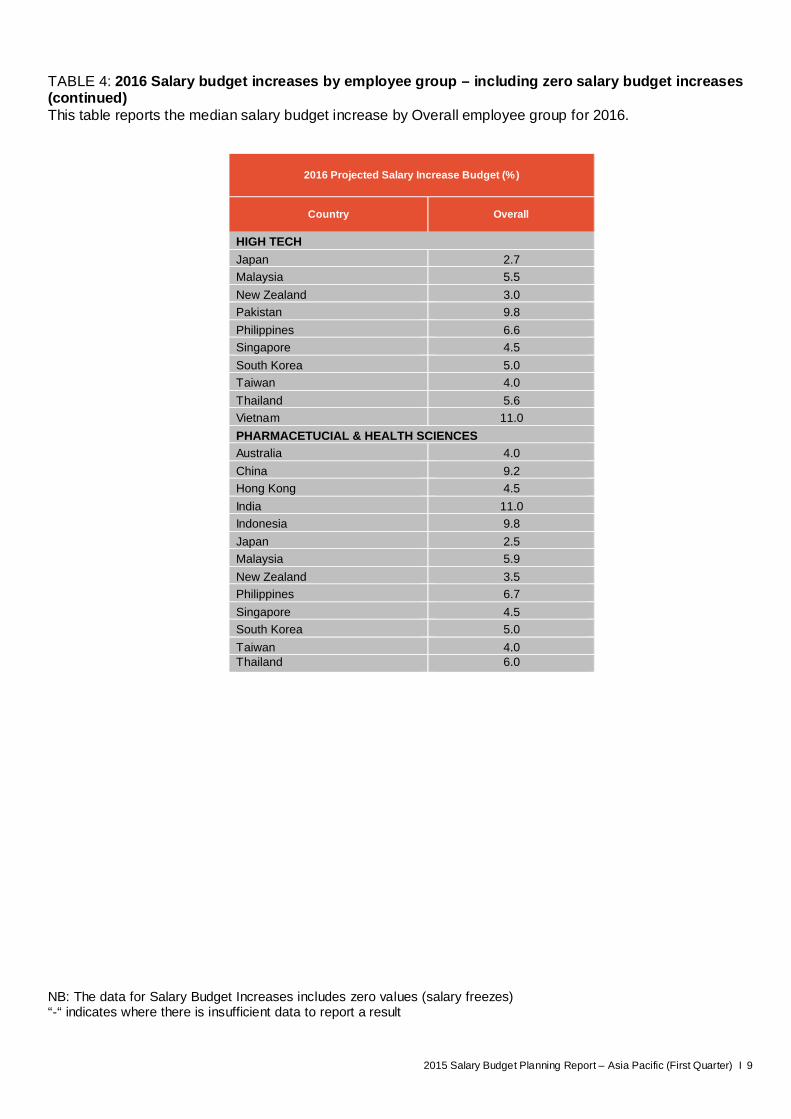
TABLE 4: 2016 Salary budget increases by employee group – including zero salary budget increases (continued) This table reports the median salary budget increase by Overall employee group for 2016.
2016 Projected Salary Increase Budget (%)
Country Overall
HIGH TECH Japan 2.7 Malaysia 5.5 New Zealand 3.0 Pakistan 9.8 Philippines 6.6 Singapore 4.5 South Korea 5.0 Taiwan 4.0 Thailand 5.6 Vietnam 11.0 PHARMACETUCIAL & HEALTH SCIENCES Australia 4.0 China 9.2 Hong Kong 4.5 India 11.0 Indonesia 9.8 Japan 2.5 Malaysia 5.9 New Zealand 3.5 Philippines 6.7 Singapore 4.5 South Korea 5.0 Taiwan 4.0 Thailand 6.0
NB: The data for Salary Budget Increases includes zero values (salary freezes) “-“ indicates where there is insufficient data to report a result

2015 Salary Budget Planning Report – Asia Pacific (First Quarter) I 10
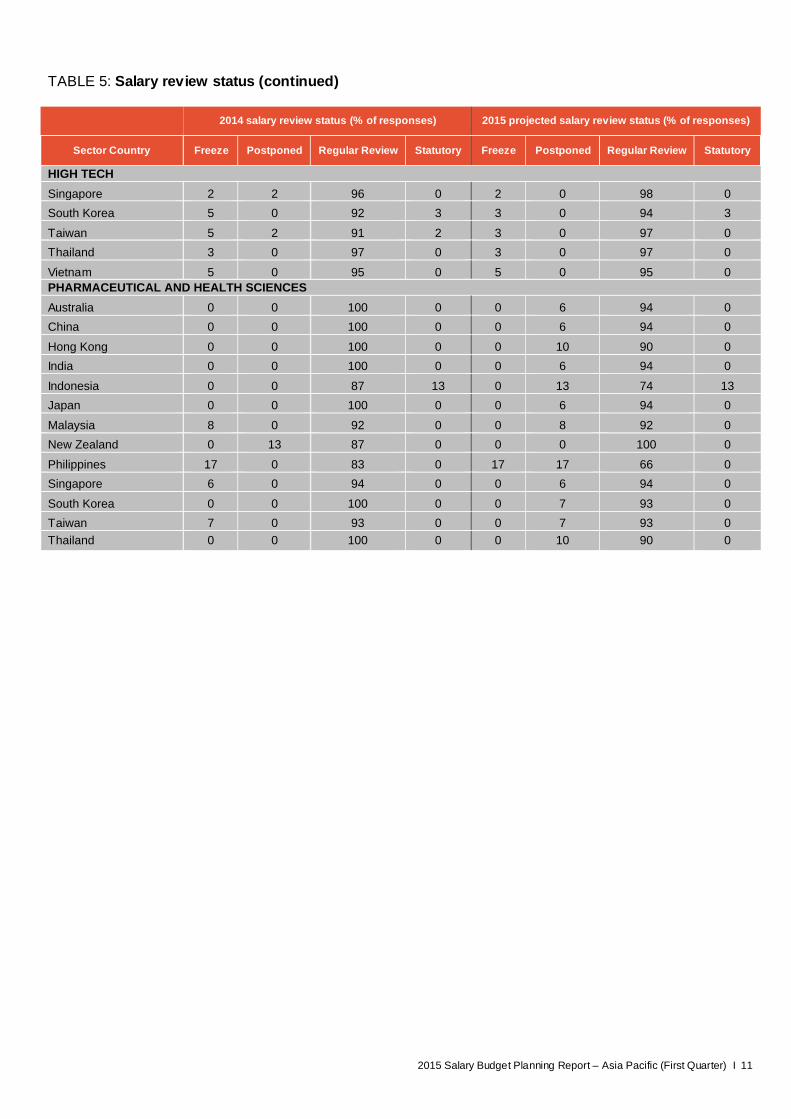
TABLE 5: Salary review status Companies were asked to indicate the status of their salary review for 2014 and 2015. This information is reported by General Industry and then by specific sectors.
2014 salary review status (% of responses) 2015 projected salary review status (% of responses)
Sector Country Freeze Postponed Regular Review Statutory Freeze Postponed Regular Review Statutory
ALL INDUSTRY Australia 3 0 97 0 5 2 93 0 Bangladesh 4 0 96 0 9 4 87 0 Cambodia 7 0 93 0 0 8 92 0 China 1 1 97 1 3 2 94 1 Hong Kong 1 0 99 0 2 2 96 0 India 2 0 97 1 1 3 95 1 Indonesia 4 1 94 1 6 5 88 1 Japan 2 2 96 0 3 2 95 0 Malaysia 5 0 95 0 6 4 90 0 Myanmar 0 0 100 0 0 14 86 0 New Zealand 4 2 94 0 2 4 94 0 Pakistan 6 3 91 0 0 7 93 0 Philippines 4 0 94 2 2 4 94 0 Singapore 4 1 95 0 5 3 92 0 South Korea 3 0 96 1 3 2 94 1 Sri Lanka 0 0 100 0 10 5 85 0 Taiwan 3 1 95 1 1 4 95 0 Thailand 2 0 98 0 3 4 93 0 Vietnam 3 0 96 1 5 3 92 0 FINANCIAL SERVICES Australia 0 0 100 0 0 0 100 0 China 0 0 100 0 0 0 100 0 Hong Kong 0 0 100 0 0 0 100 0 India 0 0 100 0 0 0 100 0 Indonesia 0 0 100 0 0 0 100 0 Japan 0 5 95 0 0 0 100 0 Malaysia 0 0 100 0 0 0 100 0 Philippines 0 0 100 0 0 0 100 0 Singapore 0 0 100 0 0 0 100 0 South Korea 0 0 100 0 0 0 100 0 Taiwan 0 0 100 0 0 0 100 0 Thailand 0 0 100 0 0 0 100 0 HIGH TECH Australia 3 0 97 0 3 0 97 0 China 2 2 94 2 5 0 93 2 Hong Kong 2 0 98 0 2 0 98 0 India 4 0 94 2 2 2 94 2 Indonesia 4 0 96 0 4 0 96 0 Japan 2 2 96 0 2 0 98 0 Malaysia 6 0 94 0 3 0 97 0 New Zealand 0 0 100 0 6 0 94 0 Pakistan 13 7 80 0 0 0 100 0 Philippines 6 0 94 0 4 0 96 0
2015 Salary Budget Planning Report – Asia Pacific (First Quarter) I 11
TABLE 5: Salary review status (continued)
2014 salary review status (% of responses) 2015 projected salary review status (% of responses)
Sector Country Freeze Postponed Regular Review Statutory Freeze Postponed Regular Review Statutory
HIGH TECH Singapore 2 2 96 0 2 0 98 0 South Korea 5 0 92 3 3 0 94 3
Taiwan 5 2 91 2 3 0 97 0 Thailand 3 0 97 0 3 0 97 0
Vietnam 5 0 95 0 5 0 95 0 PHARMACEUTICAL AND HEALTH SCIENCES Australia 0 0 100 0 0 6 94 0 China 0 0 100 0 0 6 94 0
Hong Kong 0 0 100 0 0 10 90 0 India 0 0 100 0 0 6 94 0
Indonesia 0 0 87 13 0 13 74 13 Japan 0 0 100 0 0 6 94 0
Malaysia 8 0 92 0 0 8 92 0 New Zealand 0 13 87 0 0 0 100 0
Philippines 17 0 83 0 17 17 66 0 Singapore 6 0 94 0 0 6 94 0
South Korea 0 0 100 0 0 7 93 0 Taiwan 7 0 93 0 0 7 93 0 Thailand 0 0 100 0 0 10 90 0
2015 Salary Budget Planning Report – Asia Pacific (First Quarter) I 12
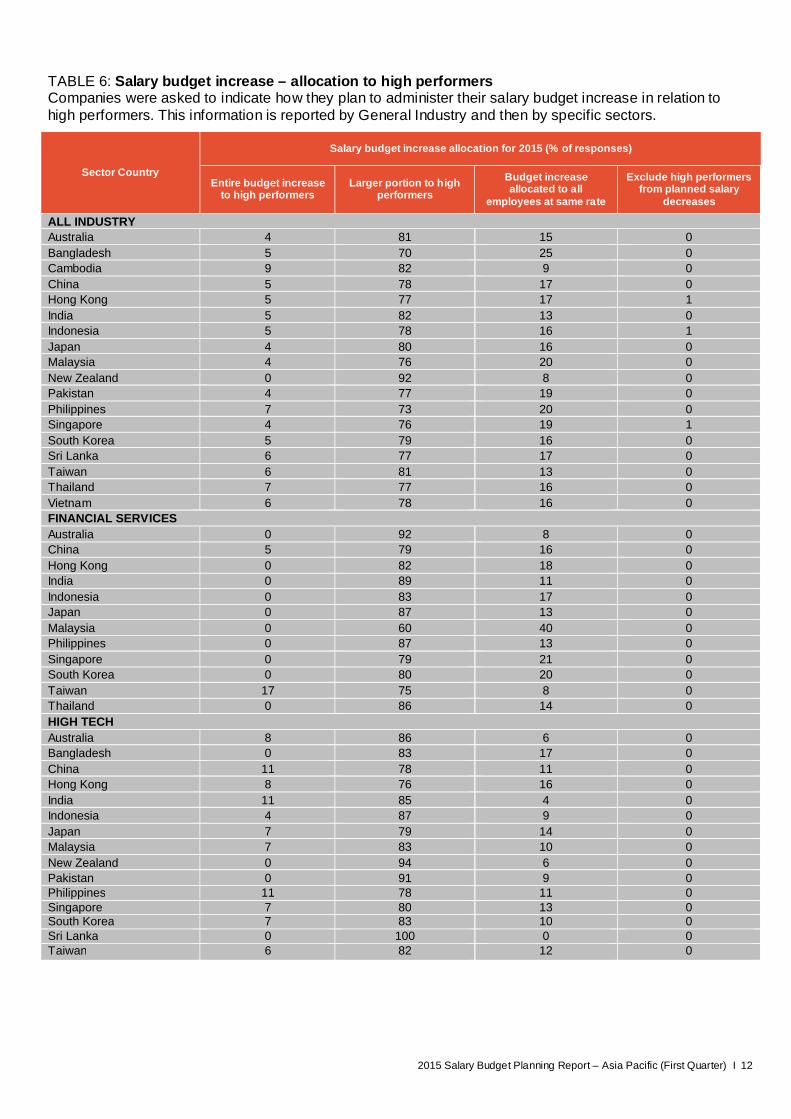
TABLE 6: Salary budget increase – allocation to high performers Companies were asked to indicate how they plan to administer their salary budget increase in relation to high performers. This information is reported by General Industry and then by specific sectors.
Sector Country
Salary budget increase allocation for 2015 (% of responses)
Entire budget increase to high performers
Larger portion to high performers
Budget increase allocated to all
employees at same rate
Exclude high performers from planned salary
decreases
ALL INDUSTRY Australia 4 81 15 0 Bangladesh 5 70 25 0 Cambodia 9 82 9 0 China 5 78 17 0 Hong Kong 5 77 17 1 India 5 82 13 0 Indonesia 5 78 16 1 Japan 4 80 16 0 Malaysia 4 76 20 0 New Zealand 0 92 8 0 Pakistan 4 77 19 0 Philippines 7 73 20 0 Singapore 4 76 19 1 South Korea 5 79 16 0 Sri Lanka 6 77 17 0 Taiwan 6 81 13 0 Thailand 7 77 16 0 Vietnam 6 78 16 0 FINANCIAL SERVICES Australia 0 92 8 0 China 5 79 16 0 Hong Kong 0 82 18 0 India 0 89 11 0 Indonesia 0 83 17 0 Japan 0 87 13 0 Malaysia 0 60 40 0 Philippines 0 87 13 0 Singapore 0 79 21 0 South Korea 0 80 20 0 Taiwan 17 75 8 0 Thailand 0 86 14 0 HIGH TECH Australia 8 86 6 0 Bangladesh 0 83 17 0 China 11 78 11 0 Hong Kong 8 76 16 0 India 11 85 4 0 Indonesia 4 87 9 0 Japan 7 79 14 0 Malaysia 7 83 10 0 New Zealand 0 94 6 0 Pakistan 0 91 9 0 Philippines 11 78 11 0 Singapore 7 80 13 0 South Korea 7 83 10 0 Sri Lanka 0 100 0 0 Taiwan 6 82 12 0
2015 Salary Budget Planning Report – Asia Pacific (First Quarter) I 13
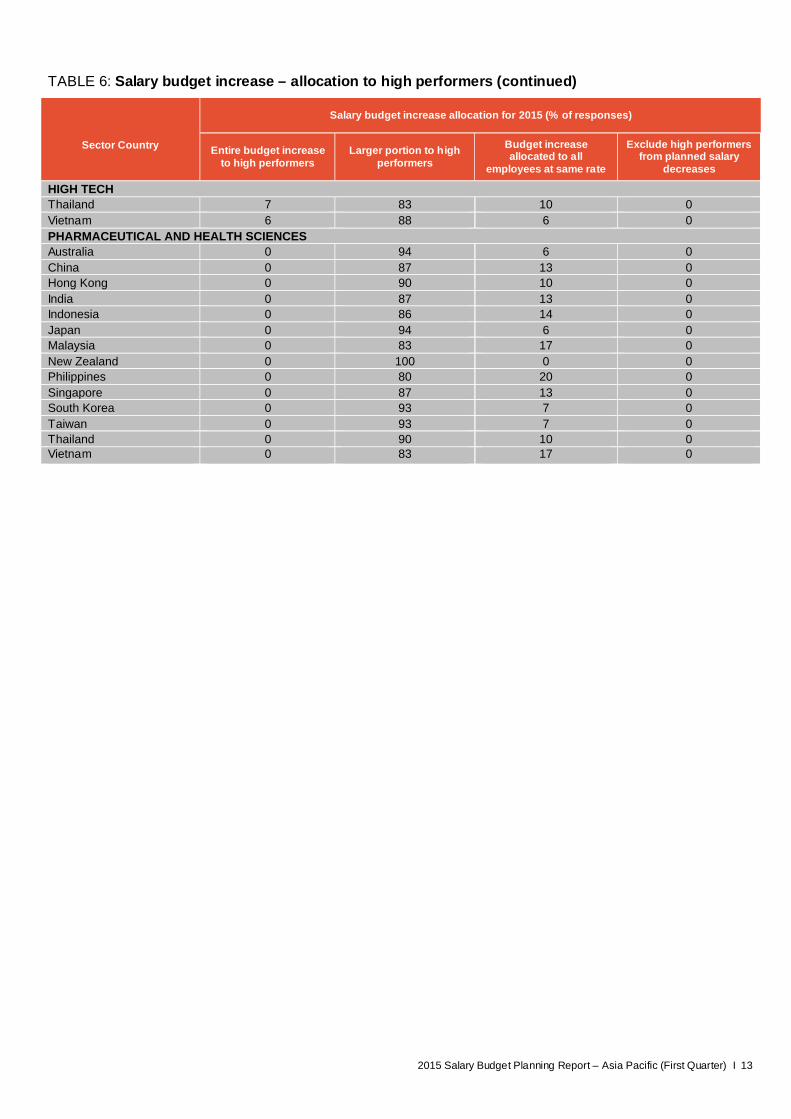
TABLE 6: Salary budget increase – allocation to high performers (continued)
Sector Country
Salary budget increase allocation for 2015 (% of responses)
Entire budget increase to high performers
Larger portion to high performers
Budget increase allocated to all
employees at same rate
Exclude high performers from planned salary
decreases
HIGH TECH Thailand 7 83 10 0 Vietnam 6 88 6 0 PHARMACEUTICAL AND HEALTH SCIENCES Australia 0 94 6 0 China 0 87 13 0 Hong Kong 0 90 10 0 India 0 87 13 0 Indonesia 0 86 14 0 Japan 0 94 6 0 Malaysia 0 83 17 0 New Zealand 0 100 0 0 Philippines 0 80 20 0 Singapore 0 87 13 0 South Korea 0 93 7 0 Taiwan 0 93 7 0 Thailand 0 90 10 0 Vietnam 0 83 17 0

2015 Salary Budget Planning Report – Asia Pacific (First Quarter) I 14
This page has been intentionally left blank
2015 Salary Budget Planning Report – Asia Pacific (First Quarter) I 15
SECTION II
SUPPLEMENTAL REPORT FOR ASIA PACIFIC In this section, organizations submitting data for Asia Pacific countries were asked to answer additional questions on the following:
• Salary Increases related to Performance Ratings
• Short-Term Incentives or Bonus Granted as % of Base Pay
• Staff Turnover
• Recruitment
• Human Capital Costs
• Business Outlook
The responses to these questions are meant to provide the users of this report additional insight on prevailing practices, HR trends, and business outlook of employers in the region. We hope you find this report both useful and insightful.
Note: All reported figures in this section are median figures.
2015 Salary Budget Planning Report – Asia Pacific (First Quarter) I 16
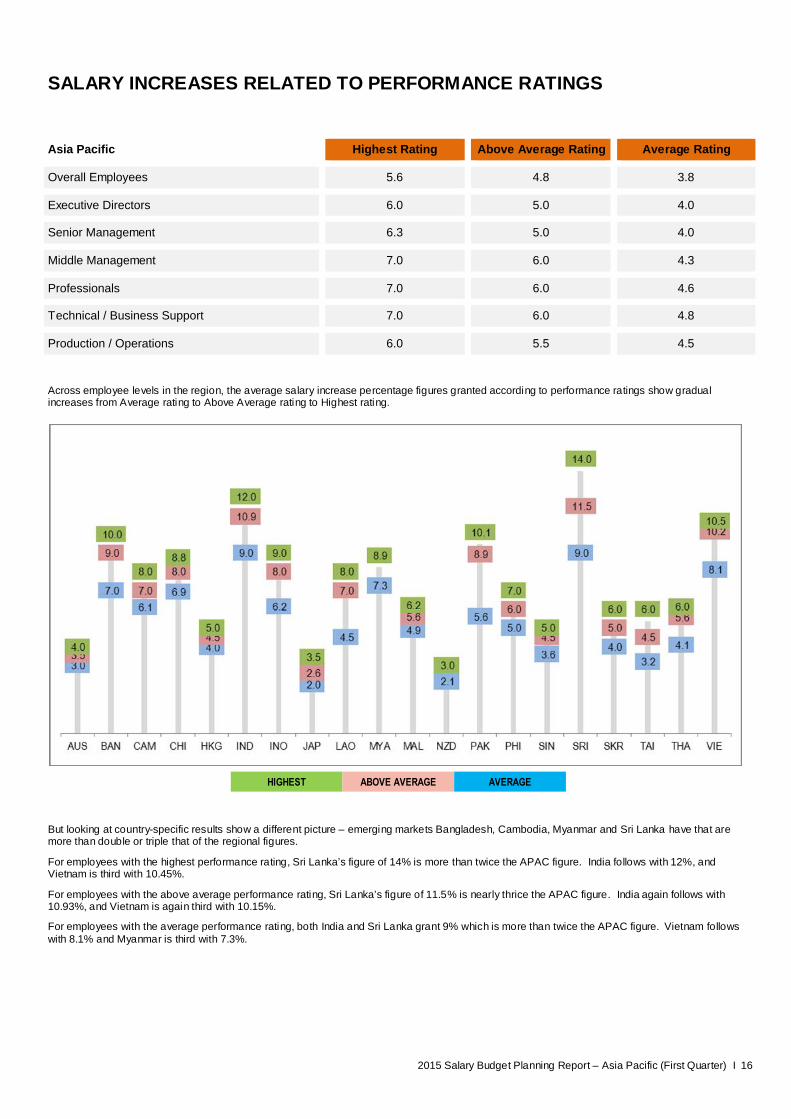
SALARY INCREASES RELATED TO PERFORMANCE RATINGS
Asia Pacific Highest Rating Above Average Rating Average Rating
Overall Employees 5.6 4.8 3.8
Executive Directors 6.0 5.0 4.0
Senior Management 6.3 5.0 4.0
Middle Management 7.0 6.0 4.3
Professionals 7.0 6.0 4.6
Technical / Business Support 7.0 6.0 4.8
Production / Operations 6.0 5.5 4.5
Across employee levels in the region, the average salary increase percentage figures granted according to performance ratings show gradual increases from Average rating to Above Average rating to Highest rating.
But looking at country-specific results show a different picture – emerging markets Bangladesh, Cambodia, Myanmar and Sri Lanka have that are more than double or triple that of the regional figures.
For employees with the highest performance rating, Sri Lanka’s figure of 14% is more than twice the APAC figure. India follows with 12%, and Vietnam is third with 10.45%.
For employees with the above average performance rating, Sri Lanka’s figure of 11.5% is nearly thrice the APAC figure. India again follows with 10.93%, and Vietnam is again third with 10.15%.
For employees with the average performance rating, both India and Sri Lanka grant 9% which is more than twice the APAC figure. Vietnam follows with 8.1% and Myanmar is third with 7.3%.
HIGHEST ABOVE AVERAGE AVERAGE
2015 Salary Budget Planning Report – Asia Pacific (First Quarter) I 17
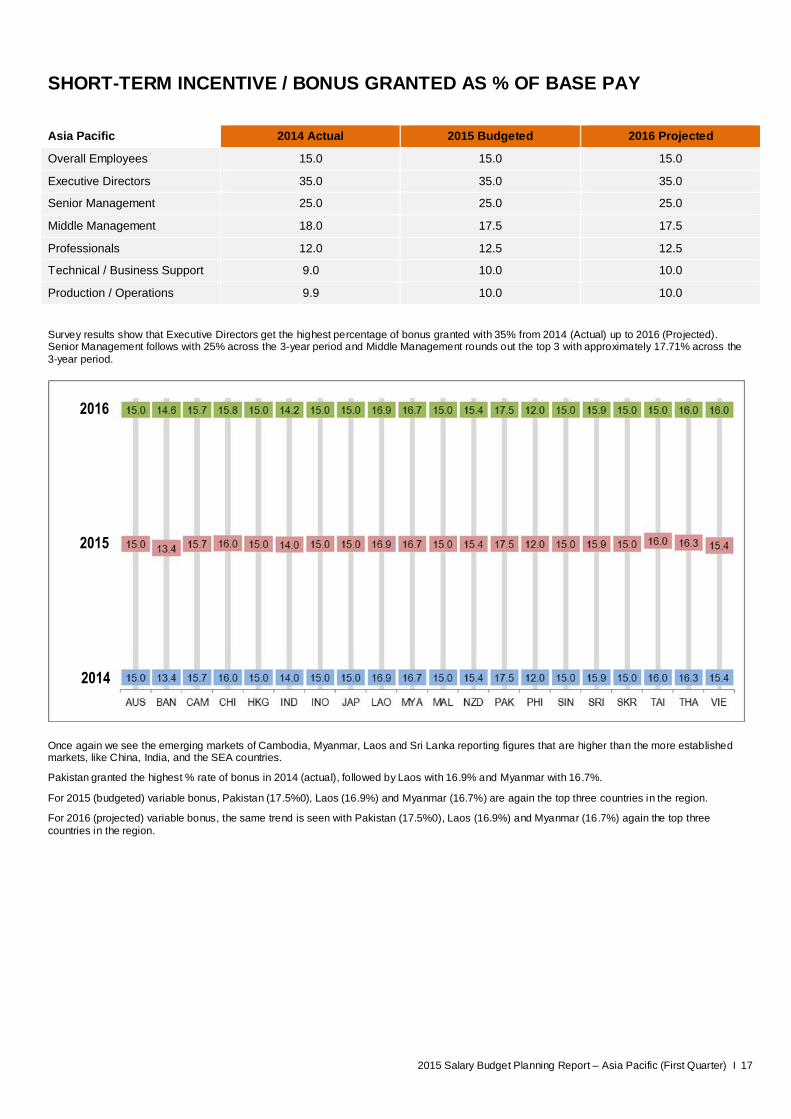
SHORT-TERM INCENTIVE / BONUS GRANTED AS % OF BASE PAY Asia Pacific 2014 Actual 2015 Budgeted 2016 Projected
Overall Employees 15.0 15.0 15.0
Executive Directors 35.0 35.0 35.0
Senior Management 25.0 25.0 25.0
Middle Management 18.0 17.5 17.5
Professionals 12.0 12.5 12.5
Technical / Business Support 9.0 10.0 10.0
Production / Operations 9.9 10.0 10.0
Survey results show that Executive Directors get the highest percentage of bonus granted with 35% from 2014 (Actual) up to 2016 (Projected). Senior Management follows with 25% across the 3-year period and Middle Management rounds out the top 3 with approximately 17.71% across the 3-year period.
Once again we see the emerging markets of Cambodia, Myanmar, Laos and Sri Lanka reporting figures that are higher than the more established markets, like China, India, and the SEA countries.
Pakistan granted the highest % rate of bonus in 2014 (actual), followed by Laos with 16.9% and Myanmar with 16.7%.
For 2015 (budgeted) variable bonus, Pakistan (17.5%0), Laos (16.9%) and Myanmar (16.7%) are again the top three countries in the region.
For 2016 (projected) variable bonus, the same trend is seen with Pakistan (17.5%0), Laos (16.9%) and Myanmar (16.7%) again the top three countries in the region.
2016
2015
2014
2015 Salary Budget Planning Report – Asia Pacific (First Quarter) I 18
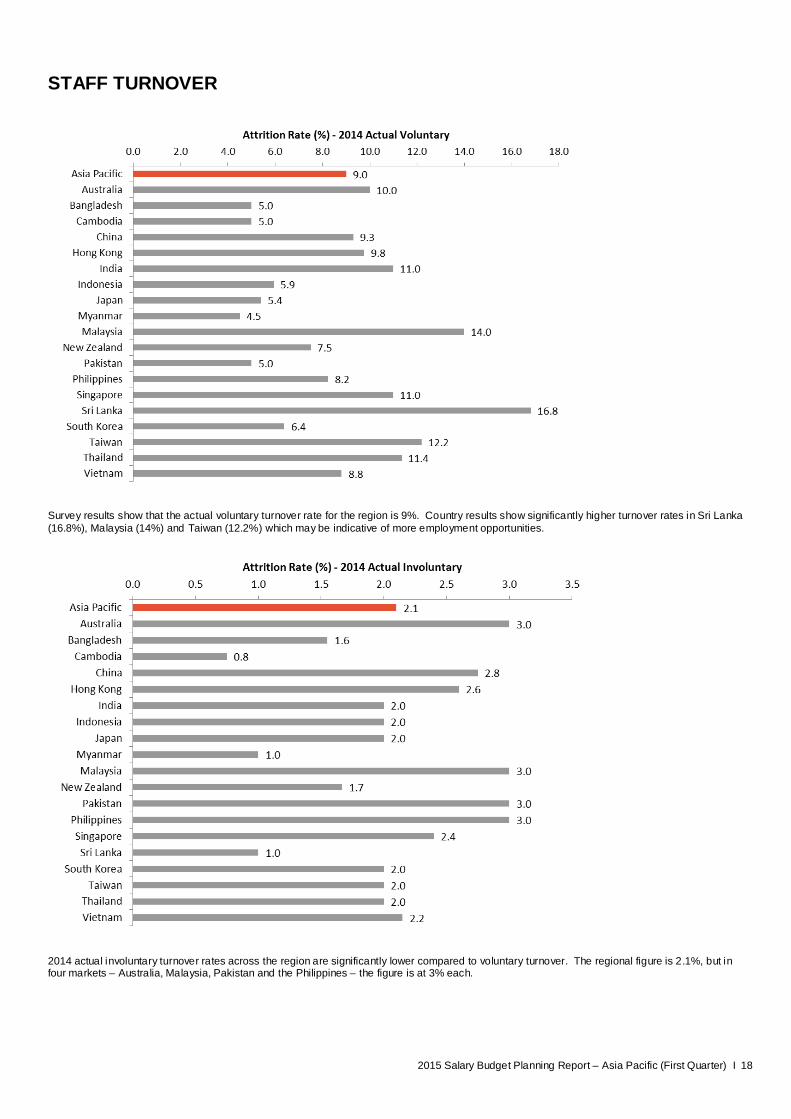
STAFF TURNOVER
Survey results show that the actual voluntary turnover rate for the region is 9%. Country results show significantly higher turnover rates in Sri Lanka (16.8%), Malaysia (14%) and Taiwan (12.2%) which may be indicative of more employment opportunities.
2014 actual involuntary turnover rates across the region are significantly lower compared to voluntary turnover. The regional figure is 2.1%, but in four markets – Australia, Malaysia, Pakistan and the Philippines – the figure is at 3% each.
2015 Salary Budget Planning Report – Asia Pacific (First Quarter) I 19
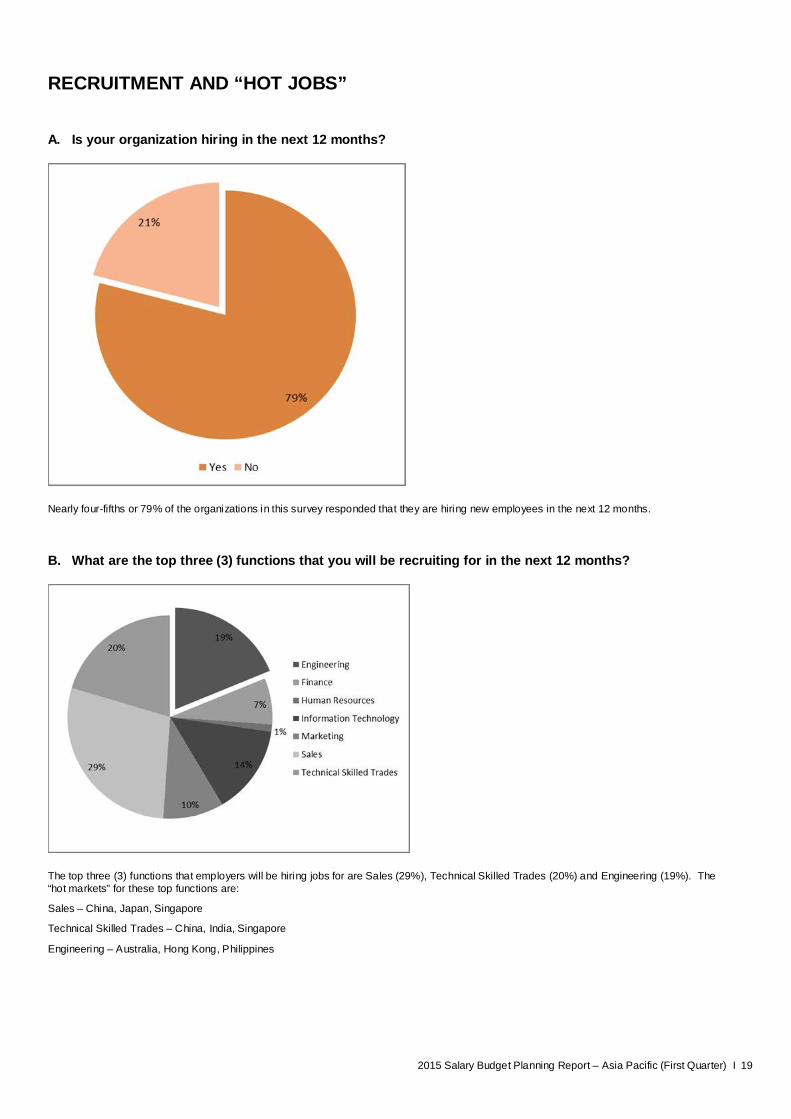
RECRUITMENT AND “HOT JOBS”
A. Is your organization hiring in the next 12 months?
Nearly four-fifths or 79% of the organizations in this survey responded that they are hiring new employees in the next 12 months.
B. What are the top three (3) functions that you will be recruiting for in the next 12 months?
The top three (3) functions that employers will be hiring jobs for are Sales (29%), Technical Skilled Trades (20%) and Engineering (19%). The “hot markets” for these top functions are:
Sales – China, Japan, Singapore
Technical Skilled Trades – China, India, Singapore
Engineering – Australia, Hong Kong, Philippines

2015 Salary Budget Planning Report – Asia Pacific (First Quarter) I 20
HUMAN CAPITAL COSTS A. What are the common cost control measures that organizations use?
Based on the responses from survey participants, the two top control measures have to do with recruitment / hiring – the number one choice is to completely freeze recruitment or hiring activities, while the second top option is to adopt or use lower cost recruitment channels.
The least popular cost control measure is cutting down on employee welfare programs.
B. What is the prevalent thrust of organizations in terms of managing costs?
A combined 68% of the survey participants responded that their cost control measures will not change or that they cannot predict any changes, while 24% responded that they believe they will be increasing their organization’s cost control measures.
2015 Salary Budget Planning Report – Asia Pacific (First Quarter) I 21
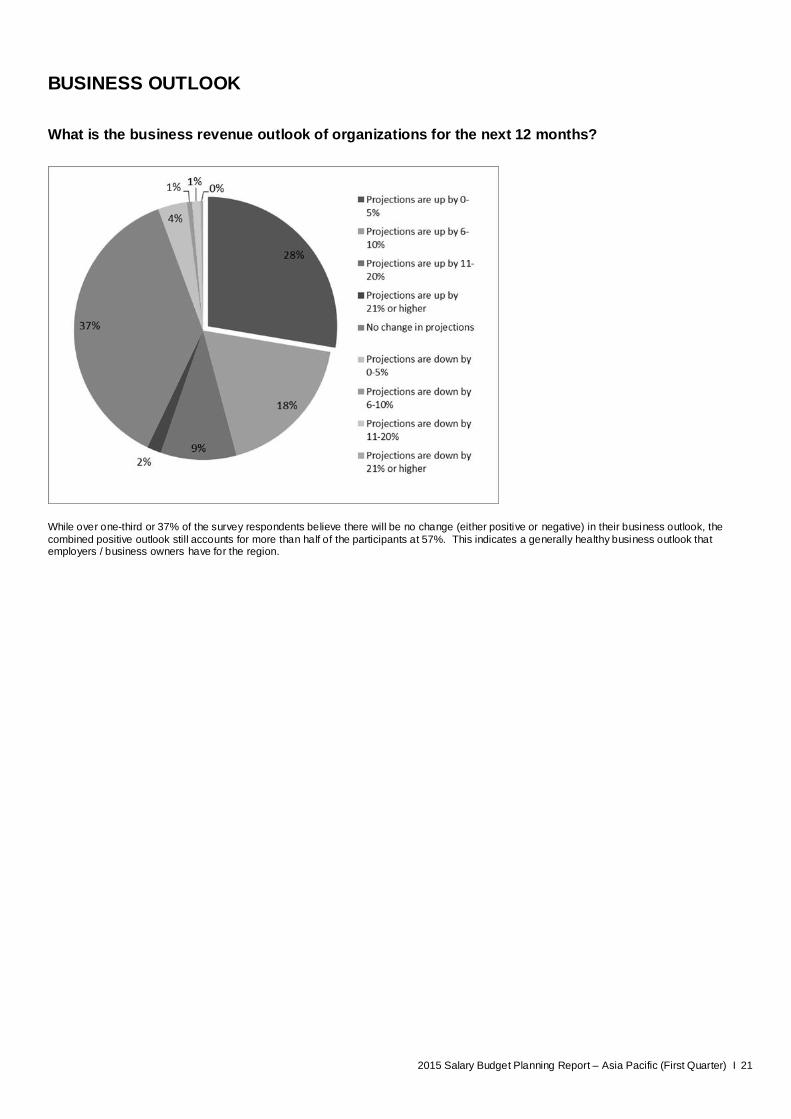
BUSINESS OUTLOOK What is the business revenue outlook of organizations for the next 12 months?
While over one-third or 37% of the survey respondents believe there will be no change (either positive or negative) in their business outlook, the combined positive outlook still accounts for more than half of the participants at 57%. This indicates a generally healthy business outlook that employers / business owners have for the region.
2015 Salary Budget Planning Report – Asia Pacific (First Quarter) I 22
LIST OF PARTICIPATING COMPANIES A CJ O SHOPPING
ABBVIE
ABCD
ACR
ACUITY BRANDS
ADP
AECOM
AGILENT TECHNOLOGIES
AIA INTERNATIONAL
AIR ASTANA
AIR PRODUCTS
ALI
ALLIANCE
AMC NETWORKS
AMERICAN EXPRESS
AMNEAL PHARMACEUTICALS
ANALOG DEVICES
ANSELL
APPTIO
ARCHROMA
ARYSTA LIFESCIENCE
ASOS
ASTRAZENECA
AT&T
AVANADE
B. BRAUN
BARCLAYS
BBC
BHP BILLITON
BILL AND MELINDA GATES FOUNDATION
BIOGEN IDEC
BIOSENSORS INTERNATIONAL
BIOTRONIK
BLOOMBERG
BMC SOFTWARE
BNP PARIBAS
BNY MELLON
BOART LONGYEAR
BOEHRINGER INGELHEIM
BOOKING.COM
BRISTOW
BRITISH SCHOOL
BRITVIC
BUNGE
BWIN
CAMERON
CAPGEMINI
CAPITAL ONE
CARL ZEISS
CATERPILLAR FINANCIAL SERVICES
CATLIN LABUAN
CEMEX
CERTIS CISCO
CHIC GROUP
CIGNA
CISCO SYSTEMS
CITIBANK
CITIGROUP
CMC
COATS
COGENT HOLDINGS
COGNIZANT
COLUMBIA SPORTSWEAR
COLUMBIAN CHEMICALS
COMMONWEALTH BANK
COMMSCOPE
CONOCOPHILLIPS
CONVERGYS
CORE LABORATORIES
CORIANT
CORNING
COVIDIEN
CSA GROUP
CTBC BANK
CWT
CYTEC
DANA
DART CONTAINER
DASSUALT SYSTEMES
DECHERT
DELPHI
DEUTSCHE TELEKOM
DIGITAL XPRESS
DISCOVERY COMMUNICATIONS
DLL
DOW CORNING
DRESSER RAND
DUN & BRADSTREET
DUPONT
DURA
E.I FREIGHT FORWARDING
EATON
EBAY
ECOLAB
EDWARDS LIFESCIENCES
EISAI
EISENMANN
EMC
EMPHASIS
ENDURANCE TECHNOLOGIES
ENPHASE ENERGY
EQUINIX
EXCELITAS TECHNOLOGIES
EXPERTISE BPO SERVICES
EZRA HOLDING
FABRINET
FANUC
FAREASTONE
FAURECIA
FIDELITY INVESTMENT
FIDESSA
FIRSTSOURCE
FLETCHER BUILDING
FLUOR
FRESENIUS KABI
FUBON LIFE INSURANCE
FUJITSU
2015 Salary Budget Planning Report – Asia Pacific (First Quarter) I 23
GAP
GAZPROM
GBM
GEN RE
GENERAL MILLS
GENWORTH
GIGAMEDIA
GILEAD
GLATFELTER
GLOBALFOUNDRIES
GLU MOBILE
GODIVA CHOCOLATIER
GREAT EASTERN LIFE
GTECH
HANA MICROELECTRONICS
HANG LUNG PROPERTIES
HARBOR STAR SHIPPING SERVICES
HESS
HOLLISTER
HONG KONG INTERNATIONAL THEME PARKS
HOTELBEDS
HSBC
HUSKY
HUTCHISON WHAMPOA
HYUNDAI
IBK ASSET MANAGEMENT
IBM
IDEXX
IEEE
IMS HEALTH
INCITEC PIVOT
INFINEON TECHNOLOGIES
INFOSYS
INGERSOLL RAND
INTEL
INVESCO
IRONSHORE INSURANCE
ITDEV
ITL
JACOBS
JARDEN CONSUMER SOLUTIONS
JINDAL ITF
JOCKEY
JOHN KEELLS BPO
JOHN WILEY & SONS
JOHNSON AND JOHNSON
JOHNSON OUTDOORS
JOTUN PAINTS
KAOHSIUNG MONOMER
KASPERSKY LAB
KEPPEL
KERRY GROUP
KING'S DEVELOPMENT
KOHLER
KSB
LAM RESEARCH
LATHAM AND WATKINS
LITTELFUSE
LOCKHEED MARTIN
LOPEZ HOLDINGS
LSG SKY CHEFS
LUBRIZOL
LYONDELLBASELL
MAERSK
MALAKOFF
MANAGEMENT SCIENCES FOR HEALTH
MANUFACTURING
MANULIFE
MASTER CHEMICAL
MCGRAW HILL
MCKESSON
MEDIACORP
MERITOR
MERZ PHARMA
METLIFE
MICRON
MINACS
MITRASTAR
MODULAR MINING SYSTEMS
MOLEX
MONEYGRAM
MONSANTO
MSD
MUNDIPHARMA
NAB
NASDAQ
NASPERS
NAVIGANT
NEPTUNE ORIENT LINES
NESTLE
NEWCREST MINING
NIKE
NOKIA
NORTHERN TRUST
NTU
NUCLEUS SOFTWARE EXPORTS
NUTRIASIA
OKIDATA
OLSWANG
ON SEMICONDUCTOR
ORANGE BUSINESS SERVICES
ORBITZ
ORORA
PANASONIC
PANAUST
PANDUIT
PAREXEL
PATH
PATTONAIR
PENTAIR VALVES & CONTROLS
PERKINELMER
PERMASTEELISA GROUP
PERSISTENT SYSTEMS
PFIZER
PHILIEAR
PHILIP MORRIS
PICANOL
PLASTIC OMNIUM
POLARIS INDUSTRIES
POLYPLASTICS MARKETING (T)
POWER MAC CENTER

2015 Salary Budget Planning Report – Asia Pacific (First Quarter) I 24
PREMIER FARNELL
PRINCIPAL FINANCIAL GROUP
QBE
QI
QUALCOMM
RACKSPACE
RBS
REED ELSEVIER
REPSOL
RICARDO
ROBERTSHAW
ROCKWELL COLLINS
ROHDE & SCHWARZ
RTI
RWE
SABIC
SABRE
SAKARI RESOURCES
SAMASTA MICROFINANCE
SBM OFFSHORE
SCA
SCHAEFFLER
SCHNEIDER
SEACHANGE
SENTOSA DEVELOPMENT
SGS
SGX
SHANGRI-LA HOTEL
SHAWCOR
SHIMAOGROUP
SIAM PACIFIC ELECTRIC WIRE & CABLE
SIGMA ALDRICH
SINGTEL
SM INVESTMENTS
SOCIÉTÉ GÉNÉRALE
SOFTWARE AG BANGALORE TECHNOLOGIES
SPLASH
STATS CHIPPAC
STMICROELECTRONICS
SUMITOMO MITSUI BANKING
SUZHOU ASEN SEMICONDUCTORS
SWAROVSKI
SWISS RE
T.D. WILLIAMSON
TA CHONG BANK
TALISMAN ENERGY
TATA MOTORS
TE CONNECTIVITY
TECK
TELEPERFORMANCE
TELSTRA
TERADATA
TERUMO BCT
TETRA PAK
THE NATURE CONSERVANCY
THOME GROUP
TOKIO MARINE LIFE INSURANCE
TOWER INTERNATIONAL
TSMC
TUPPERWARE
TWI PHARMACEUTICALS
TYCO
UCB
UL
UNILEVER
UNITED ENGINEERS
UNITED MALAYAN LAND BHD
UOB
VALEO
VETOQUINOL
VIFOR PHARMA
VIRGIN
WACKER CHEMICALS
WALT DISNEY
WATERS
WELLS FARGO
WILLIS
WITHERS
WORKDAY
2015 Salary Budget Planning Report – Asia Pacific (First Quarter) I 25
Please refer to page 27 for sample outputs. *May vary by region and/or employee level.
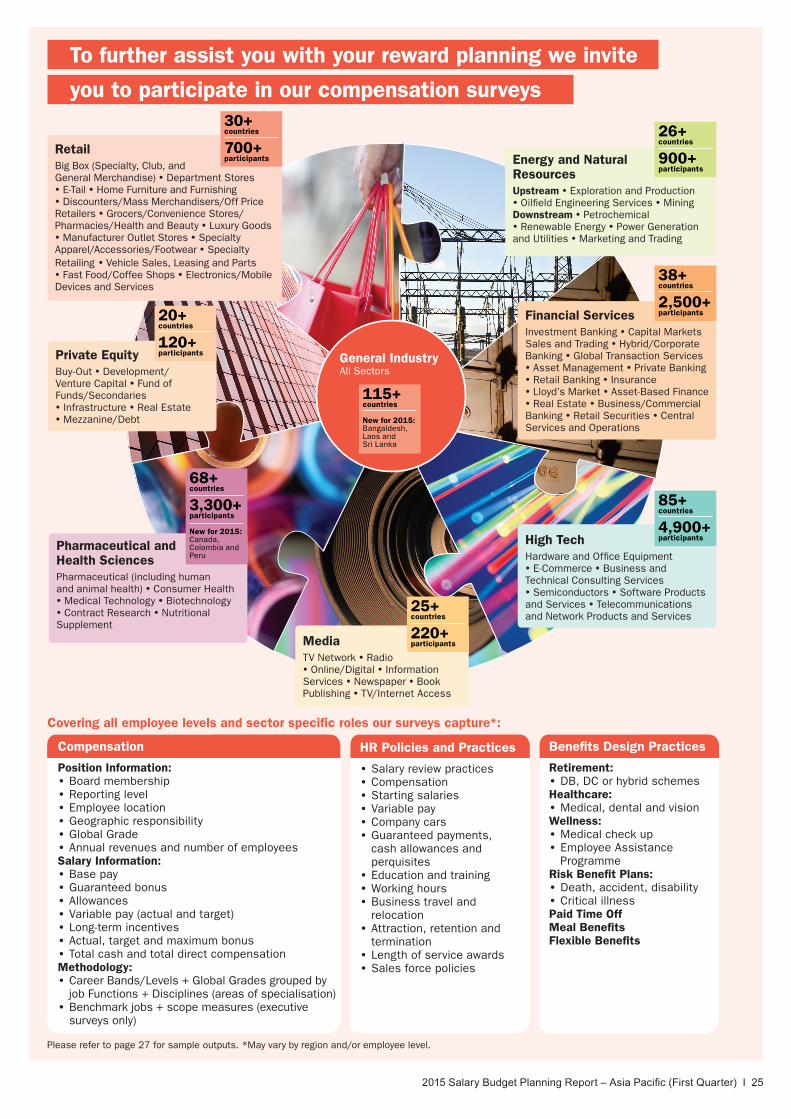
Covering all employee levels and sector specific roles our surveys capture*:
Compensation
Position Information: • Board membership • Reporting level • Employee location • Geographic responsibility • Global Grade • Annual revenues and number of employees
Salary Information: • Base pay • Guaranteed bonus • Allowances • Variable pay (actual and target) • Long-term incentives • Actual, target and maximum bonus • Total cash and total direct compensation
Methodology: • Career Bands/Levels + Global Grades grouped by job Functions + Disciplines (areas of specialisation)
• Benchmark jobs + scope measures (executive surveys only)
HR Policies and Practices
• Salary review practices • Compensation • Starting salaries • Variable pay • Company cars • Guaranteed payments, cash allowances and perquisites
• Education and training • Working hours • Business travel and relocation
• Attraction, retention and termination
• Length of service awards • Sales force policies
Benefits Design Practices
Retirement: • DB, DC or hybrid schemes
Healthcare: • Medical, dental and vision
Wellness: • Medical check up • Employee Assistance Programme
Risk Benefit Plans: • Death, accident, disability • Critical illness
Paid Time OffMeal BenefitsFlexible Benefits
To further assist you with your reward planning we invite
you to participate in our compensation surveys
General IndustryAll Sectors
RetailBig Box (Specialty, Club, and General Merchandise) Department Stores E-Tail Home Furniture and Furnishing Discounters/Mass Merchandisers/Off Price Retailers Grocers/Convenience Stores/Pharmacies/Health and Beauty Luxury Goods Manufacturer Outlet Stores Specialty Apparel/Accessories/Footwear Specialty Retailing Vehicle Sales, Leasing and Parts Fast Food/Coffee Shops Electronics/Mobile Devices and Services
Pharmaceutical and Health SciencesPharmaceutical (including human and animal health) Consumer Health Medical Technology Biotechnology Contract Research Nutritional Supplement
MediaTV Network Radio Online/Digital Information Services Newspaper Book Publishing TV/Internet Access
High TechHardware and Office Equipment E-Commerce Business and Technical Consulting Services Semiconductors Software Products and Services Telecommunications and Network Products and Services
Financial ServicesInvestment Banking Capital Markets Sales and Trading Hybrid/Corporate Banking Global Transaction Services Asset Management Private Banking Retail Banking Insurance Lloyd’s Market Asset-Based Finance Real Estate Business/Commercial Banking Retail Securities Central Services and Operations
Energy and Natural ResourcesUpstream Exploration and Production Oilfield Engineering Services Mining Downstream Petrochemical Renewable Energy Power Generation and Utilities Marketing and Trading
Private EquityBuy-Out Development/ Venture Capital Fund of Funds/Secondaries Infrastructure Real Estate Mezzanine/Debt
26+ countries
900+participants
38+ countries
2,500+participants
85+ countries
4,900+participants
25+ countries
220+participants
20+ countries
120+participants
30+ countries
700+participants
115+ countries
New for 2015: Bangaldesh, Laos and Sri Lanka
68+ countries
3,300+participants
New for 2015: Canada, Colombia and Peru
2015 Salary Budget Planning Report – Asia Pacific (First Quarter) I 26
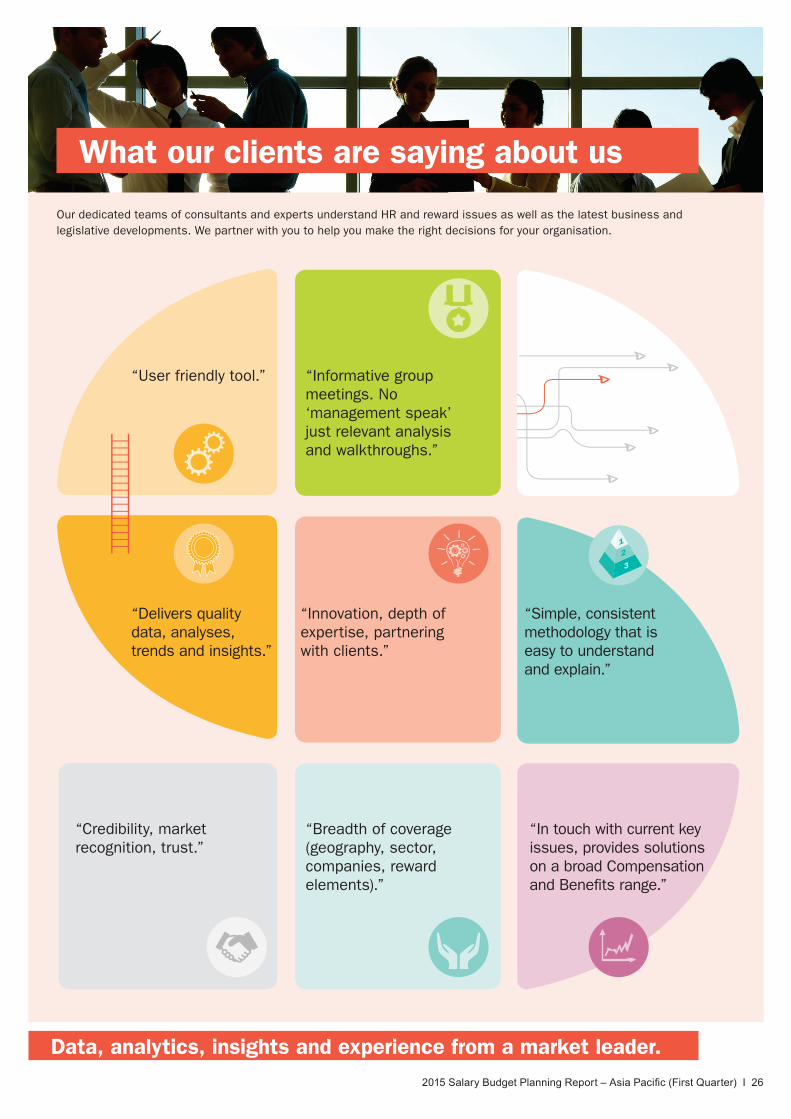
What our clients are saying about us
Data, analytics, insights and experience from a market leader.
Our dedicated teams of consultants and experts understand HR and reward issues as well as the latest business and legislative developments. We partner with you to help you make the right decisions for your organisation.
“Credibility, market recognition, trust.”
“Simple, consistent methodology that is easy to understand and explain.”
“Innovation, depth of expertise, partnering with clients.”
“Delivers quality data, analyses, trends and insights.”
“In touch with current key issues, provides solutions on a broad Compensation and Benefits range.”
“Breadth of coverage (geography, sector, companies, reward elements).”
“Informative group meetings. No ‘management speak’ just relevant analysis and walkthroughs.”
“User friendly tool.”
12
3

2015 Salary Budget Planning Report – Asia Pacific (First Quarter) I 27
Flexible and insightful reports and analyses Delivered online
Our reports provide answers to your questions and needs, whether it’s comparing your competitive position to your competitors’, or pay levels across countries, designing company car plans for thousands of employees, leveling roles for benchmarking, or calculating statutory employer costs or for those starting HR operations in a new market.
Data displayed are for illustrative purposes only. Report formats and pay elements may vary by survey and country to reflect unique local practices.
Available in Advanced Reports only.
General Industry Compensation Survey Report – France • Create peer groups based on company name or characteristics.
• Copy your preferred custom peer groups across countries.
• Preview the number of companies and cases for your custom analyses.
• Combine jobs to mirror your own internal job classifications, or when data samples are limited.
• Add custom percentile(s) to your data views. • Search for jobs by keyword and review job descriptions.
• Age data and customise currencies displayed. • View, download and print presentation-ready results. • Export your custom selection of jobs and data elements and rename fields using your organisation’s terminology.
Compensation
TRAINING/PROFESSIONAL DEVELOPMENT
Training/professional development policy
Policy for training/professional development or continuing education
All costs covered, including payment for missed working timeAll costs covered, excluding payment for missed working timeNo costs covered and no payment for missed working time
• Formally established
• Discretionary (on a case by case basis)
• Combination of both
62.1
27.7
10.3
%reporting
86.7
%reporting
82.915.0
2.1
%reporting
78.3
69.274.547.1
Type of policy:
Coverage of costs
Contribution to development/education activities
% contributingContribution covers
• MBA/University Education
• Professional quali�cation (ACCA, CPA, CFA, or CIMA)
• Other type of education
No of Companies responding: 234
No of Companies responding: 263
• Provides granular salary increase budget practices. • Supports review and design needs including company car plans, variable pay (sales and non-sales), allowances and perquisites and pay philosophy/positioning.
• Complements reward information with additional information regarding typical local HR practices including training and development, working hours, overtime and attraction and retention, thus providing you a well-rounded understanding of local HR environments.
HR Policies and PracticesHR Policies and Practices
• Comprehensive coverage of a host of benefits topics including retirement, healthcare, death and disability, and wellness.
• Detailed information to support benefits specialists with plan benchmarking and design needs.
• Flexible reporting options to satisfy all needs, whether it is high level practice prevalence in the general market place or specific benefit design considerations amongst a peer group.
Benefits Design Practices
Summary
91%
30%
100%
51%
61%
60%
85%
69%
85%
37%
22%
75%
67%
81%
30%
75%
63%
82%
49%
61
20
67
34
41
40
57
46
57
25
15
50
45
54
20
50
42
55
33
DC Retirement Plan
DB Retirement Plan
Private Medical Insurance
Dental
Optical
Medical check-up
Employee Assistance Plan
Wellness Program
Group Life
AD&D
Critical Illness
Disability
Business Travel Accident
Company Car/Transportation
Loan Program
Childcare
Meal bene�ts
Tuition
Flexible Bene�ts
67
67
67
67
67
67
67
67
67
67
67
67
67
67
67
67
67
67
67
PrevalenceNumber of companies
Total participants
DC Retirement Plan
DB Retirement Plan
Private Medical Insurance
Dental
Optical
Medical check-up
Employee Assistance Plan
Wellness Program
Group Life
AD&D
Critical Illness
Disability
Business Travel Accident
Company Car/Transportation
Loan Program
Childcare
Meal bene�ts
Tuition
Flexible Bene�ts
91%
30%
100%
51%
61%
60%85%
69%
85%
37%
22%
75%
67%
81%
30%75%
63%
82%
49%
0% 20% 40% 60% 80% 100%
Prevalence of benefits
Benefits Design Practices – United Kingdom
2015 Salary Budget Planning Report – Asia Pacific (First Quarter) I 28
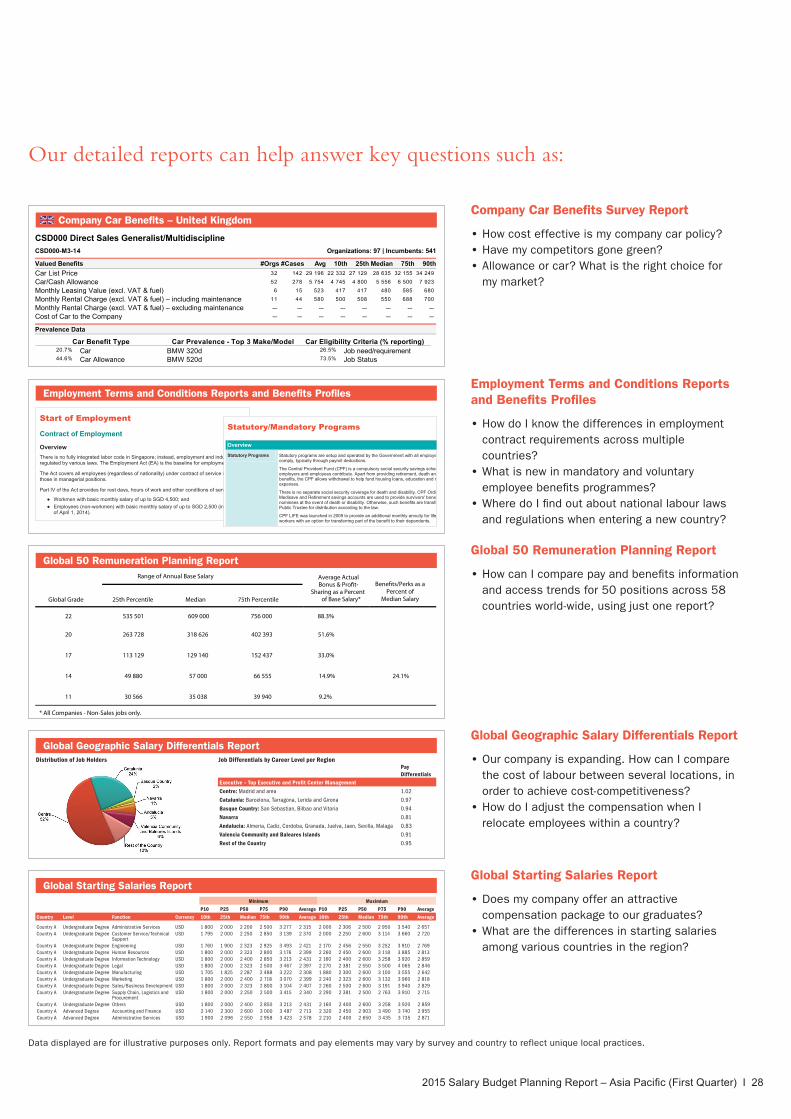
Our detailed reports can help answer key questions such as:
Data displayed are for illustrative purposes only. Report formats and pay elements may vary by survey and country to reflect unique local practices.
CSD000 Direct Sales Generalist/MultidisciplineCSD000-M3-14 Organizations: 97 | Incumbents: 541
Valued Benefits #Orgs #Cases Avg 10th 25th Median 75th 90thCar List Price 32 142 29 196 22 332 27 129 28 635 32 155 34 249
Car/Cash Allowance 52 278 5 754 4 745 4 800 5 556 6 500 7 923
Monthly Leasing Value (excl. VAT & fuel) 6 15 523 417 417 480 585 680
Monthly Rental Charge (excl. VAT & fuel) – including maintenance 11 44 580 500 508 550 688 700
Monthly Rental Charge (excl. VAT & fuel) – excluding maintenance --- --- --- --- --- --- --- ---
Cost of Car to the Company --- --- --- --- --- --- --- ---
Prevalence Data
Car Benefit Type20.7% Car44.6% Car Allowance
Car Prevalence - Top 3 Make/ModelBMW 320dBMW 520d
Car Eligibility Criteria (% reporting)26.5% Job need/requirement73.5% Job Status
Company Car Benefits – United KingdomCompany Car Benefits Survey Report
• How cost effective is my company car policy? • Have my competitors gone green? • Allowance or car? What is the right choice for my market?
Global 50 Remuneration Planning Report
• How can I compare pay and benefits information and access trends for 50 positions across 58 countries world-wide, using just one report?
Global Grade
Range of Annual Base Salary Average Actual Bonus & Pro�t-
Sharing as a Percent of Base Salary*
Bene�ts/Perks as a Percent of
Median Salary 25th Percentile Median 75th Percentile
22 535 501
20 263 728 318 626 402 393 51.6%
17 113 129 129 140 152 437 33.0%
14 49 880 57 000 66 555 14.9% 24.1%
11 30 566 35 038 39 940 9.2%
* All Companies - Non-Sales jobs only.
Global Grade % Incumbents
Receiving Incentive
31.7% %36 21
31.1% 54% 11
58% 29.4% 01
26.6% 63% 9
* Actual variable pay, i.e. sales commission and/or bonus and/or pro�t-sharing. ** Those receiving.
609 000 756 000 88.3%
Average Actual Incentive as a Percent
of Base Salary**
Global 50 Remuneration Planning Report
Employment Terms and Conditions Reports and Benefits Profiles
• How do I know the differences in employment contract requirements across multiple countries?
• What is new in mandatory and voluntary employee benefits programmes?
• Where do I find out about national labour laws and regulations when entering a new country?
Employment Terms and Conditions Reports and Benefits Profiles
7
2014 Employment Terms and Conditions Singapore
Start of Employment
Contract of Employment
OverviewThere is no fully integrated labor code in Singapore; instead, employment and industrial relations are regulated by various laws. The Employment Act (EA) is the baseline for employment terms and conditions.
The Act covers all employees (regardless of nationality) under contract of service with an employer except for those in managerial positions.
Part IV of the Act provides for rest days, hours of work and other conditions of service and it applies only to:
● Workmen with basic monthly salary of up to SGD 4,500; and ● Employees (non-workmen) with basic monthly salary of up to SGD 2,500 (increased from SGD 2,000 as
of April 1, 2014).
Effective April 1, 2014 professionals, junior managers and executives (PMEs) with basic monthly salary of up to SGD 4,500 are covered by general provisions of the EA, including sick leave benefits and protection against unfair dismissal. Previously, only salary protection was accorded to them; Part IV provisions still do not apply.
LegislationMajor legislation affecting employment includes:
● Trade Disputes Act;● Employment Act;● Employment of Foreign Manpower Act;● Skills Development Levy Act;● Retirement and Re-Employment Act;● Industrial Relations Act;● Trade Unions Act;● Workplace Safety and Health Act; and● Work Injury Compensation Act.
Other Sources of InfluenceIn unionized industries, the terms and conditions of employment are negotiated between management and employee unions and incorporated into agreements that must be certified by the Industrial Arbitration Court. Employment conditions for executive, administrative and professional employees are usually covered by individual employment contracts. The EA prescribes certain minimum terms and conditions of employment for employees who fall within its protections.
Work RulesThere is no requirement for companies to establish or post work rules. Company policies and other standard terms and conditions may also be set out in an employee handbook or manual, the terms of which are incorporated into an employment contract.
8
2014 Benefits Profile
Singapore
Statutory/Mandatory Programs
Overview
Statutory Programs Statutory programs are setup and operated by the Government with all employers required to comply, typically through payroll deductions.
The Central Provident Fund (CPF) is a compulsory social security savings scheme to which both employers and employees contribute. Apart from providing retirement, death and disability benefits, the CPF allows withdrawal to help fund housing loans, education and medical expenses.
There is no separate social security coverage for death and disability. CPF Ordinary, Special, Medisave and Retirement savings accounts are used to provide survivors' benefits to members' nominees at the event of death or disability. Otherwise, such benefits are transferred to the Public Trustee for distribution according to the law.
CPF LIFE was launched in 2009 to provide an additional monthly annuity for life to elderly workers with an option for transferring part of the benefit to their dependents.
Mandatory Programs Mandatory programs are required to be implemented by Companies. They are not managed by the Government but typically by providers selected by the company.
Under the Re-employment Act, it is unlawful to dismiss an employee on the grounds of age for any employee below age 62 (or the prescribed minimum retirement age. Effective January 1, 2012 employees are eligible for re-employment by the employer up to the age of 65 for employees who are assessed by their employer as having a satisfactory work performance and as being medically fit to continue working.
Employers that are unable to find suitable job vacancies for employees eligible for re-employment are required to offer a one-off Employment Assistance Payment (EAP) to such employees. The legislation does not prescribe the amount of the EAP to be paid, but does require the employer to take into account the Tripartite Guidelines on the Re-Employment of Older Employees in determining the amount to be paid.
There is no other legal requirement for supplemental employer provided retirement, health or welfare plans.
Retirement Benefits
Overview Singapore has a comprehensive social security pay-as-you-go savings plan called the Central Provident Fund (CPF). The plan is regulated by the CPF Act and administered by the CPF Board (CPFB).
Mandatory coverage applies for Singapore citizens and permanent residents. Each CPF member has three basic accounts, the Ordinary Account (OA), the Special Account (SA) and the Medisave Account (MA). Upon reaching age 55, a fourth account, the Retirement Account (RA), should be established to meet members' basic needs during old age.
Membership to the CPF LIFE (Lifelong Income Scheme for the Elderly) is currently voluntary. This scheme complements standard CPF retirement benefits and it is similar to life annuities usually purchased by retiring members except that this is administered by CPFB.
Total accumulated retirement savings are normally used to purchase a life annuity from authorized insurance companies. The sum may also be placed with an authorized bank or drawn periodically in fixed amounts from age 62.
Reforms CPF contribution rates for older workers aged 50-65 were increased from September 2012.
Global Starting Salaries Report
• Does my company offer an attractive compensation package to our graduates?
• What are the differences in starting salaries among various countries in the region?
Global Starting Salaries ReportMinimum Maximium
P10 P25 P50 P75 P90 Average P10 P25 P50 P75 P90 Average
Country Level Function Currency 10th 25th Median 75th 90th Average 10th 25th Median 75th 90th Average
Country A Undergraduate Degree Administrative Services USD 1 800 2 000 2 200 2 500 3 277 2 315 2 000 2 306 2 500 2 950 3 540 2 657Country A Undergraduate Degree Customer Service/Technical
SupportUSD 1 795 2 000 2 250 2 850 3 139 2 370 2 000 2 250 2 600 3 114 3 660 2 720
Country A Undergraduate Degree Engineering USD 1 760 1 900 2 323 2 925 3 493 2 421 2 170 2 456 2 550 3 252 3 910 2 769Country A Undergraduate Degree Human Resources USD 1 800 2 000 2 323 2 800 3 176 2 399 2 260 2 450 2 600 3 118 3 885 2 813Country A Undergraduate Degree Information Technology USD 1 800 2 000 2 400 2 850 3 213 2 431 2 160 2 400 2 600 3 258 3 920 2 859Country A Undergraduate Degree Legal USD 1 800 2 000 2 323 2 500 3 467 2 397 2 270 2 381 2 550 3 500 4 065 2 846Country A Undergraduate Degree Manufacturing USD 1 705 1 825 2 287 2 488 3 222 2 308 1 880 2 300 2 600 3 100 3 555 2 642Country A Undergraduate Degree Marketing USD 1 800 2 000 2 400 2 718 3 070 2 399 2 240 2 323 2 600 3 132 3 960 2 818Country A Undergraduate Degree Sales/Business Development USD 1 800 2 000 2 323 2 800 3 104 2 407 2 260 2 500 2 600 3 191 3 940 2 829Country A Undergraduate Degree Supply Chain, Logistics and
ProcurementUSD 1 800 2 000 2 250 2 500 3 415 2 340 2 290 2 381 2 500 2 763 3 910 2 715
Country A Undergraduate Degree Others USD 1 800 2 000 2 400 2 850 3 213 2 431 2 160 2 400 2 600 3 258 3 920 2 859Country A Advanced Degree Accounting and Finance USD 2 140 2 300 2 600 3 000 3 487 2 713 2 320 2 450 2 903 3 490 3 740 2 955Country A Advanced Degree Administrative Services USD 1 900 2 096 2 550 2 958 3 423 2 578 2 210 2 400 2 650 3 435 3 735 2 871
Global Geographic Salary Differentials Report
• Our company is expanding. How can I compare the cost of labour between several locations, in order to achieve cost-competitiveness?
• How do I adjust the compensation when I relocate employees within a country?
Global Geographic Salary Differentials ReportDistribution of Job Holders Job Differentials by Career Level per Region
Pay Differentials
Executive – Top Executive and Profit Center Management
Centre: Madrid and area 1.02
Catalunia: Barcelona, Tarragona, Lerida and Girona 0.97
Basque Country: San Sebastian, Bilbao and Vitoria 0.94
Navarra 0.81
Andalucia: Almeria, Cadiz, Cordoba, Granada, Juelva, Jaen, Sevilla, Malaga 0.83
Valencia Community and Baleares Islands 0.91
Rest of the Country 0.95
2015 Salary Budget Planning Report – Asia Pacific (First Quarter) I 29
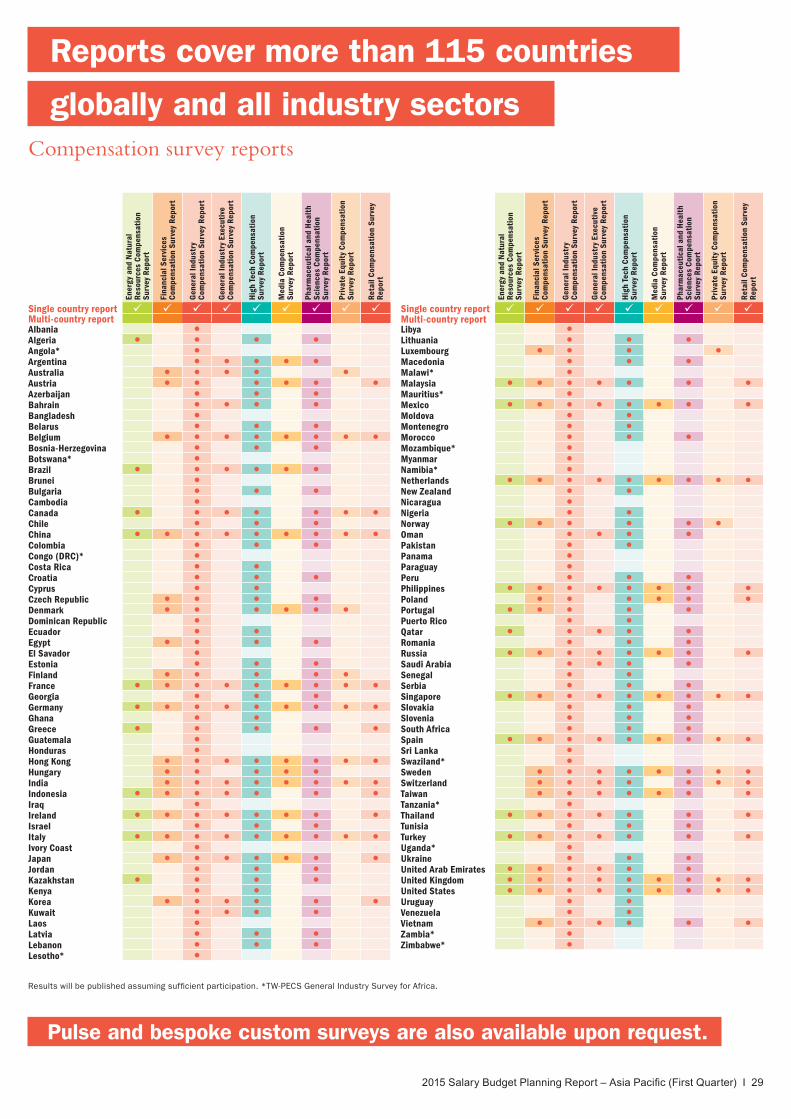
Reports cover more than 115 countries
globally and all industry sectors Compensation survey reports
Pulse and bespoke custom surveys are also available upon request.
Results will be published assuming sufficient participation. *TW-PECS General Industry Survey for Africa.
Single country report Multi-country reportAlbania ●Algeria ● ● ● ●Angola* ●Argentina ● ● ● ● ●Australia ● ● ● ● ●Austria ● ● ● ● ● ●Azerbaijan ● ● ●Bahrain ● ● ● ●Bangladesh ●Belarus ● ● ●Belgium ● ● ● ● ● ● ● ●Bosnia-Herzegovina ● ● ●Botswana* ●Brazil ● ● ● ● ● ●Brunei ●Bulgaria ● ● ●Cambodia ●Canada ● ● ● ● ● ● ●Chile ● ● ●China ● ● ● ● ● ● ● ● ●Colombia ● ● ●Congo (DRC)* ●Costa Rica ● ●Croatia ● ● ●Cyprus ● ●Czech Republic ● ● ● ●Denmark ● ● ● ● ● ●Dominican Republic ●Ecuador ● ●Egypt ● ● ● ●El Savador ●Estonia ● ● ●Finland ● ● ● ● ●France ● ● ● ● ● ● ● ● ●Georgia ● ● ●Germany ● ● ● ● ● ● ● ● ●Ghana ● ●Greece ● ● ● ● ●Guatemala ●Honduras ●Hong Kong ● ● ● ● ● ● ● ●Hungary ● ● ● ● ●India ● ● ● ● ● ● ● ●Indonesia ● ● ● ● ● ● ●Iraq ●Ireland ● ● ● ● ● ● ● ●Israel ● ● ●Italy ● ● ● ● ● ● ● ● ●Ivory Coast ●Japan ● ● ● ● ● ● ●Jordan ● ● ●Kazakhstan ● ● ● ●Kenya ● ●Korea ● ● ● ● ● ●Kuwait ● ● ● ●Laos ●Latvia ● ● ●Lebanon ● ● ●Lesotho* ●
Hig
h Te
ch C
ompe
nsat
ion
Surv
ey R
epor
t
Med
ia C
ompe
nsat
ion
Surv
ey R
epor
t
Ener
gy a
nd N
atur
al
Reso
urce
s Co
mpe
nsat
ion
Surv
ey R
epor
t
Fina
ncia
l Ser
vice
s Co
mpe
nsat
ion
Surv
ey R
epor
t
Priv
ate
Equi
ty C
ompe
nsat
ion
Surv
ey R
epor
t
Phar
mac
euti
cal a
nd H
ealt
h Sc
ienc
es C
ompe
nsat
ion
Surv
ey R
epor
t
Reta
il Co
mpe
nsat
ion
Surv
ey
Repo
rt
Gen
eral
Indu
stry
Co
mpe
nsat
ion
Surv
ey R
epor
t
Gen
eral
Indu
stry
Exe
cuti
ve
Com
pens
atio
n Su
rvey
Rep
ort
Single country report Multi-country reportLibya ●Lithuania ● ● ●Luxembourg ● ● ● ●Macedonia ● ● ●Malawi* ●Malaysia ● ● ● ● ● ● ●Mauritius* ●Mexico ● ● ● ● ● ● ● ●Moldova ● ●Montenegro ● ●Morocco ● ● ●Mozambique* ●Myanmar ●Namibia* ●Netherlands ● ● ● ● ● ● ● ● ●New Zealand ● ●Nicaragua ●Nigeria ● ●Norway ● ● ● ● ● ●Oman ● ● ● ●Pakistan ● ●Panama ●Paraguay ●Peru ● ● ●Philippines ● ● ● ● ● ● ● ●Poland ● ● ● ● ● ●Portugal ● ● ● ● ●Puerto Rico ● ●Qatar ● ● ● ● ●Romania ● ● ●Russia ● ● ● ● ● ● ● ●Saudi Arabia ● ● ● ●Senegal ● ●Serbia ● ● ●Singapore ● ● ● ● ● ● ● ● ●Slovakia ● ● ●Slovenia ● ● ●South Africa ● ● ●Spain ● ● ● ● ● ● ● ● ●Sri Lanka ●Swaziland* ●Sweden ● ● ● ● ● ● ● ●Switzerland ● ● ● ● ● ● ●Taiwan ● ● ● ● ● ● ●Tanzania* ●Thailand ● ● ● ● ● ● ●Tunisia ● ● ●Turkey ● ● ● ● ● ● ●Uganda* ●Ukraine ● ● ●United Arab Emirates ● ● ● ● ● ●United Kingdom ● ● ● ● ● ● ● ● ●United States ● ● ● ● ● ● ● ● ●Uruguay ● ●Venezuela ● ●Vietnam ● ● ● ● ● ●Zambia* ●Zimbabwe* ●
Hig
h Te
ch C
ompe
nsat
ion
Surv
ey R
epor
t
Med
ia C
ompe
nsat
ion
Surv
ey R
epor
t
Ener
gy a
nd N
atur
al
Reso
urce
s Co
mpe
nsat
ion
Surv
ey R
epor
t
Fina
ncia
l Ser
vice
s Co
mpe
nsat
ion
Surv
ey R
epor
t
Priv
ate
Equi
ty C
ompe
nsat
ion
Surv
ey R
epor
t
Phar
mac
euti
cal a
nd H
ealt
h Sc
ienc
es C
ompe
nsat
ion
Surv
ey R
epor
t
Reta
il Co
mpe
nsat
ion
Surv
ey
Repo
rt
Gen
eral
Indu
stry
Co
mpe
nsat
ion
Surv
ey R
epor
t
Gen
eral
Indu
stry
Exe
cuti
ve
Com
pens
atio
n Su
rvey
Rep
ort
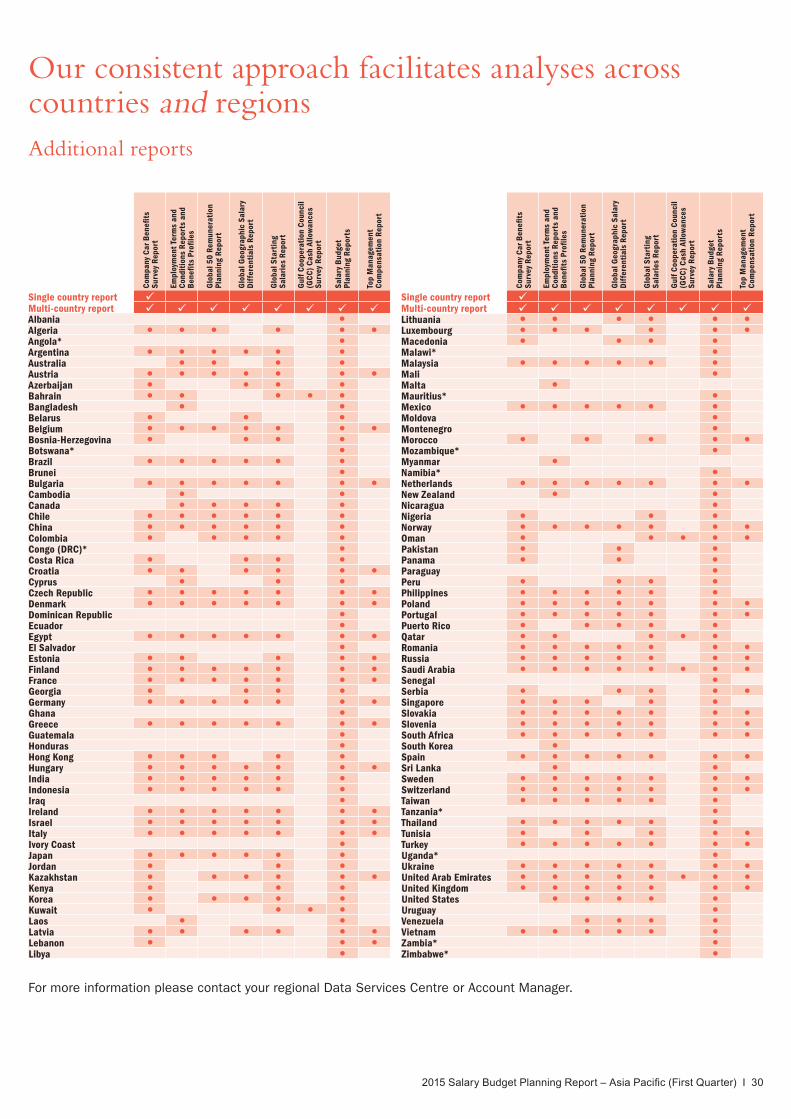
2015 Salary Budget Planning Report – Asia Pacific (First Quarter) I 30
Our consistent approach facilitates analyses across countries and regionsAdditional reports
For more information please contact your regional Data Services Centre or Account Manager.
Single country report Multi-country report Albania ●Algeria ● ● ● ● ● ●Angola* ●Argentina ● ● ● ● ● ●Australia ● ● ● ●Austria ● ● ● ● ● ● ●Azerbaijan ● ● ● ●Bahrain ● ● ● ● ●Bangladesh ● ●Belarus ● ● ●Belgium ● ● ● ● ● ● ●Bosnia-Herzegovina ● ● ● ●Botswana* ●Brazil ● ● ● ● ● ●Brunei ●Bulgaria ● ● ● ● ● ● ●Cambodia ● ●Canada ● ● ● ● ●Chile ● ● ● ● ● ●China ● ● ● ● ● ●Colombia ● ● ● ● ●Congo (DRC)* ●Costa Rica ● ● ● ●Croatia ● ● ● ● ● ●Cyprus ● ● ●Czech Republic ● ● ● ● ● ● ●Denmark ● ● ● ● ● ● ●Dominican Republic ●Ecuador ●Egypt ● ● ● ● ● ● ●El Salvador ●Estonia ● ● ● ● ●Finland ● ● ● ● ● ● ●France ● ● ● ● ● ● ●Georgia ● ● ● ●Germany ● ● ● ● ● ● ●Ghana ●Greece ● ● ● ● ● ● ●Guatemala ●Honduras ●Hong Kong ● ● ● ● ●Hungary ● ● ● ● ● ● ●India ● ● ● ● ● ●Indonesia ● ● ● ● ● ●Iraq ●Ireland ● ● ● ● ● ● ●Israel ● ● ● ● ● ● ●Italy ● ● ● ● ● ● ●Ivory Coast ●Japan ● ● ● ● ● ●Jordan ● ● ●Kazakhstan ● ● ● ● ● ●Kenya ● ● ●Korea ● ● ● ● ●Kuwait ● ● ● ●Laos ● ●Latvia ● ● ● ● ● ●Lebanon ● ● ●Libya ●
Empl
oym
ent T
erm
s an
d Co
ndit
ions
Rep
orts
and
B
enefi
ts P
rofil
es
Sala
ry B
udge
t Pl
anni
ng R
epor
ts
Com
pany
Car
Ben
efits
Su
rvey
Rep
ort
Glo
bal 5
0 Re
mun
erat
ion
Plan
ning
Rep
ort
Glo
bal G
eogr
aphi
c Sa
lary
D
iffe
rent
ials
Rep
ort
Glo
bal S
tart
ing
Sala
ries
Rep
ort
Top
Man
agem
ent
Com
pens
atio
n Re
port
Gul
f Coo
pera
tion
Cou
ncil
(GCC
) Ca
sh A
llow
ance
s Su
rvey
Rep
ort
Single country report Multi-country report Lithuania ● ● ● ● ● ●Luxembourg ● ● ● ● ● ●Macedonia ● ● ● ●Malawi* ●Malaysia ● ● ● ● ● ●Mali ●Malta ●Mauritius* ●Mexico ● ● ● ● ● ●Moldova ●Montenegro ●Morocco ● ● ● ● ●Mozambique* ●Myanmar ●Namibia* ●Netherlands ● ● ● ● ● ● ●New Zealand ● ●Nicaragua ●Nigeria ● ● ●Norway ● ● ● ● ● ● ●Oman ● ● ● ● ●Pakistan ● ● ●Panama ● ● ●Paraguay ●Peru ● ● ● ●Philippines ● ● ● ● ● ●Poland ● ● ● ● ● ● ●Portugal ● ● ● ● ● ● ●Puerto Rico ● ● ● ● ●Qatar ● ● ● ● ●Romania ● ● ● ● ● ● ●Russia ● ● ● ● ● ● ●Saudi Arabia ● ● ● ● ● ● ● ●Senegal ●Serbia ● ● ● ● ●Singapore ● ● ● ● ●Slovakia ● ● ● ● ● ● ●Slovenia ● ● ● ● ● ● ●South Africa ● ● ● ● ● ● ●South Korea ●Spain ● ● ● ● ● ● ●Sri Lanka ● ●Sweden ● ● ● ● ● ● ●Switzerland ● ● ● ● ● ● ●Taiwan ● ● ● ● ● ●Tanzania* ●Thailand ● ● ● ● ● ●Tunisia ● ● ● ● ●Turkey ● ● ● ● ● ● ●Uganda* ●Ukraine ● ● ● ● ● ● ●United Arab Emirates ● ● ● ● ● ● ● ●United Kingdom ● ● ● ● ● ● ●United States ● ● ● ● ●Uruguay ●Venezuela ● ● ● ●Vietnam ● ● ● ● ● ●Zambia* ●Zimbabwe* ●
Empl
oym
ent T
erm
s an
d Co
ndit
ions
Rep
orts
and
B
enefi
ts P
rofil
es
Sala
ry B
udge
t Pl
anni
ng R
epor
ts
Com
pany
Car
Ben
efits
Su
rvey
Rep
ort
Glo
bal 5
0 Re
mun
erat
ion
Plan
ning
Rep
ort
Glo
bal G
eogr
aphi
c Sa
lary
D
iffe
rent
ials
Rep
ort
Glo
bal S
tart
ing
Sala
ries
Rep
ort
Top
Man
agem
ent
Com
pens
atio
n Re
port
Gul
f Coo
pera
tion
Cou
ncil
(GCC
) Ca
sh A
llow
ance
s Su
rvey
Rep
ort
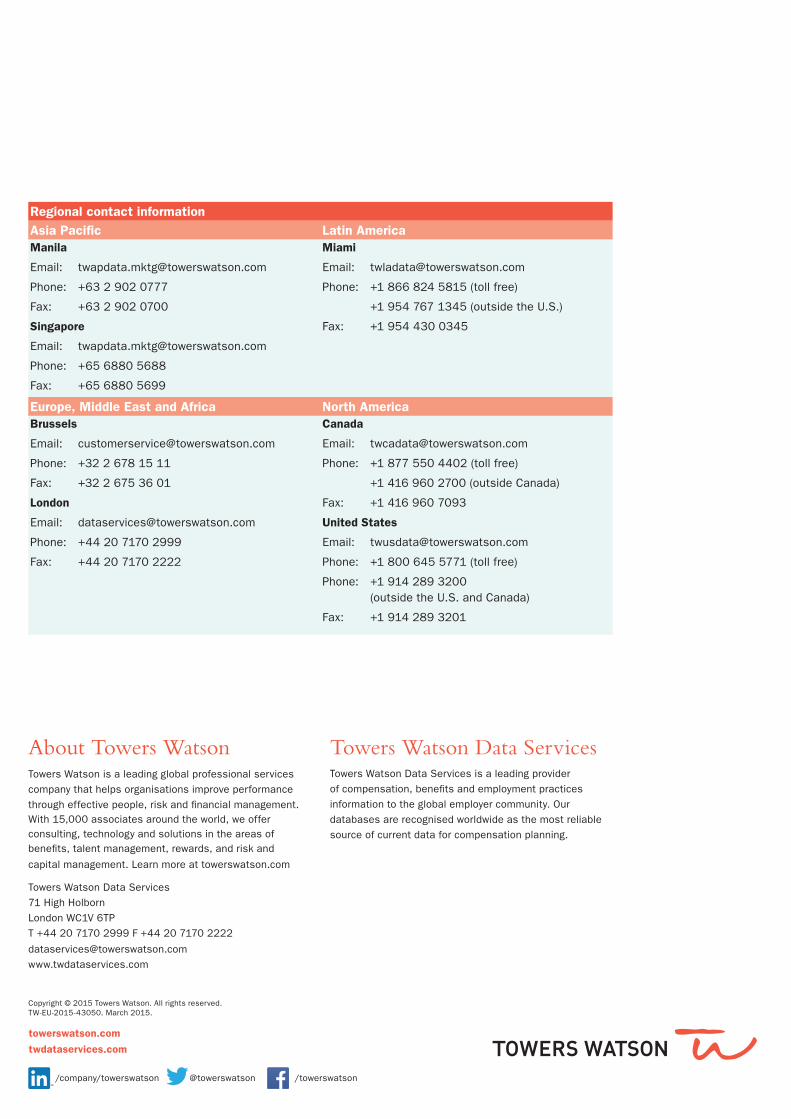
About Towers WatsonTowers Watson is a leading global professional services company that helps organisations improve performance through effective people, risk and financial management. With 15,000 associates around the world, we offer consulting, technology and solutions in the areas of benefits, talent management, rewards, and risk and
capital management. Learn more at towerswatson.com
Towers Watson Data Services 71 High Holborn London WC1V 6TP T +44 20 7170 2999 F +44 20 7170 2222
[email protected] www.twdataservices.com
Towers Watson Data ServicesTowers Watson Data Services is a leading provider of compensation, benefits and employment practices information to the global employer community. Our databases are recognised worldwide as the most reliable source of current data for compensation planning.
Regional contact informationAsia Pacific Latin AmericaManila
Email: [email protected]
Phone: +63 2 902 0777
Fax: +63 2 902 0700
Singapore
Email: [email protected]
Phone: +65 6880 5688
Fax: +65 6880 5699
Miami
Email: [email protected]
Phone: +1 866 824 5815 (toll free)
+1 954 767 1345 (outside the U.S.)
Fax: +1 954 430 0345
Europe, Middle East and Africa North AmericaBrussels
Email: [email protected]
Phone: +32 2 678 15 11
Fax: +32 2 675 36 01
London
Email: [email protected]
Phone: +44 20 7170 2999
Fax: +44 20 7170 2222
Canada
Email: [email protected]
Phone: +1 877 550 4402 (toll free)
+1 416 960 2700 (outside Canada)
Fax: +1 416 960 7093
United States
Email: [email protected]
Phone: +1 800 645 5771 (toll free)
Phone: +1 914 289 3200 (outside the U.S. and Canada)
Fax: +1 914 289 3201
/company/towerswatson @towerswatson /towerswatson
Copyright © 2015 Towers Watson. All rights reserved.TW-EU-2015-43050. March 2015.
towerswatson.com
twdataservices.com