Sal. Oppenheim – European Financials Conference 2009 · Oppenheim – European Financials...
27
Sal. Oppenheim – European Financials Conference 2009 18 November 2009, Zurich Strengthening capital base & increasing financial flexibility Gabriele Werzer, Head of Investor Relations
Transcript of Sal. Oppenheim – European Financials Conference 2009 · Oppenheim – European Financials...

Sal. Oppenheim –European Financials Conference 200918 November 2009, Zurich
Strengthening capital base & increasing financial flexibilityGabriele Werzer, Head of Investor Relations

Sal. Oppenheim – EuropeanFinancials Conference 2009
18 November 2009Zurich2
Agenda
− Transaction overview & rationale
−Erste Group’s strengths & strategy
−Summary financial results (1-9 2009)
−Conclusion

Sal. Oppenheim – EuropeanFinancials Conference 2009
18 November 2009Zurich3
This presentation is not an offer or solicitation of an offer to buy or sell securities. It is solely for use at this roadshow presentation and is provided for information only. This presentation does not contain all the information that is material to aninvestor. By attending this roadshow presentation or by reading the presentation slides you agree to be bound as follows:This presentation has been prepared by Erste Group Bank AG (the “Company”) and is confidential and does not constitute or form part of, and should not be construed as, an offer or invitation to subscribe for, underwrite or otherwise acquire, ora recommendation regarding, any securities of the Company or any member of their respective group nor should it or any part of it form the basis of or be relied on in connection with (i) any contract to purchase or subscribe for any securities ofthe Company or any member of their respective group or (ii) any other contract or commitment whatsoever. Any person considering the purchase of the securities of the Company referred to in this presentation must inform himself independentlybased solely on, and any offer or sale of securities will be made solely on the basis of, a prospectus dated 30 October 2009 and issued by the Company (and any supplement or amendment thereto), copies of which can be obtained from theCompany before taking any investment decision. Such prospectus may contain information different from the information contained herein. Any proposed terms in this presentation are indicative only and remain subject to contract. This is anadvertisement and not a prospectus.This presentation has been made to you in connection with the proposed offer and sale of the securities of the Company referred to herein, is solely for your information and background for discussion purposes only, may be amended andsupplemented and may not be relied upon for the purpose of entering into any transaction. This presentation and its contents are confidential and proprietary to the Company, and no part of it or its subject matter may be reproduced,redistributed, passed on, or the contents otherwise divulged, directly or indirectly, to any other person (excluding the relevant person’s professional advisers) or published in whole or in part for any purpose without the prior written consent ofGoldman Sachs International and J.P. Morgan Securities Ltd. (collectively, the “Managers”) and the Company. This presentation is not for distribution. This presentation, if handed out at a physical roadshow meeting or presentation, must bereturned promptly at the end of such meeting/presentation. If this presentation has been received in error it must be returned immediately to the Company.The recipients of this presentation should not base any behavior in relation to qualifying investments or relevant products (as defined in the Financial Services and Markets Act 2000 (“FSMA”) and the Code of Market Conduct made pursuant toFSMA) which would amount to market abuse for the purposes of FSMA on the information in this presentation until after the information has been made generally available. Nor should the recipient use the information in this presentation in anyway which would constitute "market abuse".This presentation is not directed at, or intended for distribution to or use by, any person or entity that is a citizen or resident or located in any locality, state, country or other jurisdiction where such distribution, publication, availability or use wouldbe contrary to law or regulation or which would require any registration or licensing within such jurisdiction.The securities proposed to be offered have not been and will not be registered under the applicable securities laws of any state or jurisdiction of Australia, Canada or Japan, and subject to certain exceptions, may not be offered or sold withinAustralia, Canada or Japan or to or for the benefit of any national, resident or citizen of Australia, Canada or Japan.Neither this presentation nor any copy hereof may be sent, or taken or distributed in the United States, Australia, Canada, Japan, or to any U.S. Person (as such term is defined in the U.S. Securities Act of 1933, as amended (the “SecuritiesAct”)), except as provided below. This presentation is only being provided to persons that are (i) “Qualified Institutional Buyers” as defined in Rule 144A under the Securities Act (“QIBs”) or (ii) persons outside the United States that are not “U.S.persons” within the meaning of Regulation S under the Securities Act. By attending this roadshow presentation or by reading the presentation slides you warrant and acknowledge that you fall within the category of persons under (i) or (ii) above.This presentation and the information contained herein are not an offer of securities for sale in the United States. The securities proposed to be offered have not been, and will not be, registered under the Securities Act and, subject to certainexceptions, may not be offered or sold within the United States or to, or for the account or benefit of, U.S. persons (as defined in Regulation S under the Securities Act). Such securities may be offered and sold (i) within the United States only toQIBs in reliance on the exemption from registration provided by Rule 144A and (ii) to non-U.S. persons in offshore transactions in reliance on Regulation S.The securities have not been nor will they be qualified for sale to the public under applicable Canadian securities laws and, accordingly, any offer and sale of the securities in Canada will be made on a basis which is exempt from the prospectusrequirements of Canadian securities laws pursuant to a Canadian offering memorandum.This presentation is only addressed to and directed at persons in member states of the European Economic Area who are "qualified investors" within the meaning of Article 2(1)(e) of the Prospectus Directive (Directive 2003/71/EC) (“QualifiedInvestors”). In addition, in the United Kingdom, this presentation is being distributed only to, and is directed only at, (i) Qualified Investors who have professional experience in matters relating to investments who fall within Article 19(5) of theFinancial Services and Markets Act 2000 (Financial Promotion) Order 2005 (the “Order”) and Qualified Investors falling within Article 49(2)(a) to (d) of the Order, and (ii) Qualified Investors to whom it may otherwise lawfully be communicated (allsuch persons together being referred to as “relevant persons”). This presentation must not be acted on or relied on (i) in the United Kingdom, by persons who are not relevant persons, and (ii) in any member state of the European Economic Areaother than the United Kingdom, by persons who are not Qualified Investors. Any investment or investment activity to which this presentation relates is available only to (i) in the United Kingdom, relevant persons, and (ii) in any member state ofthe European Economic Area other than the Untied Kingdom, Qualified Investors, and will be engaged in only with such persons. Other persons should not rely on or act upon this presentation or any of its contents.Certain statements in this presentation constitute “forward-looking statements”. The words “believe”, “expect”, “anticipate”, “intend”, “plan” and similar expressions or their negatives identify forward-looking statements. All statements other thanhistorical facts included in this presentation including, without limitation, those regarding the Company’s financial position, business strategy, plans and objectives of management for future operations (including development plans and objectivesrelated to their products), are forward-looking statements. Such forward-looking statements involve known and unknown risks, uncertainties and other factors, including those described in more detail in the prospectus dated 30 October 2009under the heading "Risk Factors" and factors, which are presently unknown to or not currently considered material by the Company, which may cause the Company’s actual results, performance or achievements to be materially different fromany future results, performances or achievements expressed or implied by such forward-looking statements. Past performance of the Company cannot be related upon as a guide for further performance.Such forward-looking statements are based on numerous assumptions regarding the Company’s present and future business strategies and the environment in which the Company will operate in the future. Furthermore, certain forward-lookingstatements are based on assumptions or future events which may not prove to be accurate. The forward-looking statements in this presentation speak only as of the date of this presentation, and the Company is under no obligation to updateany information contained in this presentation, including the forward-looking statements.The information in this presentation has not been independently verified, including by any of the Managers. No representation or warranty, express or implied, is made as to the fairness, accuracy or completeness of the presentation and theinformation contained herein and no reliance should be placed on it. Information other than indicative terms (including market data and statistical information) has been obtained from various sources. All projections, valuations and statisticalanalyses are provided to assist the recipient in the evaluation of matters described herein. They may be based on subjective assessments and assumptions and may use one among alternative methodologies that produce different results and tothe extent they are based on historical information, they should not be relied upon as an accurate prediction of future performance. None of the Managers, the Company their respective advisers, connected persons or any other person acceptsany liability whatsoever for any loss howsoever arising, directly or indirectly, from this presentation or its contents. The information contained herein is subject to change without notice and past performance is not indicative of future results.The Managers or their respective nominated affiliates are acting for the Company and no one else in connection with the proposals referred to in this presentation and will not be responsible to any other person for providing the protectionsafforded to their clients, or for providing advice in relation to such proposals.By attending this presentation you agree to be bound by the foregoing limitations.
Disclaimer
Sal. Oppenheim – EuropeanFinancials Conference 2009
18 November 2009Zurich4
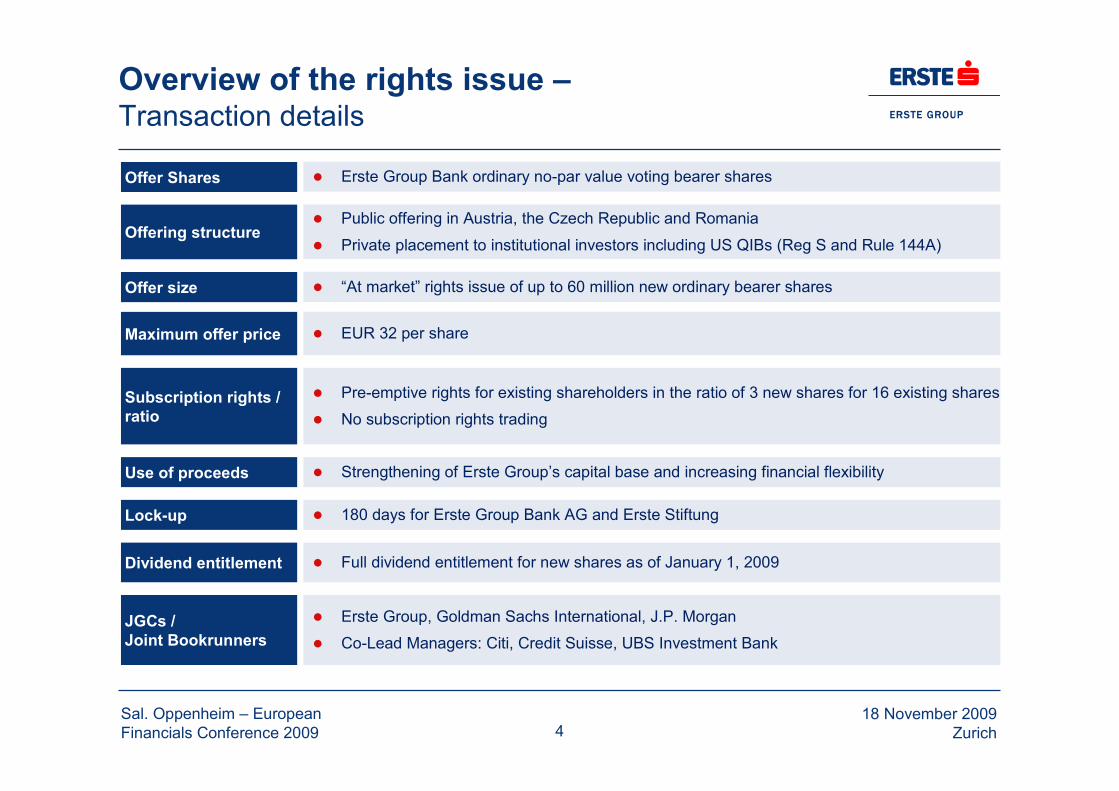
Offer Shares � Erste Group Bank ordinary no-par value voting bearer shares
Subscription rights /ratio
� Pre-emptive rights for existing shareholders in the ratio of 3 new shares for 16 existing shares
� No subscription rights trading
Maximum offer price � EUR 32 per share
Use of proceeds � Strengthening of Erste Group’s capital base and increasing financial flexibility
Offering structure� Public offering in Austria, the Czech Republic and Romania
� Private placement to institutional investors including US QIBs (Reg S and Rule 144A)
Lock-up � 180 days for Erste Group Bank AG and Erste Stiftung
JGCs /Joint Bookrunners
� Erste Group, Goldman Sachs International, J.P. Morgan
� Co-Lead Managers: Citi, Credit Suisse, UBS Investment Bank
Offer size � “At market” rights issue of up to 60 million new ordinary bearer shares
Dividend entitlement � Full dividend entitlement for new shares as of January 1, 2009
Overview of the rights issue –Transaction details

Sal. Oppenheim – EuropeanFinancials Conference 2009
18 November 2009Zurich5
November 2, 2009Monday
November 16, 2009Monday
November 17, 2009Tuesday
November 19, 2009Thursday
� Approval and publication of prospectus
� Record date
� Start of offer period and subscription period� Start of management roadshow
� End of subscription period
� End of offer period� Pricing and allocation
� First day of trading of new shares
October 30, 2009Friday
November 20, 2009Friday
� Settlement & Closing
Key dates of the rights issue –Expected timetable

Sal. Oppenheim – EuropeanFinancials Conference 2009
18 November 2009Zurich6
Transaction rationale –Enhance capital ratios and increase financial flexibility
− Further increase capital ratios and improve capital structure1
− Increases core tier 1 capital by more than 20% resulting in core tier 1 ratio of 7.8%
− Improves capital mix with core tier 1 contribution to tier 1 capital increasing to 89%
− Raises common equity in public markets instead of previously planned issuance of government-sponsored hybrid capital
− Builds on successful issuance of EUR 1,764 million participation capital at market rates to Republicof Austria and private investors in the first half of 2009
− Provide flexibility for potential new or changed regulatory capital requirements andaddress market expectations of higher capitalisation levels
− Maintain ability to benefit from future growth opportunities in CEE− CEE economies are expected to grow faster than EU-15
− CEE banking market development to benefit from lower financial intermediation levels than in EU-15
¹ Pro forma capital ratios and other figures as of 30 September 2009. Assumes rights issue proceeds based on a share price of EUR 27.5 (closing price at Vienna Stock Exchange) asof 29 October 2009.

Sal. Oppenheim – EuropeanFinancials Conference 2009
18 November 2009Zurich7
Q3 09 pro formaQ3 09
Tier 1 ratio(credit risk)1
+155 bps 10.2%
Q3 09 pro formaQ3 09
Core tier 1 ratio(total risk)3
+134 bps
Q3 09 pro formaQ3 09
Transaction rationale –Stronger capital ratios post EUR 1.65 bn rights issue
Note: Assumes rights issue proceeds based on a share price of EUR 27.5 (closing price at Vienna Stock Exchange) as of 29 October 2009.
1) Tier 1 ratio (credit risk) = tier 1 capital incl. hybrid and after regulatory deductions divided by credit RWA.
2) Tier 1 ratio (total risk) = tier 1 capital incl. hybrid and after regulatory deductions divided by total RWA (which includes credit risk, market and operational risk).
3) Core tier 1 ratio (total risk) = tier 1 capital excl. hybrid and after regulatory deductions divided by total RWA (which includes credit risk, market and operational risk).
Tier 1 ratio(total risk)2
+134 bps
− Pro forma coretier 1 ratio inline with proforma ratiosannounced byEuropeanbanks in recentrights issues
− Transactionrepresentssignificantstrengtheningof capitallevels andquality
8.6%
7.4%
8.8%
6.5%
7.8%

Sal. Oppenheim – EuropeanFinancials Conference 2009
18 November 2009Zurich8
Participation of shareholders –Criteria will subscribe to 36% of the offering
Erste Stiftung� Erste Stiftung has agreed to
transfer all of its subscriptionrights to Criteria
Criteria CaixaCorp,S.A.
� Criteria announced that it will:� exercise all of its own
subscription rights,� has acquired and will
exercise all of Erste Stiftung’ssubscription rights
� This amounts in total to approx.36% of all subscription rights
� Erste Group entered intocooperation agreement in June2009
� Partners: Criteria and LaCaixa, one of Spain’s largestbanking groups
� Scope: Non-exclusivecommercial cooperation
Shareholder structure¹
¹ As of October 2009
Austria Verein5%Criteria
CaixaCorp S.A.5%
Institutionalinvestors
40%
Privateinvestors
7%
Savings banks8%
Employees4%
31%
Sal. Oppenheim – EuropeanFinancials Conference 2009
18 November 2009Zurich9
Agenda
− Transaction overview & rationale
−Erste Group’s strengths & strategy
−Summary financial results (1-9 2009)
−Conclusion
Sal. Oppenheim – EuropeanFinancials Conference 2009
18 November 2009Zurich10
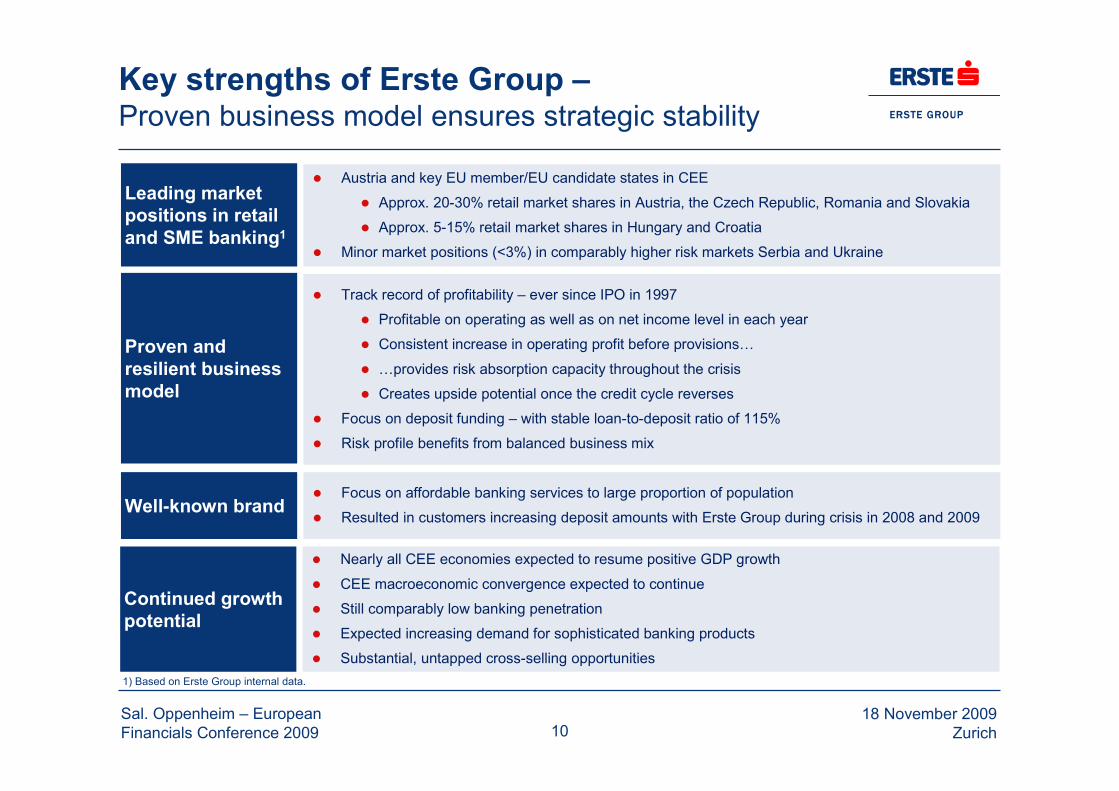
Well-known brand� Focus on affordable banking services to large proportion of population
� Resulted in customers increasing deposit amounts with Erste Group during crisis in 2008 and 2009
Leading marketpositions in retailand SME banking1
� Austria and key EU member/EU candidate states in CEE
� Approx. 20-30% retail market shares in Austria, the Czech Republic, Romania and Slovakia
� Approx. 5-15% retail market shares in Hungary and Croatia
� Minor market positions (<3%) in comparably higher risk markets Serbia and Ukraine
Proven andresilient businessmodel
� Track record of profitability – ever since IPO in 1997
� Profitable on operating as well as on net income level in each year
� Consistent increase in operating profit before provisions…
� …provides risk absorption capacity throughout the crisis
� Creates upside potential once the credit cycle reverses
� Focus on deposit funding – with stable loan-to-deposit ratio of 115%
� Risk profile benefits from balanced business mix
Continued growthpotential
� Nearly all CEE economies expected to resume positive GDP growth
� CEE macroeconomic convergence expected to continue
� Still comparably low banking penetration
� Expected increasing demand for sophisticated banking products
� Substantial, untapped cross-selling opportunities
Key strengths of Erste Group –Proven business model ensures strategic stability
1) Based on Erste Group internal data.

Sal. Oppenheim – EuropeanFinancials Conference 2009
18 November 2009Zurich1111
Erste Group in CEE –A market leader in the eastern part of the European Union
Indirect presence
Non-EU or non-EU candidate country
Total population: 120m
Bankable population: 92m
Total customers: 17.5m
Total group facts
Total population: 60m
Customer base: 17.1m
20-30% retail market share:Austria, Czech Republic, Romania and Slovakia
5-15% retail market share:Hungary, Croatia
EU fact sheet ofErste Group
EU share of loans and deposits > 99%
EU or EU-candidate country

Sal. Oppenheim – EuropeanFinancials Conference 2009
18 November 2009Zurich12
Long-term track record of profitability –Higher margins & efficiency drive operating profit
Net interest margin development
1.73% 1.72% 1.60% 1.77% 1.93%
2.22% 2.31% 2.49%2.84% 2.98%
4.15%4.56% 4.63%
3.72% 3.80%
1%
2%
3%
4%
5%
2005 2006 2007 2008 1-9 09
Austria CEE Group
Operating profit of Erste Group
1.21.4
1.8
2.2
2.8
0.0
0.5
1.0
1.5
2.0
2.5
3.0
1-9 05 1-9 06 1-9 07 1-9 08 1-9 09
in E
UR
bill
ion
CAGR = 24%
Note: Net interest margin computed on average interest bearing assets and local entity IFRS consolidated results. Cost/income ratio = general administrative expenses as a percentageof operating income (net interest income + net fee and commission income + net trading result); operating result = operating income - general administrative expenses.
Cost/income ratio
61.7%59.5% 59.2%
57.2%
50.9%50%
55%
60%
65%
70%
2005 2006 2007 2008 1-9 09

Sal. Oppenheim – EuropeanFinancials Conference 2009
18 November 2009Zurich13
Long-term track record of profitability –Growing pre- and resilient post-provision profit generation
Erste Group's operating profit history (pre-provision profit)
468 463 514 614 597 510 484 334 468 416 443
128 111 97119 163 221 218 469
370 522 557597 573 610732 761 731 703
804 839938 1,001
0
250
500
750
1,000
1,250
Q1 07 Q2 07 Q3 07 Q4 07 Q1 08 Q2 08 Q3 08 Q4 08 Q1 09 Q2 09 Q3 09
in E
UR
mill
ion
Post-provision profit Risk provisions
.
13
Segment CEE (Retail & SME) - Operating profit history (pre-provision profit)
224 247 318 324 375 362 361 360253 224 214
39 4125 55
69 86 108 178174 289 363
263 288 343 379444 448 468
538427
513576
0
250
500
750
Q1 07 Q2 07 Q3 07 Q4 07 Q1 08 Q2 08 Q3 08 Q4 08 Q1 09 Q2 09 Q3 09
in E
UR
mill
ion
Post-provision profit Risk provisions
.
Sal. Oppenheim – EuropeanFinancials Conference 2009
18 November 2009Zurich14
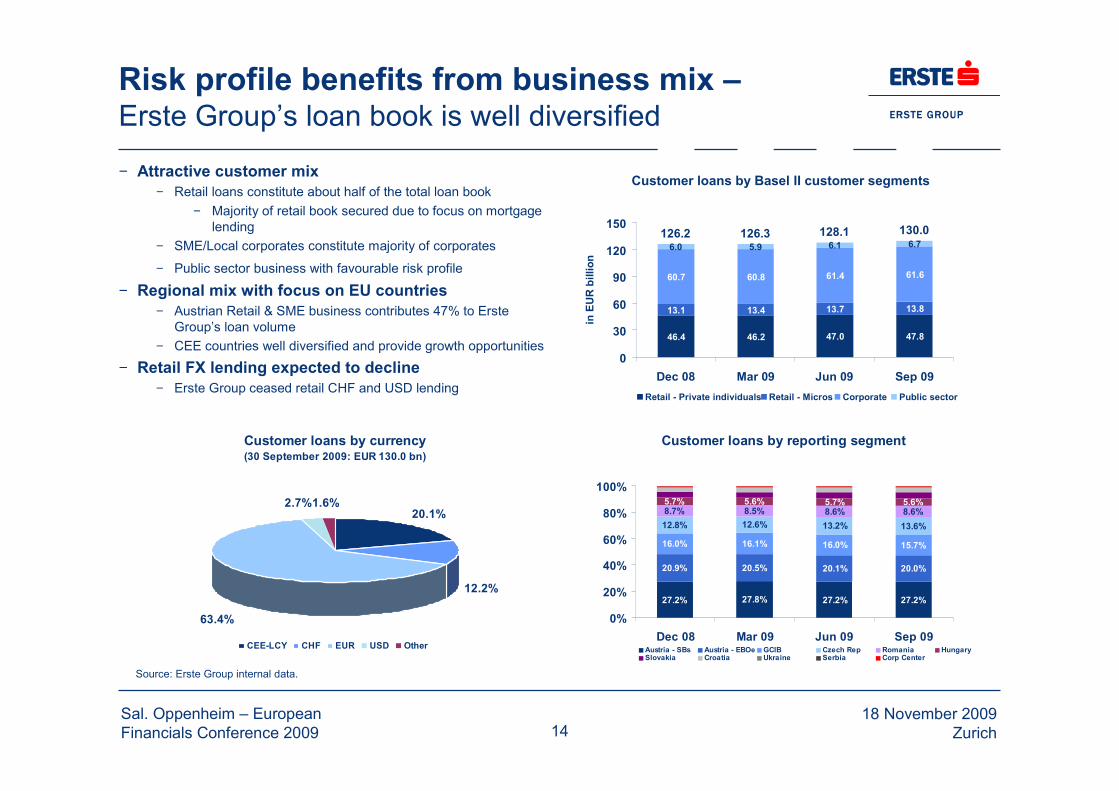
− Attractive customer mix− Retail loans constitute about half of the total loan book
− Majority of retail book secured due to focus on mortgagelending
− SME/Local corporates constitute majority of corporates
− Public sector business with favourable risk profile
− Regional mix with focus on EU countries− Austrian Retail & SME business contributes 47% to Erste
Group’s loan volume− CEE countries well diversified and provide growth opportunities
− Retail FX lending expected to decline− Erste Group ceased retail CHF and USD lending
Risk profile benefits from business mix –Erste Group’s loan book is well diversified
Source: Erste Group internal data.
Customer loans by reporting segment
27.2% 27.8% 27.2% 27.2%
20.9% 20.5% 20.1% 20.0%
16.0% 16.1% 16.0% 15.7%
12.8% 12.6% 13.2% 13.6%8.7% 8.5% 8.6% 8.6%5.7% 5.6% 5.7% 5.6%
0%
20%
40%
60%
80%
100%
Dec 08 Mar 09 Jun 09 Sep 09Austria - SBs Austria - EBOe GCIB Czech Rep Romania HungarySlovakia Croatia Ukraine Serbia Corp Center
Customer loans by currency(30 September 2009: EUR 130.0 bn)
20.1%
12.2%
2.7%
63.4%
1.6%
CEE-LCY CHF EUR USD Other
Customer loans by Basel II customer segments
46.4 46.2 47.0 47.8
13.1 13.4 13.7 13.8
60.8 61.4 61.6
6.0 5.9 6.1 6.7126.2 126.3 128.1 130.0
60.7
0
30
60
90
120
150
Dec 08 Mar 09 Jun 09 Sep 09
in E
UR
bill
ion
Retail - Private individuals Retail - Micros Corporate Public sector

Sal. Oppenheim – EuropeanFinancials Conference 2009
18 November 2009Zurich15
Risk profile benefits from business mix –Deceleration of NPL formation and improved coverage
Note: NPL coverage ratios in key markets based on country of origination concept. Overall NPL ratio and NPL coverage ratio based on customer loans.
Erste Group: NPL ratio vs NPL coverage
4.7% 5.2% 5.9% 6.3%
62.8%
59.3%
55.2%56.7%
0%
5%
10%
15%
20%
25%
30%
Dec 08 Mar 09 Jun 09 Sep 0950%
55%
60%
65%
NPL ratio NPL coverage (ex coll)
Quarterly NPL growth (absolute/relative)
456
730
987
531
8.4%
12.4%
14.9%
7.0%
0
400
800
1,200
1,600
Dec 08 Mar 09 Jun 09 Sep 09
in E
UR
mill
ion
0%
4%
8%
12%
16%
NPL growth (absolute) NPL growth (relative)
− NPL growth slowed down in Q3 09− NPL ratio rose by 40 bps to 6.3% after a rise of 70 bps in Q2 09
on the back of slowing new formation in CEE and a decline inNPL ratio in Austria
− Slowdown of new NPL formation in corporate business wasmore significant than in the retail business
− CEE NPL ratios deteriorated most in Romania and Ukraine,while Hungary performed comparatively well
− NPL coverage improved in Q3 09− Stabilising coverage ratios in Romania and Hungary− Continued high collateral coverage
NPL coverage ratios in key markets
57.7% 62.1% 56.5%
75.6%
45.9%
70.3%
0%
40%
80%
120%
Austria Czech R Romania Slovakia Hungary CroatiaDec 08 Mar 09 Jun 09 Sep 09

Sal. Oppenheim – EuropeanFinancials Conference 2009
18 November 2009Zurich16
Tier 1 capital composition
4.9 5.4 6.2 6.27.9
0.00.0
1.8
1.8
1.3 1.21.3
1.2
1.2
6.2 6.7 7.49.2
10.8
0.0
0
3
6
9
12
Dec 06 Dec 07 Dec 08 Sep 09 Pro-formapost-CI
in E
UR
bill
ion
Core Tier I capital Participation capital Hybrid Tier I capital
Strongly improving capital position –Increasing share of high quality, core tier 1 capital
− Strengthen capital base− Increase Erste Group's overall financial flexibility− Prepare Erste Group for potential changes in the
regulatory environment and investors’ expectations− Allow Erste Group to finance growth in CEE
− Higher quality capital structure− Share of core tier 1 capital in capital structure to rise
to 89%, while hybrid capital will decline to 11%− Common equity raised in the public markets instead
of previously planned issuance of government-sponsored hybrid capital
− Participation capital to be retained− Raised at market terms with Republic of Austria and
private investors− Government investment limited to EUR 1,224m− Core tier 1 eligible
Key capital ratios
6.6% 7.0% 7.2%8.6%
10.2%
5.0% 5.0% 5.2%6.5%
7.8%
6.1%6.2%
8.8%7.4%
6.2%4.0%
6.0%
8.0%
10.0%
12.0%
Dec 06 Dec 07 Dec 08 Sep 09 Pro-formapost-CI
TIER I ratio (credit risk) Tier I ratio (total risk) Core TIER I ratio
¹ Assumes rights issue proceeds based on Erste Group share price of EUR 27.5 (closing price at Vienna Stock Exchange) as of 29 October 2009.
Sal. Oppenheim – EuropeanFinancials Conference 2009
18 November 2009Zurich1717
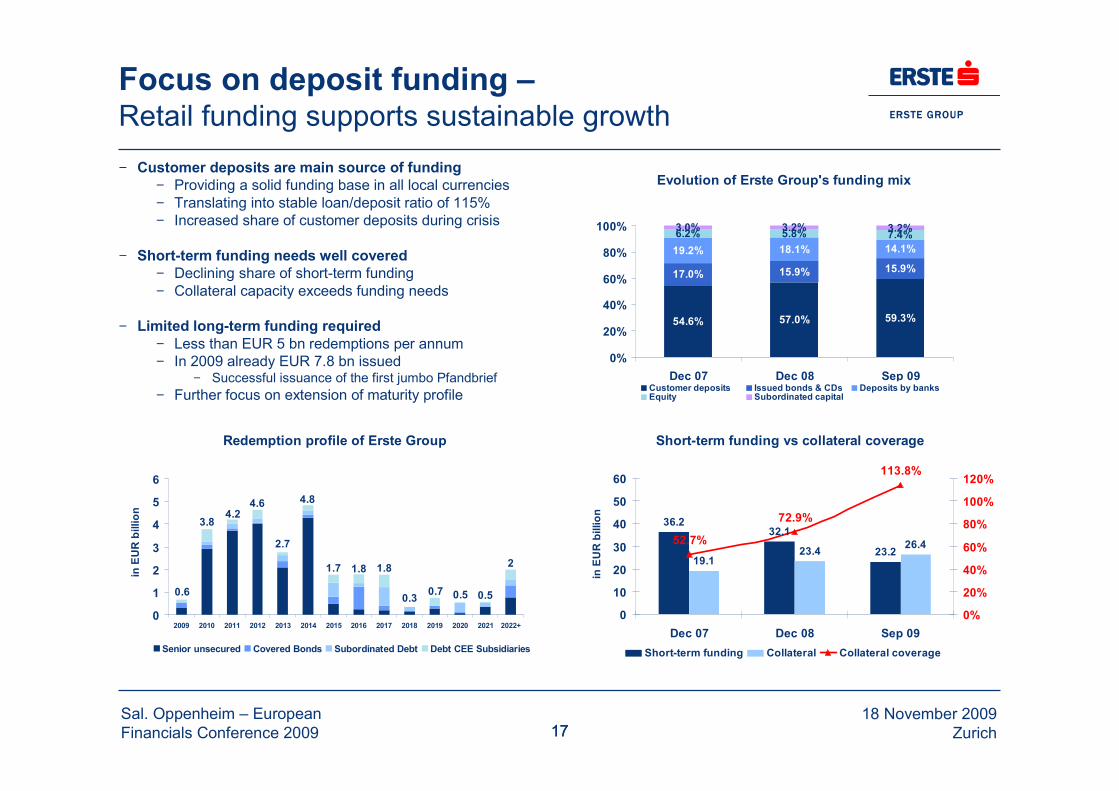
Focus on deposit funding –Retail funding supports sustainable growth− Customer deposits are main source of funding
− Providing a solid funding base in all local currencies− Translating into stable loan/deposit ratio of 115%− Increased share of customer deposits during crisis
− Short-term funding needs well covered− Declining share of short-term funding− Collateral capacity exceeds funding needs
− Limited long-term funding required− Less than EUR 5 bn redemptions per annum− In 2009 already EUR 7.8 bn issued
− Successful issuance of the first jumbo Pfandbrief− Further focus on extension of maturity profile
Evolution of Erste Group's funding mix
54.6% 57.0% 59.3%
17.0% 15.9% 15.9%19.2% 18.1% 14.1%6.2% 5.8% 7.4%3.0% 3.2% 3.2%
0%
20%
40%
60%
80%
100%
Dec 07 Dec 08 Sep 09Customer deposits Issued bonds & CDs Deposits by banksEquity Subordinated capital
Short-term funding vs collateral coverage
36.232.1
23.219.1
23.4 26.452.7%
72.9%
113.8%
0
10
20
30
40
50
60
Dec 07 Dec 08 Sep 09
in E
UR
bill
ion
0%
20%
40%
60%
80%
100%
120%
Short-term funding Collateral Collateral coverage
Redemption profile of Erste Group
4.6
1.7
4.8
2.7
4.23.8
1.8 1.8
0.3 0.7 0.5 0.5
2
0.6
0
1
2
3
4
5
6
2009 2010 2011 2012 2013 2014 2015 2016 2017 2018 2019 2020 2021 2022+
in E
UR
bill
ion
Senior unsecured Covered Bonds Subordinated Debt Debt CEE Subsidiaries

Sal. Oppenheim – EuropeanFinancials Conference 2009
18 November 2009Zurich18
Continued growth potential –CEE economies expected to recover in 2010
− CEE economies expected to contract in 2009 butintensity of macro pressure is easing− First signs of stabilisation, supported by global
stabilisation packages
− Consumer confidence on the rise− Gradual improvement in CZ, RO, HU and SK
− Improving current account balances− Romanian current account deficit almost fully
covered by foreign direct investments in 2009
− Lower levels of public debt
− CEE’s competitive advantages are still in place− CEE remains an attractive investment
destination− Attractive tax regimes− Labour market flexibility and productivity− Educated workforce
Source: Chart data based on Economist Intelligence Unit.
Current account balance outlook for CEE
-5.1
%
-4.0
%
-6.0
%
-0.4
%
-2.3
%
-5.2
%
-4.5
%
-3.3
%
-5.3
%
-12.
4% -6.7
%
-8.4
%
3.4%
-3.1
%
-9.2
%
-1.1
%
-2.1
% -2.8
%
-15%
-10%
-5%
0%
5%
Austria Czech R Romania Slovakia Hungary Croatia
2008 2009e 2010e
Real GDP outlook for CEE
-7.5
%
-5.5
%
-5.4
%
0.5%
0.9%
1.0%
1.5%
-1.0
%
0.5%2.
4%
2.7%
1.7%
0.6%
6.4%7.1%
-7.0
%
-4.3
%
-3.5
%
-15%
-10%
-5%
0%
5%
10%
Austria Czech R Romania Slovakia Hungary Croatia
2008 2009e 2010e

Sal. Oppenheim – EuropeanFinancials Conference 2009
18 November 2009Zurich19
CEE GDP/capita as % of EU-15 GDP/capita
26% 25%
49%48% 49%
20% 20%
36%33% 33%
8% 7% 8%
22%21%22%
40%42%
26%
22%
16%18%18%
41%
0%
10%
20%
30%
40%
50%
60%
1998
1999
2000
2001
2002
2003
2004
2005
2006
2007
2008
2009
e20
10e
Czech Rep Hungary Romania Slovakia
Continued growth potential –CEE macroeconomic convergence is set to continue
Financial intermediation in CEE (2008)
69%
39%
16%
24%
47%45%
23%19%
29%25%
0%
20%
40%
60%
80%
Austri
a
Czech
R
Roman
ia
Hungary
Slovakia
Household deposits/GDP Household loans/GDP
CEE impacted byinternational financial crisis
CEE impactedby Asian crisis
Source: Economist Intelligence Unit (left), Eurostat & national banks of the respective countries (right).

Sal. Oppenheim – EuropeanFinancials Conference 2009
18 November 2009Zurich20
Continued growth potential –Underpenetration creates demand for banking services
− Product ownership of Erste Group’sCEE customer base remains low− Only 10%-20% of existing customers have an
unsecured consumer loan− Only 2%-20% of existing clients have a
mortgage or home equity loan�Erste Group expects to benefit from cross-
selling opportunities among the existingcustomer base
− Average loan sizes still small− Size of mortgages is comparatively low as
consequence of− Early stage of market development− Erste Group risk management approach
�Ability to grow lending volumes with existingcustomer base
# of customers vs # of loan accounts (Aug 09)
5,2754,645
850
2,555
865 71179 238113 86 152 74
0
1,000
2,000
3,000
4,000
5,000
6,000
Czech Rep Romania Hungary Slovakia
in th
ousa
nd
# of customers # of unsecured consumer loans# of mortgage/home equity loans
Average loan sizes (Aug 09)
48
26 2630
21
32
18 22
3 3 2 30
10
20
30
40
50
60
Czech Rep Romania Hungary Slovakia
in E
UR
thou
sand
Mortgage Home equity loan Unsecured consumer loan
Source: Chart data based on Erste Group internal data (bank only).

Sal. Oppenheim – EuropeanFinancials Conference 2009
18 November 2009Zurich21
Agenda
− Transaction overview & rationale
−Erste Group’s strengths & strategy
−Summary financial results (1-9 2009)
−Conclusion

Sal. Oppenheim – EuropeanFinancials Conference 2009
18 November 2009Zurich22
1-9 09 financial highlights –Executive summary
− Erste Group’s strong performance continued with a record operating result of EUR 2,776.9m inthe first nine months 2009− Operating result increased by 26.6% compared to 1-9 08 – supported by a 7.8% increase in revenues and a
substantial decline in administrative expenses (- 5.7%)− Best ever operating result of EUR 1,000.5m in Q3 09 was supported by a record operating performance in the core
Retail & SME segment in Austria and CEE in Q3 09− Stable net interest margin at 2.98% per 1-9 09 (H1 09: 2.84%)− CIR improved to record low of 50.9%
− Operating environment remained challenging despite first signs of recovery in 1-9 09− Moderately growing loan demand both from retail and corporate customers in Austria and CEE
− Total customer loans at Erste Group increased by 3.0% compared to YE 08
− Improved NPL coverage1, as risk costs increased and formation of new NPLs decelerated− NPL ratio based on total customer loans increased to 6.3% in 1-9 09 (H1 09: 5.9%)− Quarterly increase of NPL ratio of 40bps in Q3 09 well below 70bps in Q2 09− Risk costs on average loans of 151bps in 1-9 09 (H1 09: 141bps)− NPL coverage based on total customer loans improved to 56.7% (H1 09: 55.2%)
− Tier 1 ratio (credit risk) improved to 8.6% (YE 08: 7.2%)− Tier 1 ratio (total risk) improved to 7.4% (YE 08: 6.2%)− Core tier 1 ratio (total risk) improved to 6.5% (YE 08: 5.2%)− Including EUR 1.76bn of participation capital issued in H1 09− Increase of RWA by 2.8% compared to YE 08
1) To improve transparency all ratios with regards to asset quality are referring to total customer loans. NPLs over total exposure increased to 3.8% in Q3 09 (after 3.6% at H1 09).

Sal. Oppenheim – EuropeanFinancials Conference 2009
18 November 2009Zurich23
Group income statement (IFRS) –Cost/income ratio improves to historic low
in EUR million 1-9 09 1-9 08 Change Q3 09 Q2 09 Q3 08Net interest income 3,840.9 3,573.3 7.5% 1,335.6 1,279.3 1,267.3Risk provisions for loans and advances (1,449.2) (602.3) >100.0% (557.1) (521.9) (218.2)Net fee and commission income 1,313.3 1,489.0 (11.8%) 425.1 443.6 486.8Net trading result 503.0 184.9 >100.0% 159.9 199.3 0.5General administrative expenses (2,880.3) (3,053.7) (5.7%) (920.1) (984.3) (1,052.1)Other operating result (201.8) (141.0) (43.1%) (114.3) (47.6) (56.2)Result from financial assets - FV 56.4 (114.9) na 68.5 32.0 (35.0)Result from financial assets - AfS (106.4) (11.6) na (87.7) (7.9) (5.1)Result from financial assets - HtM 2.0 (1.9) na 2.9 (0.8) (2.0)Pre-tax profit from continuing operations 1,077.9 1,321.8 (18.5%) 312.8 391.7 386.0Taxes on income (269.6) (264.4) 2.0% (78.3) (107.3) (77.2)Post-tax profit from discontinuing ops 0.0 610.2 na 0.0 0.0 600.1Minority interests (88.2) (204.6) (56.9%) (6.5) (24.4) (82.5)Net profit after minorities 720.1 1,463.0 (50.8%) 228.0 260.0 826.4
Operating income 5,657.2 5,247.2 7.8% 1,920.6 1,922.2 1,754.6Operating expenses (2,880.3) (3,053.7) (5.7%) (920.1) (984.3) (1,052.1)Operating result 2,776.9 2,193.5 26.6% 1,000.5 937.9 702.5
Cost/income ratio 50.9% 58.2% 47.9% 51.2% 60.0%Return on equity 10.3% 21.7% 8.8% 11.4% 34.2%
Sal. Oppenheim – EuropeanFinancials Conference 2009
18 November 2009Zurich24
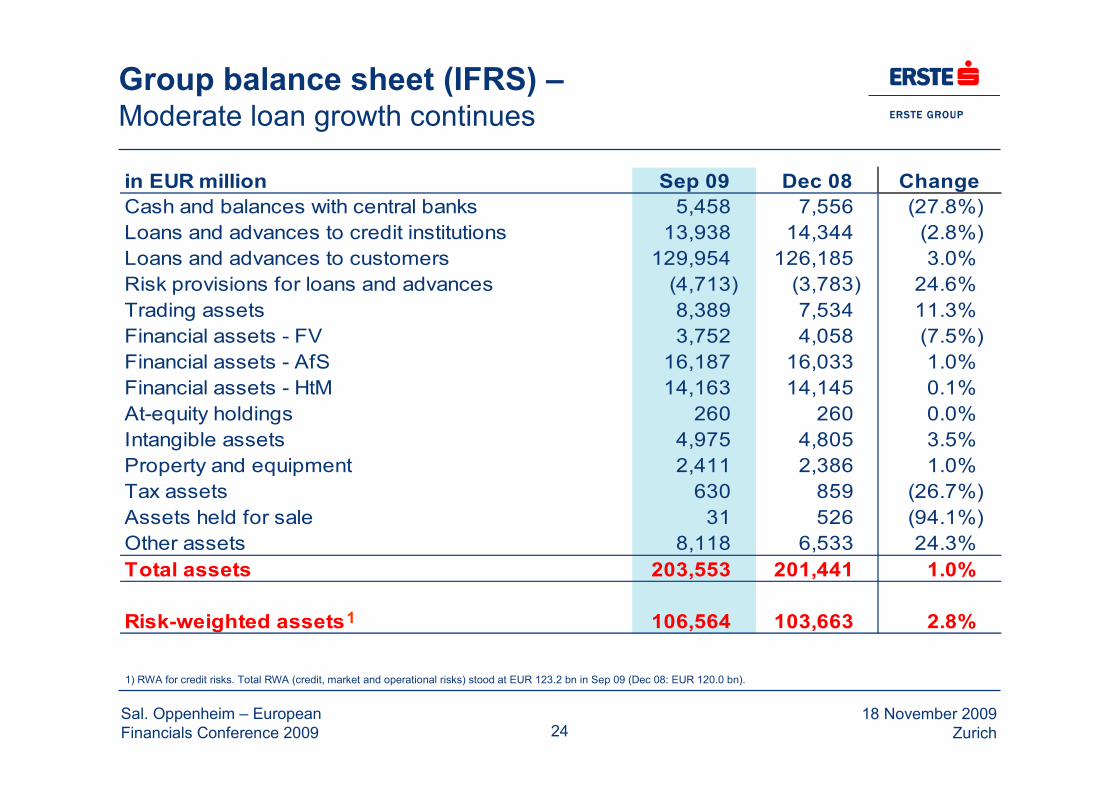
Group balance sheet (IFRS) –Moderate loan growth continues
in EUR million Sep 09 Dec 08 ChangeCash and balances with central banks 5,458 7,556 (27.8%)Loans and advances to credit institutions 13,938 14,344 (2.8%)Loans and advances to customers 129,954 126,185 3.0%Risk provisions for loans and advances (4,713) (3,783) 24.6%Trading assets 8,389 7,534 11.3%Financial assets - FV 3,752 4,058 (7.5%)Financial assets - AfS 16,187 16,033 1.0%Financial assets - HtM 14,163 14,145 0.1%At-equity holdings 260 260 0.0%Intangible assets 4,975 4,805 3.5%Property and equipment 2,411 2,386 1.0%Tax assets 630 859 (26.7%)Assets held for sale 31 526 (94.1%)Other assets 8,118 6,533 24.3%Total assets 203,553 201,441 1.0%
Risk-weighted assets 106,564 103,663 2.8%
1) RWA for credit risks. Total RWA (credit, market and operational risks) stood at EUR 123.2 bn in Sep 09 (Dec 08: EUR 120.0 bn).
1

Sal. Oppenheim – EuropeanFinancials Conference 2009
18 November 2009Zurich25
Group balance sheet (IFRS) –Customer deposits continue to outgrow loans
in EUR million Sep 09 Dec 08 ChangeDeposits by banks 26,920 34,672 (22.4%)Customer deposits 113,317 109,305 3.7%Debt securities in issue 30,431 30,483 (0.2%)Trading liabilities 3,175 2,519 26.0%Other provisions 1,670 1,620 3.1%Tax liabilities 459 389 18.0%Liabilities associated with assets held for sale 0 343 naOther liabilities 7,314 4,968 47.2%Subordinated liabilities 6,184 6,047 2.3%Total equity 14,083 11,095 26.9%
Shareholders‘ equity 10,667 8,079 32.0%Minority interests 3,416 3,016 13.3%
Total liabilities and equity 203,553 201,441 1.0%
Tier 1 ratio (credit risk) 8.6% 7.2%Solvency ratio 10.9% 9.8%

Sal. Oppenheim – EuropeanFinancials Conference 2009
18 November 2009Zurich26
Agenda
− Transaction overview & rationale
−Erste Group’s strengths & strategy
−Summary financial results (1-9 2009)
−Conclusion
Sal. Oppenheim – EuropeanFinancials Conference 2009
18 November 2009Zurich27
Conclusion –Improved capital ratio allows to leverage the franchise
−Our key strengths…− Leading market positions in retail and SME banking− Proven and resilient business model−Well-known brand− Continued growth potential
−… and our strategic focus…− Business focus on retail and SME banking− Geographic focus on Austria and CEE− Efficiency focus
−… result in attractive profile …− Stability of business model demonstrated by performance throughout crisis− Largely deposit-funded− Earnings generation – despite currently elevated provisioning levels during the crisis
−… which will be supported by further strengthened capital ratio