SAGE II measurements of stratospheric aerosol properties ...
14
HAL Id: hal-00296457 https://hal.archives-ouvertes.fr/hal-00296457 Submitted on 26 Feb 2008 HAL is a multi-disciplinary open access archive for the deposit and dissemination of sci- entific research documents, whether they are pub- lished or not. The documents may come from teaching and research institutions in France or abroad, or from public or private research centers. L’archive ouverte pluridisciplinaire HAL, est destinée au dépôt et à la diffusion de documents scientifiques de niveau recherche, publiés ou non, émanant des établissements d’enseignement et de recherche français ou étrangers, des laboratoires publics ou privés. SAGE II measurements of stratospheric aerosol properties at non-volcanic levels Larry W. Thomason, S. P. Burton, B.-P. Luo, T. Peter To cite this version: Larry W. Thomason, S. P. Burton, B.-P. Luo, T. Peter. SAGE II measurements of stratospheric aerosol properties at non-volcanic levels. Atmospheric Chemistry and Physics, European Geosciences Union, 2008, 8 (4), pp.983-995. hal-00296457
Transcript of SAGE II measurements of stratospheric aerosol properties ...

HAL Id: hal-00296457https://hal.archives-ouvertes.fr/hal-00296457
Submitted on 26 Feb 2008
HAL is a multi-disciplinary open accessarchive for the deposit and dissemination of sci-entific research documents, whether they are pub-lished or not. The documents may come fromteaching and research institutions in France orabroad, or from public or private research centers.
L’archive ouverte pluridisciplinaire HAL, estdestinée au dépôt et à la diffusion de documentsscientifiques de niveau recherche, publiés ou non,émanant des établissements d’enseignement et derecherche français ou étrangers, des laboratoirespublics ou privés.
SAGE II measurements of stratospheric aerosolproperties at non-volcanic levels
Larry W. Thomason, S. P. Burton, B.-P. Luo, T. Peter
To cite this version:Larry W. Thomason, S. P. Burton, B.-P. Luo, T. Peter. SAGE II measurements of stratosphericaerosol properties at non-volcanic levels. Atmospheric Chemistry and Physics, European GeosciencesUnion, 2008, 8 (4), pp.983-995. �hal-00296457�

Atmos. Chem. Phys., 8, 983–995, 2008www.atmos-chem-phys.net/8/983/2008/© Author(s) 2008. This work is licensedunder a Creative Commons License.
AtmosphericChemistry
and Physics
SAGE II measurements of stratospheric aerosol properties atnon-volcanic levels
L. W. Thomason1, S. P. Burton2, B.-P. Luo3, and T. Peter3
1NASA Langley Research Center, Hampton, Virginia, USA2Science Systems and Applications, Inc., Hampton, Virginia, USA3Institute for Atmospheric and Climate Science, ETH Zurich, Zurich, Switzerland
Received: 22 February 2007 – Published in Atmos. Chem. Phys. Discuss.: 23 May 2007Revised: 12 November 2007 – Accepted: 31 January 2008 – Published: 26 February 2008
Abstract. Since 2000, stratospheric aerosol levels have beenrelatively stable and at the lowest levels observed in the his-torical record. Given the challenges of making satellite mea-surements of aerosol properties at these levels, we have per-formed a study of the sensitivity of the product to the ma-jor components of the processing algorithm used in the pro-duction of SAGE II aerosol extinction measurements and theretrieval process that produces the operational surface areadensity (SAD) product. We find that the aerosol extinctionmeasurements, particularly at 1020 nm, remain robust andreliable at the observed aerosol levels. On the other hand,during background periods, the SAD operational product hasan uncertainty of at least a factor of 2 due to the lack of sen-sitivity to particles with radii less than 100 nm.
1 Introduction
SAGE II (Stratospheric Aerosol and Gas Experiment II) op-erated in low Earth orbit between October 1984 and Au-gust 2005 producing globally distributed profiles of ozone,NO2, water vapor, and aerosol extinction at four wavelengthsfrom the middle troposphere though the stratosphere. It isthe third in a series of four solar occultation instrumentswhose records begin in 1978 and end in March 2006. Dur-ing this time the variability of aerosol in the stratosphere isdominated by a series of large volcanic perturbations andfollowed by multi-year recoveries. The most significant ofthese are the 1982 El Chichon eruptions, which continued
Correspondence to: L. W. Thomason([email protected])
to have observable effects into the SAGE II observationalperiod, and the 1991 Pinatubo. The Pinatubo eruption wasthe most stratospherically significant volcanic event of thepast 30 years and was responsible for significant radiativeand chemical effects in the atmosphere (e.g., McCormick etal., 1995). The SAGE II data also records perturbations asso-ciated with a number of smaller volcanic events including theeruptions of Nevado del Ruiz and Nyamuragira (1985/1986),Kelut (1990), Cerro Hudson (1991), and Ruang and Reventa-dor (2002). For most of the SAGE II record, the stratospherecan be considered to be in recovery from volcanic perturba-tions.
The 1979–2004 multi-instrument 1000-nm stratosphericoptical depth is shown in Fig. 1. The stratospheric columnoptical depth was well in excess of 0.1 following the erup-tion of Pinatubo. However, in recent years, the lack of strato-spherically significant volcanic activity has led to the low-est optical depth values in the 28-year record with minimumvalues near 0.001 or a factor of more than 100 smaller thanthe maximum. At some altitudes, changes in the measuredaerosol extinction have varied by a factor in excess of 1000.Immediately following Pinatubo, the part of the aerosol ex-tinction profiles accessible to SAGE II occultation often ter-minated well above the tropopause. Therefore, the opticaldepths between the eruption and mid 1993 are computed byextrapolating the profiles from the bottom of the profile downto the tropopause using lidar data as described in the SPARCAssessment of Stratospheric Aerosol Properties (Thomasonand Peter, 2006). The premature termination of profiles iscommonly referred to as the “saturation” effect that repre-sents the upper bounds of the SAGE II dynamic range andoccurs when the line of sight optical depth observed by the
Published by Copernicus Publications on behalf of the European Geosciences Union.

984 L. W. Thomason et al.: SAGE II measurements of stratospheric aerosol properties
1979 1983 1987 1991 1995 1999 2003 2005
80S
60S
40S
20S
EQ
20N
40N
60N
80N
St. HelensEl Chichon
Ruiz
KelutPinatuboHudson
0.2
0.1
0.01
0.001
0.0006
Year
0.002
0.004
0.006
0.02
0.04
0.06
0.008
0.08
R Ruang/Reventador
R
Fig. 1. The 1020-nm stratospheric optical depth from SAM II, SAGE, SAGE II and SAGE III for the period from January 1979 through theend of 2004. Between the June 1991 Pinatubo eruption and mid 1993, aerosol extinction coefficient profiles are supplemented by lidar datafollowing the method described in Thomason and Peter (2006).
instrument (through the limb of the Earth’s atmosphere) ex-ceeds measurable bounds (a value of about 7). Saturation,due to Pinatubo effects, occurs from shortly after the erup-tion through mid-1993. It additionally occurs throughout theSAGE II record due to the presence of clouds, though mostlyin the troposphere. In fact, clouds in the troposphere are themost common mechanism for defining the lower altitude ex-tent of extinction profiles.
Since 2000, aerosol extinction has been characterized byrelatively steady levels throughout the stratosphere. Theselevels may represent a volcanically unperturbed stratosphere.Except for a minor perturbation by the eruptions of Ruangand Reventador in late 2002, this is the only period of steadyaerosol levels in the satellite measurement era dating backto the late 1970s. This extended period represents an op-portunity to observe the optical manifestations of the pro-cesses that control stratospheric aerosol under volcanicallyquiescent conditions including possible human-derived ef-fects. For this period, Fig. 2 shows the aerosol extinction inthe tropics at altitudes between 18 and 30 km. The SAGE IIextinction record shows a significant annual cycle at 18 km.Its source is not obvious as the data have been cleared ofclouds (Kent et al., 1996; Thomason and Peter, 2006). Lessthan 20% of the observed cycle may be due to the annualtemperature and water vapor cycle leading to a cycle in thewater uptake of the H2SO4-H2O aerosol and hence its size,but more than 80% must be related to other effects such asseasonal differences in the amount of H2SO4 entering thestratosphere or seasonal differences in organic aerosol. Thereis also a significant aerosol variability that appears to havea period similar to the Quasi-Biennial Oscillation (QBO) at30 km, while there is virtually no evidence for these cycles at22 or 26 km.
With aerosol at such low levels, as a corollary to the satu-ration problem, it is sensible to ascertain the degree to whichSAGE II extinction measurements remain dependable at thereported levels and, by extension, determine whether mea-surement features like the tropical annual aerosol extinctioncycle are robust features of aerosol morphology. Several fac-tors that are unimportant at high aerosol levels may influencethe robustness of the measurements at low levels. These in-clude dark current subtraction, altitude registration, and cor-rection for the effects of molecular scattering and absorptionby ozone and nitrogen dioxide. Herein, we discuss the sensi-tivity of the product to the major components of the process-ing algorithm used in the production of SAGE II aerosol ex-tinction measurements. We focus on factors that have the po-tential for producing bias in the aerosol measurements, thuswe neglect factors that are either too small (e.g., nitrogendioxide clearing) or produce random noise (e.g., measure-ment noise). In addition to extinction, SAGE II provides anestimate of the aerosol surface area density (SAD) as an op-erational product (Thomason et al., 1997). Since visible andnear-infrared wavelength aerosol extinction is insensitive toparticles with radii smaller than 100 nm, the robustness ofSAD estimates based on these measurements is questionable.Therefore, we have also included a study of the limitationsof SAD estimates based on SAGE II aerosol extinction mea-surements.
Atmos. Chem. Phys., 8, 983–995, 2008 www.atmos-chem-phys.net/8/983/2008/

L. W. Thomason et al.: SAGE II measurements of stratospheric aerosol properties 985
2 SAGE II aerosol extinction measurement sensitivitystudy
2.1 An overview of the retrieval process
SAGE II is a solar occultation instrument. It records theattenuation of sunlight by the Earth’s atmosphere at sevenwavelengths between 386 nm and 1020 nm during each sun-rise and sunset encountered by the spacecraft. As the sunrises or sets, the instrument scans across the face of the sun,thereby obtaining multiple measurements of total slant pathtransmittance for a given ray tangent altitude. Since mea-surements are also made for ray paths outside the atmo-sphere, this technique is self-calibrating. The tangent al-titude of each ray path is calculated from spacecraft andsun ephemeris data, taking into account the shape of theEarth and atmospheric refraction. The total slant path op-tical depth data are corrected for molecular scattering usingmeteorological data from the National Centers for Environ-mental Prediction (NCEP) supplemented with climatologicaldata at higher altitudes. Then the information for the sevenSAGE II channels is separated into slant path optical depthcontributions for ozone, nitrogen dioxide and water vaporplus aerosol in four channels (centered at 1020 nm, 525 nm,452 nm and 386 nm) using a least squares technique in whichaerosol effects at 448, 600, and 945 nm are estimated usinga physically-based interpolation from the other channels. Fi-nally, the slant path profiles undergo vertical inversion to pro-duce vertical profiles of aerosol extinction in four channels,ozone and NO2 number density, and H2O mixing ratio (e.g.,Chu et al., 1989). For the sensitivity study, we will show re-sults based on occultations that occurred between 10◦ N and30◦ N during the extended low aerosol loading period. Thislatitude band was chosen because column aerosol loading isrelatively low in this region (see Fig. 1) and therefore it ispotentially the most difficult region in which to make aerosolmeasurements; however, the following results are generallyapplicable to all latitudes.
2.2 Sensitivity study
The raw measurement obtained by the instrument is solarpower as an integer number of counts from 3 or 4 (off-sun)to a few thousand, depending on the channel. The valuesmeasured through the Earth’s limb are normalized by theexoatmospheric counts to generate transmittance measure-ments. The peak exoatmospheric count levels have generallydecreased slowly over the lifetime of the instrument. Figure 3shows the peak exoatmospheric count levels for the center ofthe Sun for the seven spectral channels from 1984 to 2005.Since the electronic noise level for the instrument is very low(less than one count), the signal-to-noise ratio for this datais very high. However, as the instrument scans from edgeto edge across the face of the sun, the number of counts de-creases toward zero, so only data from the center 90% of
0.0
0.5
1.0
1.5
2.0
0.0
0.5
1.0
1.5
2.0
Ex
tin
cti
on
0.0
0.2
0.4
0.6
0.8
1.0
0.0
0.1
0.2
0.3
0.4
0.5
0
2
4
6
Ex
tin
cti
on
Ex
tin
cti
on
Ex
tin
cti
on
Ex
tin
cti
on
(a) 1020 nm, 18 km
(b) 1020 nm, 22 km
(c) 1020 nm, 26 km
(d) 1020 nm, 30 km
(e) 525 nm, 18 km
1998 2000 2002 2004
Year
Fig. 2. SAGE II stratospheric 1020-nm aerosol extinction coeffi-cient (in units of km−1) for altitudes of 18(a), 22(b), 26(c) and 30km (d) between 10◦ N and 10◦ S for the years 1998 through 2003.In addition, 525-nm aerosol extinction variability is shown in frame(e). The effects of the eruptions of Ruang and Reventador in late2002 can be seen at 18 km. Dashed vertical lines show 1 Januaryof each year. Horizontal block arrows in (d) show easterly QBO asgiven by zonal winds at 50 mb over Singapore.
the Sun is used to compute transmission. Count levels alsodecrease as the path through the atmosphere approaches theEarth’s surface. Figure 4 shows the raw counts measured inthe 1020 nm channel as a function of altitude for a typicalevent from December 2003 and demonstrates that the bulkof the on-sun measurements in the stratosphere and well intothe troposphere have count levels of 1500 or higher. There-fore, the transmittance accuracy is on the order of 0.1%.
The transmittance signal in each channel is attributable tomultiple sources: aerosol and molecular scattering and ab-sorption by ozone, NO2, and water vapor. Specifically, theaerosol extinction signal in the 1020 nm channel must beseparated from the signal due to molecular scattering plus asmall contribution from ozone absorption. Figure 5 showsthe fraction of the signal in the 1020 nm channel due toaerosol. This fraction varies from about 40% to 60% below30 km showing that at these altitudes 1020-nm extinction isnot sensitive to the removal of interfering species. Above30 km, the aerosol fraction decreases rapidly and the impor-tance of the molecular correction increases rapidly.
www.atmos-chem-phys.net/8/983/2008/ Atmos. Chem. Phys., 8, 983–995, 2008

986 L. W. Thomason et al.: SAGE II measurements of stratospheric aerosol properties
1985 1990 1995 2000
Year
2000
2500
3000
3500
4000
I 0 C
ou
nts
1 1020 nm
2 940 nm
3 600 nm
4 525 nm
5 453 nm
6 448 nm
7 386 nm
Ch. Wavelength
1
2
7
6
5
3
4
Fig. 3. SAGE II exoatmospheric counts for channels 1 through 7through the lifetime of the instrument. The channels have centralwavelengths of 1020, 940, 600, 525, 453, 448, and 386 nm, respec-tively. The lines are labeled with channel number followed by cen-tral wavelength.
0 500 1000 1500 2000 2500 3000
Counts (minus background)
0
10
20
30
40
50
60
Alt
itude (
km
)
Fig. 4. Instrument counts, minus background, for the center 90% ofthe sun, as a function of altitude, for an event which occurred on 19December 2003 at 21.1◦ N, 142.0◦ E.
Other parameters besides the sensitivity to aerosol couldpotentially handicap the aerosol measurements, including anumber of possible sources of bias hinted at in the descrip-tion of the retrieval above. The aim of the sensitivity studyis to examine the effect on 1020 nm and 525-nm aerosol ex-tinction data of various sources of systematic error, includingthe dark (off-sun) measurement, the altitude registration, themeteorological input data, and the gas cross-sections. Thesefactors are not significant at high and moderate aerosol levelsbut may be significant at the low levels observed after 2000.In the following discussion, we demonstrate that the 1020-nm aerosol extinction is not sensitive to any of these sourceswhile the 525-nm aerosol extinction is sensitive only to theozone cross-section.
Average of 2003, latitude 20 +- 10
0.0 0.2 0.4 0.6 0.8 1.0
Aerosol Fraction of 1020-nm LOS Optical Depth
15
20
25
30
35
40
Alt
itu
de
(km
)
Fig. 5. Fraction of the measured slant path optical depth in the 1020-nm channel that is attributed to aerosol. All events between 10◦ Nand 30◦ N in 2003 are included in the average shown here. Un-der the conditions of interest the H2SO4-H2O aerosol is expectedto fully evaporate at temperatures above∼238 K, corresponding toaltitudes between 35 km and 40 km.
Dark count +1 at 525 nm
-10 0 10
Percent di� (exp-std)/mean
15
20
25
30
35
40
Alt
itu
de
(k
m)
Dark count +1 at 1020 nm
-10 0 10
Percent di� (exp-std)/mean
15
20
25
30
35
40
Alt
itu
de
(k
m)
(a) (b)
Fig. 6. Effect on the ratio of 525 nm to 1020 nm aerosol extinc-tion of increasing the number of counts subtracted from the sig-nal to correct for dark current. The plot shows the percent dif-ference of the means of multiple processed events, with the sense(exp−std)/mean×100% where exp and std refer to the perturbedsubtraction and the assumed-correct subtraction, respectively, andthe mean is (std+exp)/2. The occultation events included are thosebetween 10◦ N and 30◦ N latitude in the year from October 2001to September 2002. Panel(a): experimental perturbation applied tothe 1020 nm channel. Panel(b): the same for the 525 nm channel.
2.2.1 Dark count subtraction
The dark count value is measured by pointing the instru-ment away from the sun. It represents the instrument’s“zero” level. In processing, this value is subtracted from theraw solar power measurements before the calibration by the
Atmos. Chem. Phys., 8, 983–995, 2008 www.atmos-chem-phys.net/8/983/2008/

L. W. Thomason et al.: SAGE II measurements of stratospheric aerosol properties 987
exoatmospheric scans. The dark count values for all sevenchannels are between 3 and 4 counts, or about one or twoone-thousandths of the maximum intensity measured. Overthe lifetime of the instrument, dark count values have beenstable for each measurement channel. Ironically, the gen-erally desirable characteristics of very small measurementnoise and a high stability of the dark count level conspireto make precise measurements of dark counts difficult. Theuncertainty is about one half count and therefore is a largefraction of the overall dark count value.
In practice, dark count subtraction will have its greatestimpact when the channels are near saturation and the mea-sured total count level is close to the dark count value. In thestratosphere, this only occurs immediately after the Pinatuboeruption in 1991. In stratospheric background periods it oc-curs only in the presence of clouds for the 1020-nm channeland for clouds or in clear skies at and below about 6 km forthe 525-nm channel. In order to determine the sensitivityof the aerosol measurements to the uncertainty in the darkcount subtraction, we performed two experiments in whichthe magnitude of the dark count subtraction was changed byone count, first in the 1020 nm channel and then in the 525nm channel. Figure 6 shows the results of these experimentson the ratio of detected aerosol extinction (525 nm/1020 nm)for all profiles in the 10◦–30◦ N latitude band in October2001 through September 2002. They were reprocessed witha change in the dark count subtraction of one count. The re-sulting systematic change when the assumed background ischanged in the 1020-nm channel is a fraction of a percent.The effect of adjusting the 525-nm background is slightlylarger, but is still less than a percent below 30 km, except inthe vicinity of 15 km where it is about 2% in the 525-nm ex-tinction (visible here as a similar change in the ratio, sincethe change in 1020-nm extinction is near zero). As expected,we find that background stratospheric aerosol measurementsare not greatly influenced by the dark count subtraction.
2.2.2 Altitude registration sensitivity
The determination of the ray tangent altitude is another po-tential source of systematic error. In a similar experimentto that described above, the altitude registrations were arti-ficially shifted upward and downward by 100 m. This shiftis comparable to the altitude registration uncertainty (100 to200 m) derived from ozone intercomparisons [Borchi andPommereau, 2007]. The shift was experimentally appliedto all profiles in the 10◦-30◦ N latitude band in October 2001through September 2002. The result, shown in Fig. 7 showsthat the effect on 1020 nm aerosol extinction is less than 3%throughout the stratosphere. The effect of an upward (down-ward) shift on the 525-nm aerosol measurement is to de-crease (increase) the inferred extinction by about 2–5% al-most everywhere in the stratosphere, with the peak shift near31–33 km. Even at the peak value, where the difference is 6%in the measured 525-nm aerosol extinction and in the 525 to
15
20
25
30
35
40
Alt
itu
de
(k
m)
-10 0 10
Diference (%)
(exp-std)/mean
-10 0 10
Diference (%)
(exp-std)/mean
-10 0 10
Diference (%)
(exp-std)/mean
15
20
25
30
35
40
15
20
25
30
35
40
updown
updown up
down
(a) (b) (c)
Fig. 7. Effect of a shift in the altitude registration upward (solidlines) or downward (dashed): difference in percent between shiftedand unshifted aerosol extinctions are shown for 1020-nm aerosolextinction(a), 525-nm aerosol extinction(b) and the ratio of 525-nm/1020-nm extinction(c). The sense of the percent difference is(experimental−standard)/mean where experimental is the mean ofall the perturbed measurements, standard is the mean of unperturbedmeasurements and mean is (experimental+standard)/2. The occulta-tion events included are those between 10◦ N and 30◦ N for the yearfrom October 2001 to September 2002 removing measurements thatappear to have been contaminated by clouds.
1020-nm extinction ratio, the systematic error resulting fromthis experiment is quite small.
2.2.3 Temperature profile sensitivity
In our third experiment, we examine the effect on the SAGEII aerosol extinction measurements of an artificially inducedsystematic bias in the NCEP temperature profiles at the 100-mb level. Randel et al. (2004) has reported that the NCEPtropopause temperature is too warm by approximately 2–3 Kwith the potential for larger errors at 10 mb. The possibilityof a systematic error or a spurious trend in the temperaturedata is of particular concern to SAGE II measurements sincesuch an error can produce a bias or an artificial trend in theaerosol measurements. Accordingly, we have experimentallyadjusted the temperature profiles that are input to the SAGEII retrieval for the same 10◦–30◦ N latitude band in October2001 through September 2002.
SAGE II receives NCEP temperatures at 18 pressure levels(1000, 850, 700, 500, 400, 300, 250, 200, 150, 100, 70, 50,30, 10, 5, 2, 1, and 0.4 mb) and interpolates this data to a 0.5-km profile of temperature and pressure. For this experiment,we adjusted the temperature at one of the pressure levels andthe perturbation is spread at altitudes between the pressurelevels immediately above and below the perturbed level. Theprimary test was to adjust the temperature at the 100 mb levelby +3 K. The result is an increase of 9% in a narrow regionnear 16 km and a decrease of generally less than 1% in the525-nm channel in the stratosphere (Fig. 8, top middle). Inthe 1020-nm channel, the narrow peak is somewhat smaller,while stratospheric values again change by 1% or less (Fig. 8,
www.atmos-chem-phys.net/8/983/2008/ Atmos. Chem. Phys., 8, 983–995, 2008

988 L. W. Thomason et al.: SAGE II measurements of stratospheric aerosol properties
15
20
25
30
35
40
Alt
itu
de
(k
m)
-10 0 10
Diference (%)
(exp-std)/mean
-10 0 10
Diference (%)
(exp-std)/mean
-10 0 10
Diference (%)
(exp-std)/mean
15
20
25
30
35
40
15
20
25
30
35
40
15
20
25
30
35
40
Alt
itu
de
(k
m)
-10 0 10
Diference (%)
(exp-std)/mean
-10 0 10
Diference (%)
(exp-std)/mean
-10 0 10
Diference (%)
(exp-std)/mean
15
20
25
30
35
40
15
20
25
30
35
40
+3 K
-3 K
+3 K
-3 K
+3 K
-3 K
+3 K
-3 K
+3 K
-3 K
+3 K
-3 K
100 mb
10 mb
(a) (b) (c)
(d) (e) (f )
Fig. 8. Panels (a), (b), and (c) show the result of perturb-ing the input temperature value at 100 mb by 3 K (solid lines)and −3 K (dashed). Percent differences for the 1020-nm extinc-tion (a), 525-nm extinction (b) and 525-nm/1020-nm ratio (c) are(experimental−standard)/mean with the meanings as in Fig. 6.Same suite of measurements and cloud clearing is also the sameas in Fig. 6. Panels(d), (e), and(f): same at the 10 mb level.
top left). Conversely, decreasing the temperature results inequivalent changes opposite in sign to those described above(Fig. 8, top left, middle, and right).
Temperature uncertainties at a higher altitude may havea stronger relative impact on stratospheric aerosol measure-ments. Therefore, in a separate experiment, we have testedthe response of the aerosol measurements to an increase ordecrease of 3 K at the 10 mb level (about 31 km). The bot-tom panels of Fig. 8 demonstrate the response of the aerosolextinction measurements to this perturbation. Increasing thetemperature produces an increase in the measured 1020-nmaerosol extinction between 25 and 38 km, with a peak effectof about 4% near 34 km. The effect on the 525-nm measure-ment is increasing between about 25 and 31 km, with a peakof about 5% at 29.5 km, and a constant decrease of about2% above 31 km. In summary, a 1% error in absolute tem-perature translates into an error of up to 4% in the 525 and1020 nm extinction coefficients and similarly in their ratio.
2.2.4 Sensitivity to mirror correction
In an additional experiment, we assess the effect of an im-posed bias in the mirror correction. The mirror correction is
a small adjustment, nearly linear with altitude that is madeto correct for variation in the mirror reflectivity as a func-tion of the mirror angle. The correction is small throughoutthe depth of the atmosphere and never exceeds 1% with anestimated relative uncertainty of 0.4%. For testing, we madethe mirror correction one sigma (0.4%) larger than the opera-tional values. The effect on the 525-nm and 1020-nm aerosolextinction profiles is negligible throughout the 15–35 km re-gion, with a maximum effect of only 1.8% near 38 km in the1020-nm channel and less than 1% at 34 km in the 525-nmchannel. These effects are very small and only occur at thehigh altitude extreme of the aerosol profiles where measure-ment uncertainty is already close to 100%.
2.2.5 Sensitivity to aerosol model
The SAGE II species retrieval includes an aerosol modelwhich is used to calculate the aerosol extinction in the 600-nm channel where it is an interfering species in the ozone re-trieval. The calculation estimates the aerosol slant path opti-cal depth as a linear combination of the aerosol optical depthin the 1020-nm and 525-nm channels. The model, similarto that described by Chu et al. (1989), uses a set of linearcoefficients to relate extinction at 525 and 1020-nm to that at600 nm based upon a family of log-normal aerosol size distri-butions that are representative of stratospheric aerosol. Themodel produces 600-nm aerosol extinction estimates with anestimated accuracy of∼1%. For the sensitivity study, weperturbed the 600-nm aerosol by changing the coefficientsmultiplying the other two channels, both separately and to-gether, by one percent. Since the retrieval is a simultaneousretrieval of the gaseous species and aerosol in all channels,there is potential crosstalk between the retrieval of ozone andaerosol extinction, particularly for the shorter wavelengthaerosol channels, through the aerosol model. However, wefind that these perturbations have a negligible effect on the1020-nm and 525-nm aerosol extinction. The effect on the1020-nm aerosol extinction was effectively zero (less than0.01%) in all three tests; the maximum effect on the 525-nmaerosol extinction was less than four tenths of a percent (thisoccurred when both coefficients were simultaneously biasedaway from their standard values in the same direction).
2.2.6 Ozone cross-section sensitivity
The final component of the sensitivity study is an assessmentof the effect of a systematic error in the ozone cross-section.SAGE II version 6.2 uses the ozone cross sections of An-derson and Mauersberger (1992) and Anderson et al. (1990,1991, 1993a, 1993b) and the temperature dependence mea-sured by Burkholder and Talukdar (1994), as compiled byShettle and Anderson (1994). These sources report uncer-tainties of 1–2% near the peak of the Chappuis band andnear 525 nm. Ozone absorption cross-sections for each chan-nel are required for the retrieval of individual species. These
Atmos. Chem. Phys., 8, 983–995, 2008 www.atmos-chem-phys.net/8/983/2008/

L. W. Thomason et al.: SAGE II measurements of stratospheric aerosol properties 989
are derived by combining the above cross sections with theSAGE II instrument’s filter response function. Since the 525-nm channel is within the Chappuis band, the cross section atthat channel is a potential source of systematic error in theaerosol measurements. On the other hand, the ozone crosssection at 1020 nm is very small and unlikely to play a role inthe aerosol extinction coefficient measurement quality. Thetest consists of a perturbation of 1% in the ozone cross sec-tion for the 525-nm channel. As expected, Fig. 9 shows thatthere is almost no effect on the 1020 nm aerosol extinction,but a significant effect on 525 nm aerosol extinction that in-creases with altitude reaching 18% at 31 km. A related ex-periment was performed in which the cross section for theprimary ozone channel (at 600 nm) was changed by 1%. Theeffect on the 525-nm aerosol extinction measurement is inthe opposite sense than the previous experiment but with asimilar altitude dependence. The peak change is about 20%near 33 km. The effect on the 1020 nm aerosol extinctionmeasurement is again nearly zero.
As a result, we find that a systematic bias in the ozonecross section (either in an absolute sense or in its temperaturedependence) could potentially produce artificial seasonal cy-cles or other effects in the inferred aerosol extinction coef-ficient variability but only at the short wavelength channelslike 525 nm. The 1020-nm channel is essentially indepen-dent of ozone cross section errors and therefore, annual cy-cles in aerosol that appear in both the short wavelength andthe 1020-nm channels are likely to reflect real changes in theaerosol morphology rather than a residual ozone signature.This includes the annual cycles (shown Fig. 2) in the tropicallower stratosphere (amplitude∼20%) and the annual cyclenear 30 km where the amplitude is near 50%. It also impliesthat the real uncertainty in the 525-nm ozone cross sectionmust be significantly less than 1%.
2.3 Summary of aerosol extinction coefficient sensitivitystudy
We find that during the low stratospheric aerosol levels foundbeginning in 2000 and continuing through the end of its mis-sion in 2005, SAGE II aerosol extinction coefficient profilesremained robust and reliable. While the relative uncertain-ties associated with measurement noise were larger than dur-ing higher aerosol loading periods, the potential for signifi-cant measurement bias remained low. For these conditionsand the factors as tested, the largest departure at 1020 nmis less than 5% from the tropopause to 30 km and is domi-nated by the a priori temperature profile data used in the dataprocessing. At 525 nm, the largest departures were less than10% through most of the lower stratosphere and approaches20% at 30 km. At this wavelength, the bias potential is domi-nated by uncertainty in the temperature profile data and in theozone cross section. At background aerosol levels and giventhe full range of potential error in the retrieval parameters, it
Perturb O3 cross section at 525 nm by 1%
-30 -10 0 10 3015
20
25
30
35
40
Alt
itu
de
(k
m)
-30 -10 0 10 30Di�erence (%)
(exp-std)/mean
Di�erence (%)
(exp-std)/mean
-30 -10 0 10 30Di�erence (%)
(exp-std)/mean
1020 nm 525 nm
Extinction Ratio
15
20
25
30
35
40
15
20
25
30
35
40
-30 -10 0 10 30Di�erence (%)
(exp-std)/mean
-30 -10 0 10 30Di�erence (%)
(exp-std)/mean
-30 -10 0 10 30Di�erence (%)
(exp-std)/mean
15
20
25
30
35
40
Alt
itu
de
(k
m)
15
20
25
30
35
40
15
20
25
30
35
40Perturb O3 cross section at 600 nm by 1%
Extinction Ratio525 nm1020 nm
(a) (b) (c)
(d) (e) (f )
Fig. 9. This figure shows the effect of perturbing the ozone crosssection at 525 nm (panels(a), (b), and(c)) and separately at 600 nm(panels(d), (e), and(f)) by 1%. The effects on the 1020-nm aerosolextinction measurement ((a) and (d)), 525-nm aerosol extinctionmeasurement ((b) and (e)) and the ratio ((c) and (f)) are shown.Details of the experiments are otherwise the same as Figs. 6, 7, 8,and 9. Note the range of the abscissa has been increased on theseplots compared to previous figures.
is difficult to produce a bias exceeding 10% at 1020 nm and20% at 525 nm (below 25 km).
3 Surface Area Density Estimation Sensitivity
3.1 A model for determining the limiting bounds on SAD
The operational SAGE II data processing includes estimatedsurface area density (SAD) beginning with the release of Ver-sion 6.2. The method follows that described by Thomasonet al. (1997) except the coefficients used in the operationalretrieval are weighted by measurement uncertainty therebymoving the SAD derivation dependence toward the 525 and1020-nm channels rather than the short wavelength channelsthat are generally less reliable. Operationally, this approachwas simplified to this expression
SAD = k1020
(
1854.97+ 90.137r + 66.97r2
1. − 0.1745r + 0.00858r2
)
(1)
www.atmos-chem-phys.net/8/983/2008/ Atmos. Chem. Phys., 8, 983–995, 2008

990 L. W. Thomason et al.: SAGE II measurements of stratospheric aerosol properties
0.01 0.10 1.00 10.00
Radius (μm)
0
1
2
3
4
5
1 2 3 4 5 6
Extinction Ratio
0.0
0.2
0.4
0.6
0.8
1.0
Radiu
s (μ
m)
(a) (b)
3λQ
(λ,r
)/4r
Fig. 10. (a) Extinction kernels for SAGE II aerosol extinctionchannels at 385 (left-most), 452, 525, and 1020 nm (right-most)for spherical water/sulfuric acid drops at stratospheric temperatures.(b) The solid line shows the particle radius as a function of the 525-nm to the 1020-nm extinction kernel ratio (or extinction coefficientratio for a monodispersed aerosol). The dotted line shows the par-ticle radius as a function of the 452-nm to the 1020-nm extinctionkernel ratio.
wherer is the 525 to 1020-nm aerosol extinction ratio, andk1020 is the 1020-nm aerosol extinction coefficient in unitsof km−1 and the equation yields surface area density in unitsof µm2 cm−3. This technique was shown to produce val-ues comparable with those produced by in situ instrumentssuch as the University of Wyoming Optical Particle Counter(OPC) during the post-Pinatubo period (e.g., Thomason etal., 1997) but more recent work shows that it tends to un-derestimate OPC-derived SAD during low aerosol loadingperiods such as the current period (e.g., Thomason and Peter,2006). It is not surprising that SAD calculations based onvisible wavelength extinction measurements are less robustduring low aerosol periods. This occurs in these periods be-cause the bulk aerosol properties like SAD become heavilydependent on particles smaller than 100 nm which are ratherpoor scatterers and thus have only a small impact on mea-sured extinction values. Figure 10a shows the aerosol extinc-tion kernels for the four SAGE II measurement wavelengths(386, 452, 525, and 1020 nm) assuming spherical particlescomposed of a mixture of sulfuric acid and water. Generally,aerosol extinction coefficient and particle size are positivelycorrelated; that is, as aerosol extinction coefficient increasesthe mean particle size also increases. Thus, for low aerosolloading it is possible that a significant fraction of SAD lies atparticle sizes to which visible wavelength aerosol extinctionis almost totally insensitive and, as a result, the calculationof SAD is prone to substantial uncertainties. The retrievalof SAD for low aerosol loading is not necessarily biased tolow values but rather it is highly dependent on how the re-trieval process fills the small end of the particle size distri-bution and thus can be biased either high or low. This willbe demonstrated later in this section. Many techniques havebeen applied to this calculation for SAGE II data, each of
which filled this “blind spot” in a somewhat different man-ner (Wang et al., 1989; Thomason et al., 1997; Steele et al.,1997; Yue et al., 1999; Bingen et al., 2004). The operationalSAD retrieval puts relatively little material at radii smallerthan 50 nm and thus is likely to produce SAD values that arebiased low to some degree (Thomason et al., 1997).
SAD is an important parameter in stratospheric chemistryas well as for light scattering and absorption, and hence forstratospheric heating and consequently dynamics. The back-ground aerosol levels currently observed establish a base-line for SAD effects. As a result, it is important to estab-lish the level of reliability for SAGE II SAD estimates foruse in chemical and radiative modeling. This is particularlyimportant since SAGE II provides a unique global view ofthe aerosol burden from 1984 into 2005 spanning the entirePinatubo period. The only other comparable data set is thatprovided by the Halogen Occultation Experiment (HALOE)which is also a space-based solar occultation experiment thatoperates in the infrared. HALOE produces SAD estimatesthat are in fact smaller than those estimated from SAGEII during background periods (Hervig et al., 1998, 2002).To quantify the range of possible solutions for SAD duringbackground periods, we will in the following develop sim-ple models that allow us to put bounds on the maximumand minimum values for SAD that are consistent with themeasured aerosol extinction and its wavelength dependence.These models provide rigorous limits on the SAD calculationbut are not meant to produce a new SAD retrieval algorithm.
4 Method 1
For the first approach, the minimum SAD value consistentwith observed aerosol extinction is a straightforward calcu-lation. It is based on the observation from Figure 10a that theMie scattering efficiency monotonically increases for particlesizes between 0 and∼0.5µm. As a result, on a per particlebasis, the largest particles produce the most extinction at thecost of the smallest SAD. Thus the minimum possible SADoccurs for a monodispersed aerosol at the radius that pre-serves the observed extinction wavelength dependence mod-ified by measurement uncertainty. For this model, aerosolextinction is given by
k(λ) − ε(λ) = NminQ(rmin, λ)πr2min, (2)
wherek and ε are the aerosol extinction coefficient andits associated uncertainty at wavelengthλ, Nmin andrmin arethe number density and radius of the monodispersed aerosol,andQ(r,λ) is the Mie extinction efficiency seen in Fig. 10a.Figure 10b shows the 525 to 1020-nm extinction ratio to par-ticle radius relationship for this model. This relationship isrobust for particle sizes from 0 to 0.5µm but becomes multi-valued at larger radii where the extinction ratio approaches1. As a result, this method becomes ill-behaved for high
Atmos. Chem. Phys., 8, 983–995, 2008 www.atmos-chem-phys.net/8/983/2008/
L. W. Thomason et al.: SAGE II measurements of stratospheric aerosol properties 991
aerosol loading periods (e.g., post-Pinatubo) and other situa-tions where the measured extinction ratio is small. The min-imum SAD, SADmin, is computed by using the 525 to 1020-nm extinction ratio, (k(525 nm)−ε (525 nm))/k (1020 nm), toinfer rmin thenNmin is computed using Eq. (2) above. Finally,SADmin is given by 4πNminr
2min.
From a mathematical perspective, the maximum possibleSAD that can be produced from SAGE II measurements isunbounded. Since particles smaller than 0.1µm are poorscatterers, it is possible to produce virtually unlimitedly largevalues of SAD by adding to the aerosol distribution derivedfor the minimum SAD (preserving the measured extinctioncoefficients) a second monodispersed mode at a very smallradius (<<0.1µm). For instance, using enough 10 nm parti-cles to perturb the 525-nm aerosol extinction by the measure-ment uncertainty (∼10%) produces SAD values in excess of104 µm2 cm−3 at the cost of a particle density on the order of107 cm−3 for conditions where the operational method pro-duces values on the order of 1µm2 cm−3. Clearly, numberdensities of this order are physically unrealistic but this il-lustrates the scope of the mathematical freedom afforded inSAD calculations by visible near infrared wavelength extinc-tion measurements.
An alternative approach to estimating a maximum valueof SAD is based on the observation from in situ measure-ments that aerosol number density (for radii greater thanabout 10 nm) tends to be around 10 cm−3 independent of thedetails of the size distribution (Deshler et al., 2003). Thephysical reason for this is coagulation, which takes typicallyone year to reduce 10 cm−3 to half of this value, whereas ittakes approximately one month to halve 100 cm−3 and 3 daysto halve 1000 cm−3. In light of this, we compute a secondmonodispersed mode that brings the total number density toa fixed value,Ntotal=20 cm−3, at a radius that perturbs theshortest wavelength aerosol extinction wavelength used inthe calculation by the measurement uncertaintyε(λ). Sinceincreasing the total number density monotonically increasesthe inferred SAD, we choose 20 cm−3 since it should exceedthe number density in most circumstances in the stratosphereand thus ensure a “maximum” SAD value. An exception oc-curs where new particle nucleation is occurring. This occursin the lower tropical stratosphere and the middle stratosphereat the winter pole; in those cases, this methodology wouldnot necessarily yield a robust maximum SAD value.
The Method 1 maximum surface area density, SADmax, isgiven by
SADmax = SAD′min + 4(Ntotal − Nmin)πr2
max (3)
wherermax is the radius that is the solution to
ε(λmin) = Q(rmax, λmin)πr2max(Ntotal − N ′
min) (4)
whereε is the uncertainty in the short wavelength aerosolextinction coefficient at wavelengthλmin. In this case, weuse a minimum SAD, SAD′min, computed usingk(λ) instead
10-6 10-5 10-4 10-3 10-2
Aerosol Extinction Coefficient (km-1)
5
10
15
20
25
30
Altitu
de
(km
)
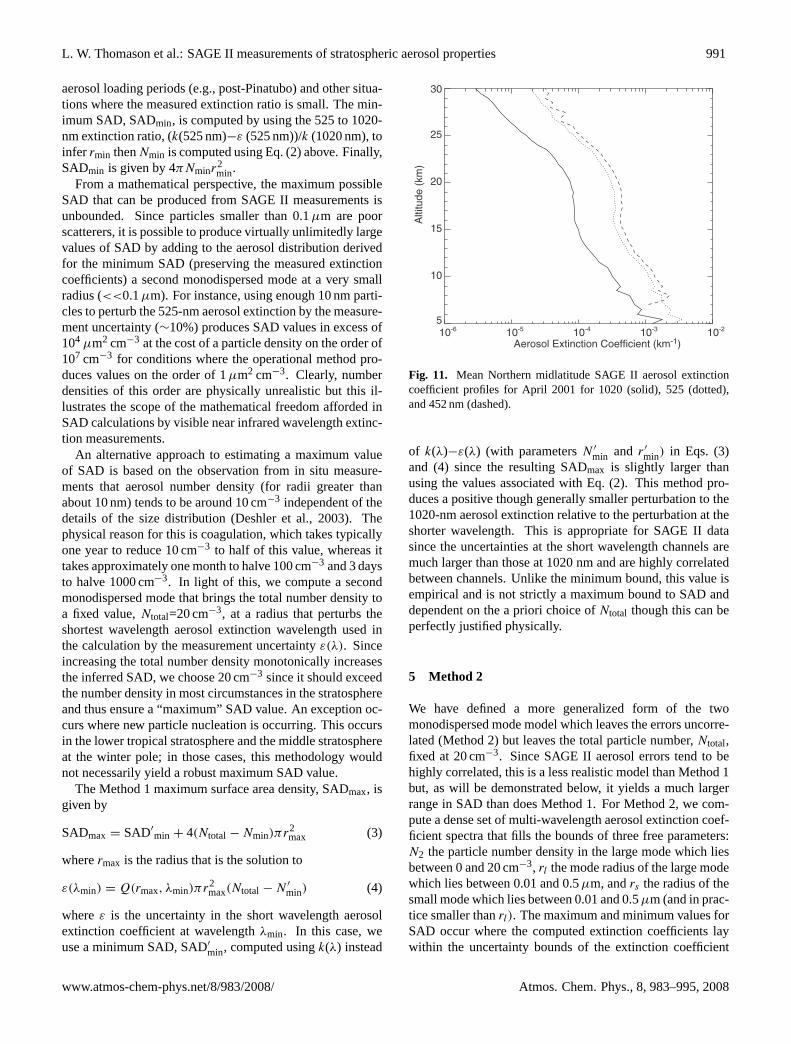
Fig. 11. Mean Northern midlatitude SAGE II aerosol extinctioncoefficient profiles for April 2001 for 1020 (solid), 525 (dotted),and 452 nm (dashed).
of k(λ)−ε(λ) (with parametersN ′
min and r ′
min) in Eqs. (3)and (4) since the resulting SADmax is slightly larger thanusing the values associated with Eq. (2). This method pro-duces a positive though generally smaller perturbation to the1020-nm aerosol extinction relative to the perturbation at theshorter wavelength. This is appropriate for SAGE II datasince the uncertainties at the short wavelength channels aremuch larger than those at 1020 nm and are highly correlatedbetween channels. Unlike the minimum bound, this value isempirical and is not strictly a maximum bound to SAD anddependent on the a priori choice ofNtotal though this can beperfectly justified physically.
5 Method 2
We have defined a more generalized form of the twomonodispersed mode model which leaves the errors uncorre-lated (Method 2) but leaves the total particle number,Ntotal,fixed at 20 cm−3. Since SAGE II aerosol errors tend to behighly correlated, this is a less realistic model than Method 1but, as will be demonstrated below, it yields a much largerrange in SAD than does Method 1. For Method 2, we com-pute a dense set of multi-wavelength aerosol extinction coef-ficient spectra that fills the bounds of three free parameters:N2 the particle number density in the large mode which liesbetween 0 and 20 cm−3, rl the mode radius of the large modewhich lies between 0.01 and 0.5µm, andrs the radius of thesmall mode which lies between 0.01 and 0.5µm (and in prac-tice smaller thanrl). The maximum and minimum values forSAD occur where the computed extinction coefficients laywithin the uncertainty bounds of the extinction coefficient
www.atmos-chem-phys.net/8/983/2008/ Atmos. Chem. Phys., 8, 983–995, 2008

992 L. W. Thomason et al.: SAGE II measurements of stratospheric aerosol properties
0.1 1.0 10.0
Surface Area Density
5
10
15
20
25
30
Alt
itu
de
(km
)
Fig. 12. This figure shows the comparison of operational SAGEII SAD (black) with the Method 1 minimum and maximum SADusing 525-nm aerosol extinction coefficient (red) and the minimumand maximum Method 2 SAD using 3 channels at 452, 525, and1020 nm (gold).
measurements at two or more wavelengths (SADmin2 andSADmax2). We use a look up table with more than 107 ele-ments to determine a solution. While this approach is labori-ous, it avoids the numerical instability endemic to the directretrieval process which is exacerbated by the fine structurein the extinction kernels and the use of monodispersed sizedistributions. The minimum and maximum SAD values thatboth Method 1 and Method 2 yield are intended to be ex-treme and the real distribution of particle sizes is likely to bespread across a broad range of particle sizes that yield SADvalues well within the bounds derived here.
5.1 Examples of SAD bound calculations
Figure 11 shows the mean SAGE II aerosol extinction coef-ficient profiles for Northern midlatitudes in April 2001. Thisperiod occurs well within the current non-volcanic periodand the profiles are typical of the period between 2000 andthe end of the SAGE II measurements in August 2005. Fig-ure 12 shows a comparison of SADmin and SADmax valuesfor Method 1 for the same period along with the operationalSAD profile. In this case, we show results forNtotal equal to20 cm−3 and using extinction at 525 nm as the short wave-length aerosol channel. We found that the SAD bounds arenot strongly influenced by the choice of the 452 or 525 nmchannels and we limit discussion to the use of the 525-nmchannel. We also find for these parameters that the differ-ence between the minimum and maximum values of SADincreases from about a factor of 2 at 10 km to about a factorof 4 at 25 km and roughly follows the increase in the 525 to1020-nm extinction coefficient ratio (decreasing mean par-ticle size). The operational model tends to lie within these
0.0 0.1 0.2 0.3 0.4 0.5Radius (microns)
5
10
15
20
25
30
Alt
itu
de
(k
m)
0.0 0.5 1.0 1.5 2.0 2.5
Large Mode Number Density (cm-3)
5
10
15
20
25
30
Alt
itu
de
(k
m)
(a)
(b)
rlmax
rsmax
rlmin
rsmin
rmax
r'minrmin
N’min
Nmin
N2
Fig. 13. This figure shows the profiles of the Method 1 depen-dent parametersrmin, rmax, andr ′
min (on frame(a)) andNmin andN ′
min (b) in red. In addition, it shows Method 2 free parametersrlmax,rlmin, rsmax, and rsmin (a) and N2 for the maximum SAD(solid) and for the minimum SAD (dashed) in gold.
bounds where it runs from a little less than SADmax at 10 kmto a little greater than SADmin at 25 km. In the main aerosolregion below 25 km, the operational value lies around 30% ofthe way from SADmin to SADmax and thus follows the gen-eral expectation that it would tend to produce surface areadensity values that are on the low end of the range of possi-ble values.
Figure 12 also shows the minimum and maximum SADvalues for the 3-channel results from Method 2. The 2 and 3-channel versions (using 525 and 1020 nm and 452, 525, and1020 nm channels respectively) yield very similar results sowe restrict discussion to the three channel method. Here,we find that the range in SAD is much larger than found forMethod 1 and runs from a factor of 6 near 10 km to a factorof ∼15 at 25 km. The larger domain is an outcome of thesolutions Method 2 preferentially produces for the minimum
Atmos. Chem. Phys., 8, 983–995, 2008 www.atmos-chem-phys.net/8/983/2008/

L. W. Thomason et al.: SAGE II measurements of stratospheric aerosol properties 993
and maximum SADs. The minimum solution uniformly oc-curs for the shallowest allowed slope in the extinction co-efficient wavelength dependence (the largest allowed nega-tive departures at the short wavelengths and largest allowedpositive departures at 1020 nm) whereas the maximum SADsolution invariably occurs for the steepest allowed solution(the largest allowed positive departures at the short wave-lengths and largest allowed negative departures at 1020 nm).This result is not surprising since the steeper slope impliessmaller particles which require greater surface area to pro-duce an equivalent extinction as larger particles. The effectof the slope change is extremely non-linear (as implied byEq. (1)) and overwhelms any change in SAD implied by therelatively minor changes in the absolute magnitude of the ex-tinction coefficients.
Figure 13 shows the derived free parameters(rmin, rmax, r
′
min, Nmin, and N ′
min) for these solutions.We find thatrmin for the minimum and maximum SADs forMethod 1 are essentially the same and the small particlesize for the maximum SAD lies between 30 and 50 nm formost of the stratosphere. The large mode,rlmax, for themaximum SAD in Method 2 is close tormin from Method1 particularly above 15 km. On the other hand the smallmode particle radius,rsmax, is larger thanrmax from Method1 and varies from 60 to 100 nm in the stratosphere. Forthe minimum SAD for Method 2,rsmax does not contributesignificantly to the total surface area density but uniformlyselects the smallest allowed particle size. As a result,the Method 2 approach effectively selects a single modesolution for minimum SAD and follows the argument madefor the definition of the Method 1 minimum SAD. For bothmethods, the number density of the large mode for both theminimum and maximum SAD is less than 1 cm−3 above10 km and generally decreases with altitude. This result isconsistent with past efforts to fit SAGE II extinctions with apriori size distribution models like the log-normal. In theseefforts, the size distributions were commonly very narrowand the derived number densities were often much smallerthan∼10 cm−3 measured by in situ instruments (e.g., Wanget al., 1989).
Obviously, the dependence of the maximum SAD modelon a priori parameters plays a role in understanding the upperlimit of SAD that can be computed from SAGE II extinctioncoefficient measurements. For instance, doublingNtotal to40 cm−3 yields a 15 to 40% increase in both SADmax andSADmin for Method 1 depending on altitude. The depen-dence is not linear since the increase in number density isin part compensated for by a reduction in the inferred parti-cle size for the small mode aerosol. We find that includinga third monodispersed mode never yields a significant thirdmode for either the minimum or maximum SAD. These re-sults make us confident that two monodispersed modes areyielding the extreme results that we are seeking.
As an extension to this study, we have examined the im-pact of additional measurements on the range of surface area
0.1 1.0 10.0
Surface Area Density
5
10
15
20
25
30
Altitude (
km
)
Fig. 14. This figure shows the comparison of operational SAGEII SAD (black) with the Method 1 SAD using 525-nm aerosol ex-tinction coefficient (red) and the Method 2 SAD using the 525 and1020 nm channels (gold) and the Method 2 SAD computed usingthe channels at 525 and 1020 nm plus a pseudo-infrared channel(grey).
density possible from SAGE II measurements. In particular,we consider including a channel from the infrared where sul-fate aerosol strongly absorbs. In the infrared, provided thatthe refractive index of the aerosol is well known, the aerosolextinction coefficient is roughly proportional to aerosol vol-ume density for a broad range of aerosol sizes and as a re-sult insensitive to aerosol size. We have examined this effectusing the SAGE II operational estimate of aerosol volumewith an uncertainty of 15% as a stand-in for an infrared mea-surement for use along with the 3 visible channel version ofMethod 2. We find that, as shown in Fig. 14, the range ofSAD is reduced to a factor of at least 4 throughout the pro-file relative to the nominal Method 2 results and now liesbetween 1.5 and 2. Since we are using a SAGE II-basedaerosol volume estimate as stand-in for an infrared channel,the range of SAD values should be interpreted cautiously.Nonetheless, we conclude that a mix of visible and infraredaerosol measurements would be a much stronger measure-ment ensemble than either visible or infrared measurementsalone.
5.2 Summary of aerosol surface area density study
The SAD inferred from SAGE II visible and near-infraredaerosol extinction coefficient measurements is mathemati-cally unbounded; however, modest physically-based restric-tions to the underlying particle number density reduces therange of SAD values for background periods to a factor of2 to 15 depending on altitude and assumptions regarding thenature of the measurement uncertainty. It is important to re-member that this range is the outcome of several unrealistic
www.atmos-chem-phys.net/8/983/2008/ Atmos. Chem. Phys., 8, 983–995, 2008

994 L. W. Thomason et al.: SAGE II measurements of stratospheric aerosol properties
assumptions about the nature of the aerosol and the SAGEII measurements. However, this study helps to put a broadbracket around the range of SAD values that can be pro-duced from SAGE II extinction coefficient measurements.Method 1 is the most realistic in its treatment of the SAGEII measurements and measurement errors (forcing errors be-tween channels to be correlated) whereas Method 2 allowsthem to be completely uncorrelated. As a result, we believethat the maximum range of reasonable SAD values aroundthe current operational values is on the order of a factor of2 for non-volcanic conditions. This factor is comparable toor greater than the differences found between the operationalSAGE II SAD and SAD measurements made by in situ mea-surements such as the University of Wyoming Optical Parti-cle Counter (e.g., Thomason and Peter, 2006; Hervig et al.,2002). The SAD model described above may not providereasonable limits in regions of the stratosphere where strongparticle nucleation occurs such as the lower tropical strato-sphere (Brock et al., 1995) or the polar winter middle strato-sphere (Deshler et al., 2003) since number densities may beconsiderably larger than those considered here though theSAGE II-measured extinctions remain valid.
Acknowledgements. We are grateful for the support bySPARC/WCRP and for many helpful discussions with theLead Authors of SPARC’s Assessment of Stratospheric AerosolProperties (ASAP). We also thank the reviewers for their insightfulcomments and efforts toward improving this manuscript.Edited by: W. Ward
References
Anderson, S. M. and Mauersberger, K.: Laser measurements ofozone absorption cross sections in the Chappuis band, Geophys.Res. Lett., 19, 933–936, 1992.
Anderson, S. M., Morton, J., and Mauersberger, K.: Near-infraredabsorption spectra of 16O3 and 18O3: Adiabatic energy of the1A2 state, J. Chem. Phys., 93, 3826–3832, 1990.
Anderson, S. M., Maeder, J., and Mauersberger, K.: Effect of iso-topic substitution on the visible absorption spectrum of ozone, J.Chem. Phys., 94, 6351–6357, 1991.
Anderson, S. M., Hupalo, P., and Mauersberger, K.: Rotationalstructure in the near-infrared absorption spectrum of ozone, J.Chem. Phys., 99, 737-739, 1993a.
Anderson, S. M., Hupalo, P., and Mauersberger, K.: Ozone absorp-tion cross section measurements in the Wulf bands, Geophys.Res. Lett., 20, 1579–1582, 1993b.
Bingen, C., Fussen, D., and Vanhellemont, F.: A global climatol-ogy of stratospheric aerosol size distribution parameters derivedfrom SAGE II data over the period 1984-2000: 2. Reference data,J. Geophys. Res., 109, D06202, doi:10.1029/2003JD003511,2004b.
Borchi, F. and Pommereau, J.-P.: Evaluation of ozonesondes,HALOE, SAGE II and III, Odin-OSIRIS and -SMR, andENVISAT-GOMOS, -SCIAMACHY and -MIPAS ozone profilesin the tropics from SAOZ long duration balloon measurements in2003 and 2004, Atmos. Chem. Phys., 7, 2671–2690, 2007,http://www.atmos-chem-phys.net/7/2671/2007/.
Brock, C. A., Hamill, P., Wilson, J. C., Jonsson, H. H., and Chan, K.R.: Particle formation in the upper tropical troposphere: A sourceof nuclei for the stratospheric aerosol, Science, 270, 1650–1653,1995.
Burkholder, J. B. and Talukdar, R. K.: Temperature dependence ofthe ozone absorption spectrum over the wavelength range 410 to760 nm, Geophys. Res. Lett., 21, 581–584, 1994.
Deshler, T., Hervig, M. E., Hofmann, D. J., Rosen, J. M., andLiley, J. B.: Thirty years of in situ stratospheric aerosol sizedistribution measurements from Laramie, Wyoming (41◦ N) us-ing balloon-borne instruments, J. Geophys. Res., 108, 4167,doi:10.1029/2002JD002514, 2003.
Hervig, M. E. and Deshler, T.: Evaluation of aerosol mea-surements from SAGE II, HALOE, and balloonborne op-tical particle counters, J. Geophys. Res., 107(D3), 4031,doi:10.1029/2001JD000703, 2002.
Hervig, M. E., Deshler, T., and Russell III, J. M.: Aerosol sizedistributions obtained from HALOE spectral extinction measure-ments, J. Geophys. Res., 103, 1573–1583, 1998.
Hofmann, D. J. and Rosen, J. M.: Antarctic observations of strato-spheric aerosol and high altitude condensation nuclei followingthe El Chichon eruption, Geophys. Res. Lett., 12, 13–16, 1985.
McCormick, M. P., Thomason, L. W., and Trepte, C. R.: Atmo-spheric effects of the Mount Pinatubo eruption, Nature, 373,399–404, 1995.
Pitts, M. C. and Thomason, L. W.: The impact of the eruptions ofMount Pinatubo and Cerro Hudson on Antarctic aerosol levelsduring the 1991 austral spring, Geophys. Res. Lett., 20, 2451–2454, 1993.
Randel, W., Udelhofen, P., Fleming, E., Geller, M., Gelman, M.,Hamilton, K., Karoly, D., Ortland, D., Pawson, S., Swinbank,R., Wu, F., Baldwin, M., Chanin, M.-L., Keckhut, P., Labitzke,K., Remsberg, E., Simmons, A., and Wu, D.: The SPARC In-tercomparison of Middle-Atmosphere Climatologies, J. Climate,17, 986–1003, 2004.
Russell, P. B., Livingston, J. M., Pueschel, R. F., Hughes, J. J., Pol-lack, J. B., Brooks, S. L., Hamill, P., Thomason, L. W., Stowe,L. L., Deshler, T., Dutton, E. G., and Berstrom, R. W.: Globalto microscale evolution of the Pinatubo volcanic aerosol, derivedfrom diverse measurements and analyses, J. Geophys. Res., 101,18 745-18 764, 1996.
Shettle, E. P. and Anderson, S. M.: New Visible and Near IROzone Cross Sections for MODTRAN, presented at the 17th An-nual Review Conference on Atmospheric Transmission Models,Phillips Laboratory, Bedford, MA, 7–8 June, 1994.
Steele, H. M. and Hamill, P.: Effects of temperature and humid-ity on the growth and optical properties of sulfuric acid-waterdroplets in the stratosphere, J. Aerosol Sci., 12, 517–528, 1981.
Steele, H. M. and Turco, R. P.: Retrieval of aerosol size distribu-tions from satellite extinction spectra using constrained linear in-version, J. Geophys. Res., 102, 16 737–16 747, 1997.
Thomason, L. W., Kent, G. S., Trepte, C. R., and Poole, L. R.: Acomparison of the stratospheric aerosol background periods of1979 and 1989–1991, J. Geophys. Res., 102, 3611–3616, 1997a.
Thomason, L. W., Poole, L. R., and Deshler, T. R.: A global clima-tology of stratospheric aerosol surface area density as deducedfrom SAGE II: 1984–1994, J. Geophys. Res., 102, 8967–8976,1997b.
Atmos. Chem. Phys., 8, 983–995, 2008 www.atmos-chem-phys.net/8/983/2008/

L. W. Thomason et al.: SAGE II measurements of stratospheric aerosol properties 995
Thomason, L. W. and T. Peter (Eds.): Assessment of StratosphericAerosol Properties (ASAP), SPARC Report No. 4, WCRP-124, WMO/TD-No. 1295, http://www.atmosp.physics.utoronto.ca/SPARC/index.html, February, 2006.
Trepte, C. R., Thomason, L. W., and Kent, G. S.: Banded structuresin stratospheric aerosol distributions, Geophys. Res. Lett., 22,2397–2400, 1994.
Wang, P. H., McCormick, M. P., McMaster, L. R., Chu, W. P.,Swissler, T. J., Osborn, M. T., Russell, P. B., Oberbeck, V. R.,Livingston, J., Rosen, J. M., Hofmann, D. J., Grams, G. W.,Fuller, W. H., and Yue, G. K.: SAGE II aerosol data validationbased on retrieved aerosol model size distribution from SAGE IIaerosol measurements, J. Geophys. Res., 94, 8381–8393, 1989.
Wang, H. J., Cunnold, D. M., Thomason, L. W., Zawodny,J. M., and Bodeker, G. E.: Assessment of SAGE version6.1 ozone data quality, J. Geophys. Res., 107(D23), 4691,doi:10.1029/2002JD002418, 2002.
Yue, G. K.: A new approach to retrieval of aerosol size distributionsand integral properties from SAGE II aerosol extinction spectra,J. Geophys. Res., 104, 27 491–27 506, 1999.
www.atmos-chem-phys.net/8/983/2008/ Atmos. Chem. Phys., 8, 983–995, 2008