SAGAING REGION, MONYWA DISTRICT - myanmar.unfpa.org · 29 Ka Toe(VT) 422 1,533 641 892 30 Mauk...
59
THE REPUBLIC OF THE UNION OF MYANMAR The 2014 Myanmar Populaon and Housing Census Department of Populaon Ministry of Labour, Immigraon and Populaon October 2017 SAGAING REGION, MONYWA DISTRICT Butalin Township Report
Transcript of SAGAING REGION, MONYWA DISTRICT - myanmar.unfpa.org · 29 Ka Toe(VT) 422 1,533 641 892 30 Mauk...
THE REPUBLIC OF THE UNION OF MYANMAR
The 2014 Myanmar Population and Housing Census
Department of Population
Ministry of Labour, Immigration and Population
October 2017
SAGAING REGION, MONYWA DISTRICTButalin Township Report

The 2014 Myanmar Population and Housing Census
Sagaing Region, Monywa District
Butalin Township Report
Department of Population
Ministry of Labour, Immigration and Population
Office No.48
Nay Pyi Taw
Tel: +95 67 431062
www.dop.gov.mm
October 2017

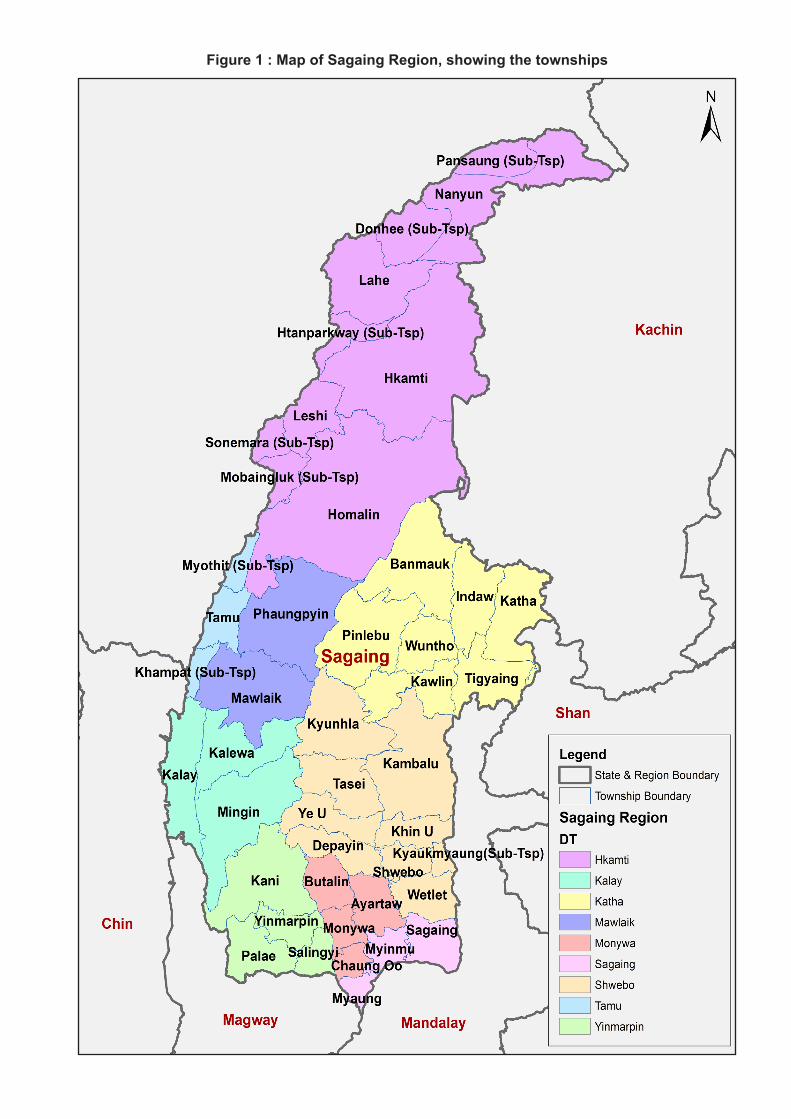
Figure 1 : Map of Sagaing Region, showing the townships

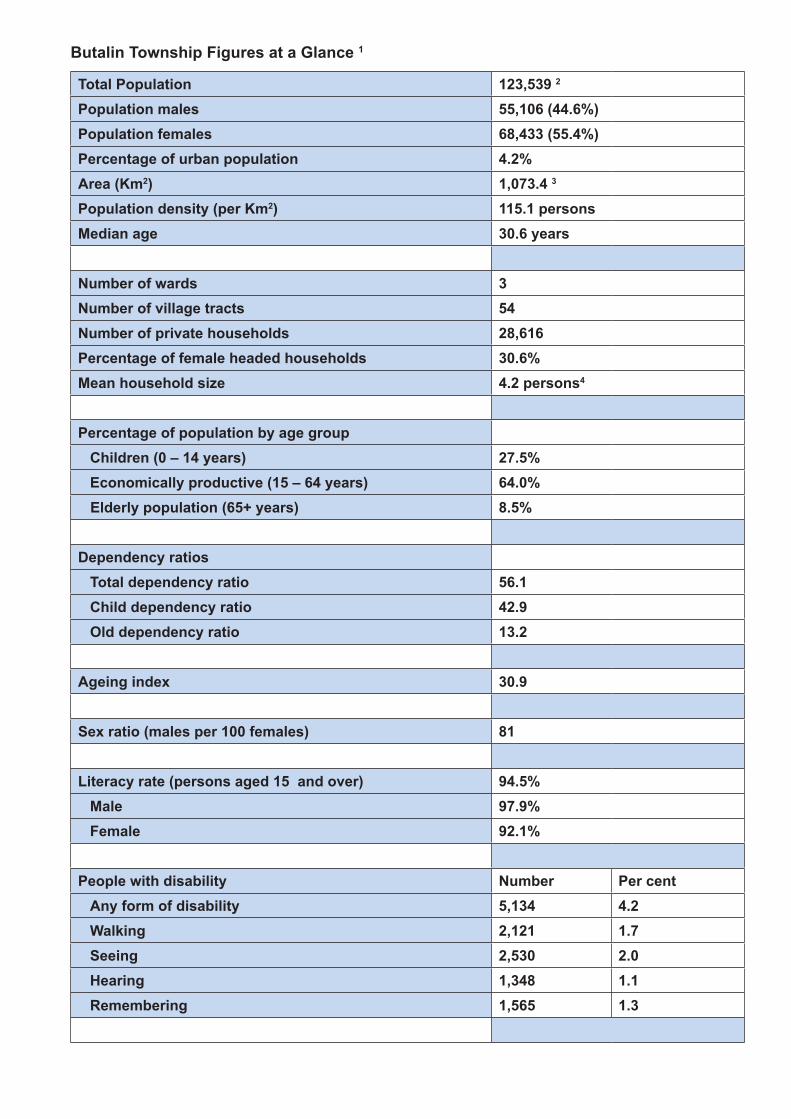
Butalin Township Figures at a Glance 1
Total Population 123,539 2
Population males 55,106 (44.6%)Population females 68,433 (55.4%)Percentage of urban population 4.2%Area (Km2) 1,073.4 3
Population density (per Km2) 115.1 personsMedian age 30.6 years
Number of wards 3Number of village tracts 54Number of private households 28,616Percentage of female headed households 30.6%Mean household size 4.2 persons4
Percentage of population by age groupChildren (0 – 14 years) 27.5%Economically productive (15 – 64 years) 64.0%
Elderly population (65+ years) 8.5%
Dependency ratiosTotal dependency ratio 56.1Child dependency ratio 42.9Old dependency ratio 13.2
Ageing index 30.9
Sex ratio (males per 100 females) 81
Literacy rate (persons aged 15 and over) 94.5%Male 97.9%Female 92.1%
People with disability Number Per centAny form of disability 5,134 4.2Walking 2,121 1.7Seeing 2,530 2.0Hearing 1,348 1.1Remembering 1,565 1.3
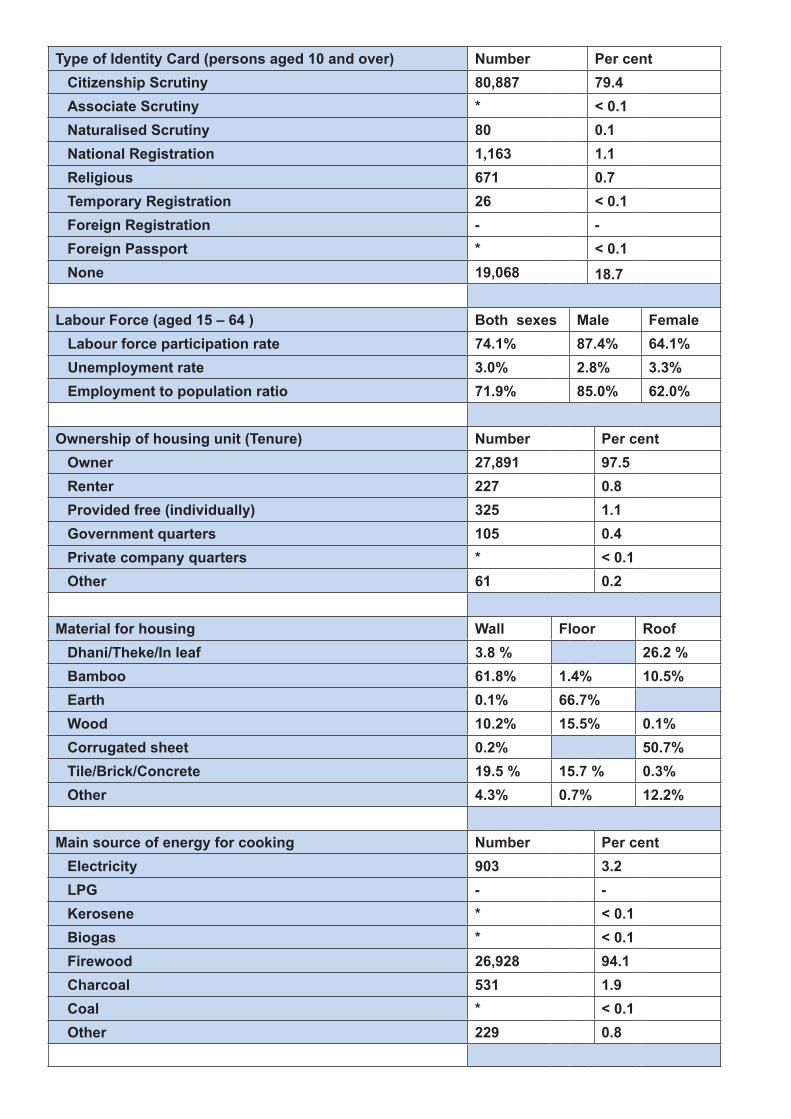
Type of Identity Card (persons aged 10 and over) Number Per centCitizenship Scrutiny 80,887 79.4Associate Scrutiny * < 0.1Naturalised Scrutiny 80 0.1National Registration 1,163 1.1Religious 671 0.7Temporary Registration 26 < 0.1Foreign Registration - -Foreign Passport * < 0.1None 19,068 18.7
Labour Force (aged 15 – 64 ) Both sexes Male Female Labour force participation rate 74.1% 87.4% 64.1% Unemployment rate 3.0% 2.8% 3.3% Employment to population ratio 71.9% 85.0% 62.0%
Ownership of housing unit (Tenure) Number Per centOwner 27,891 97.5 Renter 227 0.8Provided free (individually) 325 1.1Government quarters 105 0.4 Private company quarters * < 0.1Other 61 0.2
Material for housing Wall Floor RoofDhani/Theke/In leaf 3.8 % 26.2 %Bamboo 61.8% 1.4% 10.5%Earth 0.1% 66.7%Wood 10.2% 15.5% 0.1%Corrugated sheet 0.2% 50.7%Tile/Brick/Concrete 19.5 % 15.7 % 0.3%Other 4.3% 0.7% 12.2%
Main source of energy for cooking Number Per centElectricity 903 3.2LPG - -Kerosene * < 0.1Biogas * < 0.1Firewood 26,928 94.1Charcoal 531 1.9Coal * < 0.1Other 229 0.8
Main source of energy for lighting Number Per cent
Electricity 4,907 17.1
Kerosene 38 0.1
Candle 2,973 10.4
Battery 8,724 30.5
Generator (private) 4,576 16.0
Water mill (private) 26 0.1
Solar system/energy 2,525 8.8
Other 4,847 16.9
Main source of drinking water Number Per cent
Tap water/piped 1,476 5.2
Tube well, borehole 13,637 47.6
Protected well/spring 9,674 33.8
Bottled/purifier water 62 0.2
Total Improved Water Sources 24,849 86.8
Unprotected well/spring 616 2.2
Pool/pond/lake 2,186 7.7
River/stream/canal 929 3.2
Waterfall/rainwater * < 0.1
Other 31 0.1
Total Unimproved Water Sources 3,767 13.2
Main source of water for non-drinking use Number Per cent
Tap water/piped 1,905 6.7
Tube well, borehole 11,627 40.6
Protected well/spring 7,320 25.6
Unprotected well/spring 319 1.1
Pool/pond/lake 6,527 22.8
River/stream/canal 871 3.0
Waterfall/rainwater * < 0.1
Bottled/purifier water * < 0.1
Other 45 0.2
Type of toilet Number Per cent
Flush 294 1.0
Water seal (Improved pit latrine) 19,236 67.2
Total Improved Sanitation 19,530 68.2
Pit (Traditional pit latrine) 374 1.3
Bucket (Surface latrine) 56 0.2
Other 31 0.1
None 8,625 30.2
Availability of communication amenities Number Per cent
Radio 15,134 52.9
Television 7,778 27.2
Landline phone 928 3.2
Mobile phone 4,073 14.2
Computer 224 0.8
Internet at home 570 2.0
Households with none of the items 10,178 35.6
Households with all of the items 39 0.1
Availability of Transportation equipment Number Per cent
Car/Truck/Van 239 0.8
Motorcycle/Moped 14,541 50.8
Bicycle 14,540 50.8
4-Wheel tractor 238 0.8
Canoe/Boat 116 0.4
Motor boat 151 0.5
Cart (bullock) 14,342 50.1 Note: 1 Population figures for Butalin Township are as of 29th March 2014.
2 Includes both household population and institution population.
3 Settlement and Land Record Department, Ministry of Agriculture, Livestock and Irrigation, (2014-2015)
4 Calculated based on conventional household population
* Less than 20.
1
Contents
Introduction ................................................................................................................................................3
Census information on Butalin Township ...................................................................................................5
(A) Demographic Characteristics .........................................................................................................7
(B) Religion ........................................................................................................................................12
(C) Education .....................................................................................................................................13
(D) Economic Characteristics ............................................................................................................17
(E) Identity Cards ...............................................................................................................................23
(F) Disability ......................................................................................................................................24
(G) Housing Conditions and Household Amenities ............................................................................27
Type of housing unit .....................................................................................................................27
Type of toilet .................................................................................................................................28
Source of drinking water ..............................................................................................................30
Source of lighting .........................................................................................................................32
Type of cooking fuel .....................................................................................................................34
Communication and related amenities .........................................................................................36
Transportation items ....................................................................................................................38
(H) Fertility and Mortality ....................................................................................................................39
Fertility .........................................................................................................................................39
Childhood Mortality and Maternal Mortality ..................................................................................41
Definitions and Concepts .........................................................................................................................43
List of Contributors ...................................................................................................................................47

3
Introduction
In April 2014, the Government of the Republic of the Union of Myanmar conducted its latest census, after three decades without a Population and Housing Census. In the post-independence period, comprehensive population and housing censuses were only successfully undertaken in 1973, 1983 and most recently in April 2014.
Censuses are an important source of benchmark information on the characteristics of the population and households in every country. One unique feature of a census is its ability to provide information down to the lowest administrative level. Such information is vital for planning and evidence based decision-making at every level. Additional data uses include allocation of national resources; the review of administrative boundaries; the positioning of social infrastructures, drawing national development plans, service provision and developing social infrastructure, and for humanitarian preparedness and response.
The results of the 2014 Census have been published so far in a number of volumes. The first was the Provisional Results released in August 2014. The Census Main Results were launched in May 2015. These included The Union Report, Highlights of the Main Results, and reports of each of the 15 States and Regions. The reports on Occupation and Industry and Religion were launched in March 2016 and July 2016, respectively. All the publications are available online at http://www.dop.gov.mm/ and http://myanmar.unfpa.org/node/15104.
The current set of the 2014 Census publications comprise township and sub-township reports. Their preparation involved collaborative efforts of the Department of Population and UNFPA. This report contains selected demographic and socio-economic characteristics of Butalin Township in Sagaing Region. The information included in this report is the situation of 2014 March 29, Census night. Township level information is very important. However, the level of confidence of township estimates is not the same as Union level information. Some of the townships have relatively small populations; the interpretation of these estimates should be made with caution. Some of the indicators, such as IMR/U5MR, were adopted only after careful analysis considering a number of factors to ensure consistency in the results. Estimates for townships with relatively small number of observations should not be taken as exact estimates of the mortality level, but rather they should be regarded as reasonable indicators for the scale of mortality risk they experience, an indication of which townships are better off and which are in a more vulnerable situation.

5
Census information on Butalin Township

7
(A) Demographic Characteristics
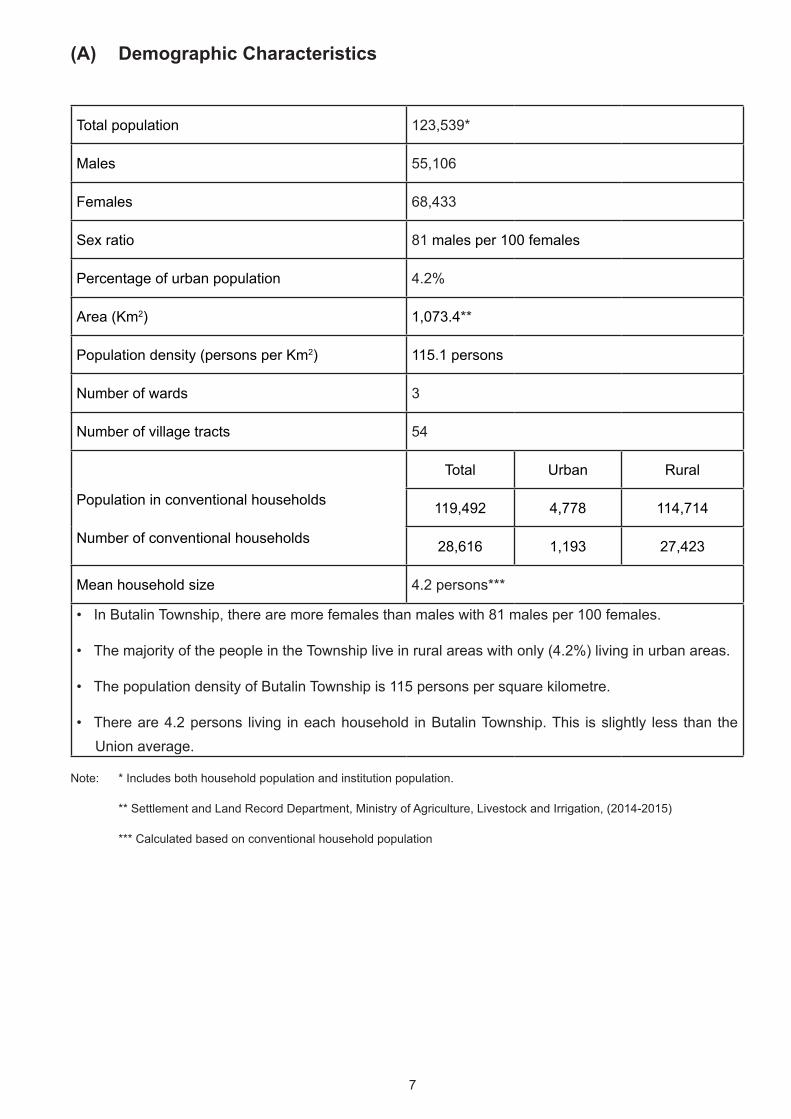
Total population 123,539*
Males 55,106
Females 68,433
Sex ratio 81 males per 100 females
Percentage of urban population 4.2%
Area (Km2) 1,073.4**
Population density (persons per Km2) 115.1 persons
Number of wards 3
Number of village tracts 54
Total Urban Rural
Population in conventional households 119,492 4,778 114,714
Number of conventional households 28,616 1,193 27,423
Mean household size 4.2 persons***
• In Butalin Township, there are more females than males with 81 males per 100 females.
• The majority of the people in the Township live in rural areas with only (4.2%) living in urban areas.
• The population density of Butalin Township is 115 persons per square kilometre.
• There are 4.2 persons living in each household in Butalin Township. This is slightly less than the Union average.
Note: * Includes both household population and institution population.
** Settlement and Land Record Department, Ministry of Agriculture, Livestock and Irrigation, (2014-2015)
*** Calculated based on conventional household population
8
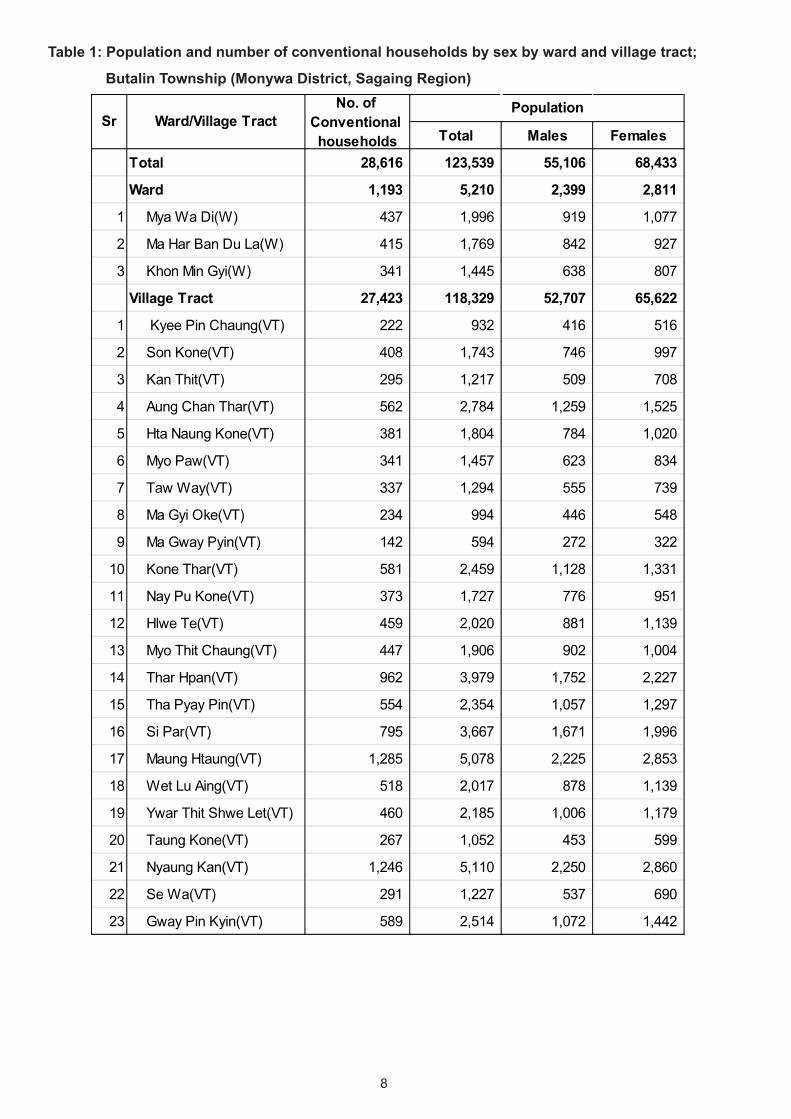
Table 1: Population and number of conventional households by sex by ward and village tract;
Butalin Township (Monywa District, Sagaing Region)
Total Males Females
Total 28,616 123,539 55,106 68,433
Ward 1,193 5,210 2,399 2,811
1 Mya Wa Di(W) 437 1,996 919 1,077
2 Ma Har Ban Du La(W) 415 1,769 842 927
3 Khon Min Gyi(W) 341 1,445 638 807
Village Tract 27,423 118,329 52,707 65,622
1 Kyee Pin Chaung(VT) 222 932 416 516
2 Son Kone(VT) 408 1,743 746 997
3 Kan Thit(VT) 295 1,217 509 708
4 Aung Chan Thar(VT) 562 2,784 1,259 1,525
5 Hta Naung Kone(VT) 381 1,804 784 1,020
6 Myo Paw(VT) 341 1,457 623 834
7 Taw Way(VT) 337 1,294 555 739
8 Ma Gyi Oke(VT) 234 994 446 548
9 Ma Gway Pyin(VT) 142 594 272 322
10 Kone Thar(VT) 581 2,459 1,128 1,331
11 Nay Pu Kone(VT) 373 1,727 776 951
12 Hlwe Te(VT) 459 2,020 881 1,139
13 Myo Thit Chaung(VT) 447 1,906 902 1,004
14 Thar Hpan(VT) 962 3,979 1,752 2,227
15 Tha Pyay Pin(VT) 554 2,354 1,057 1,297
16 Si Par(VT) 795 3,667 1,671 1,996
17 Maung Htaung(VT) 1,285 5,078 2,225 2,853
18 Wet Lu Aing(VT) 518 2,017 878 1,139
19 Ywar Thit Shwe Let(VT) 460 2,185 1,006 1,179
20 Taung Kone(VT) 267 1,052 453 599
21 Nyaung Kan(VT) 1,246 5,110 2,250 2,860
22 Se Wa(VT) 291 1,227 537 690
23 Gway Pin Kyin(VT) 589 2,514 1,072 1,442
Sr Ward/Village TractNo. of
Conventional households
Population
9
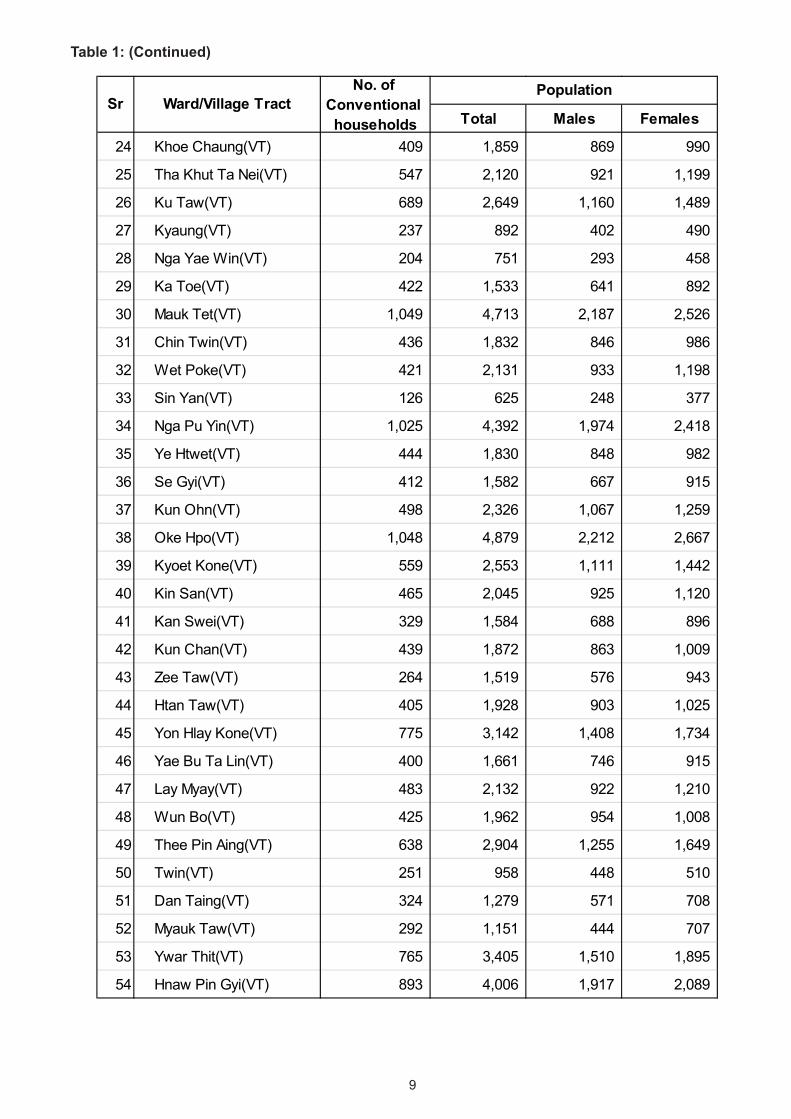
Table 1: (Continued)
Total Males Females
24 Khoe Chaung(VT) 409 1,859 869 990
25 Tha Khut Ta Nei(VT) 547 2,120 921 1,199
26 Ku Taw(VT) 689 2,649 1,160 1,489
27 Kyaung(VT) 237 892 402 490
28 Nga Yae Win(VT) 204 751 293 458
29 Ka Toe(VT) 422 1,533 641 892
30 Mauk Tet(VT) 1,049 4,713 2,187 2,526
31 Chin Twin(VT) 436 1,832 846 986
32 Wet Poke(VT) 421 2,131 933 1,198
33 Sin Yan(VT) 126 625 248 377
34 Nga Pu Yin(VT) 1,025 4,392 1,974 2,418
35 Ye Htwet(VT) 444 1,830 848 982
36 Se Gyi(VT) 412 1,582 667 915
37 Kun Ohn(VT) 498 2,326 1,067 1,259
38 Oke Hpo(VT) 1,048 4,879 2,212 2,667
39 Kyoet Kone(VT) 559 2,553 1,111 1,442
40 Kin San(VT) 465 2,045 925 1,120
41 Kan Swei(VT) 329 1,584 688 896
42 Kun Chan(VT) 439 1,872 863 1,009
43 Zee Taw(VT) 264 1,519 576 943
44 Htan Taw(VT) 405 1,928 903 1,025
45 Yon Hlay Kone(VT) 775 3,142 1,408 1,734
46 Yae Bu Ta Lin(VT) 400 1,661 746 915
47 Lay Myay(VT) 483 2,132 922 1,210
48 Wun Bo(VT) 425 1,962 954 1,008
49 Thee Pin Aing(VT) 638 2,904 1,255 1,649
50 Twin(VT) 251 958 448 510
51 Dan Taing(VT) 324 1,279 571 708
52 Myauk Taw(VT) 292 1,151 444 707
53 Ywar Thit(VT) 765 3,405 1,510 1,895
54 Hnaw Pin Gyi(VT) 893 4,006 1,917 2,089
Sr Ward/Village TractNo. of
Conventional households
Population
10
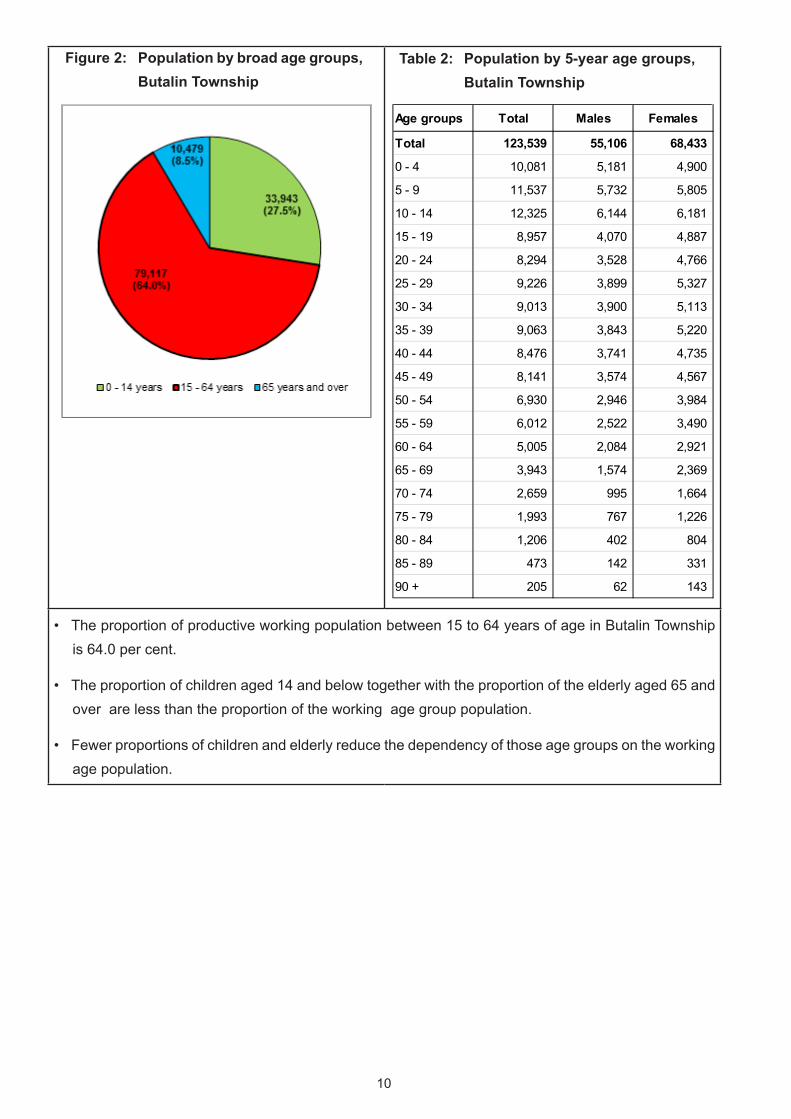
• The proportion of productive working population between 15 to 64 years of age in Butalin Township is 64.0 per cent.
• The proportion of children aged 14 and below together with the proportion of the elderly aged 65 and over are less than the proportion of the working age group population.
• Fewer proportions of children and elderly reduce the dependency of those age groups on the working age population.
Age groups Total Males Females
Total 123,539 55,106 68,433
0 - 4 10,081 5,181 4,900
5 - 9 11,537 5,732 5,805
10 - 14 12,325 6,144 6,181
15 - 19 8,957 4,070 4,887
20 - 24 8,294 3,528 4,766
25 - 29 9,226 3,899 5,327
30 - 34 9,013 3,900 5,113
35 - 39 9,063 3,843 5,220
40 - 44 8,476 3,741 4,735
45 - 49 8,141 3,574 4,567
50 - 54 6,930 2,946 3,984
55 - 59 6,012 2,522 3,490
60 - 64 5,005 2,084 2,921
65 - 69 3,943 1,574 2,369
70 - 74 2,659 995 1,664
75 - 79 1,993 767 1,226
80 - 84 1,206 402 804
85 - 89 473 142 331
90 + 205 62 143
Figure 2: Population by broad age groups, Butalin Township
Table 2: Population by 5-year age groups, Butalin Township
11
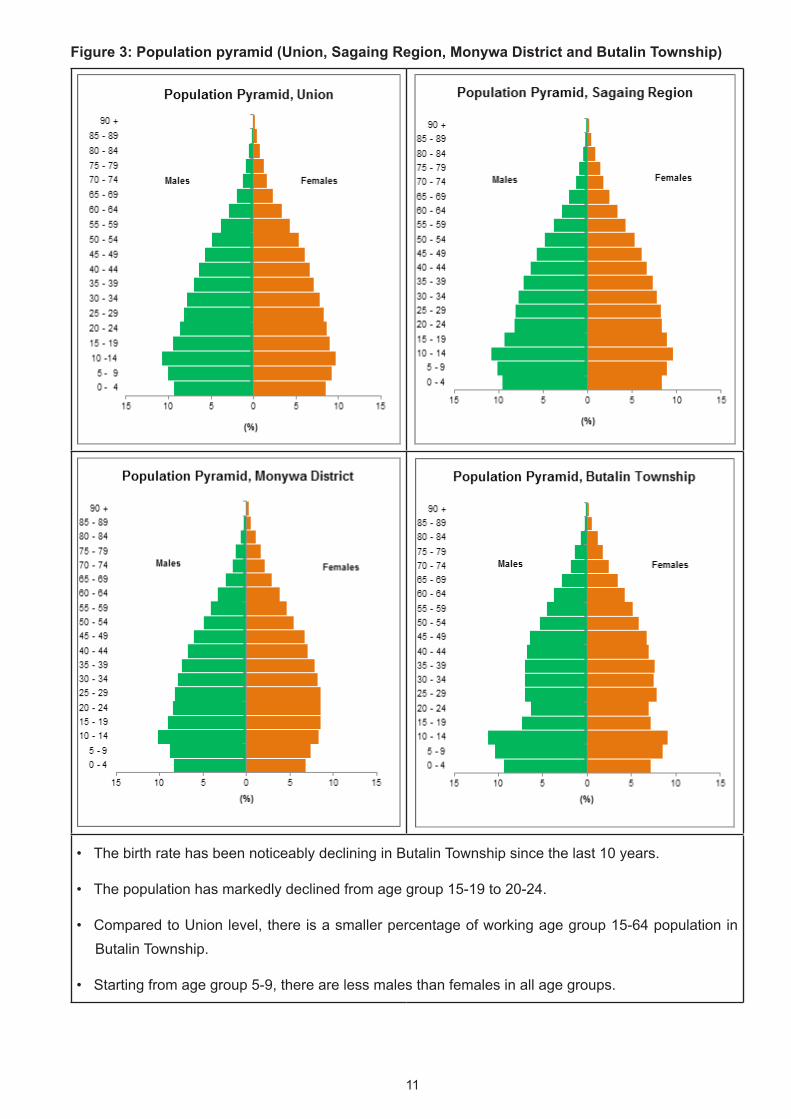
Figure 3: Population pyramid (Union, Sagaing Region, Monywa District and Butalin Township)
• The birth rate has been noticeably declining in Butalin Township since the last 10 years.
• The population has markedly declined from age group 15-19 to 20-24.
• Compared to Union level, there is a smaller percentage of working age group 15-64 population in Butalin Township.
• Starting from age group 5-9, there are less males than females in all age groups.
12
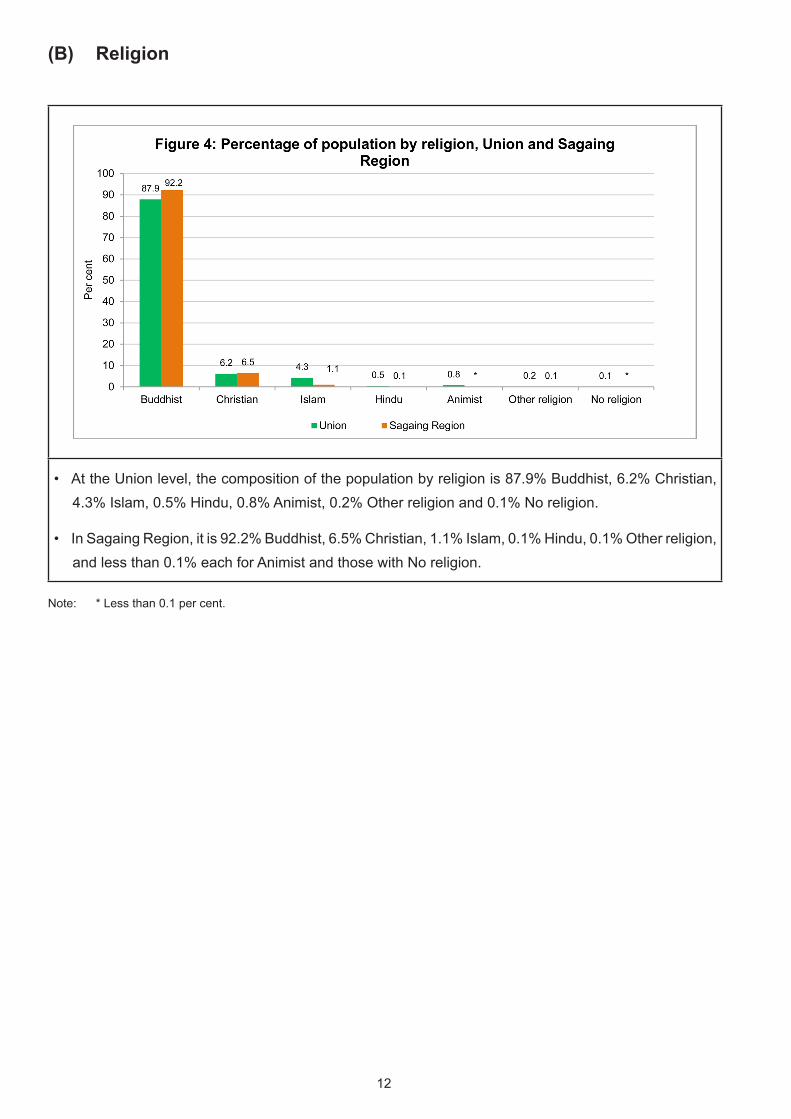
(B) Religion
• At the Union level, the composition of the population by religion is 87.9% Buddhist, 6.2% Christian, 4.3% Islam, 0.5% Hindu, 0.8% Animist, 0.2% Other religion and 0.1% No religion.
• In Sagaing Region, it is 92.2% Buddhist, 6.5% Christian, 1.1% Islam, 0.1% Hindu, 0.1% Other religion, and less than 0.1% each for Animist and those with No religion.
Note: * Less than 0.1 per cent.
13
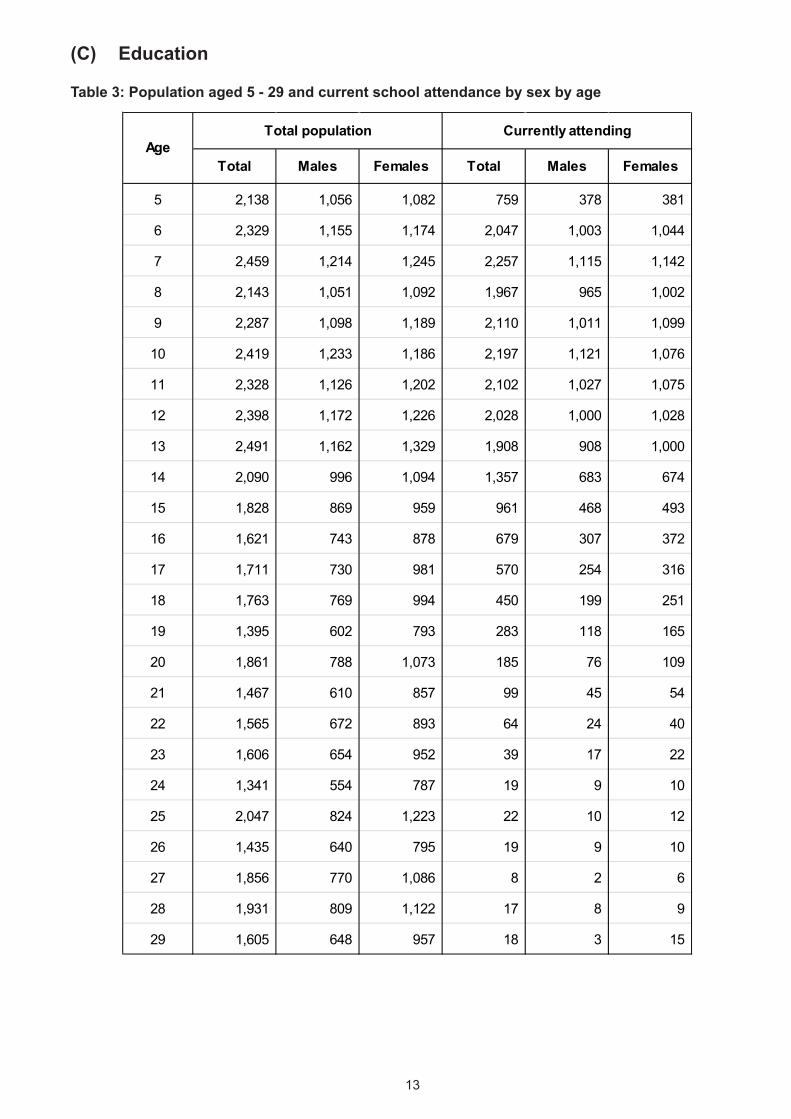
(C) Education
Table 3: Population aged 5 - 29 and current school attendance by sex by age
Total Males Females Total Males Females
5 2,138 1,056 1,082 759 378 381
6 2,329 1,155 1,174 2,047 1,003 1,044
7 2,459 1,214 1,245 2,257 1,115 1,142
8 2,143 1,051 1,092 1,967 965 1,002
9 2,287 1,098 1,189 2,110 1,011 1,099
10 2,419 1,233 1,186 2,197 1,121 1,076
11 2,328 1,126 1,202 2,102 1,027 1,075
12 2,398 1,172 1,226 2,028 1,000 1,028
13 2,491 1,162 1,329 1,908 908 1,000
14 2,090 996 1,094 1,357 683 674
15 1,828 869 959 961 468 493
16 1,621 743 878 679 307 372
17 1,711 730 981 570 254 316
18 1,763 769 994 450 199 251
19 1,395 602 793 283 118 165
20 1,861 788 1,073 185 76 109
21 1,467 610 857 99 45 54
22 1,565 672 893 64 24 40
23 1,606 654 952 39 17 22
24 1,341 554 787 19 9 10
25 2,047 824 1,223 22 10 12
26 1,435 640 795 19 9 10
27 1,856 770 1,086 8 2 6
28 1,931 809 1,122 17 8 9
29 1,605 648 957 18 3 15
Total population Currently attendingAge
14
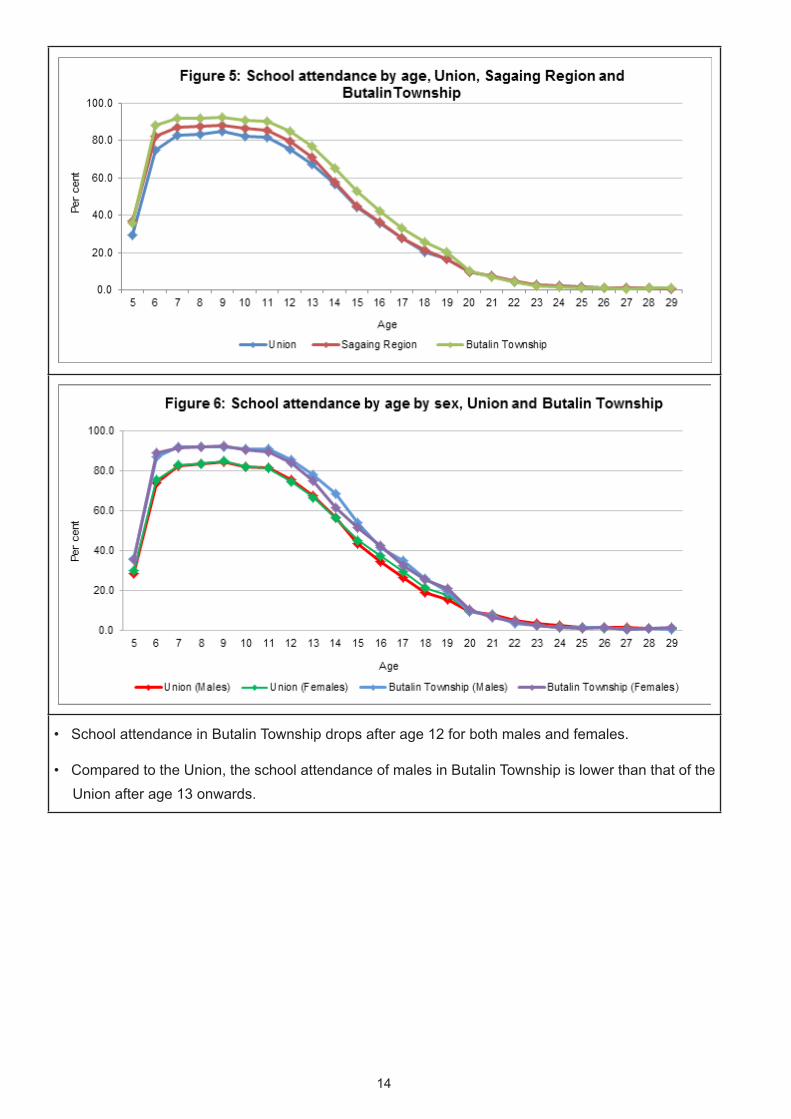
• School attendance in Butalin Township drops after age 12 for both males and females.
• Compared to the Union, the school attendance of males in Butalin Township is lower than that of the Union after age 13 onwards.
15
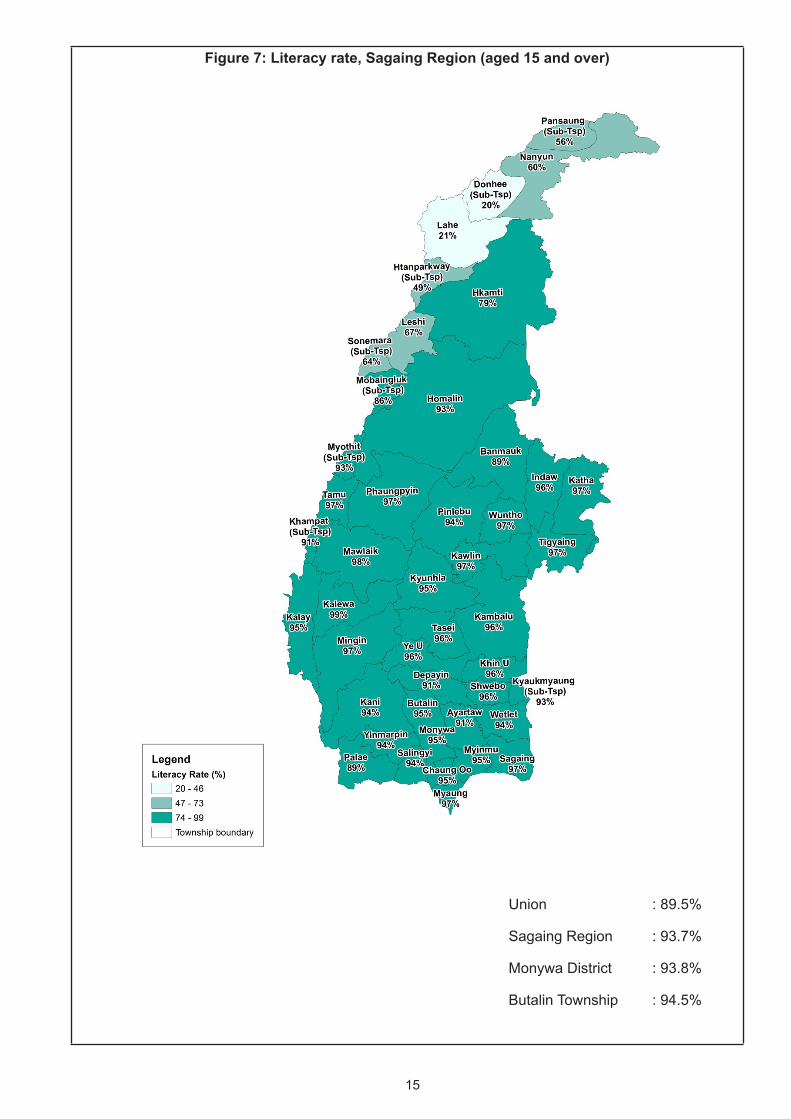
Figure 7: Literacy rate, Sagaing Region (aged 15 and over)
Union : 89.5%
Sagaing Region : 93.7%
Monywa District : 93.8%
Butalin Township : 94.5%
16
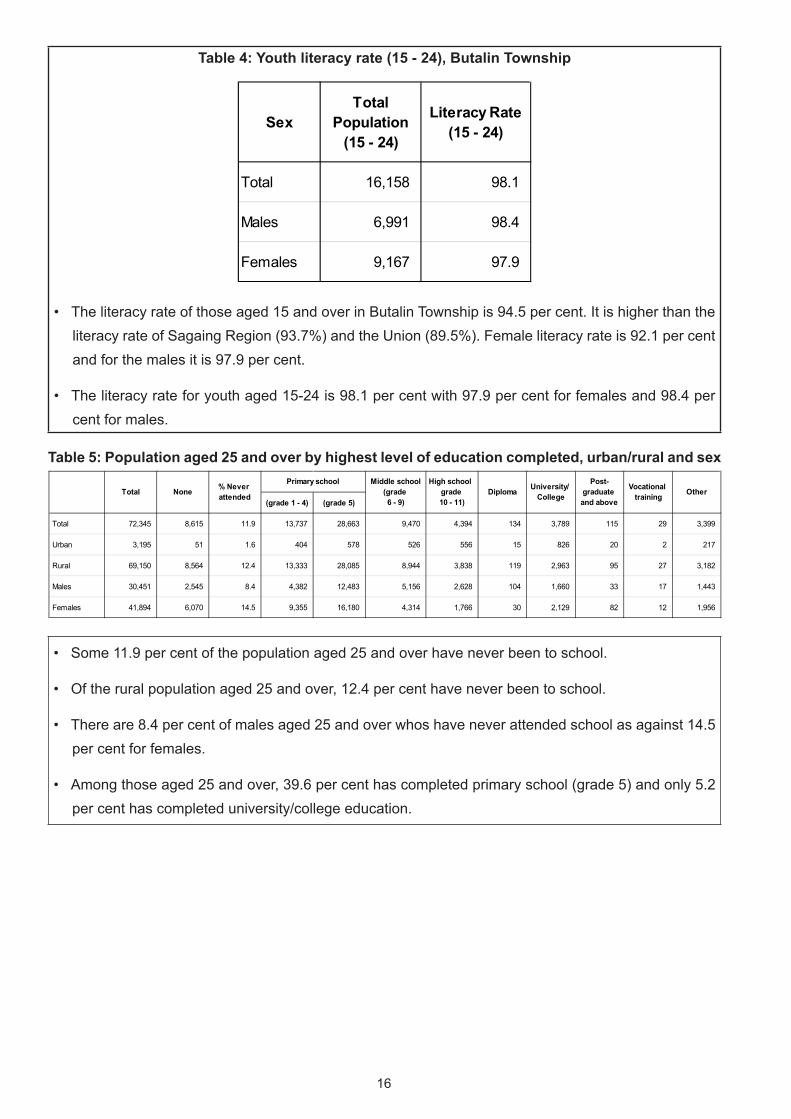
Table 4: Youth literacy rate (15 - 24), Butalin Township
• The literacy rate of those aged 15 and over in Butalin Township is 94.5 per cent. It is higher than the literacy rate of Sagaing Region (93.7%) and the Union (89.5%). Female literacy rate is 92.1 per cent and for the males it is 97.9 per cent.
• The literacy rate for youth aged 15-24 is 98.1 per cent with 97.9 per cent for females and 98.4 per cent for males.
Table 5: Population aged 25 and over by highest level of education completed, urban/rural and sex
• Some 11.9 per cent of the population aged 25 and over have never been to school.
• Of the rural population aged 25 and over, 12.4 per cent have never been to school.
• There are 8.4 per cent of males aged 25 and over whos have never attended school as against 14.5 per cent for females.
• Among those aged 25 and over, 39.6 per cent has completed primary school (grade 5) and only 5.2 per cent has completed university/college education.
SexTotal
Population(15 - 24)
Literacy Rate(15 - 24)
Total 16,158 98.1
Males 6,991 98.4
Females 9,167 97.9
(grade 1 - 4) (grade 5)
Total 72,345 8,615 11.9 13,737 28,663 9,470 4,394 134 3,789 115 29 3,399
Urban 3,195 51 1.6 404 578 526 556 15 826 20 2 217
Rural 69,150 8,564 12.4 13,333 28,085 8,944 3,838 119 2,963 95 27 3,182
Males 30,451 2,545 8.4 4,382 12,483 5,156 2,628 104 1,660 33 17 1,443
Females 41,894 6,070 14.5 9,355 16,180 4,314 1,766 30 2,129 82 12 1,956
OtherTotal None % Never attended
Primary school Middle school(grade 6 - 9)
High school grade 10 - 11)
Diploma University/ College
Post-graduate and above
Vocational training
17
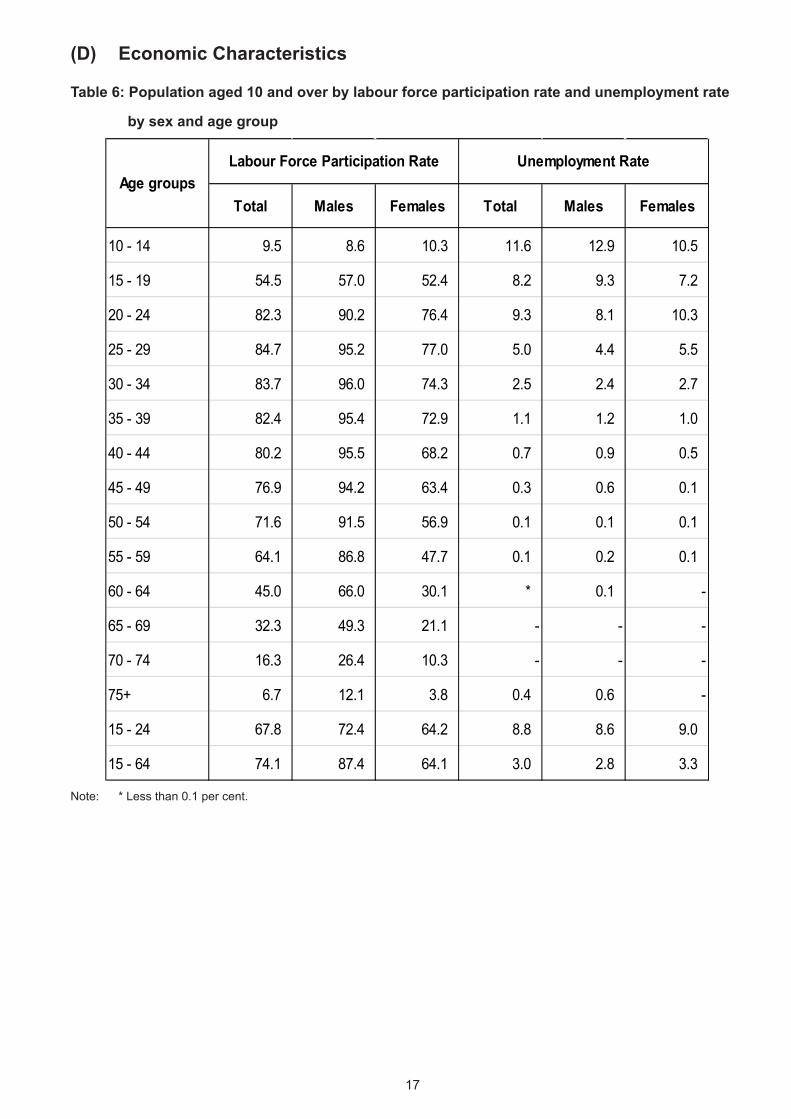
(D) Economic Characteristics
Table 6: Population aged 10 and over by labour force participation rate and unemployment rate
by sex and age group
Note: * Less than 0.1 per cent.
Total Males Females Total Males Females
10 - 14 9.5 8.6 10.3 11.6 12.9 10.5
15 - 19 54.5 57.0 52.4 8.2 9.3 7.2
20 - 24 82.3 90.2 76.4 9.3 8.1 10.3
25 - 29 84.7 95.2 77.0 5.0 4.4 5.5
30 - 34 83.7 96.0 74.3 2.5 2.4 2.7
35 - 39 82.4 95.4 72.9 1.1 1.2 1.0
40 - 44 80.2 95.5 68.2 0.7 0.9 0.5
45 - 49 76.9 94.2 63.4 0.3 0.6 0.1
50 - 54 71.6 91.5 56.9 0.1 0.1 0.1
55 - 59 64.1 86.8 47.7 0.1 0.2 0.1
60 - 64 45.0 66.0 30.1 * 0.1 -
65 - 69 32.3 49.3 21.1 - - -
70 - 74 16.3 26.4 10.3 - - -
75+ 6.7 12.1 3.8 0.4 0.6 -
15 - 24 67.8 72.4 64.2 8.8 8.6 9.0
15 - 64 74.1 87.4 64.1 3.0 2.8 3.3
Age groupsLabour Force Participation Rate Unemployment Rate
18
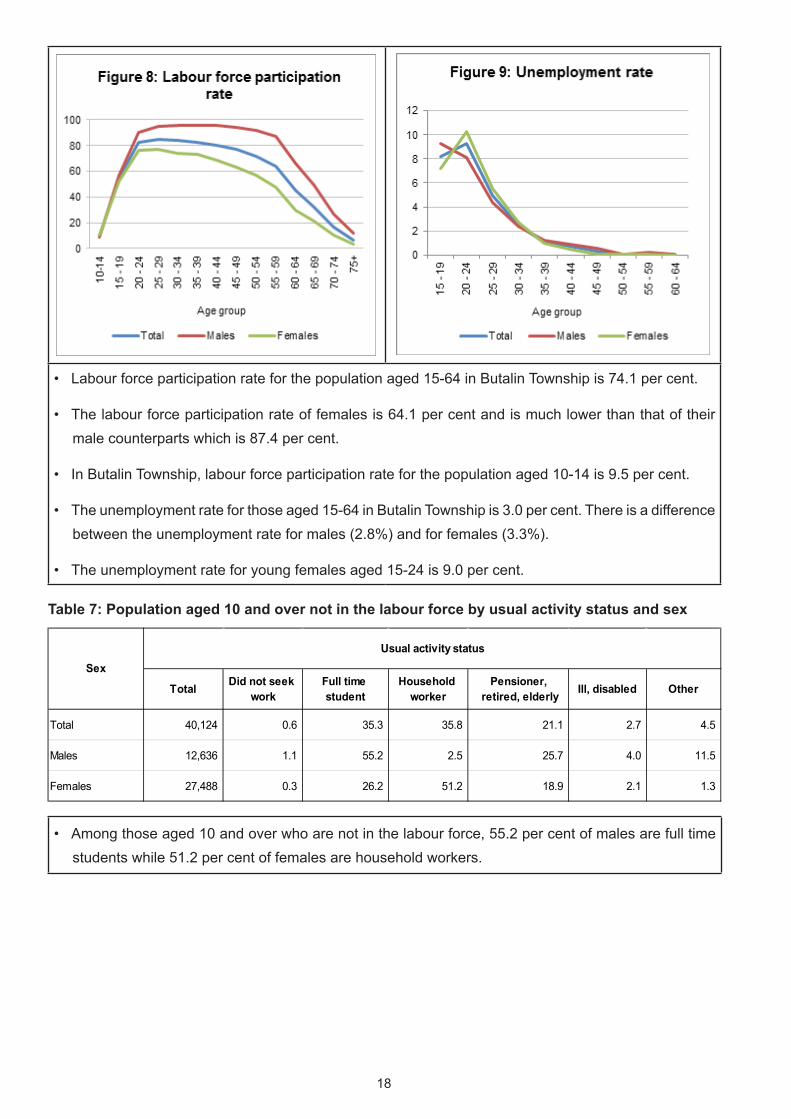
• Labour force participation rate for the population aged 15-64 in Butalin Township is 74.1 per cent.
• The labour force participation rate of females is 64.1 per cent and is much lower than that of their male counterparts which is 87.4 per cent.
• In Butalin Township, labour force participation rate for the population aged 10-14 is 9.5 per cent.
• The unemployment rate for those aged 15-64 in Butalin Township is 3.0 per cent. There is a difference between the unemployment rate for males (2.8%) and for females (3.3%).
• The unemployment rate for young females aged 15-24 is 9.0 per cent.
Table 7: Population aged 10 and over not in the labour force by usual activity status and sex
• Among those aged 10 and over who are not in the labour force, 55.2 per cent of males are full time students while 51.2 per cent of females are household workers.
Total Did not seek work
Full time student
Household worker
Pensioner, retired, elderly Ill, disabled Other
Total 40,124 0.6 35.3 35.8 21.1 2.7 4.5
Males 12,636 1.1 55.2 2.5 25.7 4.0 11.5
Females 27,488 0.3 26.2 51.2 18.9 2.1 1.3
SexUsual activity status
19
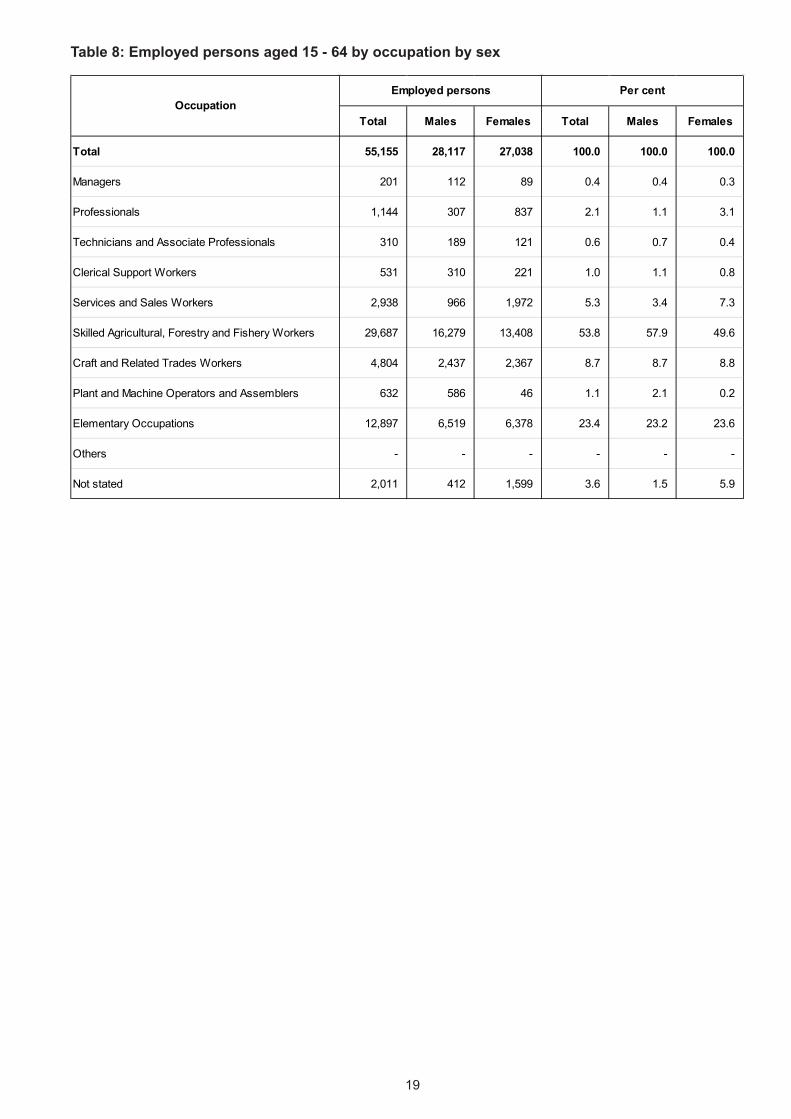
Table 8: Employed persons aged 15 - 64 by occupation by sex
Total Males Females Total Males Females
Total 55,155 28,117 27,038 100.0 100.0 100.0
Managers 201 112 89 0.4 0.4 0.3
Professionals 1,144 307 837 2.1 1.1 3.1
Technicians and Associate Professionals 310 189 121 0.6 0.7 0.4
Clerical Support Workers 531 310 221 1.0 1.1 0.8
Services and Sales Workers 2,938 966 1,972 5.3 3.4 7.3
Skilled Agricultural, Forestry and Fishery Workers 29,687 16,279 13,408 53.8 57.9 49.6
Craft and Related Trades Workers 4,804 2,437 2,367 8.7 8.7 8.8
Plant and Machine Operators and Assemblers 632 586 46 1.1 2.1 0.2
Elementary Occupations 12,897 6,519 6,378 23.4 23.2 23.6
Others - - - - - -
Not stated 2,011 412 1,599 3.6 1.5 5.9
Employed persons Per centOccupation
20
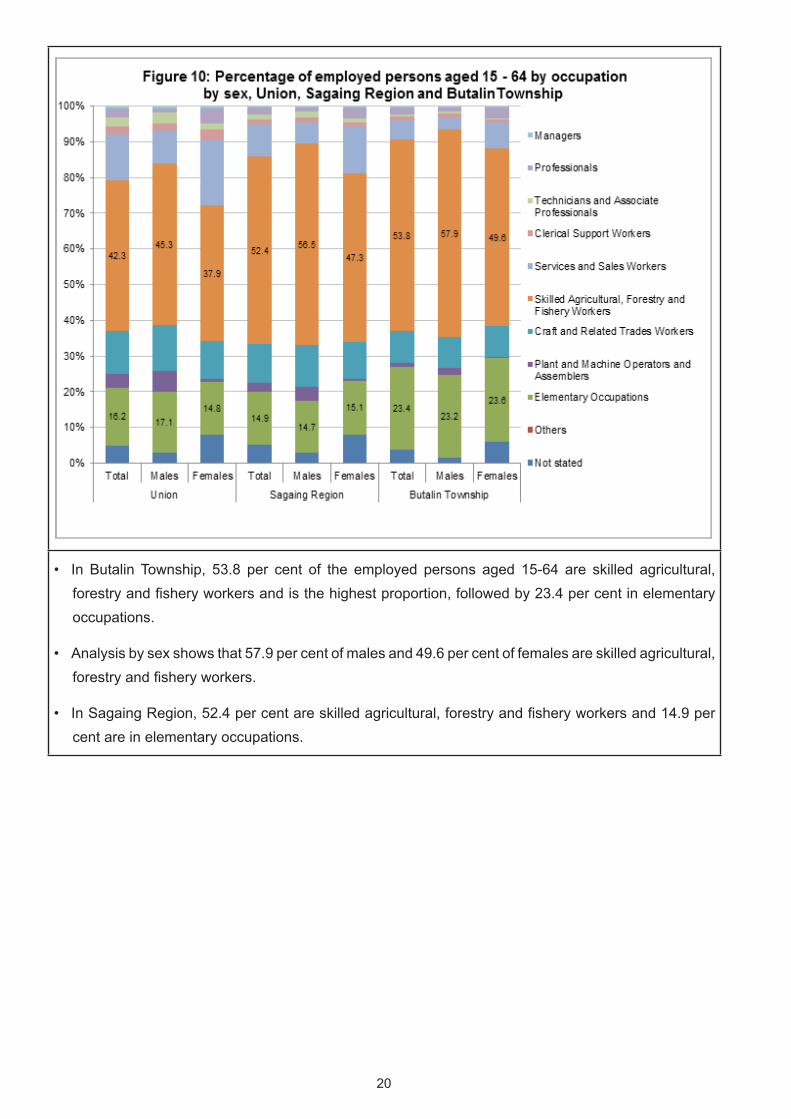
• In Butalin Township, 53.8 per cent of the employed persons aged 15-64 are skilled agricultural, forestry and fishery workers and is the highest proportion, followed by 23.4 per cent in elementary occupations.
• Analysis by sex shows that 57.9 per cent of males and 49.6 per cent of females are skilled agricultural, forestry and fishery workers.
• In Sagaing Region, 52.4 per cent are skilled agricultural, forestry and fishery workers and 14.9 per cent are in elementary occupations.
21
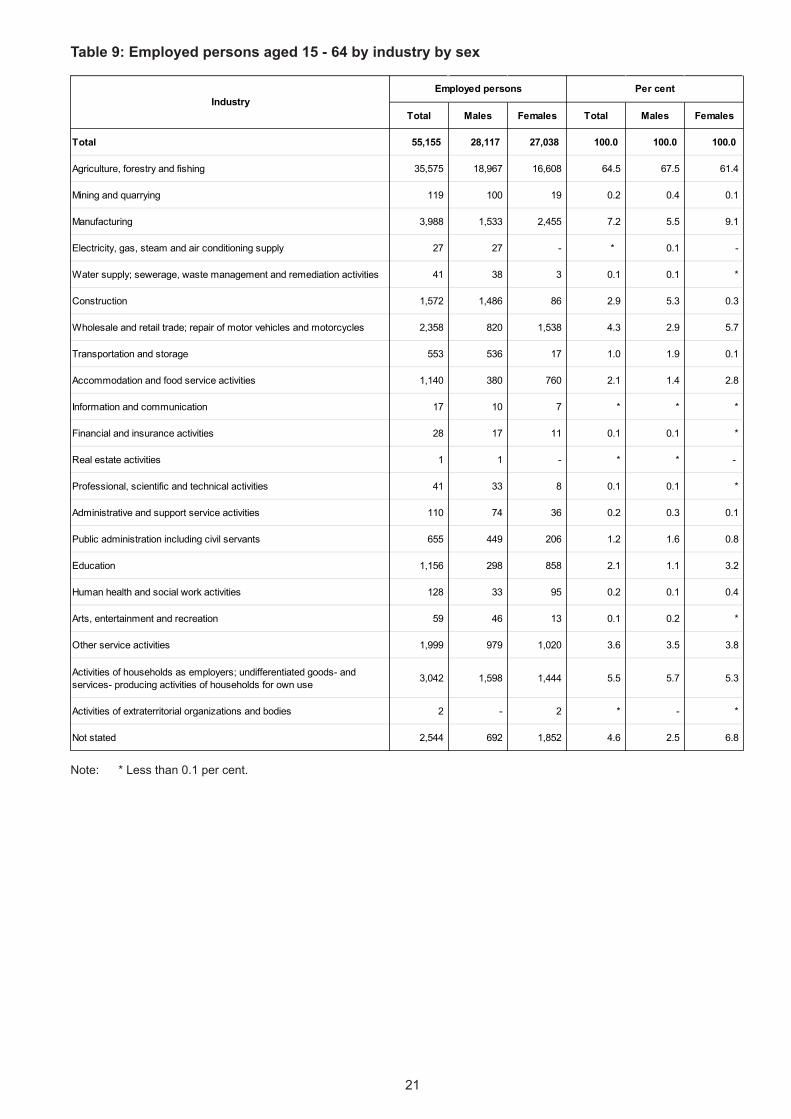
Table 9: Employed persons aged 15 - 64 by industry by sex
Note: * Less than 0.1 per cent.
Total Males Females Total Males Females
Total 55,155 28,117 27,038 100.0 100.0 100.0
Agriculture, forestry and fishing 35,575 18,967 16,608 64.5 67.5 61.4
Mining and quarrying 119 100 19 0.2 0.4 0.1
Manufacturing 3,988 1,533 2,455 7.2 5.5 9.1
Electricity, gas, steam and air conditioning supply 27 27 - * 0.1 -
Water supply; sewerage, waste management and remediation activities 41 38 3 0.1 0.1 *
Construction 1,572 1,486 86 2.9 5.3 0.3
Wholesale and retail trade; repair of motor vehicles and motorcycles 2,358 820 1,538 4.3 2.9 5.7
Transportation and storage 553 536 17 1.0 1.9 0.1
Accommodation and food service activities 1,140 380 760 2.1 1.4 2.8
Information and communication 17 10 7 * * *
Financial and insurance activities 28 17 11 0.1 0.1 *
Real estate activities 1 1 - * * -
Professional, scientific and technical activities 41 33 8 0.1 0.1 *
Administrative and support service activities 110 74 36 0.2 0.3 0.1
Public administration including civil servants 655 449 206 1.2 1.6 0.8
Education 1,156 298 858 2.1 1.1 3.2
Human health and social work activities 128 33 95 0.2 0.1 0.4
Arts, entertainment and recreation 59 46 13 0.1 0.2 *
Other service activities 1,999 979 1,020 3.6 3.5 3.8
Activities of households as employers; undifferentiated goods- and services- producing activities of households for own use
3,042 1,598 1,444 5.5 5.7 5.3
Activities of extraterritorial organizations and bodies 2 - 2 * - *
Not stated 2,544 692 1,852 4.6 2.5 6.8
Employed persons Per centIndustry
22
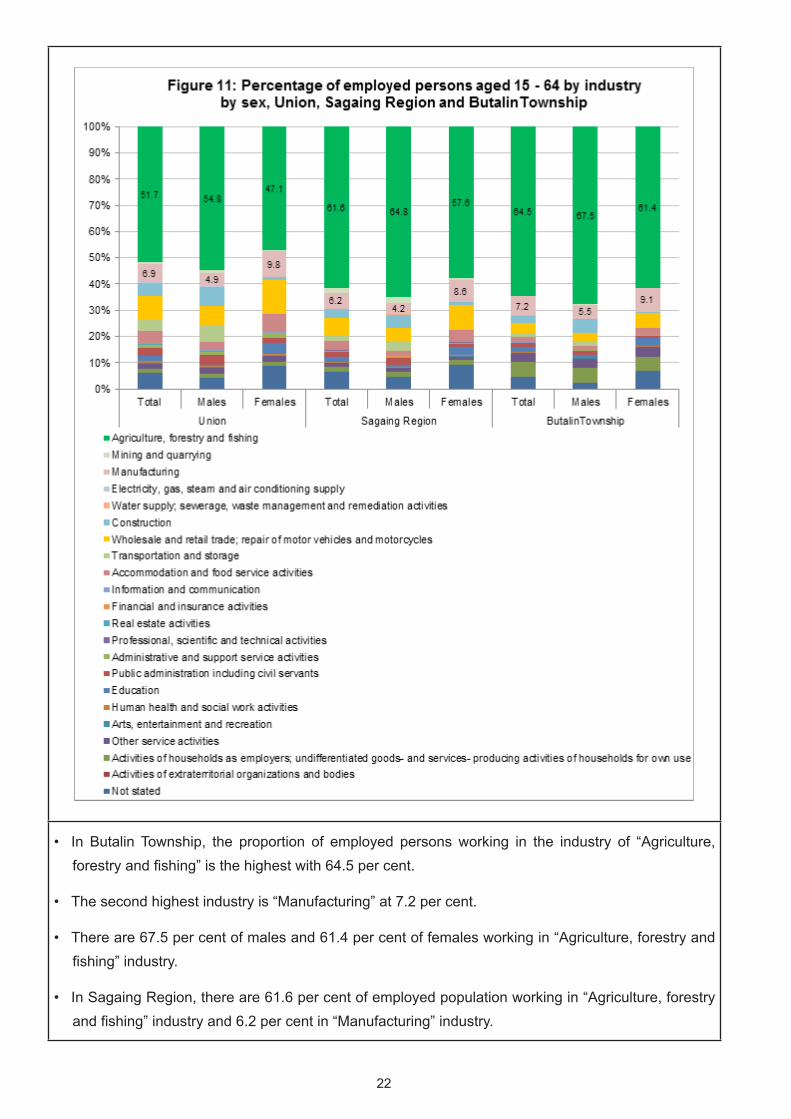
• In Butalin Township, the proportion of employed persons working in the industry of “Agriculture, forestry and fishing” is the highest with 64.5 per cent.
• The second highest industry is “Manufacturing” at 7.2 per cent.
• There are 67.5 per cent of males and 61.4 per cent of females working in “Agriculture, forestry and fishing” industry.
• In Sagaing Region, there are 61.6 per cent of employed population working in “Agriculture, forestry and fishing” industry and 6.2 per cent in “Manufacturing” industry.
23
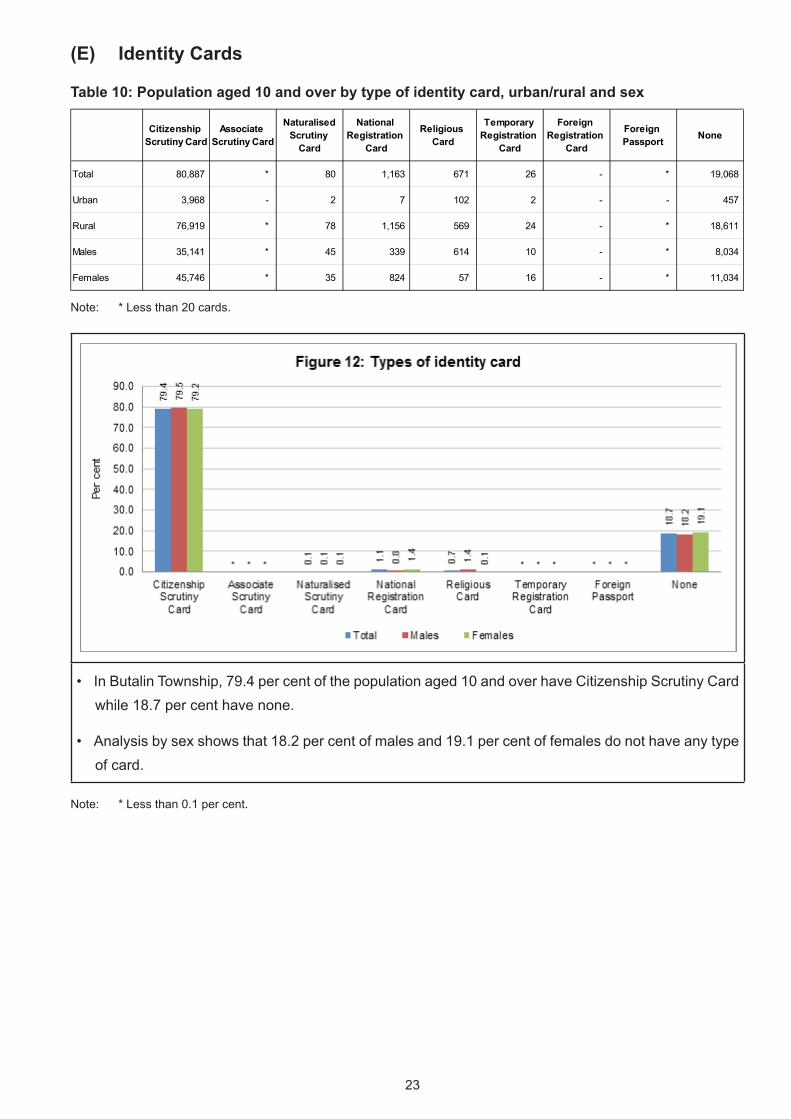
(E) Identity Cards
Table 10: Population aged 10 and over by type of identity card, urban/rural and sex
Note: * Less than 20 cards.
• In Butalin Township, 79.4 per cent of the population aged 10 and over have Citizenship Scrutiny Card while 18.7 per cent have none.
• Analysis by sex shows that 18.2 per cent of males and 19.1 per cent of females do not have any type of card.
Note: * Less than 0.1 per cent.
Citizenship Scrutiny Card
Associate Scrutiny Card
NaturalisedScrutiny
Card
National Registration
Card
Religious Card
Temporary Registration
Card
Foreign Registration
Card
Foreign Passport None
Total 80,887 * 80 1,163 671 26 - * 19,068
Urban 3,968 - 2 7 102 2 - - 457
Rural 76,919 * 78 1,156 569 24 - * 18,611
Males 35,141 * 45 339 614 10 - * 8,034
Females 45,746 * 35 824 57 16 - * 11,034
24
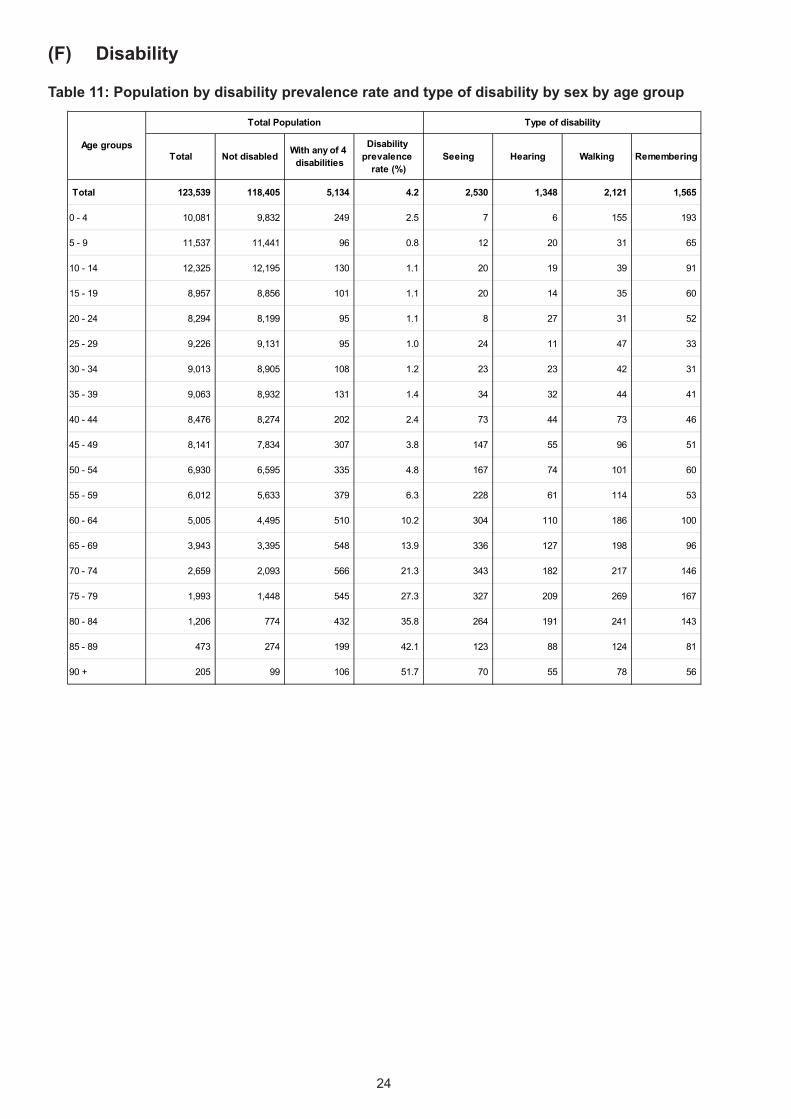
(F) Disability
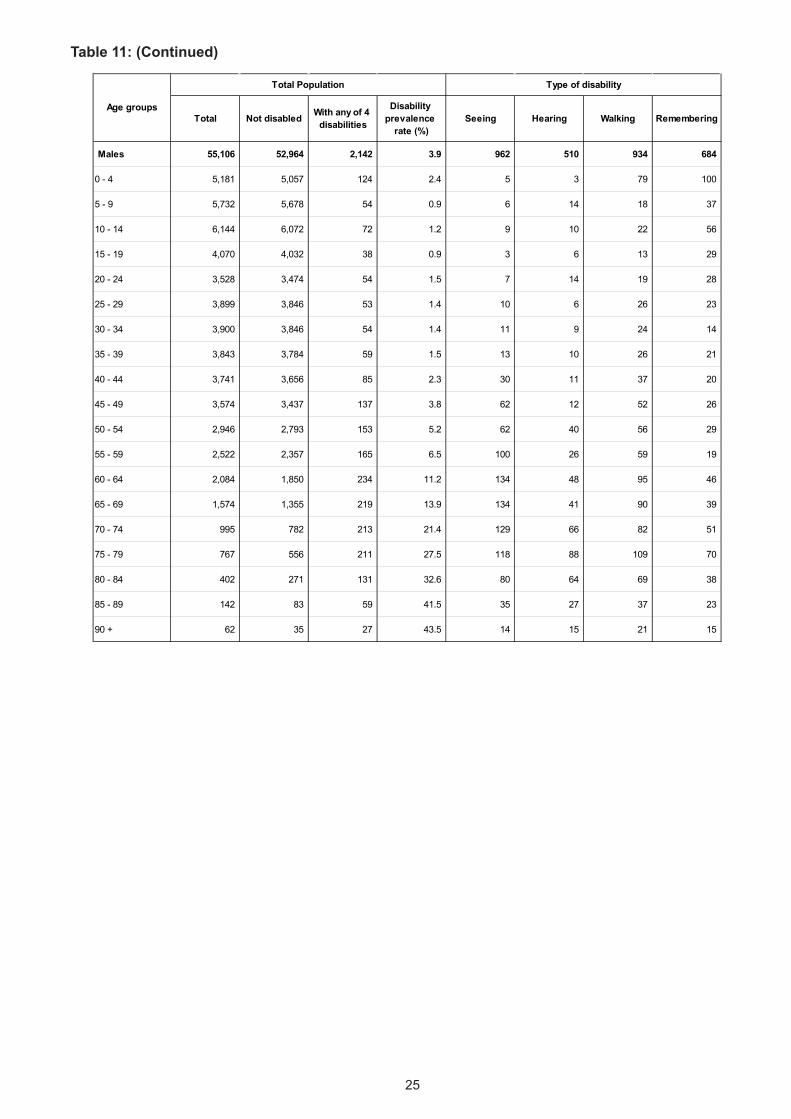
Table 11: Population by disability prevalence rate and type of disability by sex by age group
Total Not disabled With any of 4 disabilities
Disability prevalence
rate (%)Seeing Hearing Walking Remembering
Total 123,539 118,405 5,134 4.2 2,530 1,348 2,121 1,565
0 - 4 10,081 9,832 249 2.5 7 6 155 193
5 - 9 11,537 11,441 96 0.8 12 20 31 65
10 - 14 12,325 12,195 130 1.1 20 19 39 91
15 - 19 8,957 8,856 101 1.1 20 14 35 60
20 - 24 8,294 8,199 95 1.1 8 27 31 52
25 - 29 9,226 9,131 95 1.0 24 11 47 33
30 - 34 9,013 8,905 108 1.2 23 23 42 31
35 - 39 9,063 8,932 131 1.4 34 32 44 41
40 - 44 8,476 8,274 202 2.4 73 44 73 46
45 - 49 8,141 7,834 307 3.8 147 55 96 51
50 - 54 6,930 6,595 335 4.8 167 74 101 60
55 - 59 6,012 5,633 379 6.3 228 61 114 53
60 - 64 5,005 4,495 510 10.2 304 110 186 100
65 - 69 3,943 3,395 548 13.9 336 127 198 96
70 - 74 2,659 2,093 566 21.3 343 182 217 146
75 - 79 1,993 1,448 545 27.3 327 209 269 167
80 - 84 1,206 774 432 35.8 264 191 241 143
85 - 89 473 274 199 42.1 123 88 124 81
90 + 205 99 106 51.7 70 55 78 56
Age groups
Total Population Type of disability
25
Table 11: (Continued)
Total Not disabled With any of 4 disabilities
Disability prevalence
rate (%)Seeing Hearing Walking Remembering
Males 55,106 52,964 2,142 3.9 962 510 934 684
0 - 4 5,181 5,057 124 2.4 5 3 79 100
5 - 9 5,732 5,678 54 0.9 6 14 18 37
10 - 14 6,144 6,072 72 1.2 9 10 22 56
15 - 19 4,070 4,032 38 0.9 3 6 13 29
20 - 24 3,528 3,474 54 1.5 7 14 19 28
25 - 29 3,899 3,846 53 1.4 10 6 26 23
30 - 34 3,900 3,846 54 1.4 11 9 24 14
35 - 39 3,843 3,784 59 1.5 13 10 26 21
40 - 44 3,741 3,656 85 2.3 30 11 37 20
45 - 49 3,574 3,437 137 3.8 62 12 52 26
50 - 54 2,946 2,793 153 5.2 62 40 56 29
55 - 59 2,522 2,357 165 6.5 100 26 59 19
60 - 64 2,084 1,850 234 11.2 134 48 95 46
65 - 69 1,574 1,355 219 13.9 134 41 90 39
70 - 74 995 782 213 21.4 129 66 82 51
75 - 79 767 556 211 27.5 118 88 109 70
80 - 84 402 271 131 32.6 80 64 69 38
85 - 89 142 83 59 41.5 35 27 37 23
90 + 62 35 27 43.5 14 15 21 15
Age groups
Total Population Type of disability
26
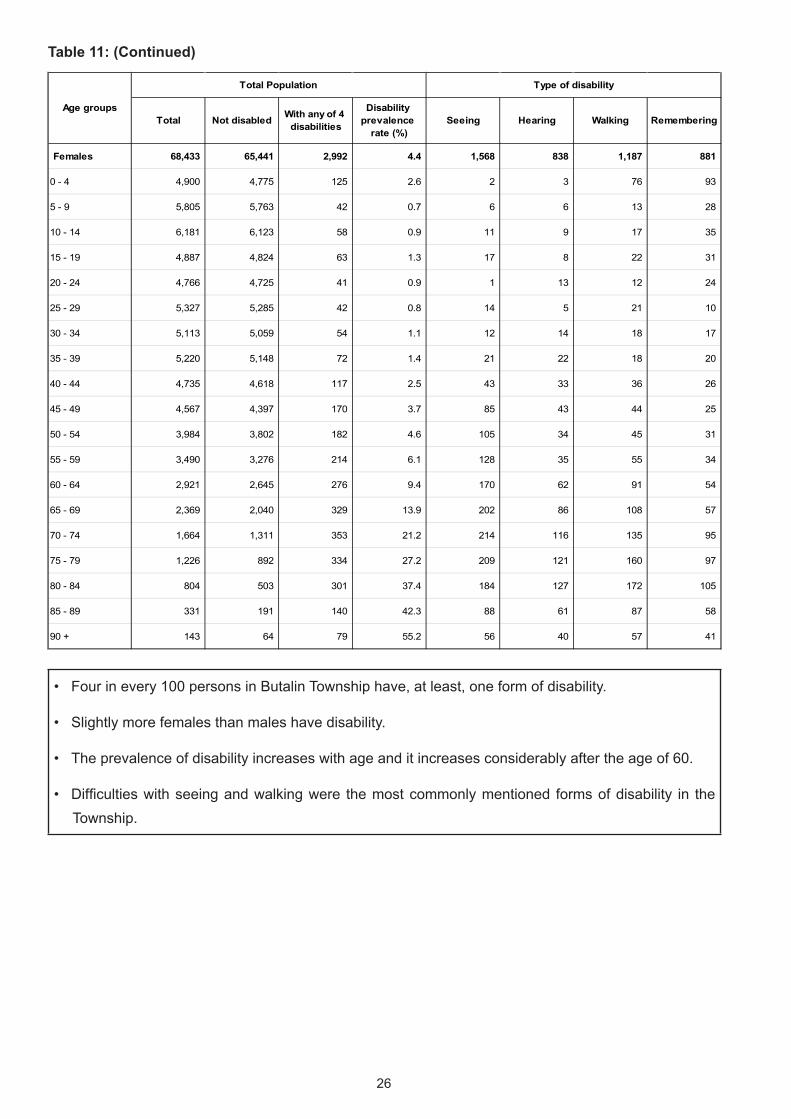
Table 11: (Continued)
• Four in every 100 persons in Butalin Township have, at least, one form of disability.
• Slightly more females than males have disability.
• The prevalence of disability increases with age and it increases considerably after the age of 60.
• Difficulties with seeing and walking were the most commonly mentioned forms of disability in the Township.
Total Not disabled With any of 4 disabilities
Disability prevalence
rate (%)Seeing Hearing Walking Remembering
Females 68,433 65,441 2,992 4.4 1,568 838 1,187 881
0 - 4 4,900 4,775 125 2.6 2 3 76 93
5 - 9 5,805 5,763 42 0.7 6 6 13 28
10 - 14 6,181 6,123 58 0.9 11 9 17 35
15 - 19 4,887 4,824 63 1.3 17 8 22 31
20 - 24 4,766 4,725 41 0.9 1 13 12 24
25 - 29 5,327 5,285 42 0.8 14 5 21 10
30 - 34 5,113 5,059 54 1.1 12 14 18 17
35 - 39 5,220 5,148 72 1.4 21 22 18 20
40 - 44 4,735 4,618 117 2.5 43 33 36 26
45 - 49 4,567 4,397 170 3.7 85 43 44 25
50 - 54 3,984 3,802 182 4.6 105 34 45 31
55 - 59 3,490 3,276 214 6.1 128 35 55 34
60 - 64 2,921 2,645 276 9.4 170 62 91 54
65 - 69 2,369 2,040 329 13.9 202 86 108 57
70 - 74 1,664 1,311 353 21.2 214 116 135 95
75 - 79 1,226 892 334 27.2 209 121 160 97
80 - 84 804 503 301 37.4 184 127 172 105
85 - 89 331 191 140 42.3 88 61 87 58
90 + 143 64 79 55.2 56 40 57 41
Age groups
Total Population Type of disability
27
(G) Housing Conditions and Household Amenities
Type of housing unit
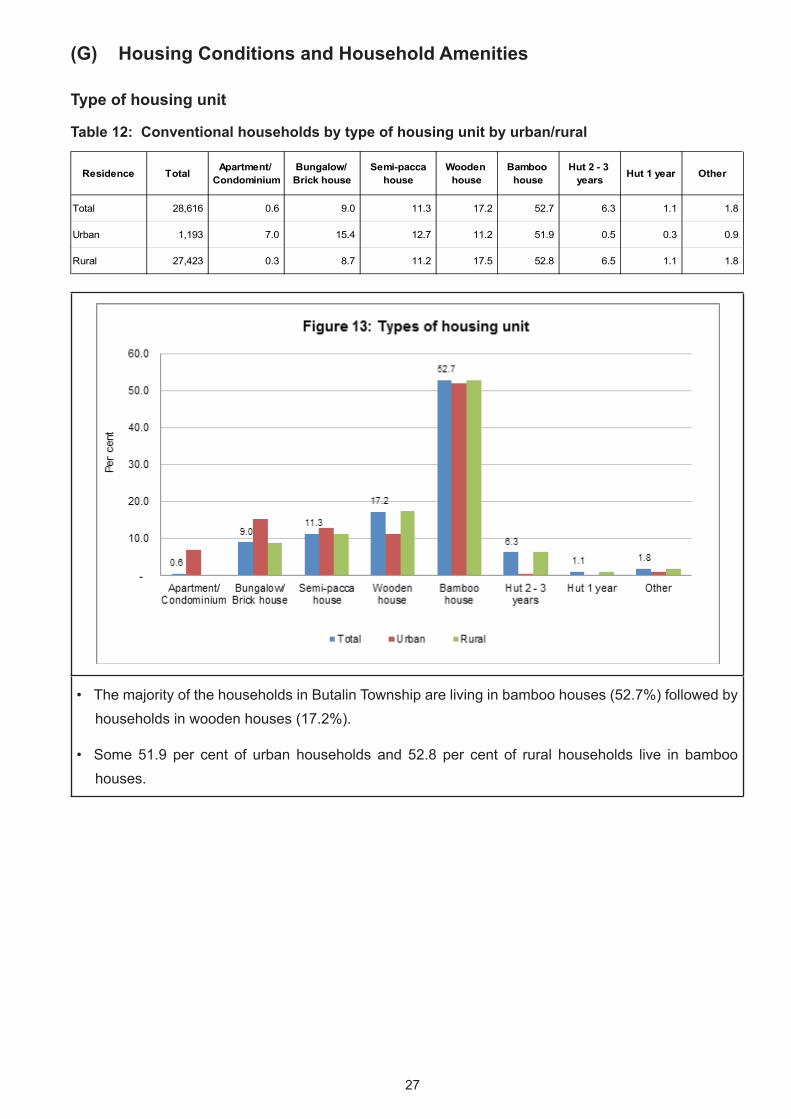
Table 12: Conventional households by type of housing unit by urban/rural
• The majority of the households in Butalin Township are living in bamboo houses (52.7%) followed by households in wooden houses (17.2%).
• Some 51.9 per cent of urban households and 52.8 per cent of rural households live in bamboo houses.
Residence Total Apartment/ Condominium
Bungalow/ Brick house
Semi-paccahouse
Wooden house
Bamboo house
Hut 2 - 3 years Hut 1 year Other
Total 28,616 0.6 9.0 11.3 17.2 52.7 6.3 1.1 1.8
Urban 1,193 7.0 15.4 12.7 11.2 51.9 0.5 0.3 0.9
Rural 27,423 0.3 8.7 11.2 17.5 52.8 6.5 1.1 1.8
28
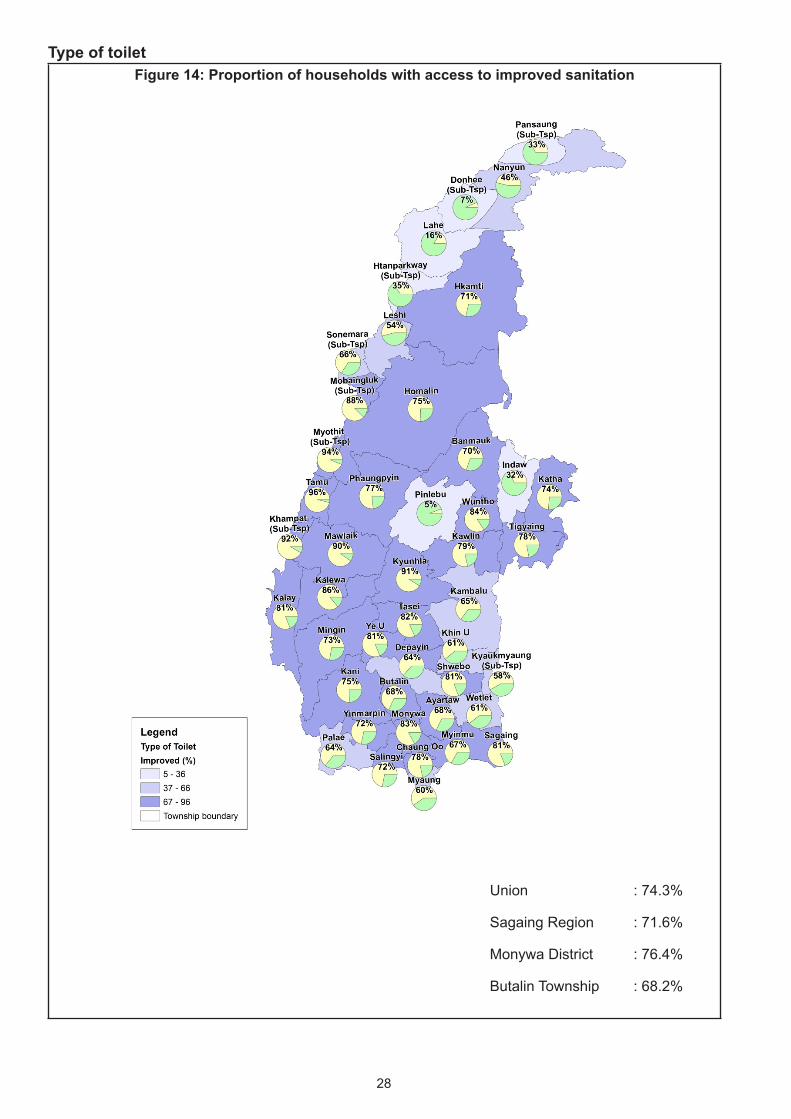
Type of toiletFigure 14: Proportion of households with access to improved sanitation
Union : 74.3%
Sagaing Region : 71.6%
Monywa District : 76.4%
Butalin Township : 68.2%
29
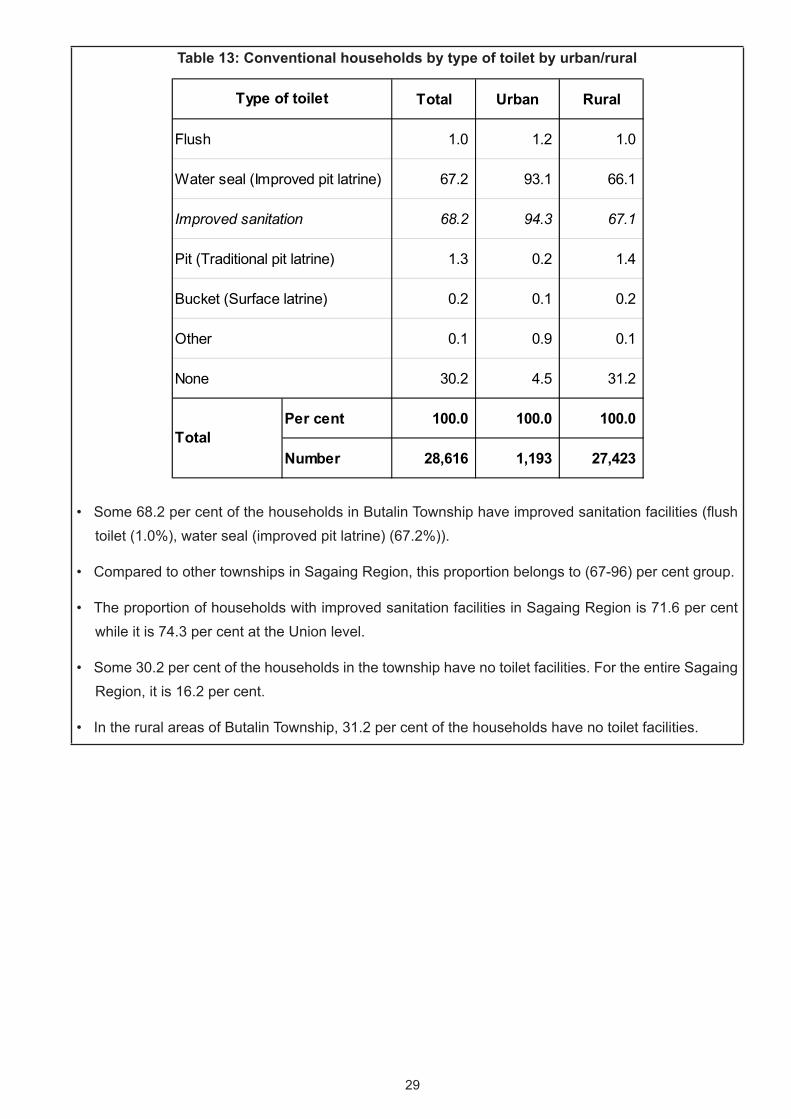
Table 13: Conventional households by type of toilet by urban/rural
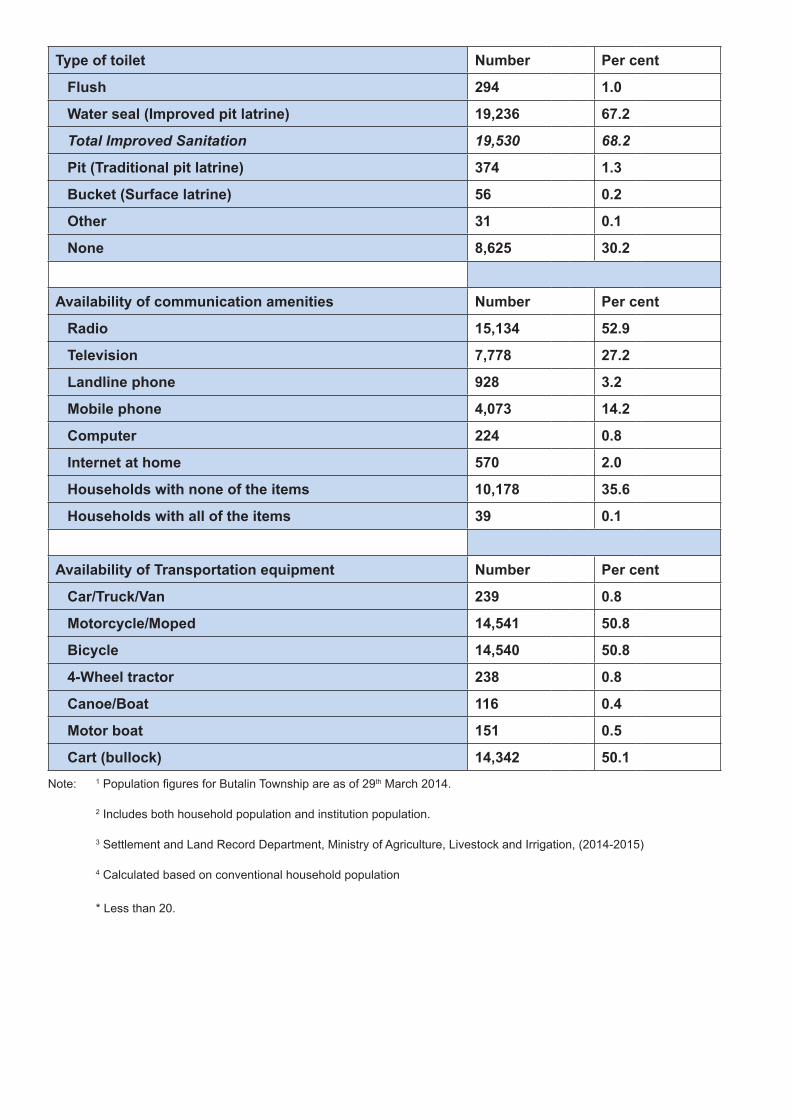
• Some 68.2 per cent of the households in Butalin Township have improved sanitation facilities (flush toilet (1.0%), water seal (improved pit latrine) (67.2%)).
• Compared to other townships in Sagaing Region, this proportion belongs to (67-96) per cent group.
• The proportion of households with improved sanitation facilities in Sagaing Region is 71.6 per cent while it is 74.3 per cent at the Union level.
• Some 30.2 per cent of the households in the township have no toilet facilities. For the entire Sagaing Region, it is 16.2 per cent.
• In the rural areas of Butalin Township, 31.2 per cent of the households have no toilet facilities.
Total Urban Rural
1.0 1.2 1.0
67.2 93.1 66.1
68.2 94.3 67.1
1.3 0.2 1.4
0.2 0.1 0.2
0.1 0.9 0.1
30.2 4.5 31.2
Per cent 100.0 100.0 100.0
Number 28,616 1,193 27,423
Type of toilet
Total
Flush
Water seal (Improved pit latrine)
Improved sanitation
Pit (Traditional pit latrine)
Bucket (Surface latrine)
Other
None
30
Source of drinking water
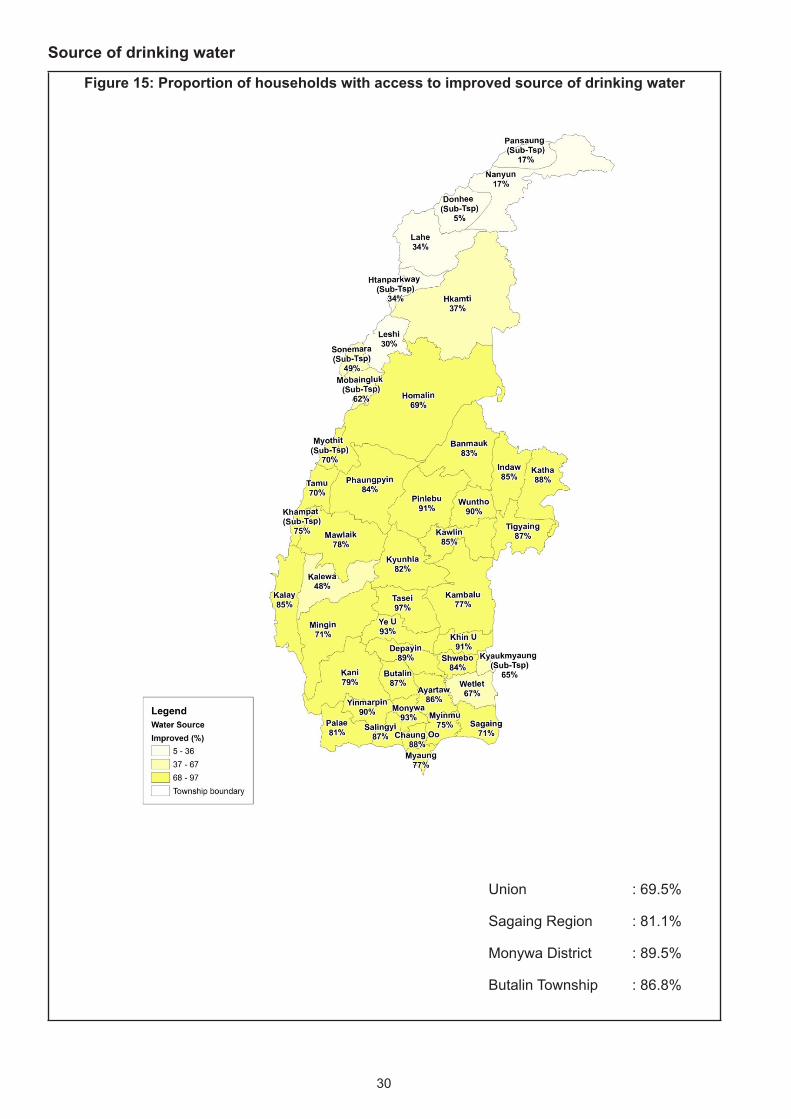
Figure 15: Proportion of households with access to improved source of drinking water
Union : 69.5%
Sagaing Region : 81.1%
Monywa District : 89.5%
Butalin Township : 86.8%
31
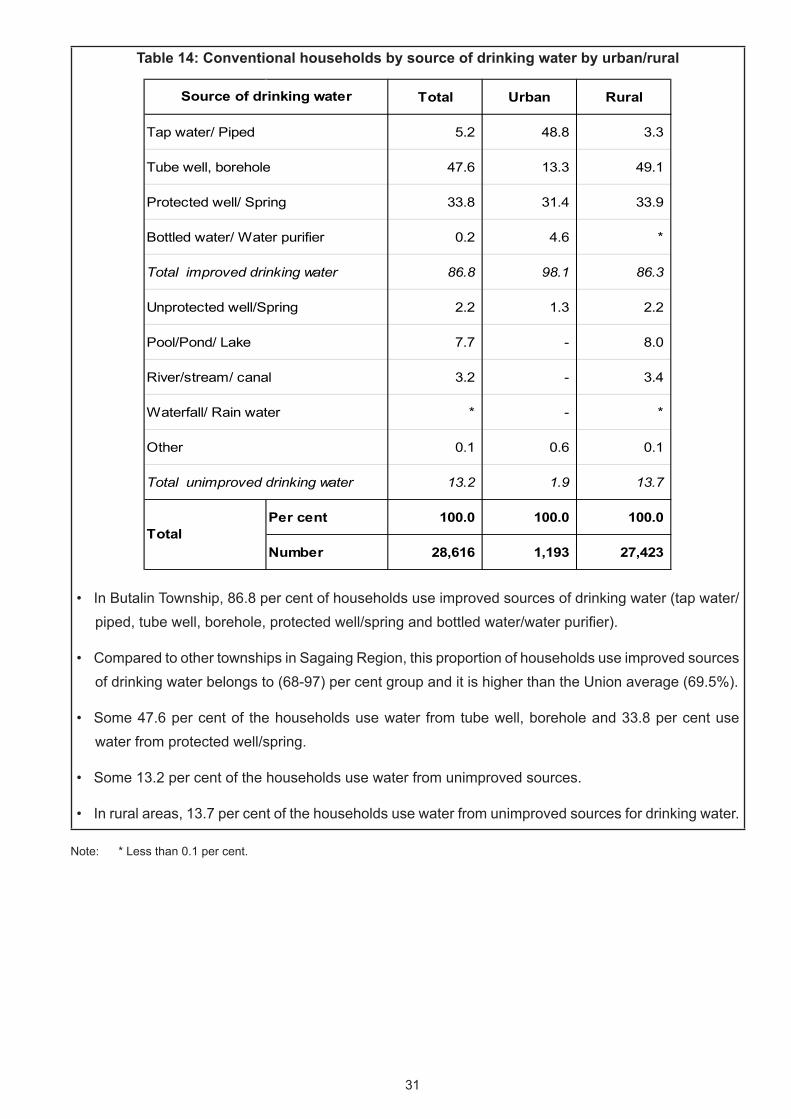
Table 14: Conventional households by source of drinking water by urban/rural
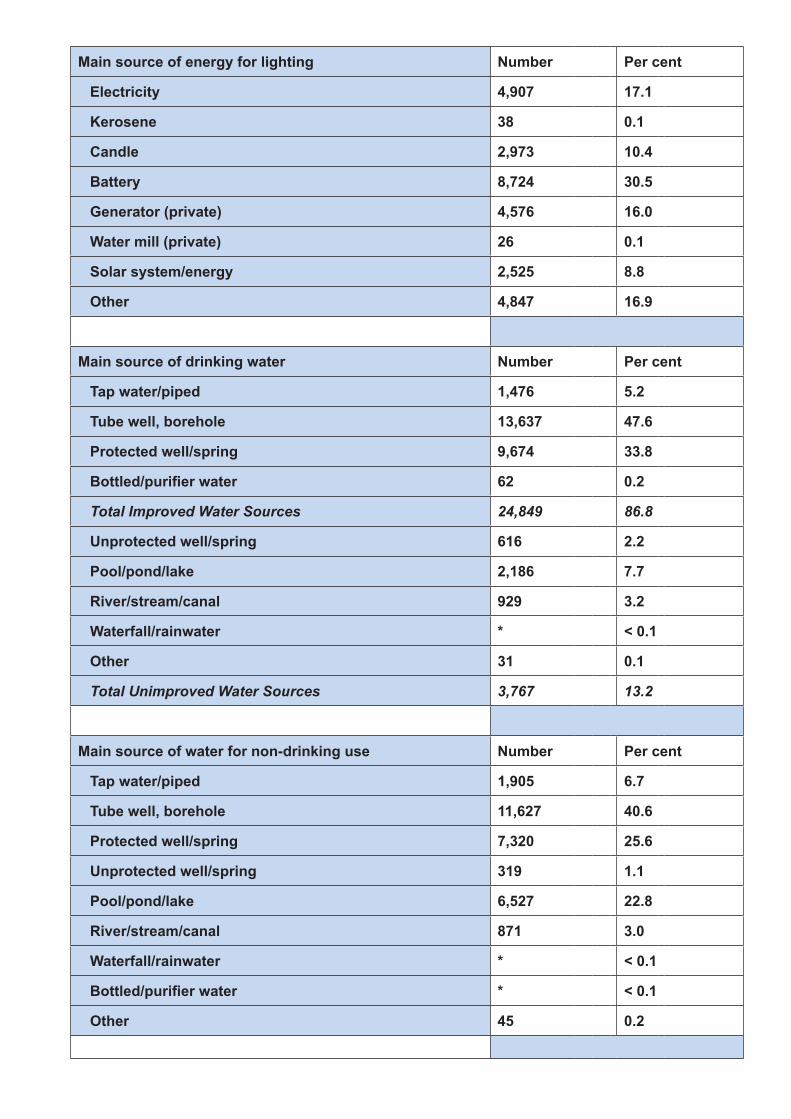
• In Butalin Township, 86.8 per cent of households use improved sources of drinking water (tap water/piped, tube well, borehole, protected well/spring and bottled water/water purifier).
• Compared to other townships in Sagaing Region, this proportion of households use improved sources of drinking water belongs to (68-97) per cent group and it is higher than the Union average (69.5%).
• Some 47.6 per cent of the households use water from tube well, borehole and 33.8 per cent use water from protected well/spring.
• Some 13.2 per cent of the households use water from unimproved sources.
• In rural areas, 13.7 per cent of the households use water from unimproved sources for drinking water.
Note: * Less than 0.1 per cent.
Total Urban Rural
5.2 48.8 3.3
47.6 13.3 49.1
33.8 31.4 33.9
0.2 4.6 *
86.8 98.1 86.3
2.2 1.3 2.2
7.7 - 8.0
3.2 - 3.4
* - *
0.1 0.6 0.1
13.2 1.9 13.7
Per cent 100.0 100.0 100.0
Number 28,616 1,193 27,423
Total improved drinking water
Source of drinking water
Tap water/ Piped
Tube well, borehole
Protected well/ Spring
Bottled water/ Water purifier
Total
Unprotected well/Spring
Pool/Pond/ Lake
River/stream/ canal
Waterfall/ Rain water
Other
Total unimproved drinking water
32
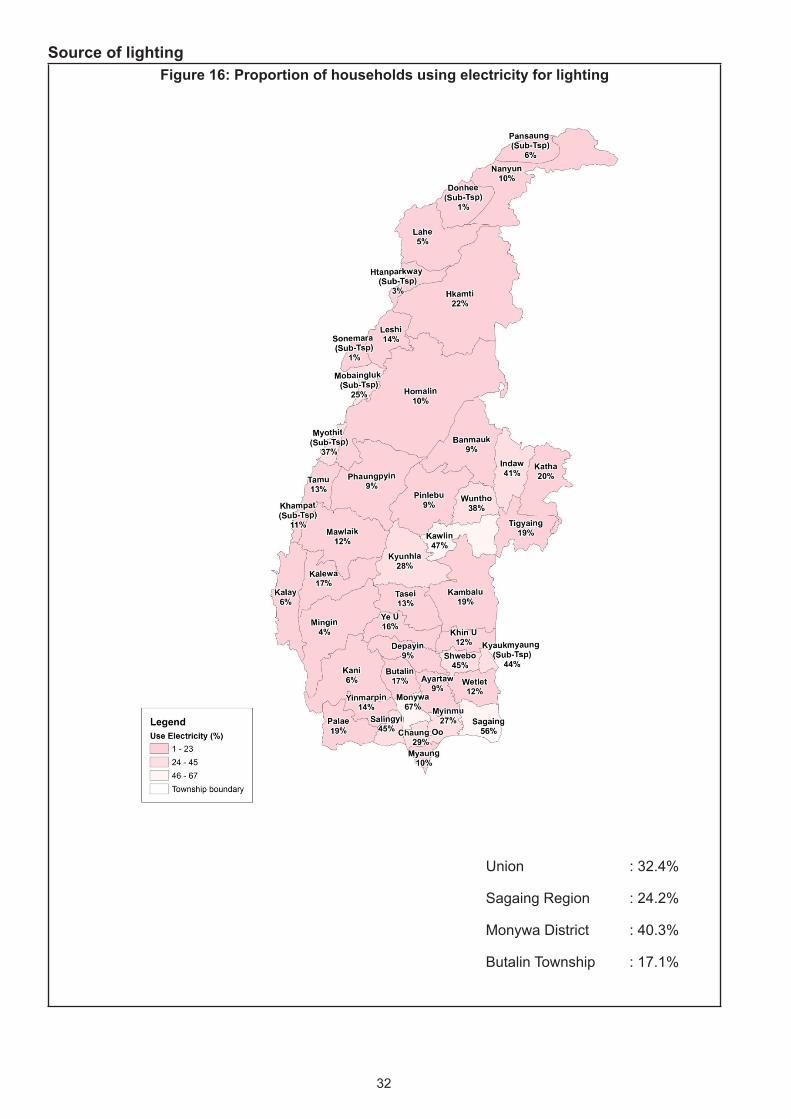
Source of lightingFigure 16: Proportion of households using electricity for lighting
Union : 32.4%
Sagaing Region : 24.2%
Monywa District : 40.3%
Butalin Township : 17.1%
33
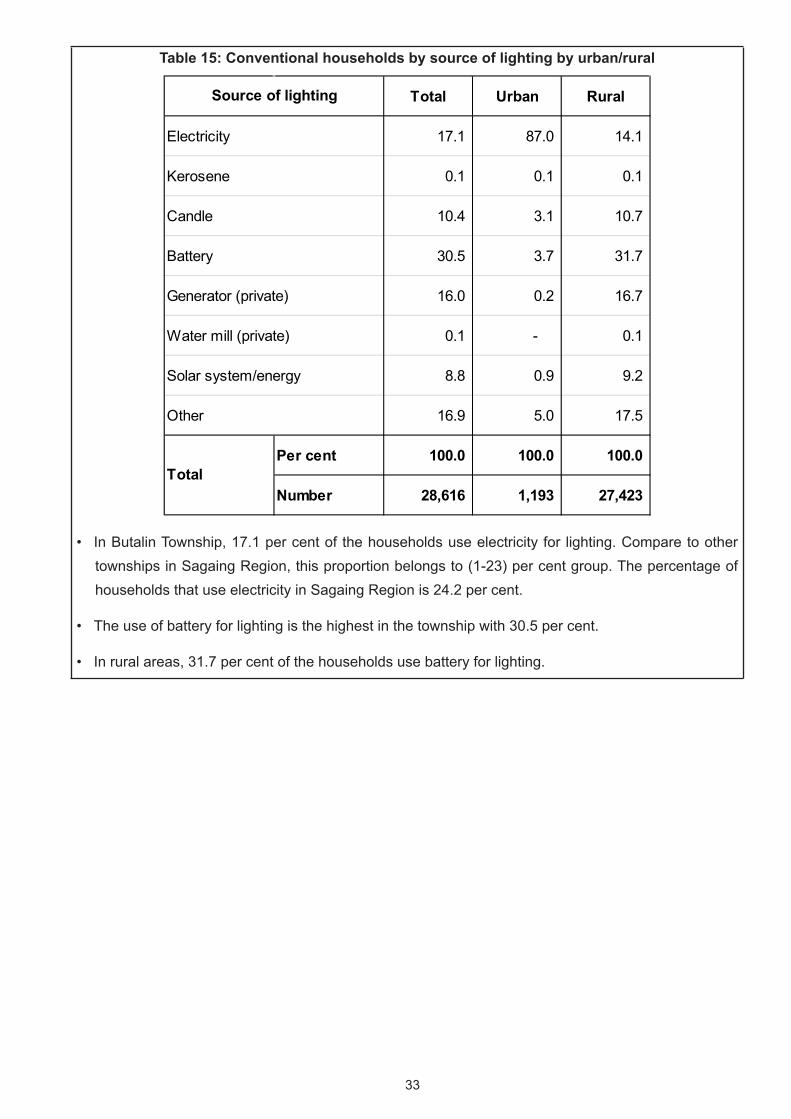
Table 15: Conventional households by source of lighting by urban/rural
• In Butalin Township, 17.1 per cent of the households use electricity for lighting. Compare to other townships in Sagaing Region, this proportion belongs to (1-23) per cent group. The percentage of households that use electricity in Sagaing Region is 24.2 per cent.
• The use of battery for lighting is the highest in the township with 30.5 per cent.
• In rural areas, 31.7 per cent of the households use battery for lighting.
Total Urban Rural
17.1 87.0 14.1
0.1 0.1 0.1
10.4 3.1 10.7
30.5 3.7 31.7
16.0 0.2 16.7
0.1 - 0.1
8.8 0.9 9.2
16.9 5.0 17.5
Per cent 100.0 100.0 100.0
Number 28,616 1,193 27,423
Generator (private)
Source of lighting
Electricity
Kerosene
Candle
Battery
Water mill (private)
Solar system/energy
Other
Total
34
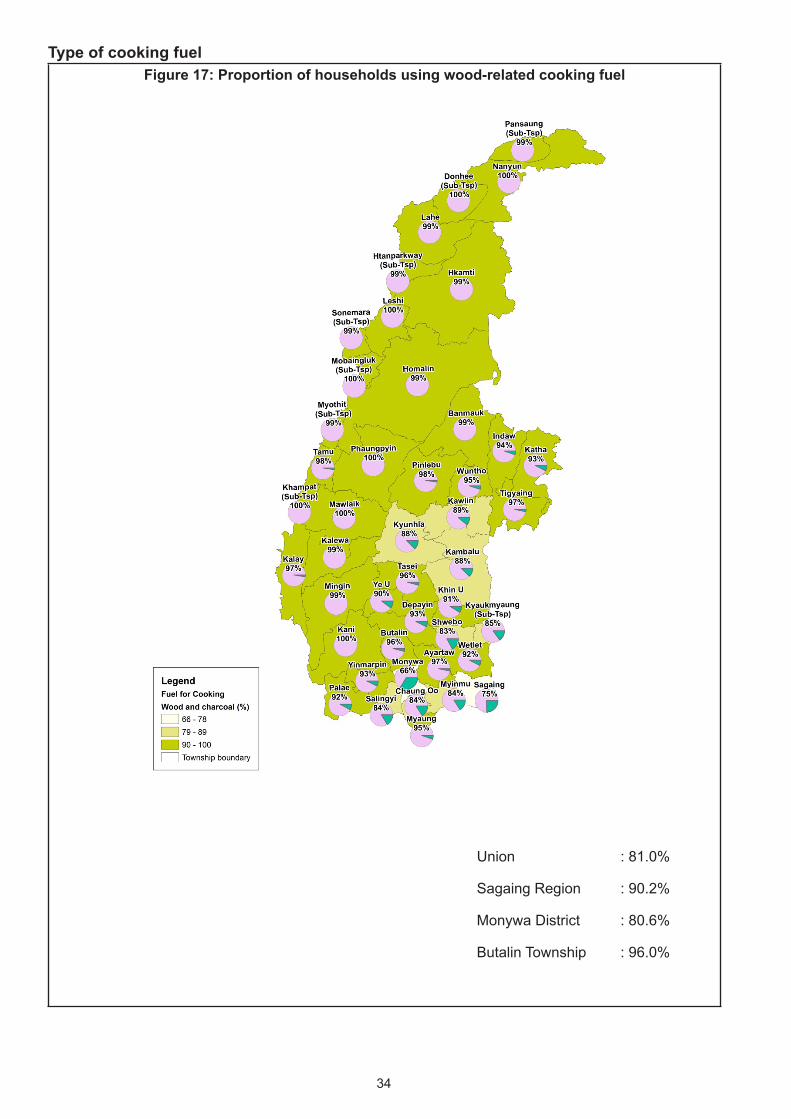
Type of cooking fuelFigure 17: Proportion of households using wood-related cooking fuel
Union : 81.0%
Sagaing Region : 90.2%
Monywa District : 80.6%
Butalin Township : 96.0%
35
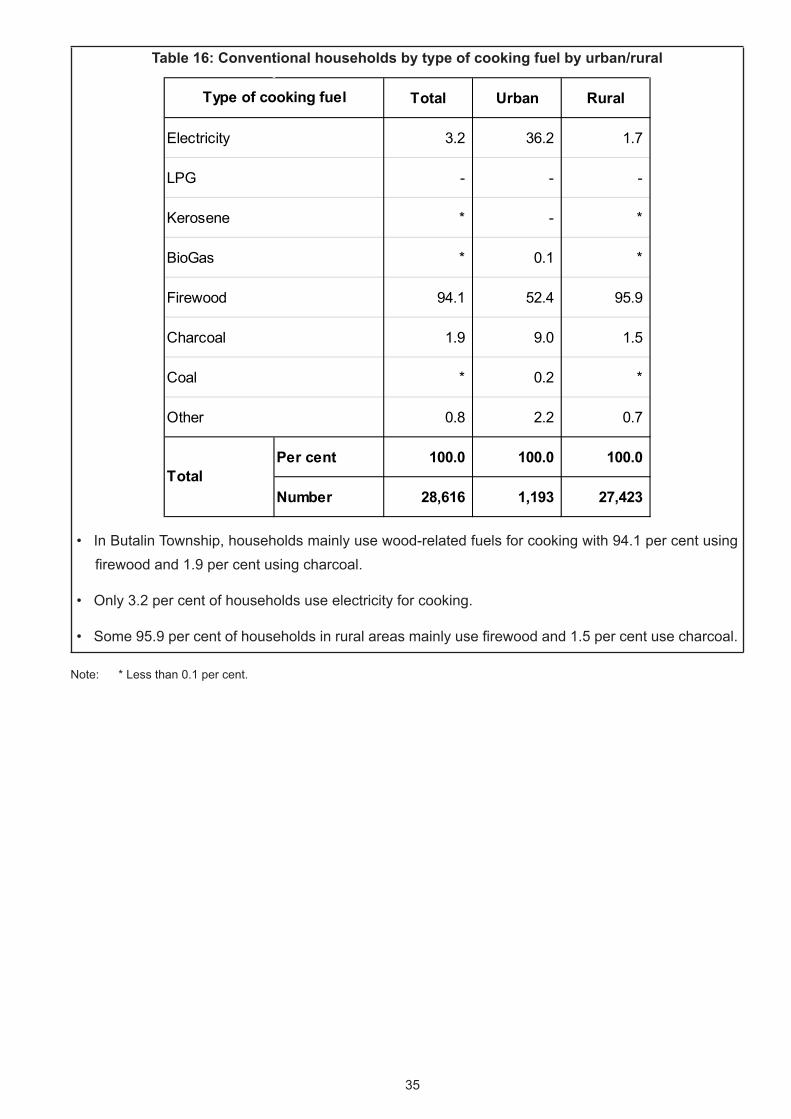
Table 16: Conventional households by type of cooking fuel by urban/rural
• In Butalin Township, households mainly use wood-related fuels for cooking with 94.1 per cent using firewood and 1.9 per cent using charcoal.
• Only 3.2 per cent of households use electricity for cooking.
• Some 95.9 per cent of households in rural areas mainly use firewood and 1.5 per cent use charcoal.
Note: * Less than 0.1 per cent.
Total Urban Rural
3.2 36.2 1.7
- - -
* - *
* 0.1 *
94.1 52.4 95.9
1.9 9.0 1.5
* 0.2 *
0.8 2.2 0.7
Per cent 100.0 100.0 100.0
Number 28,616 1,193 27,423
Charcoal
Coal
Other
Total
Type of cooking fuel
Electricity
LPG
Kerosene
BioGas
Firewood
36
Communication and related amenities
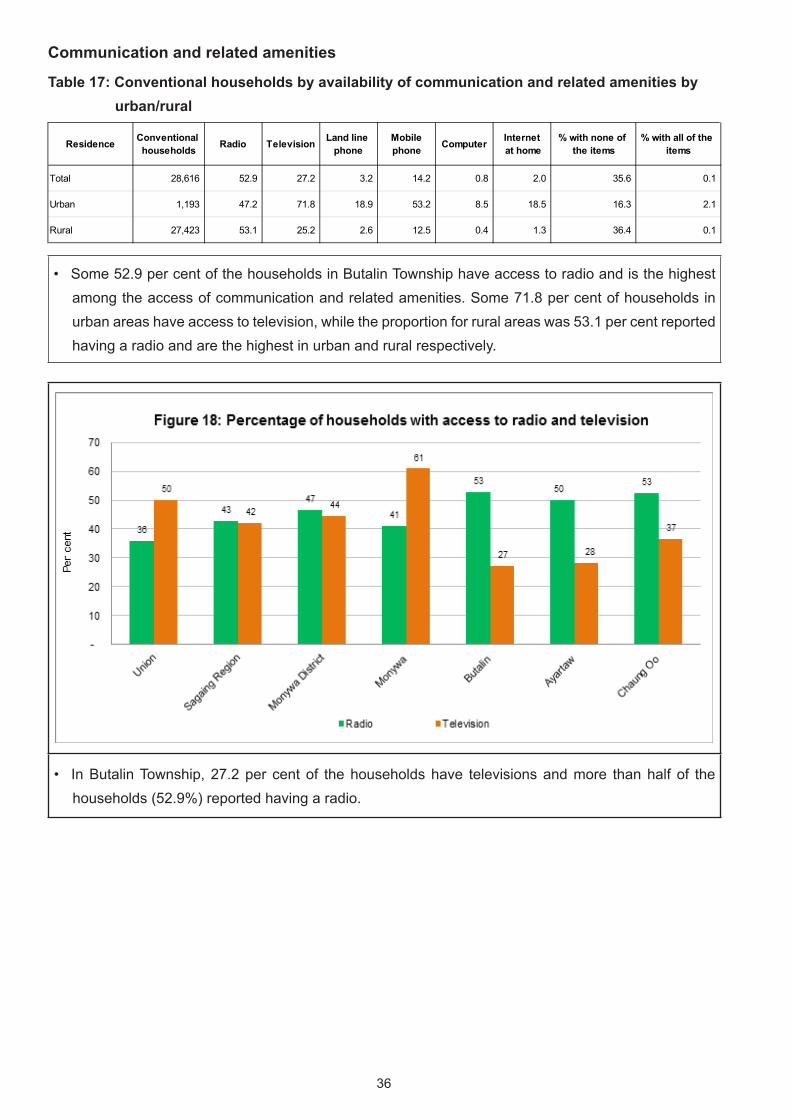
Table 17: Conventional households by availability of communication and related amenities by urban/rural
• Some 52.9 per cent of the households in Butalin Township have access to radio and is the highest among the access of communication and related amenities. Some 71.8 per cent of households in urban areas have access to television, while the proportion for rural areas was 53.1 per cent reported having a radio and are the highest in urban and rural respectively.
• In Butalin Township, 27.2 per cent of the households have televisions and more than half of the households (52.9%) reported having a radio.
Residence Conventional households Radio Television Land line
phoneMobilephone Computer Internet
at home% with none of
the items% with all of the
items
Total 28,616 52.9 27.2 3.2 14.2 0.8 2.0 35.6 0.1
Urban 1,193 47.2 71.8 18.9 53.2 8.5 18.5 16.3 2.1
Rural 27,423 53.1 25.2 2.6 12.5 0.4 1.3 36.4 0.1
37
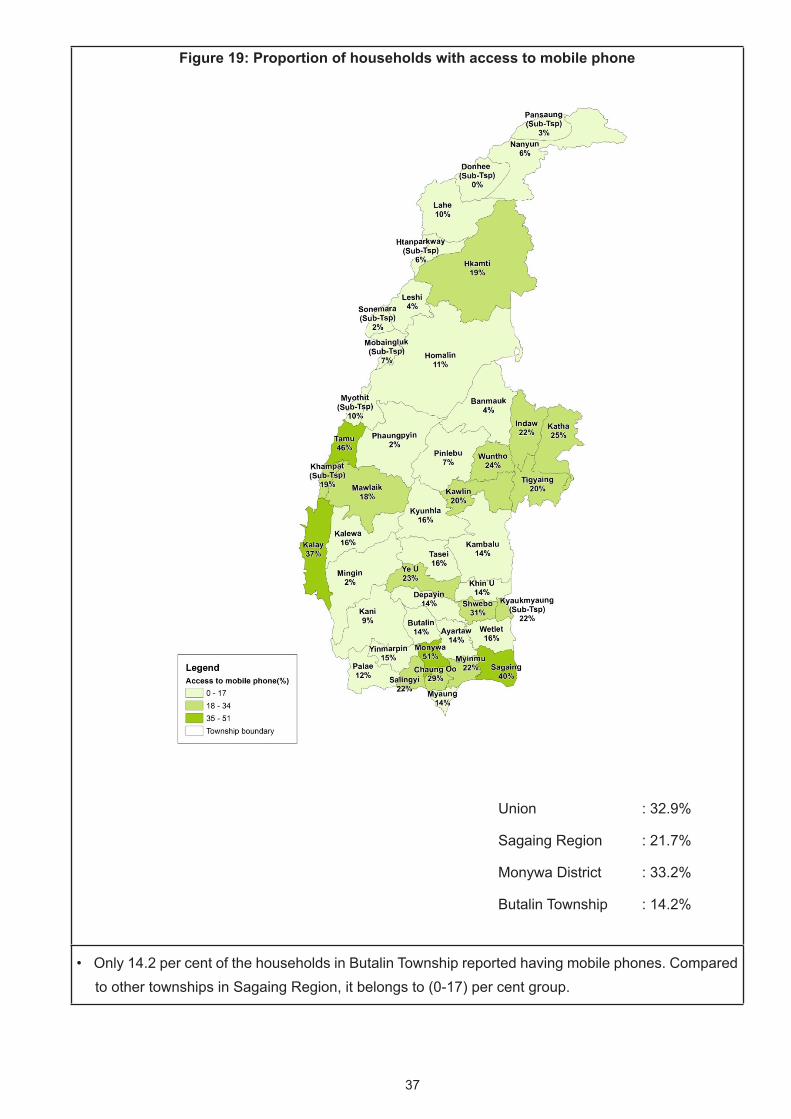
Figure 19: Proportion of households with access to mobile phone
• Only 14.2 per cent of the households in Butalin Township reported having mobile phones. Compared to other townships in Sagaing Region, it belongs to (0-17) per cent group.
Union : 32.9%
Sagaing Region : 21.7%
Monywa District : 33.2%
Butalin Township : 14.2%
38
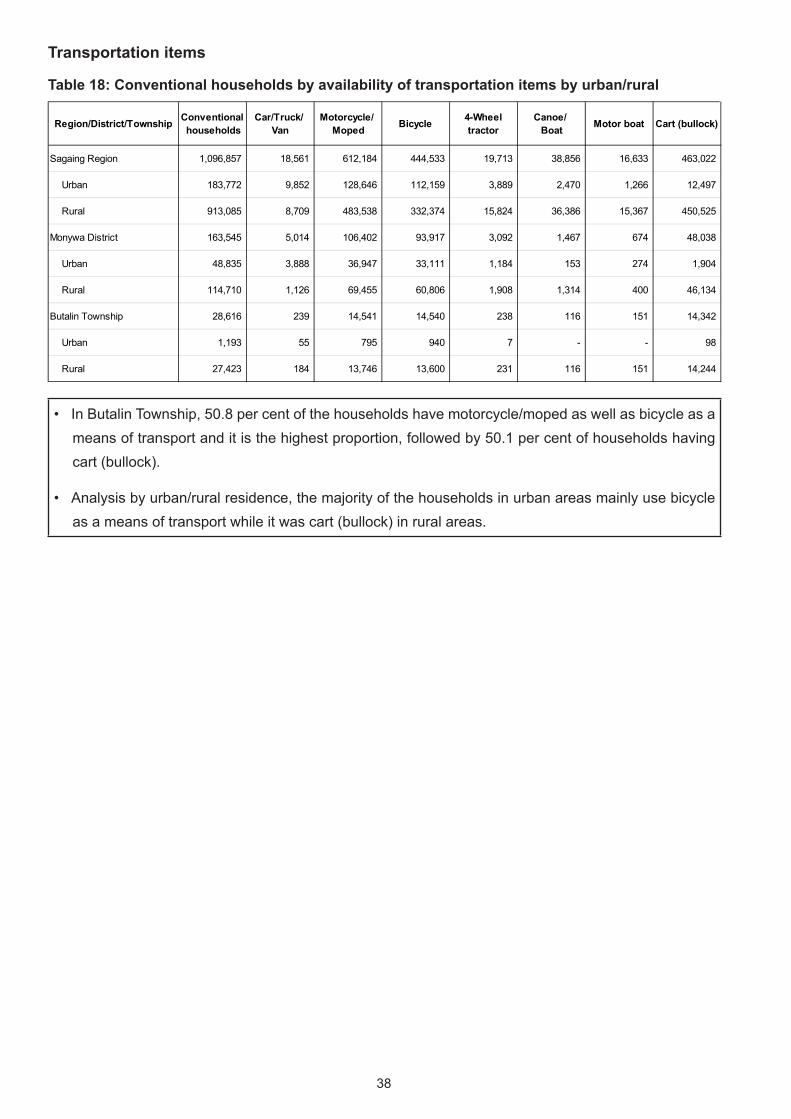
Transportation items
Table 18: Conventional households by availability of transportation items by urban/rural
• In Butalin Township, 50.8 per cent of the households have motorcycle/moped as well as bicycle as a means of transport and it is the highest proportion, followed by 50.1 per cent of households having cart (bullock).
• Analysis by urban/rural residence, the majority of the households in urban areas mainly use bicycle as a means of transport while it was cart (bullock) in rural areas.
Region/District/Township Conventional households
Car/Truck/ Van
Motorcycle/ Moped Bicycle 4-Wheel
tractorCanoe/
Boat Motor boat Cart (bullock)
Sagaing Region 1,096,857 18,561 612,184 444,533 19,713 38,856 16,633 463,022
Urban 183,772 9,852 128,646 112,159 3,889 2,470 1,266 12,497
Rural 913,085 8,709 483,538 332,374 15,824 36,386 15,367 450,525
Monywa District 163,545 5,014 106,402 93,917 3,092 1,467 674 48,038
Urban 48,835 3,888 36,947 33,111 1,184 153 274 1,904
Rural 114,710 1,126 69,455 60,806 1,908 1,314 400 46,134
Butalin Township 28,616 239 14,541 14,540 238 116 151 14,342
Urban 1,193 55 795 940 7 - - 98
Rural 27,423 184 13,746 13,600 231 116 151 14,244
39
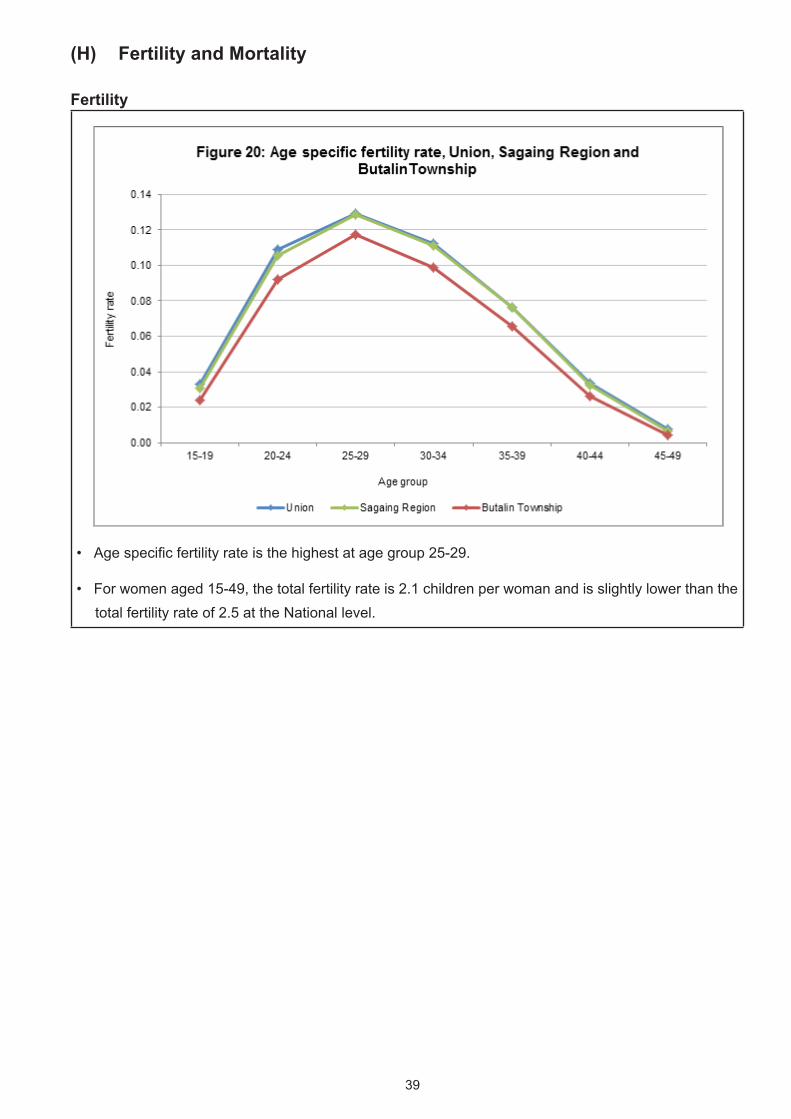
(H) Fertility and Mortality
Fertility
• Age specific fertility rate is the highest at age group 25-29.
• For women aged 15-49, the total fertility rate is 2.1 children per woman and is slightly lower than the total fertility rate of 2.5 at the National level.
40
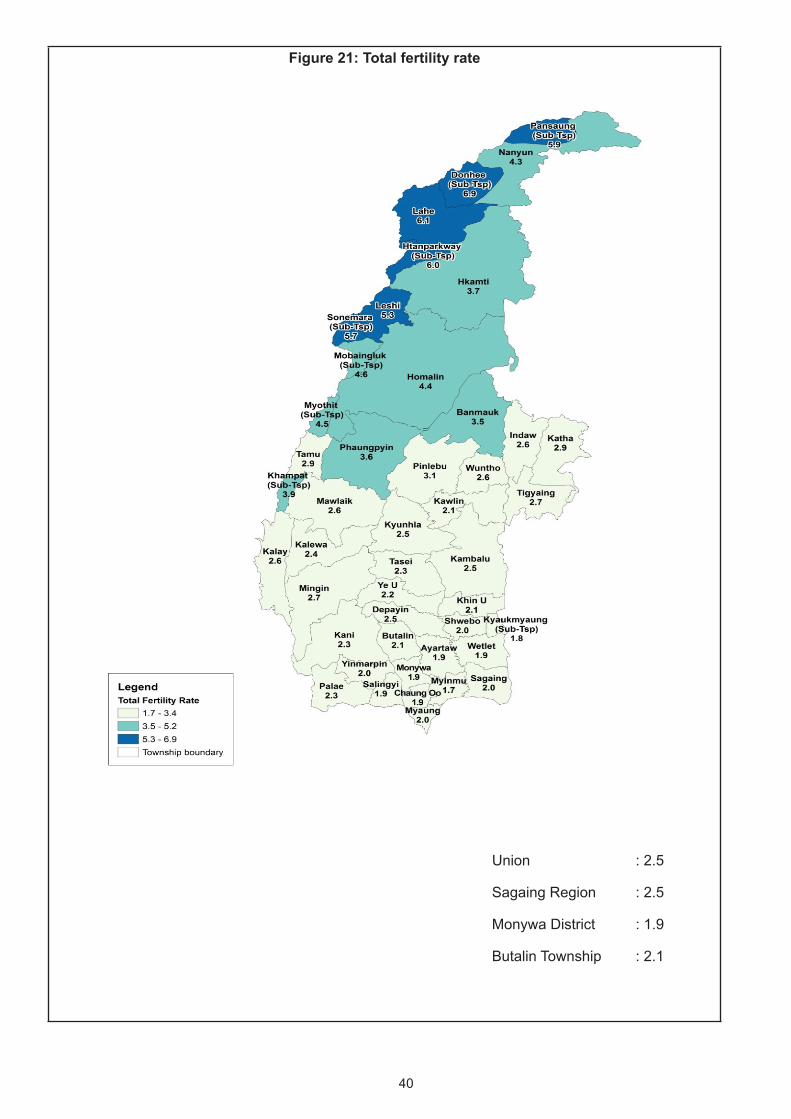
Figure 21: Total fertility rate
Union : 2.5
Sagaing Region : 2.5
Monywa District : 1.9
Butalin Township : 2.1
41
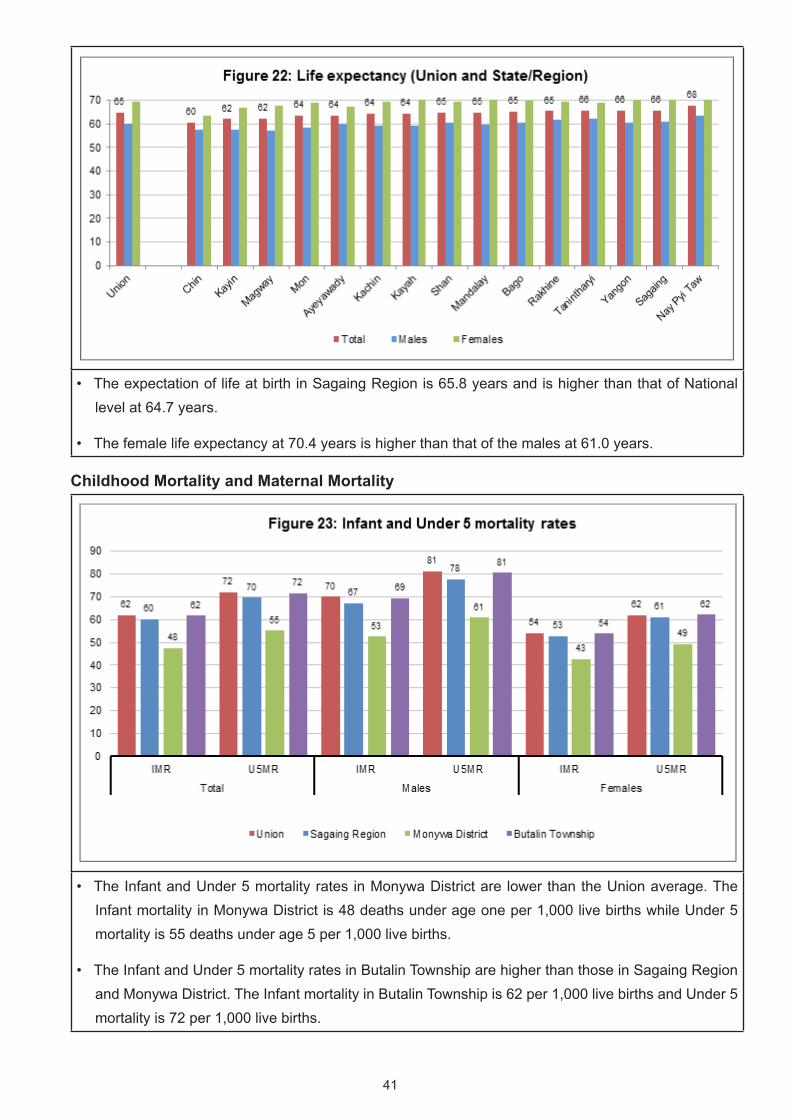
• The expectation of life at birth in Sagaing Region is 65.8 years and is higher than that of National level at 64.7 years.
• The female life expectancy at 70.4 years is higher than that of the males at 61.0 years.
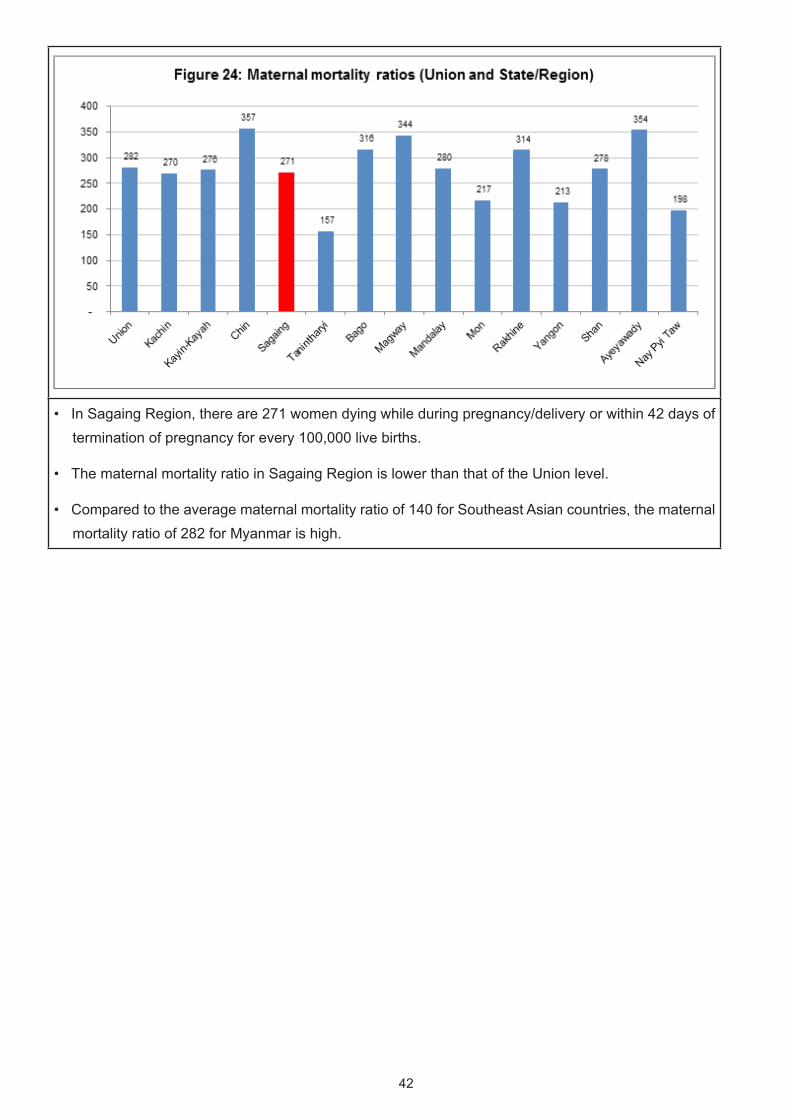
Childhood Mortality and Maternal Mortality
• The Infant and Under 5 mortality rates in Monywa District are lower than the Union average. The Infant mortality in Monywa District is 48 deaths under age one per 1,000 live births while Under 5 mortality is 55 deaths under age 5 per 1,000 live births.
• The Infant and Under 5 mortality rates in Butalin Township are higher than those in Sagaing Region and Monywa District. The Infant mortality in Butalin Township is 62 per 1,000 live births and Under 5 mortality is 72 per 1,000 live births.
42
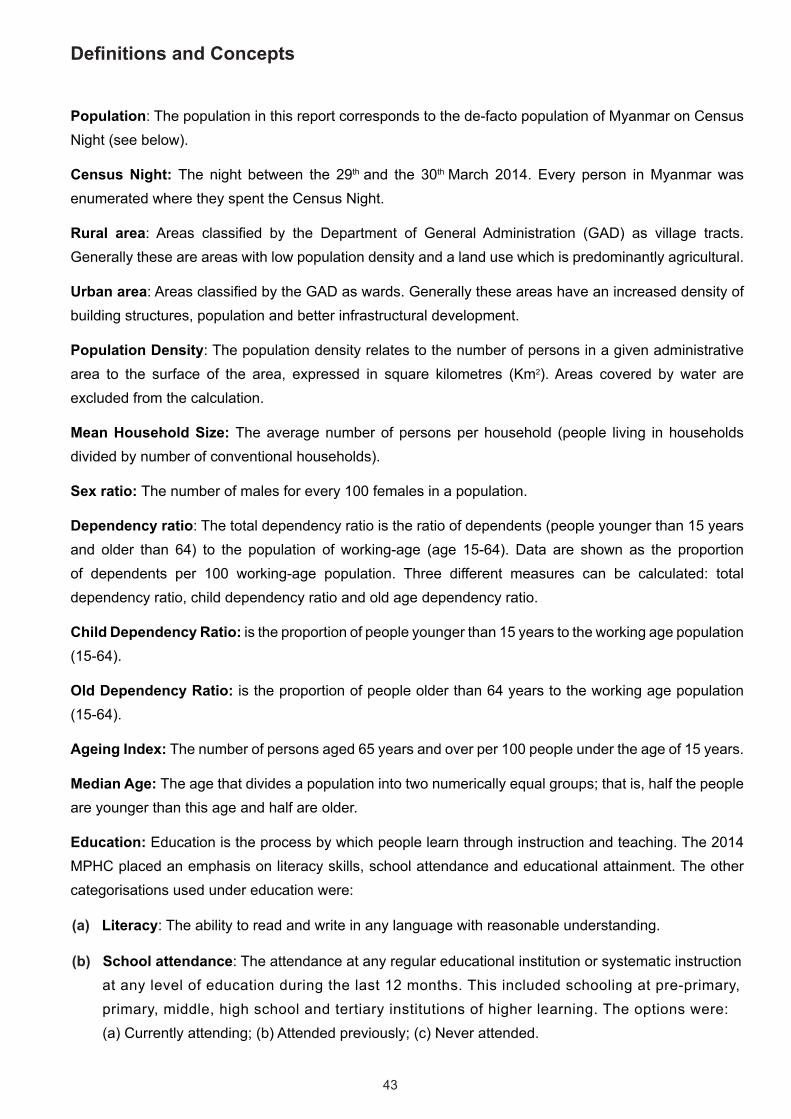
• In Sagaing Region, there are 271 women dying while during pregnancy/delivery or within 42 days of termination of pregnancy for every 100,000 live births.
• The maternal mortality ratio in Sagaing Region is lower than that of the Union level.
• Compared to the average maternal mortality ratio of 140 for Southeast Asian countries, the maternal mortality ratio of 282 for Myanmar is high.
43
Definitions and Concepts
Population: The population in this report corresponds to the de-facto population of Myanmar on Census Night (see below).
Census Night: The night between the 29th and the 30th March 2014. Every person in Myanmar was enumerated where they spent the Census Night.
Rural area: Areas classified by the Department of General Administration (GAD) as village tracts. Generally these are areas with low population density and a land use which is predominantly agricultural.
Urban area: Areas classified by the GAD as wards. Generally these areas have an increased density of building structures, population and better infrastructural development.
Population Density: The population density relates to the number of persons in a given administrative area to the surface of the area, expressed in square kilometres (Km2). Areas covered by water are excluded from the calculation.
Mean Household Size: The average number of persons per household (people living in households divided by number of conventional households).
Sex ratio: The number of males for every 100 females in a population.
Dependency ratio: The total dependency ratio is the ratio of dependents (people younger than 15 years and older than 64) to the population of working-age (age 15-64). Data are shown as the proportion of dependents per 100 working-age population. Three different measures can be calculated: total dependency ratio, child dependency ratio and old age dependency ratio.
Child Dependency Ratio: is the proportion of people younger than 15 years to the working age population (15-64).
Old Dependency Ratio: is the proportion of people older than 64 years to the working age population (15-64).
Ageing Index: The number of persons aged 65 years and over per 100 people under the age of 15 years.
Median Age: The age that divides a population into two numerically equal groups; that is, half the people are younger than this age and half are older.
Education: Education is the process by which people learn through instruction and teaching. The 2014 MPHC placed an emphasis on literacy skills, school attendance and educational attainment. The other categorisations used under education were:
(a) Literacy: The ability to read and write in any language with reasonable understanding.
(b) School attendance: The attendance at any regular educational institution or systematic instruction at any level of education during the last 12 months. This included schooling at pre-primary, primary, middle, high school and tertiary institutions of higher learning. The options were: (a) Currently attending; (b) Attended previously; (c) Never attended.
44
(c) Educational Attainment: The highest grade/standard/diploma/degree completed within the most advanced level attended in the education system of the country where the education was received. It covered both public and private institutions accredited by government.
Disability: Disability is a situation where a person is at a greater risk than the general population of experiencing restrictions in performing routine activities (including activities of daily living) or participating in roles (such as work) if no supportive measures are offered. The difficulties covered in the 2014 census included:
(a) Walking difficulty (wheel chairs, crutches, limping, problems climbing steps);
(b) Seeing difficulty (low vision, blind);
(c) Hearing difficulty (partially or completely deaf);
(d) Mental/Intellectual difficulty (slow learning development making it hard to compete with their counterparts at school, other mental conditions).
Identity card: An identity card is a document used to verify aspects of a person›s personal identity. There are several types of identity cards issued by the Government of Myanmar, and national passports in the case of foreigners.
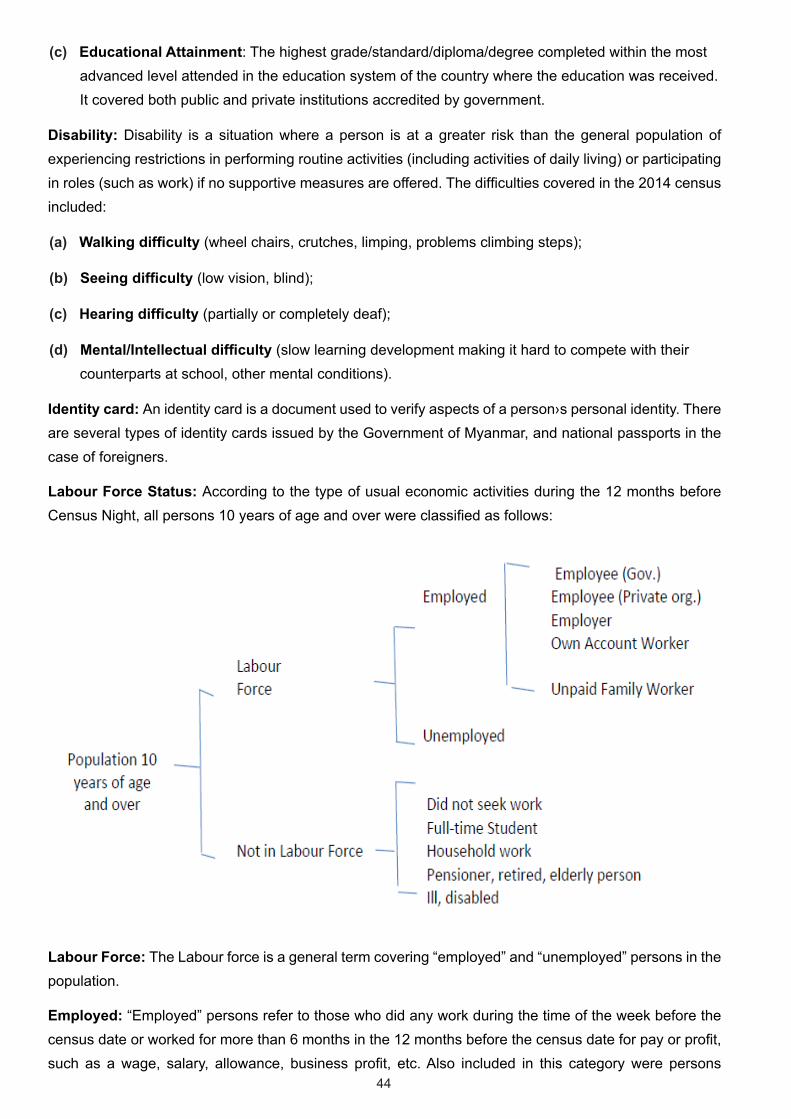
Labour Force Status: According to the type of usual economic activities during the 12 months before Census Night, all persons 10 years of age and over were classified as follows:
Labour Force: The Labour force is a general term covering “employed” and “unemployed” persons in the population.
Employed: “Employed” persons refer to those who did any work during the time of the week before the census date or worked for more than 6 months in the 12 months before the census date for pay or profit, such as a wage, salary, allowance, business profit, etc. Also included in this category were persons
45
working in family businesses, on a farm, in a store, in a private hospital etc., even though they were not paid any wages.
Unemployed: “Unemployed” persons refer to those who had no work but were able to work and actually seeking a job during the reference period, or at the time of the census enumeration.
Not in labour force: This category comprised persons who had no work and did not make any positive efforts to find a job during the 6 months before the census date or were unable to work. This included full time students, household work, elderly people, etc.
Employment Status: All employed persons were classified according to the economic activity status in the place where they worked during the last 12 months or if they worked in more than one place, where they worked most of the time. There were five employment categories:
(a) Employee (Government): those employed and working for government including in state organisation institutions.
(b) Employee (Private organisation): those employed and working for private employers or private organisations. All people in private companies, NGOs, international organisations, retail and wholesale enterprises fell under this category.
(c) Employer: persons who during the reference period worked in their own business, which also employed one or more other persons.
(d) Own account worker: self-employed persons who worked in their own business or worked in their own/family business for family gain and did not have any employees.
(e) Unpaid family worker: persons who worked in a business, farm, trade or professional enterprise operated by a member of the household/family and received no pay.
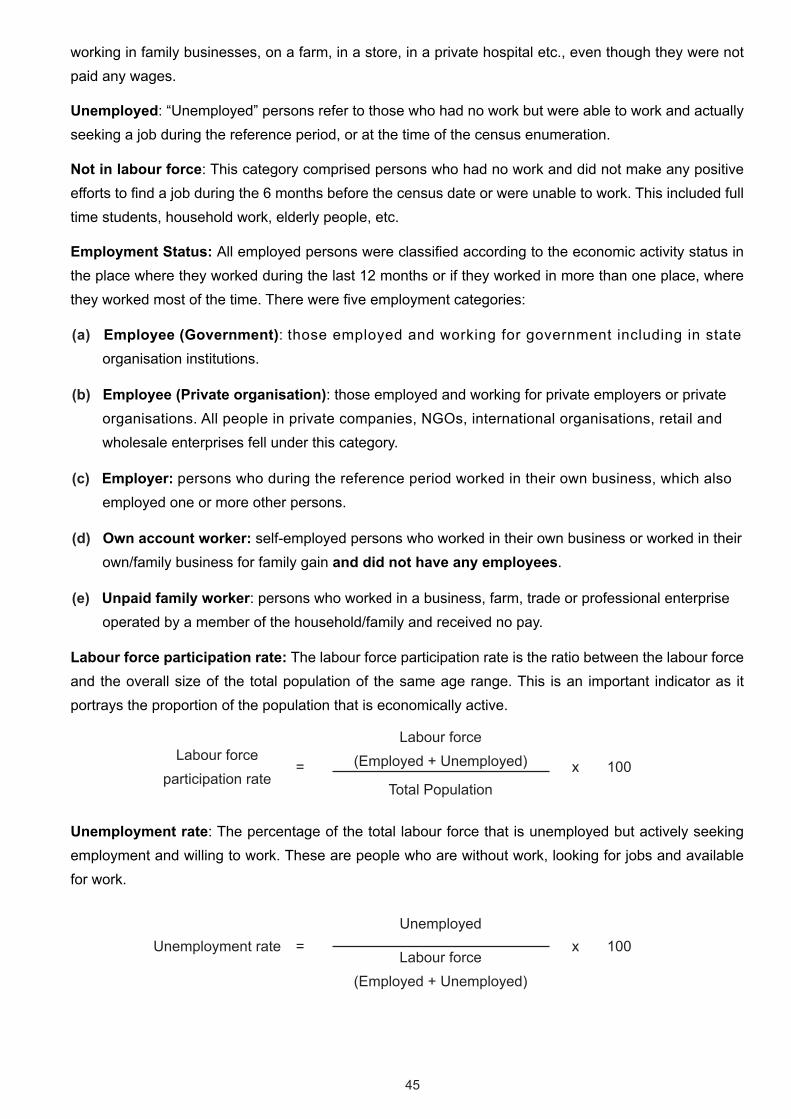
Labour force participation rate: The labour force participation rate is the ratio between the labour force and the overall size of the total population of the same age range. This is an important indicator as it portrays the proportion of the population that is economically active.
Labour force participation rate
=
Labour force (Employed + Unemployed) x 100
Total Population
Unemployment rate: The percentage of the total labour force that is unemployed but actively seeking employment and willing to work. These are people who are without work, looking for jobs and available for work.
Unemployment rate =Unemployed
x 100Labour force
(Employed + Unemployed)
46
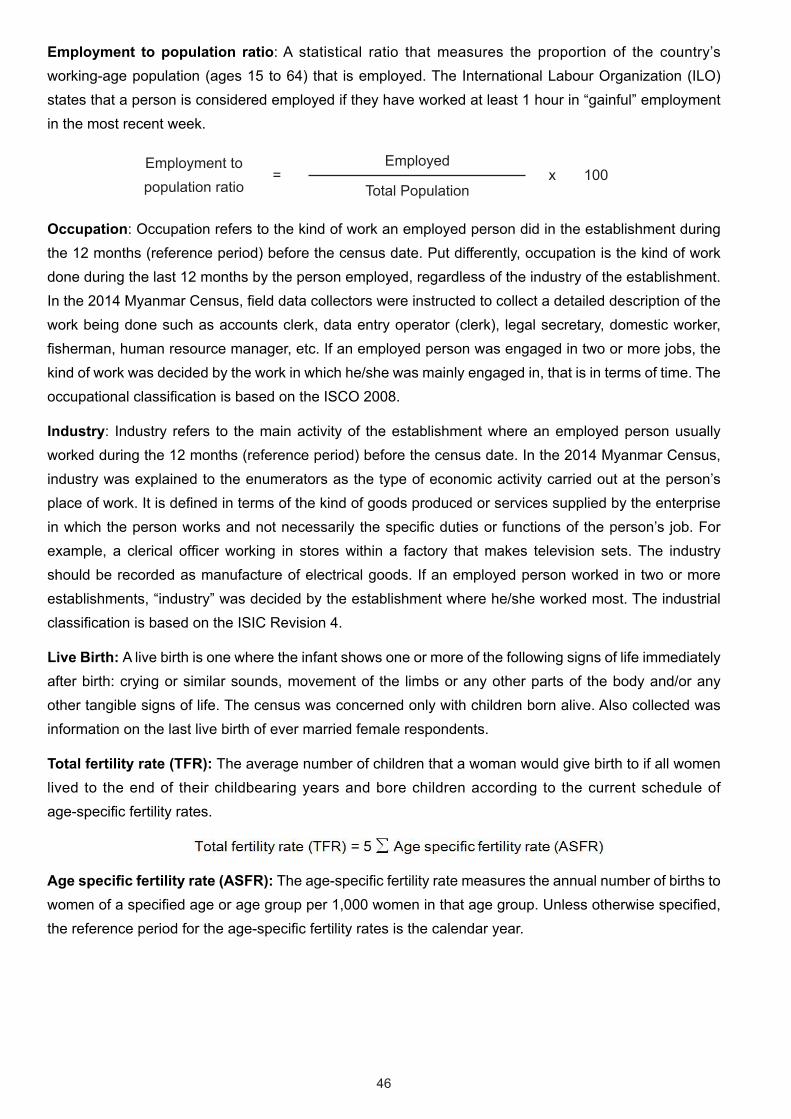
Employment to population ratio: A statistical ratio that measures the proportion of the country’s working-age population (ages 15 to 64) that is employed. The International Labour Organization (ILO) states that a person is considered employed if they have worked at least 1 hour in “gainful” employment in the most recent week.
Employment to population ratio
=Employed
x 100Total Population
Occupation: Occupation refers to the kind of work an employed person did in the establishment during the 12 months (reference period) before the census date. Put differently, occupation is the kind of work done during the last 12 months by the person employed, regardless of the industry of the establishment. In the 2014 Myanmar Census, field data collectors were instructed to collect a detailed description of the work being done such as accounts clerk, data entry operator (clerk), legal secretary, domestic worker, fisherman, human resource manager, etc. If an employed person was engaged in two or more jobs, the kind of work was decided by the work in which he/she was mainly engaged in, that is in terms of time. The occupational classification is based on the ISCO 2008.
Industry: Industry refers to the main activity of the establishment where an employed person usually worked during the 12 months (reference period) before the census date. In the 2014 Myanmar Census, industry was explained to the enumerators as the type of economic activity carried out at the person’s place of work. It is defined in terms of the kind of goods produced or services supplied by the enterprise in which the person works and not necessarily the specific duties or functions of the person’s job. For example, a clerical officer working in stores within a factory that makes television sets. The industry should be recorded as manufacture of electrical goods. If an employed person worked in two or more establishments, “industry” was decided by the establishment where he/she worked most. The industrial classification is based on the ISIC Revision 4.
Live Birth: A live birth is one where the infant shows one or more of the following signs of life immediately after birth: crying or similar sounds, movement of the limbs or any other parts of the body and/or any other tangible signs of life. The census was concerned only with children born alive. Also collected was information on the last live birth of ever married female respondents.
Total fertility rate (TFR): The average number of children that a woman would give birth to if all women lived to the end of their childbearing years and bore children according to the current schedule of age-specific fertility rates.
Age specific fertility rate (ASFR): The age-specific fertility rate measures the annual number of births to women of a specified age or age group per 1,000 women in that age group. Unless otherwise specified, the reference period for the age-specific fertility rates is the calendar year.
47
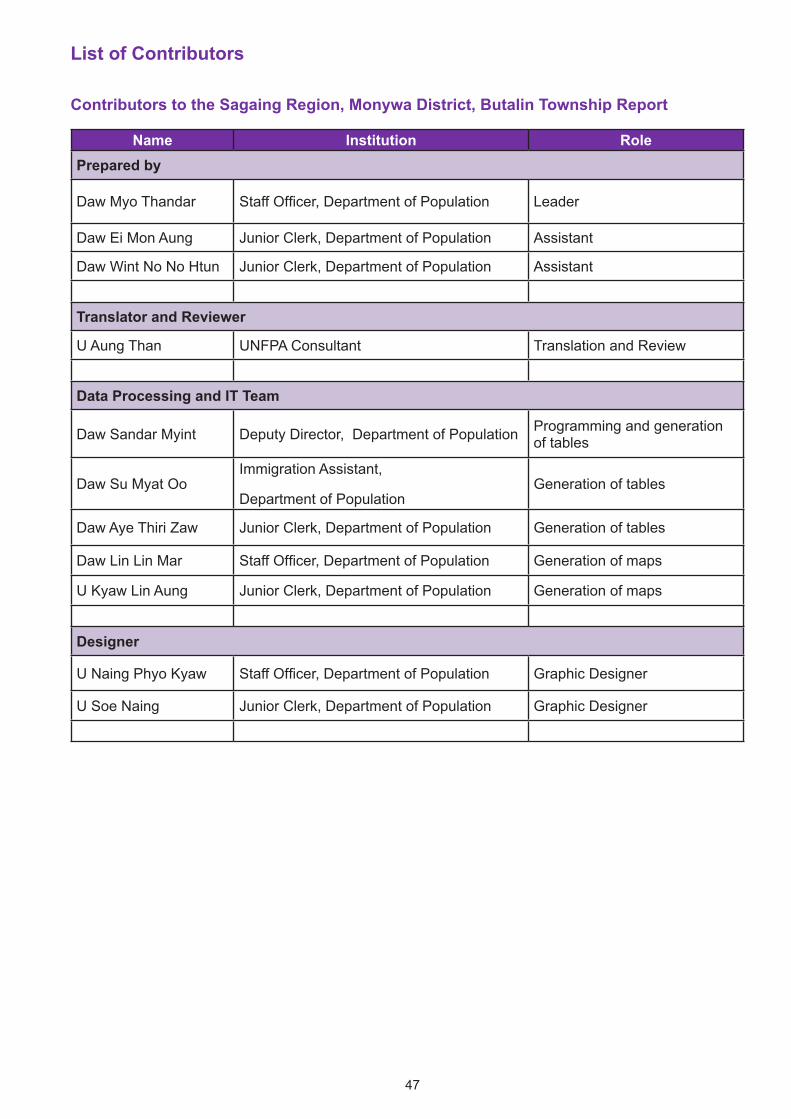
List of Contributors
Contributors to the Sagaing Region, Monywa District, Butalin Township Report
Name Institution RolePrepared by
Daw Myo Thandar Staff Officer, Department of Population Leader
Daw Ei Mon Aung Junior Clerk, Department of Population Assistant
Daw Wint No No Htun Junior Clerk, Department of Population Assistant
Translator and Reviewer
U Aung Than UNFPA Consultant Translation and Review
Data Processing and IT Team
Daw Sandar Myint Deputy Director, Department of Population Programming and generation of tables
Daw Su Myat OoImmigration Assistant,
Department of PopulationGeneration of tables
Daw Aye Thiri Zaw Junior Clerk, Department of Population Generation of tables
Daw Lin Lin Mar Staff Officer, Department of Population Generation of maps
U Kyaw Lin Aung Junior Clerk, Department of Population Generation of maps
Designer
U Naing Phyo Kyaw Staff Officer, Department of Population Graphic Designer
U Soe Naing Junior Clerk, Department of Population Graphic Designer

49
The Townships Reports
can be downloaded at :www.dop.gov.mm
or
http://myanmar.unfpa.org/census