SAFEWAY INC. 2004 ANNUAL REPORT -...
60
Safeway Inc. 2004 Annual Report Life is changing.
Transcript of SAFEWAY INC. 2004 ANNUAL REPORT -...

Safeway Inc.2004 Annual Report
L i fe is changing.
SA
FEWA
Y IN
C. 2004 A
NN
UA
L REP
OR
T

P e r c e n t a g e o f S t o r e s w i t h S p e c i a l t y D e p a r t m e n t s
2004
Bakery 94%Deli 96Floral 93Pharmacy 74
M a n u f a c t u r i n g a n d P r o c e s s i n g F a c i l i t i e s
Year-end 2004
U.S. Canada
Milk Plants 6 3Bread Baking Plants 5 2Ice Cream Plants 2 2Cheese and Meat Packaging Plants – 2Soft Drink Bottling Plants 4 –Fruit and Vegetable Processing Plants 1 3Other Food Processing Plants 2 –Pet Food Plant 1 –
21 12
C o n t e n t s
2 Letter to Stockholders
5 Editorial Material
14 Financial Contents
56 Directors and Principal Officers
57 Investor Information
Safeway Inc. is one of the largest food and drug retailers in North America. As of January 1, 2005, the company operated 1,802 stores in the Western, Southwestern, Rocky Mountain, Midwestern andMid-Atlantic regions of the United States and in western Canada. In support of its stores, Safeway has an extensive network of distribution, manufacturing and food processing facilities.

S A F E WAY I N C . 2 0 0 4 A N N U A L R E P O R T 1
52 Weeks 53 Weeks 52 Weeks(Dollars in millions, except per-share amounts) 2004 2003 2002
F o r t h e Ye a r :
Sales and other revenue $35,822.9 $35,727.2 $34,917.2
Gross profit 10,595.3 10,724.2 10,996.4
Operating profit 1,172.8 573.9 947.6
Net income (loss) 560.2 (169.8) (828.1)
Diluted earnings (loss) per share: 1.25 (0.38) (1.77)
Cash capital expenditures 1,212.5 935.8 1,467.4
A t Ye a r E n d :
Common shares outstanding (in millions) (Note 1) 447.7 444.2 441.0
Retail square feet (in millions) 82.1 82.6 81.5
Number of stores 1,802 1,817 1,808
Note 1: Net of 130.8 million, 131.2 million and 132.0 million shares held in treasury in 2004, 2003 and 2002, respectively.
F i n a n c i a l H i g h l i g h t s

2 S A F E WAY I N C . 2 0 0 4 A N N U A L R E P O R T
To O u r S t o c k h o l d e r s
While 2004 was another difficult year for our industry, we made solid progress on several frontsand laid a strong foundation to support future growth. Among our most notable achievements,we generated exceptionally strong cash flow from operations, which allowed us to significantlyreduce total debt; we dramatically improved the quality, selection and presentation of ourperishable offerings; and we began the rollout of our highly successful Lifestyle stores throughan aggressive remodeling program. We also made substantial progress restructuring laborcontracts, which we believe will enable us to compete more effectively going forward.
R e s u l t s F r o m O p e r a t i o n sNet income was $560.2 million ($1.25 per diluted share) in 2004 compared to a loss of $169.8million ($0.38 per diluted share) in 2003.
As indicated in the table at the bottom of page 4, results for 2004 include total estimatedcharges of approximately $308.1 million, after tax ($0.68 per diluted share), related to thefollowing items:
• Estimated impact of the Southern California strike;• Dominick’s store closures;• Contributions to a UFCW multi-employer health and welfare plan in Northern California; and• A lease expense adjustment in accordance with recent SEC guidance on “rent holidays.”
Excluding these items, 2004 earnings would have been $1.93 per diluted share.1
For 2003, the same table outlines a total of almost $1.1 billion in after-tax charges ($2.43 per diluted share), related to the following items:
• Estimated impact of the Southern California strike;• Dominick’s impairment charges;• Randall’s impairment charges;• Miscellaneous investments write-off;• Inventory accounting change; and• Restructuring and other expenses.
Excluding these items, net income in 2003 would have been $2.05 per diluted share.1
S a l e sTotal sales rose only slightly to $35.8 billion in 2004 from $35.7 billion in 2003, primarily because of the strike and the extra week of operation in fiscal 2003, which was a 53-week year.Excluding strike-affected stores, comparable-store sales increased 1.5%, while identical-storesales (which do not include replacement stores) rose 0.9%. Further excluding fuel, comparable-store sales declined 0.2%, while identical-store sales were down 0.8%.
With the lingering effects of the strike gradually abating, total sales have improved in thefirst quarter of 2005. We are encouraged by this positive trend and expect it to continue as theyear progresses.
G r o s s P r o f i tGross profit in 2004 declined 44 basis points to 29.58% of sales. The reduction was due primarilyto increased fuel sales (which have a lower gross margin) and the estimated impact of the strike.
O p e r a t i n g a n d A d m i n i s t r a t i v e E x p e n s eOperating and administrative expense last year decreased 7 basis points to 26.30% of sales.The slight improvement was due to lower impairment charges and higher fuel sales, partlyoffset by the impact of the strike and higher wages, benefits and occupancy expenses.

S A F E WAY I N C . 2 0 0 4 A N N U A L R E P O R T 3
We continued to make substantial progress renegotiating labor contracts under favorableterms. As of this writing, we have restructured collective bargaining agreements in all but twoof our retail divisions, where contracts have expired and we are currently negotiating newones. The modified agreements have begun to arrest the rapid increase in employee health carepremiums and, over time, are expected to reduce the gap in our total labor costs versus thoseof our non-union competitors.
I n t e r e s t E x p e n s eInterest expense declined $31.2 million to $411.2 million in 2004, primarily because strong cashflow from operations enabled us to reduce debt by $1.1 billion to $6.7 billion.
C a p i t a l S p e n d i n gCash capital expenditures increased to $1.2 billion in 2004. During the year we opened 33 newstores, all designed to our new Lifestyle format featured later in this report. We also expandedor remodeled 115 existing stores – 94 of which were refurbished to Lifestyle standards – andwe closed 48 older stores.
In 2005, we plan to invest approximately $1.4 billion in cash capital expenditures and open30 to 35 new Lifestyle stores while completing some 275 to 285 Lifestyle remodels. By the endof this year, we plan to operate approximately 450 Lifestyle stores, more than three times thecurrent total.
We also opened 41 fuel centers adjacent to our stores. As of year-end 2004, 311 of ourstores sold gasoline, boosting sales at these locations while enhancing one-stop shoppingconvenience for our customers.
C a s h F l o wNet cash flow from operating activities in 2004 rose $617 million to $2.2 billion, while net cashflow from investing activities, which consists principally of cash paid for property additions,increased $275 million to approximately $1.1 billion. Net cash flow used by financing activities– mainly cash used to retire debt – was also up significantly, to approximately $1.1 billion in2004 from $724 million the prior year. As noted above, total debt declined to $6.7 billion atyear-end 2004 from $7.8 billion at year-end 2003.
C o m m u n i t y I n v o l v e m e n tEach year we make cash and in-kind donations to hundreds of non-profit organizationsthroughout the communities we serve. Many of these contributions are channeled through The Safeway Foundation, which is sustained by fundraising events and an annual employee-giving campaign.
During 2004 in our U.S. retail operations alone, we donated more than $100 million worth of merchandise to Second Harvest food banks and other hunger-relief organizations. We also contributed more than $20 million to local schools through eScrip and othereducational programs. In addition, we conducted major fundraising campaigns to supportawareness, research and treatment programs for breast and prostate cancer as well as muscular dystrophy.
Although we generally limit our charitable giving to worthy causes within our operatingareas, we made an exception for victims of the devastating tsunami in South Asia and Eastern Africa, raising more than $3.5 million to support relief efforts on their behalf earlier in 2005.
O u t l o o kThis is an exciting time to be at Safeway, as we fundamentally reinvent our business and theway we go to market. We continue to make excellent progress in establishing and communi-cating clear, compelling points of difference between our offerings and those of our competitors. At the same time, through an innovative new advertising campaign, we will be connecting with consumers – current customers and potential new ones – in ways that we believe willposition Safeway as a uniquely responsive, more complete store. As noted on the followingpages, life is changing, and so are we.
In closing, once again I’d like to acknowledge our employees for their tireless efforts. As we strive to establish a sustained competitive advantage in a challenging businessenvironment, I’m reminded that “a company is only as good as its employees allow it to be.”We’re fortunate to have some of the best trained, most knowledgeable workers in thesupermarket industry. We think they’re the friendliest, most helpful employees in the businessas well, a sentiment echoed by many of our customers. We have a winning team whose players thrive on challenges and take pride in outperforming the competition while enhancingcustomer satisfaction.
Based on our recent, positive sales trends, we are encouraged that our strategy is workingand are convinced that Safeway is headed in the right direction for future growth. We aredetermined to deliver shareholder value.
Steven A. BurdChairman, President and Chief Executive OfficerMarch 15, 2005
Amount Per DilutedShare
Net income, as reported $560.2 $1.25Dominick’s store closures 28.5 0.06Estimated strike impact 254.0 0.57Health and welfare contribution 19.1 0.04Accrual for rent holidays 6.5 0.01
Adjusted income $868.3 $1.93
2004
Amount Per DilutedShare
Net loss, as reported $(169.8) $(0.38)Estimated strike impact 102.9 0.23Dominick’s impairment charges:
Goodwill 275.9 0.62Assets 190.9 0.43
Randall’s impairment charges 447.7 1.00Miscellaneous investments
write-off 6.5 0.01Inventory loss accrual 43.5 0.10Restructuring and other expenses 15.6 0.04
Adjusted income $ 913.2 $ 2.05
1 R e c o n c i l i a t i o n o f G A A P N e t I n c o m e( L o s s ) t o A d j u s t e d I n c o m e ( U n a u d i t e d )
(Dollars in millions, except per-share amounts)
2003
4 S A F E WAY I N C . 2 0 0 4 A N N U A L R E P O R T

L i f e i s c h a n g i n g . S o a r e w e .
S A F E WAY I N C . 2 0 0 4 A N N U A L R E P O R T 5

T o d a y ’s c o n s u m e r s e x p e c t Consumers today are busier and more diverse than ever before. They’re also more selective and have an unprecedented range of options when choosing where they shop for food. Increasing time constraints and shifting demographic trends – such as greater ethnicity, changing household composition and growing affluence – have accelerated the profusion of new retail formats, each trying to satisfy today’s consumers’ varied needs and desires.

S A F E W A Y I N C . 2 0 0 4 A N N U A L R E P O R T 7 8 S A F E W A Y I N C . 2 0 0 4 A N N U A L R E P O R T
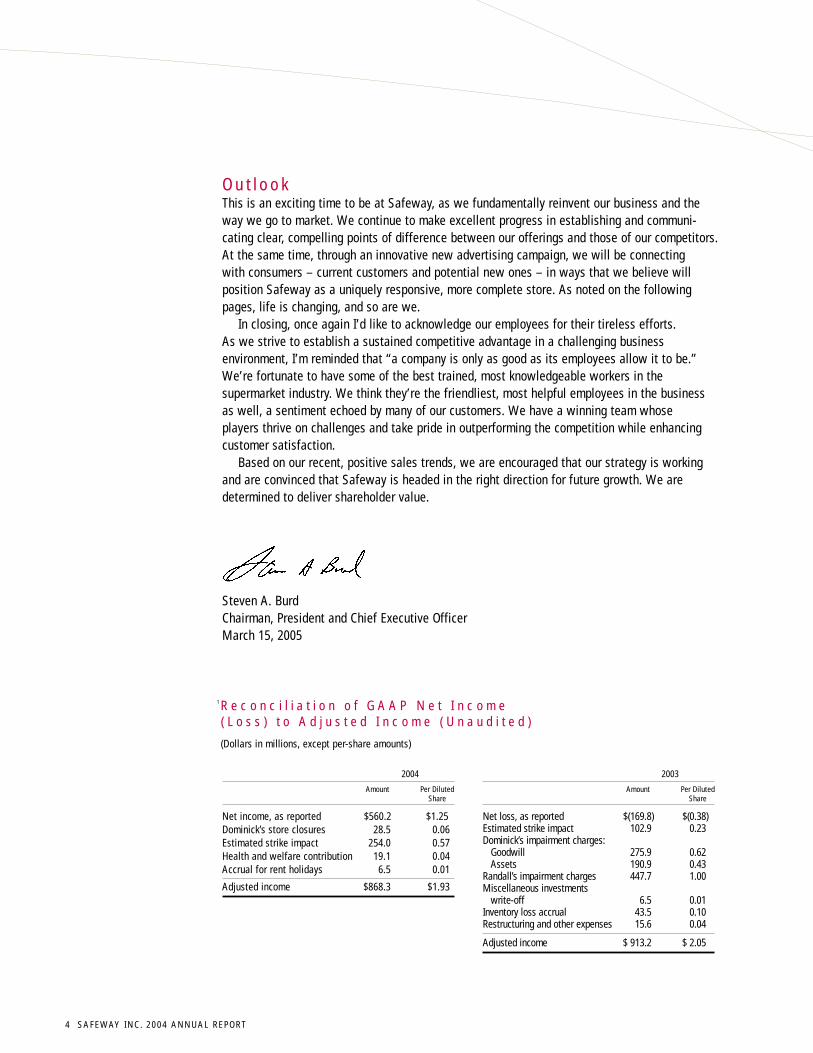
S a f e w a y i s r e d e f i n i n g t h e
Q U A L I T Y P R O D U C E
Because life has changed, we’re changing, too. We are fundamentally reinventing our business, establishing a solid framework to provide consistently high-quality food that fits consumers’ changing lifestyles. Every day, in every department of every store, we strive to establish clear, compelling points of difference in our offerings so we will be demonstrably superior to our competitors and can provide an exceptionally satisfying shopping experience for our customers. This is particularly evident in the quality and presentation of our perishables and the level of customer service we deliver.
We have dramatically improved the quality and presentation of our fresh fruits and vegetables. To differentiate our produce from our competitors’, we specify higher quality grades and select from the best, sweetest crops available, some
of them unique items grown especially for us. For consumers seeking organically grown fruits and vegetables, we have expanded our assortment of top-quality, 100% Certified Organics to more than 80 items.
When seeking a food store, consumers look for one that recognizes they live and eat differently today. More shoppers are demanding meal solutions customized to their lifestyles. At the same time, shopping for food has become a continuous series of trade-offs. Despite relentless time pressure, consumers are increasingly willing to swap convenience for more interesting, relevant shopping experiences – experiences that feed both needs and passions.
m o r e f r o m a f o o d s t o r e .
S A F E W A Y I N C . 2 0 0 4 A N N U A L R E P O R T 7 8 S A F E W A Y I N C . 2 0 0 4 A N N U A L R E P O R T
S a f e w a y i s r e d e f i n i n g t h e
Q U A L I T Y P R O D U C E
Because life has changed, we’re changing, too. We are fundamentally reinventing our business, establishing a solid framework to provide consistently high-quality food that fits consumers’ changing lifestyles. Every day, in every department of every store, we strive to establish clear, compelling points of difference in our offerings so we will be demonstrably superior to our competitors and can provide an exceptionally satisfying shopping experience for our customers. This is particularly evident in the quality and presentation of our perishables and the level of customer service we deliver.
We have dramatically improved the quality and presentation of our fresh fruits and vegetables. To differentiate our produce from our competitors’, we specify higher quality grades and select from the best, sweetest crops available, some
of them unique items grown especially for us. For consumers seeking organically grown fruits and vegetables, we have expanded our assortment of top-quality, 100% Certified Organics to more than 80 items.
When seeking a food store, consumers look for one that recognizes they live and eat differently today. More shoppers are demanding meal solutions customized to their lifestyles. At the same time, shopping for food has become a continuous series of trade-offs. Despite relentless time pressure, consumers are increasingly willing to swap convenience for more interesting, relevant shopping experiences – experiences that feed both needs and passions.
m o r e f r o m a f o o d s t o r e .

1 4 S A F E W A Y I N C . 2 0 0 4 A N N U A L R E P O R T
mF i n a n c i a l C o n t e n t s
15 Company in Review
18 Five-Year Summary Financial Information
20 Financial Review
29 Consolidated Statements of Operations
30 Consolidated Balance Sheets
32 Consolidated Statements of Cash Flows
34 Consolidated Statements of Stockholders’ Equity
35 Notes to Consolidated Financial Statements
53 Management’s Annual Report on Internal Controls over Financial Reporting
54 Independent Auditors’ Report
56 Directors and Principal Officers
57 Investor Information
S A F E WA Y I N C . 2 0 0 4 A N N U A L R E P O R T 9
f o o d s h o p p i n g e x p e r i e n c e . Nowhere is the transformation and revitalization of Safeway more apparent than in our spectacular new Lifestyle stores. These stores highlight our passion for superb fresh foods and innovative, consumer-focused initiatives such as restaurant-quality meal solutions and organic produce. We have designed and merchandised our Lifestyle stores to reflect the way today’s consumers shop. Our ultimate objective with this exciting new format is to make Safeway a complete food store, a one-of-kind store that offers shoppers an unparalleled array of uniquely responsive solutions and experiences, now and in the future.

K e y M a r k e t i n g I n i t i a t i v e s
R a n c h e r ’s R e s e r v e B e e fSafeway’s exclusive line of Rancher’s Reserve beef is naturally aged to ensure exceptional taste and tender-ness. Our beef experts carefully select and trim every cut of Rancher’s Reserve by hand. The result is beef that’s guaranteed to please or we offer another cut and a full refund. We cut our customers’ meat purchases any way they like them and gladly offer cooking tips and recommendations. We even season or marinade their purchases at no extra charge.
1 0 S A F E W A Y I N C . 2 0 0 4 A N N U A L R E P O R T 1 1 S A F E W A Y I N C . 2 0 0 4 A N N U A L R E P O R T
S p e c i a l t y F o o d s t o G oWe’re working hard to make our prepared meals program the finest of its kind. Our extensive at your table menu features fresh sushi, Milena’s pizzeria-style pizzas, gourmet specialties such as teriyaki salmon and grilled rosemary chicken, and “comfort food” like traditional meatloaf. Busy shoppers can also select numerous ready-to-go offerings from our Signature line of premium sandwiches, soups and salads.
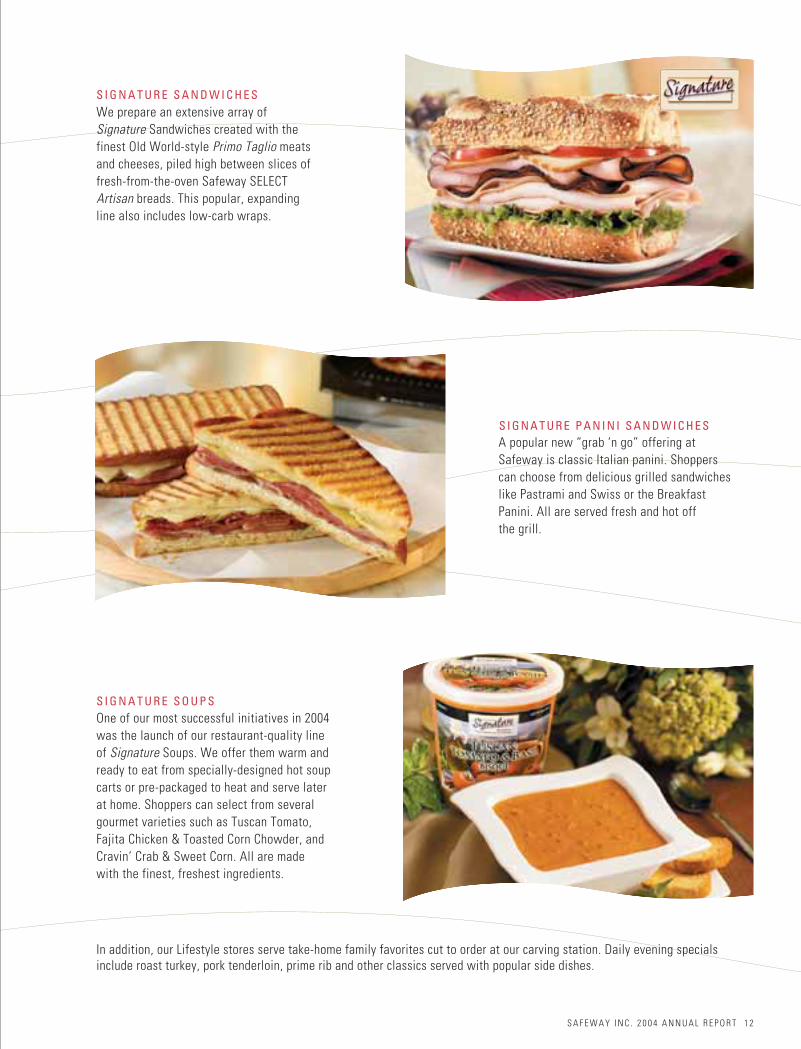
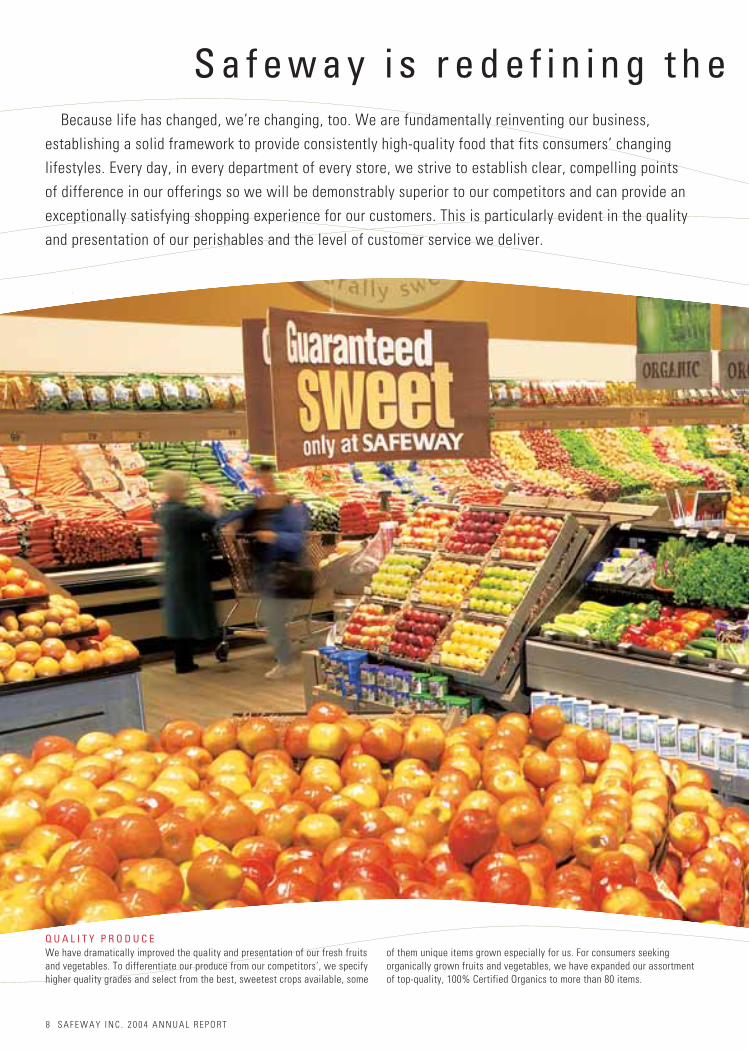
S I G N A T U R E S A N D W I C H E S We prepare an extensive array of Signature Sandwiches created with the finest Old World-style Primo Taglio meats and cheeses, piled high between slices of fresh-from-the-oven Safeway SELECT Artisan breads. This popular, expanding line also includes low-carb wraps.
S I G N A T U R E P A N I N I S A N D W I C H E SA popular new “grab ‘n go” offering at Safeway is classic Italian panini. Shoppers can choose from delicious grilled sandwiches like Pastrami and Swiss or the Breakfast Panini. All are served fresh and hot off the grill.
S I G N A T U R E S O U P S One of our most successful initiatives in 2004 was the launch of our restaurant-quality line of Signature Soups. We offer them warm and ready to eat from specially-designed hot soup carts or pre-packaged to heat and serve later at home. Shoppers can select from several gourmet varieties such as Tuscan Tomato, Fajita Chicken & Toasted Corn Chowder, and Cravin’ Crab & Sweet Corn. All are made with the finest, freshest ingredients.
In addition, our Lifestyle stores serve take-home family favorites cut to order at our carving station. Daily evening specials include roast turkey, pork tenderloin, prime rib and other classics served with popular side dishes.
S A F E W A Y I N C . 2 0 0 4 A N N U A L R E P O R T 1 2
N e w L i f e s t y l e S t o r e sOur new Lifestyle concept stores have been dramatically redesigned to showcase our commitment to quality, particularly in the perishable departments. Earth-toned décor, subdued lighting, custom flooring, unique display fixtures and other special features impart a warm ambiance that we believe significantly enhances the shopping experience. As of year-end 2004, we had built 34 new stores of this design and remodeled 108 existing stores to the same standards. Sales at these stores have been strong, reflecting positive customer response to the new format.
S A F E W A Y I N C . 2 0 0 4 A N N U A L R E P O R T 1 3

S A F E WAY I N C . A N D S U B S I D I A R I E S
1 4 S A F E WAY I N C . 2 0 0 4 A N N U A L R E P O R T
F i n a n c i a l C o n t e n t s
15 Company in Review
18 Five-Year Summary Financial Information
20 Financial Review
29 Consolidated Statements of Operations
30 Consolidated Balance Sheets
32 Consolidated Statements of Cash Flows
34 Consolidated Statements of Stockholders’ Equity
35 Notes to Consolidated Financial Statements
53 Management’s Annual Report onInternal Controls over Financial Reporting
54 Independent Auditors’ Reports
56 Directors and Principal Officers
57 Investor Information

Safeway Inc. (“Safeway” or the “Company”) is one of thelargest food and drug retailers in North America, with 1,802stores at year-end 2004.
The Company’s U.S. retail operations are locatedprincipally in California, Oregon, Washington, Alaska,Colorado, Arizona, Texas, the Chicago metropolitan area andthe Mid-Atlantic region. The Company’s Canadian retailoperations are located principally in British Columbia,Alberta and Manitoba/Saskatchewan. In support of its retailoperations, the Company has an extensive network of distri-bution, manufacturing and food processing facilities.
Safeway also has a 49% interest in Casa Ley, S.A. deC.V. (“Casa Ley”) which operates 115 food and generalmerchandise stores in Western Mexico. In addition, theCompany has a strategic alliance with and a 54%ownership interest in GroceryWorks Holdings, Inc., anInternet grocer.
S T O R E S Safeway’s average store size is approximately45,000 square feet. The Company determines the size of anew store based on a number of considerations, includingthe needs of the community the store serves, the locationand site plan, and the estimated return on capital invested.Safeway’s primary new store prototype, called the “LifestyleStore,” is 55,000 square feet. Lifestyle stores feature awarm and inviting décor, with special lighting to highlightproducts and departments.
Safeway’s stores provide a full array of dry grocery itemstailored to local preferences. Most stores offer a wideselection of food and general merchandise and feature avariety of specialty departments such as bakery,delicatessen, floral and pharmacy. In addition, many storesnow offer Starbucks coffee shops and adjacent fuel centers.
Safeway continues to operate a number of smaller storesthat also offer an extensive selection of food and generalmerchandise, and generally include one or more specialtydepartments. These stores remain an important part of theCompany’s store network in smaller communities andcertain other locations where larger stores may not befeasible because of space limitations and/or communityneeds or restrictions.
The following table summarizes Safeway’s stores by sizeat year-end 2004:
Number Percent Square Footage of Stores of Total
Less than 30,000 275 15%30,000 to 50,000 767 43More than 50,000 760 42
Total stores 1,802 100%
S T O R E O W N E R S H I P At year-end 2004, Safeway ownedapproximately one-third of its stores and leased itsremaining stores.The Company prefers ownership because itprovides control and flexibility with respect to financingterms, remodeling, expansions and closures.
M E R C H A N D I S I N G Safeway’s operating strategy is toprovide value to its customers by maintaining high storestandards and a wide selection of high quality products atcompetitive prices. To provide one-stop shopping for today’sbusy shoppers, the Company emphasizes high qualityproduce and meat, and offers many specialty items throughits various specialty departments.
Safeway is focused on differentiating its offering withhigh quality perishables. The Company is developing areputation for having the absolute best produce in themarket and the most tender and flavorful meat, through theCompany’s Rancher’s Reserve Tender Beef offering. Inaddition, Safeway has developed a variety of new items inthe deli/food service department, including Signaturesandwiches, soups and salads that provide meal solutionsto today’s busy shoppers.
To showcase its commitment to quality, particularly inthe perishable departments, Safeway has developed a storeprototype called the “Lifestyle Store.” The Lifestyle storehas an earth-toned décor package, subdued lighting, customflooring, unique display fixtures and other special featuresthat impart a warm ambience that the Company believessignificantly enhances the shopping experience.
S A F E WAY I N C . 2 0 0 4 A N N U A L R E P O R T 1 5
S A F E WAY I N C . A N D S U B S I D I A R I E S
C o m p a n y i n R e v i e w

1 6 S A F E WAY I N C . 2 0 0 4 A N N U A L R E P O R T
S A F E WAY I N C . A N D S U B S I D I A R I E S
Safeway has developed a line of some 1,300 premiumcorporate brand products since 1993 under the “SafewaySELECT” banner. The award-winning Safeway SELECT line isdesigned to offer premium quality products that the Companybelieves are equal or superior in quality to comparable best-selling nationally advertised brands, or are unique to thecategory and not available from national brand manufacturers.
The Safeway SELECT line of products includescarbonated soft drinks; unique salsas; bagged salads; wholebean coffees; the Indulgence line of cookies and othersweets; the Verdi line of frozen pizzas, fresh and frozenpastas, pasta sauces and olive oils; Milena’s take & bakepizzas; the Primo Taglio line of meats, cheeses andsandwiches; Signature soups, sandwiches and salads;Artisan fresh-baked breads; NutraBalance pet food; andUltra laundry detergents and dish soaps. The SafewaySELECT line also includes an extensive array of ice creams,frozen yogurts and sorbets; Healthy Advantage items suchas low-fat ice creams, cereals and low-fat cereal bars; andGourmet Club frozen entrees and hors d’oeuvres.
M A N U FA C T U R I N G A N D W H O L E S A L E The principalfunction of manufacturing operations is to purchase,manufacture and process private label merchandise sold instores operated by the Company. As measured by salesdollars, approximately 24% of Safeway’s private labelmerchandise is manufactured in Company-owned plants,and the remainder is purchased from third parties.
Safeway’s Canadian subsidiary has a wholesaleoperation that distributes both national brands and privatelabel products to independent grocery stores and institu-tional customers.
Safeway operated the following manufacturing andprocessing facilities at year-end 2004:
U.S. Canada
Milk plants 6 3Bread baking plants 5 2Ice cream plants 2 2Cheese and meat packaging plants – 2Soft drink bottling plants 4 –Fruit and vegetable processing plants 1 3Other food processing plants 2 –Pet food plant 1 –
Total 21 12
In addition, the Company operates laboratory facilitiesfor quality assurance and research and development incertain of its plants and at its corporate offices.
D I S T R I B U T I O N Each of Safeway’s 12 retail operatingareas is served by a regional distribution center consistingof one or more facilities. Safeway has 17 distribution/ warehousing centers (13 in the United States and four inCanada), which collectively provide the majority of allproducts to Safeway stores. The Company’s distributioncenters in Maryland, Alberta and British Columbia areoperated by third parties.
C A P I TA L E X P E N D I T U R E P R O G R A M A key component ofthe Company’s long-term strategy is its capital expenditureprogram. The Company’s capital expenditure program funds,among other things, new stores, remodels, manufacturingplants, distribution facilities and information technologyadvances. Over the last several years, Safewaymanagement has continued to strengthen its program toselect and approve new capital investments.
S A F E WAY I N C . 2 0 0 4 A N N U A L R E P O R T 1 7
S A F E WAY I N C . A N D S U B S I D I A R I E S
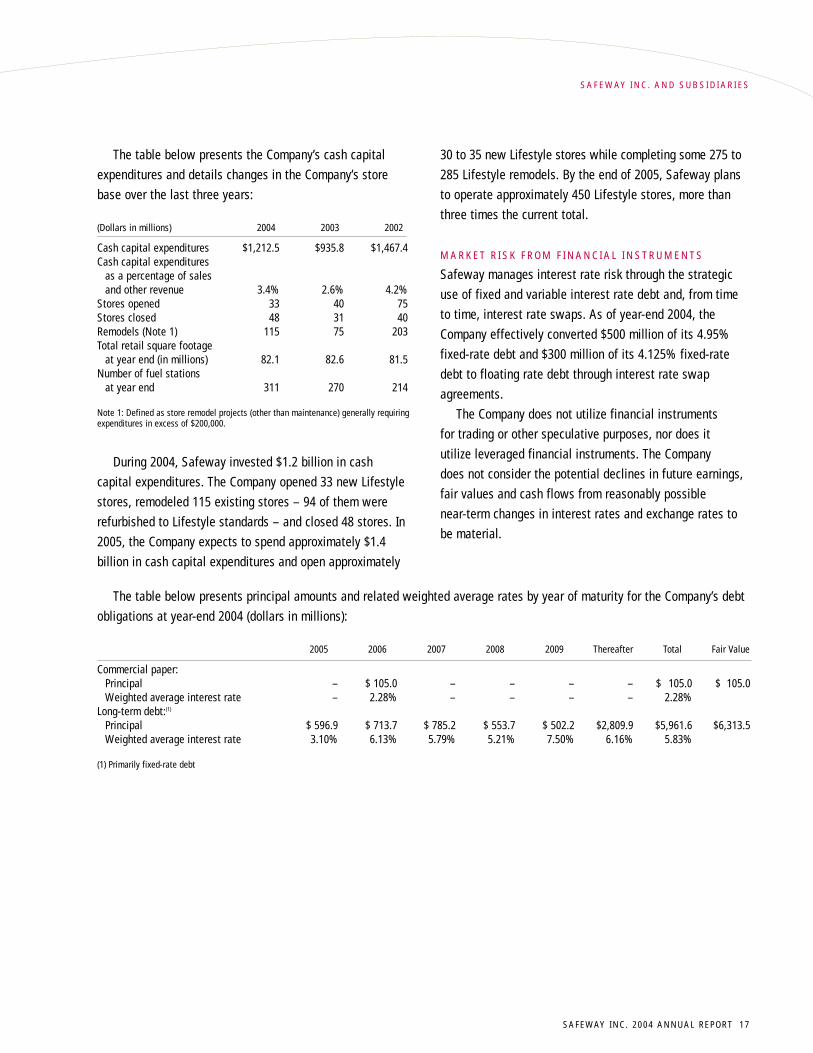
The table below presents principal amounts and related weighted average rates by year of maturity for the Company’s debtobligations at year-end 2004 (dollars in millions):
2005 2006 2007 2008 2009 Thereafter Total Fair Value
Commercial paper:Principal – $ 105.0 – – – – $ 105.0 $ 105.0Weighted average interest rate – 2.28% – – – – 2.28%
Long-term debt:(1)
Principal $ 596.9 $ 713.7 $ 785.2 $ 553.7 $ 502.2 $2,809.9 $5,961.6 $6,313.5Weighted average interest rate 3.10% 6.13% 5.79% 5.21% 7.50% 6.16% 5.83%
(1) Primarily fixed-rate debt
The table below presents the Company’s cash capitalexpenditures and details changes in the Company’s storebase over the last three years:
(Dollars in millions) 2004 2003 2002
Cash capital expenditures $1,212.5 $935.8 $1,467.4Cash capital expenditures
as a percentage of sales and other revenue 3.4% 2.6% 4.2%
Stores opened 33 40 75Stores closed 48 31 40Remodels (Note 1) 115 75 203Total retail square footage
at year end (in millions) 82.1 82.6 81.5Number of fuel stations
at year end 311 270 214
Note 1: Defined as store remodel projects (other than maintenance) generally requiringexpenditures in excess of $200,000.
During 2004, Safeway invested $1.2 billion in cashcapital expenditures. The Company opened 33 new Lifestylestores, remodeled 115 existing stores – 94 of them wererefurbished to Lifestyle standards – and closed 48 stores. In2005, the Company expects to spend approximately $1.4billion in cash capital expenditures and open approximately
30 to 35 new Lifestyle stores while completing some 275 to285 Lifestyle remodels. By the end of 2005, Safeway plansto operate approximately 450 Lifestyle stores, more thanthree times the current total.
M A R K E T R I S K F R O M F I N A N C I A L I N S T R U M E N T S
Safeway manages interest rate risk through the strategicuse of fixed and variable interest rate debt and, from timeto time, interest rate swaps. As of year-end 2004, theCompany effectively converted $500 million of its 4.95%fixed-rate debt and $300 million of its 4.125% fixed-ratedebt to floating rate debt through interest rate swapagreements.
The Company does not utilize financial instruments for trading or other speculative purposes, nor does it utilize leveraged financial instruments. The Company does not consider the potential declines in future earnings,fair values and cash flows from reasonably possible near-term changes in interest rates and exchange rates tobe material.

1 8 S A F E WAY I N C . 2 0 0 4 A N N U A L R E P O R T
52 Weeks 53 Weeks 52 Weeks 52 Weeks 52 Weeks(Dollars in millions, except per-share amounts) 2004 2003 2002 2001 2000
R e s u l t s o f O p e r a t i o n s (Note 1)Sales and other revenue $35,822.9 $35,727.2 $34,917.2 $34,434.5 $32,103.3
Gross profit 10,595.3 10,724.2 10,996.4 10,776.6 9,666.1Operating and administrative expense (9,422.5) (9,421.2) (8,760.8) (8,047.4) (7,258.2)Goodwill impairment charges – (729.1) (1,288.0) – –Goodwill amortization – – – (140.4) (126.2)
Operating profit 1,172.8 573.9 947.6 2,588.8 2,281.7Interest expense (411.2) (442.4) (430.8) (446.9) (457.2)Other income (expense), net 32.3 9.6 15.5 (46.9) 42.0
Income before income taxes and cumulativeeffect of accounting change 793.9 141.1 532.3 2,095.0 1,866.5
Income taxes (233.7) (310.9) (660.4) (841.1) (774.6)
Income (loss) before cumulative effect of accounting change 560.2 (169.8) (128.1) 1,253.9 1,091.9
Cumulative effect of accounting change – – (700.0) – –
Net income (loss) $ 560.2 $ (169.8) $ (828.1) $ 1,253.9 $ 1,091.9
Basic earnings (loss) per share:Income (loss) before cumulative effect
of accounting change $ 1.26 $ (0.38) $ (0.27) $ 2.49 $ 2.19Cumulative effect of accounting change – – (1.50) – –
Net income (loss) $ 1.26 $ (0.38) $ (1.77) $ 2.49 $ 2.19
Diluted earnings (loss) per share:Income (loss) before cumulative effect
of accounting change $ 1.25 $ (0.38) $ (0.27) $ 2.44 $ 2.13Cumulative effect of accounting change – – (1.50) – –
Net income (loss) $ 1.25 $ (0.38) $ (1.77) $ 2.44 $ 2.13
F i v e - Ye a r S u m m a r y F i n a n c i a l I n f o r m a t i o nS A F E WAY I N C . A N D S U B S I D I A R I E S

F i v e - Ye a r S u m m a r y F i n a n c i a l I n f o r m a t i o nS A F E WAY I N C . A N D S U B S I D I A R I E S
S A F E WAY I N C . 2 0 0 4 A N N U A L R E P O R T 1 9
52 Weeks 53 Weeks 52 Weeks 52 Weeks 52 Weeks(Dollars in millions, except per-share amounts) 2004 2003 2002 2001 2000
F i n a n c i a l S t a t i s t i c s (Note 1)Comparable-store sales increases (decreases) (Note 2) 0.9% (2.4%) (0.7%) 2.3% 2.8%Identical-store sales increases (decreases) (Note 2) 0.3% (2.8%) (1.7%) 1.6% 2.2%Gross profit margin 29.58% 30.02% 31.49% 31.30% 30.11%Operating and administrative expense
as a percentage of sales (Note 3) 26.30% 26.37% 25.09% 23.37% 22.61%Operating profit as a percentage of sales 3.3% 1.6% 2.7% 7.5% 7.1%Cash capital expenditures $ 1,212.5 $ 935.8 $ 1,467.4 $ 1,793.0 $ 1,572.5Depreciation and amortization 894.6 863.6 888.3 797.3 704.5Total assets 15,377.4 15,096.7 16,047.2 17,462.6 15,965.2Total debt 6,763.4 7,822.3 8,435.6 7,399.8 6,495.9Total stockholders’ equity 4,306.9 3,644.3 3,627.5 5,889.6 5,389.8Weighted average shares outstanding –
basic (in millions) 445.6 441.9 467.3 503.3 497.9Weighted average shares outstanding –
diluted (in millions) 449.1 441.9 467.3 513.2 511.6
O t h e r S t a t i s t i c sGenuardi’s stores acquired during the year – – – 39 –Stores opened during the year 33 40 75 95 75Stores closed during the year 48 31 40 49 46Total stores at year-end 1,802 1,817 1,808 1,773 1,688Remodels completed during the year (Note 4) 115 75 203 255 275Total retail square footage at year-end (in millions) 82.1 82.6 81.5 78.8 73.6
Note 1. The Company has classified certain minor revenue items as other revenues in 2004. These items had historically been classified as a reduction of costs and expenses. Theseitems, and their effect on same-store sales, have been reclassified for prior periods to conform to the 2004 presentation. See page 22.
Note 2. Defined as stores operating the same period in both the current year and the previous year. Comparable stores include replacement stores while identical stores do not. 2004 sales increase includes the estimated 60-basis-point impact of Southern California strike. 2003 sales decrease includes the estimated 240-basis-point impact of Southern California strike. 2001 and 2000 sales increases include the estimated 50-basis-point impact of the 2000 Northern California distribution center strike.
Note 3. Management believes this ratio is relevant because it assists investors in evaluating Safeway’s ability to control costs.Note 4. Defined as store remodel projects (other than maintenance) generally requiring expenditures in excess of $200,000.

2 0 S A F E WAY I N C . 2 0 0 4 A N N U A L R E P O R T
S A F E WAY I N C . A N D S U B S I D I A R I E S
R e s u l t s o f O p e r a t i o n s Safeway reported net income of $560.2 million ($1.25 perdiluted share) in 2004, a net loss of $169.8 million ($0.38per diluted share) in 2003 and a net loss of $828.1 million($1.77 per diluted share) in 2002. These results were signifi-cantly affected by a strike in Southern California, goodwilland asset impairments at Dominick’s and Randall’s andother unusual charges described below.
S T R I K E I M PA C T On October 11, 2003, seven UFCW localunions struck the Company’s 289 stores in SouthernCalifornia. As a result, pursuant to the terms of a multi-employer bargaining arrangement, Kroger and Albertson’slocked out certain of their retail union employees inSouthern California food stores. An agreement ending thestrike was ratified by the unions on February 28, 2004.Employees returned to work beginning March 5, 2004.Safeway estimates the overall cost of the strike and itsresidual effects reduced 2004 earnings by $412.2 millionbefore taxes ($0.57 per diluted share) and 2003 earnings by$167.5 million before taxes ($0.23 per diluted share).Safeway estimated the impact of the strike by comparinginternal forecasts immediately before the strike with actualresults during and after the strike, at strike-affected stores.The estimate also includes the Company’s benefit under anagreement with Kroger and Albertson’s that arises out ofthe multi-employer bargaining process in Southern California.
D O M I N I C K ’ S In the first quarter of 2002, Safeway adoptedStatement of Financial Accounting Standards (“SFAS”) No.142, “Goodwill and Other Intangible Assets,” and recordeda pre-tax goodwill impairment charge of $589.0 million atDominick’s. In November 2002, Safeway announced thedecision to sell Dominick’s and exit the Chicago market dueto labor issues. In accordance with SFAS No. 144,“Accounting for the Impairment or Disposal of Long-LivedAssets,” Safeway recorded a pre-tax charge for theimpairment of long-lived assets of $201.3 million in thefourth quarter of 2002 to adjust Dominick’s to its estimatedfair market value less cost to sell. Also in the fourth quarter
of 2002, Safeway performed its annual review of goodwilland recorded a pre-tax impairment charge of $583.8 millionfor Dominick’s.
In the first 36 weeks of 2003, Safeway reduced thecarrying value of Dominick’s by writing down an additional$256.5 million of goodwill and $120.7 million of long-livedassets, based on indications of value received during thesale process. In November 2003, Safeway announced that itwas taking Dominick’s off the market after the winningbidder and the unions representing Dominick’s could notreach an agreement on a labor contract. Safeway reclas-sified Dominick’s from an “asset held for sale” to “assetsheld and used” and adjusted Dominick’s individual long-lived assets to the lower of cost or fair value. As a result, inthe fourth quarter of 2003 Safeway incurred a pre-tax, long-lived asset impairment charge of $190.7 million and agoodwill impairment charge of $24.9 million. As of year-end2003, there is no goodwill remaining on Safeway’s consol-idated balance sheet related to Dominick’s.
In the first quarter of 2004, Safeway closed 12 under-performing Dominick’s stores which resulted in a store-lease exit charge of $45.7 million.
Pre-tax long-lived asset and goodwill impairment atDominick’s are summarized below (in millions):
2004 2003 2002
Cumulative effect of adopting SFAS No. 142 (goodwill impairment) – – $589.0
Goodwill impairment – $281.4 583.8Impairment of long-lived assets
(included in operating and administrative expense) – 311.4 201.3
Store lease exit costs (included in operating and administrative expense) $45.7 – –
Dominick’s incurred operating losses and declining salesin each of the last three fiscal years and faces substantialhurdles to achieving satisfactory operating profit in thefuture. These hurdles include a highly competitive marketand an unfavorable labor contract. Dominick’s is operatingunder a labor contract that expired in 2003 and is currentlynegotiating a new labor contract. A more competitive laborcontract is vital to Dominick’s future viability. Safewaybelieves a satisfactory contract can be negotiated.
F i n a n c i a l R e v i e w

S A F E WAY I N C . 2 0 0 4 A N N U A L R E P O R T 2 1
S A F E WAY I N C . A N D S U B S I D I A R I E S
R A N D A L L’ S In the first quarter of 2002, Safeway recordeda pre-tax goodwill impairment charge of $111.0 million atRandall’s when it adopted SFAS No. 142. During the fourthquarter of 2002, Safeway performed its annual review ofgoodwill and recorded a pre-tax impairment charge atRandall’s of $704.2 million. In the fourth quarter of 2003,Safeway again performed its annual review of goodwill andwrote off the remaining $447.7 million of goodwill atRandall’s. Pre-tax goodwill impairment charges at Randall’sare summarized below (in millions):
2003 2002
Cumulative effect of adopting SFAS No. 142 (goodwill impairment) – $111.0
Goodwill impairment $447.7 704.2
Randall’s has incurred operating losses and decliningsales in each of the last two years due primarily to over-storing in Texas. Historically, other markets which wereover-stored eventually self-corrected through populationgrowth or as operators left the market. There can be noassurance that the Texas market will experience such acorrection, and operating conditions in Texas are expectedto remain extremely competitive in 2005.
O T H E R C H A R G E S Other significant pre-tax charges (credits)consist of the following (in millions):
2004 2003 2002
Northern California health and welfare contribution $31.1 – –
Accrual for rent holidays 10.6 – –Inventory loss accrual – $71.0 –Impairment of miscellaneous
equity investments – 10.6 –Employee buyouts, severance
costs and other related costs – 25.5 –Termination of in-store banking
agreement – – $(32.7)Lease liability credits related
to Furr’s and Homeland bankruptcies – – (12.1)
In 2004, Safeway was notified that it was required tocontribute an additional $31.1 million before tax ($0.04 perdiluted share) during the year to two Northern Californiamulti-employer health and welfare plans for its share offunding deficits.
Safeway incurred a lease expense adjustment of $10.6million before tax ($0.01 per diluted share) in 2004 relatedto rent holidays. This adjustment conformed the Company’slease accounting policies to views expressed by the Officeof the Chief Accountant of the SEC on February 7, 2005.
In 2003, Safeway changed its accounting policy toaccrue estimated physical inventory losses for the periodbetween the last physical inventory count and the balancesheet date. Safeway also made a change to its physicalinventory loss calculation methodology to reflect moreprecise data from new financial software implemented in2003. The effect of these changes was recorded in 2003.However, most of the adjustment was accumulated overmany prior years. These charges reduced earnings by $71.0million before tax ($0.10 per diluted share).
Safeway wrote off miscellaneous equity investments in2003 totaling $10.6 million ($0.01 per diluted share), afterdetermining they were impaired. Safeway also incurred pre-tax charges totaling $25.5 million ($0.04 per diluted share)for employee buyouts, severance costs and other relatedcosts related to the restructuring of the Company’s adminis-trative offices.
In 2002, Safeway received $32.7 million ($0.04 perdiluted share) from a bank for the termination of an in-storebanking agreement with Safeway.
In 1987, Safeway assigned a number of leases to Furr’sInc. (“Furr’s”) and Homeland Stores, Inc. (“Homeland”) aspart of the sale of the Company’s former El Paso, Texas andOklahoma City, Oklahoma divisions. Safeway is contingentlyliable if Furr’s and Homeland are unable to continue makingrental payments on these leases. In 2001, Furr’s andHomeland declared bankruptcy and Safeway recorded a pre-tax charge to earnings of $42.7 million ($0.05 per dilutedshare) to recognize the estimated lease liabilitiesassociated with these bankruptcies and for a single lease

from Safeway’s former Florida division. In 2002, Furr’s andHomeland emerged from bankruptcy and, based on theresolution of various leases, Safeway reversed $12.1 millionof this accrual.
S A L E S Total sales increased only slightly to $35.8 billion in2004 from $35.7 billion in 2003, primarily because of thestrike and because fiscal 2004 had one fewer week thanfiscal 2003.
Historically, Safeway has classified certain minor revenueitems such as partner gift card and vending machine incomeas a reduction of costs and expenses. As the value of theseitems has grown, the Company has determined that they aremore appropriately classified as other revenue in 2004.These items have been reclassified for prior periods toconform to the 2004 presentation. These reclassificationshad no effect on previously reported operating profit or netincome (loss) and are summarized below (in millions):
2004 2003 2002
Sales, before reclassifications $ 35,621.9 $ 35,552.7 $ 34,767.5Reclassifications 201.0 174.5 149.7
Sales and other revenue, as adjusted $ 35,822.9 $ 35,727.2 $ 34,917.2
Cost of goods sold, before reclassifications $(25,230.0) $(25,018.9) $(23,955.5)
Reclassifications 2.4 15.9 34.7
Cost of good sold, as adjusted $(25,227.6) $(25,003.0) $(23,920.8)
Gross profit, before reclassifications $ 10,391.9 $ 10,533.8 $ 10,812.0
Reclassifications 203.4 190.4 184.4
Gross profit, as adjusted $ 10,595.3 $ 10,724.2 $ 10,996.4
Operating and administrative expense, before reclassifications $ (9,219.1) $ (9,230.8) $ (8,576.4)
Reclassifications (203.4) (190.4) (184.4)
Operating and administrative expense, as adjusted $ (9,422.5) $ (9,421.2) $ (8,760.8)
These reclassifications did not change previouslyreported comparable-store sales or identical-store sales bymore than 10 basis points in either 2004, 2003 or 2002.
Same-store sales increases (decreases) for 2004 were as follows:
Comparable-Store Identical-Store Sales (includes Sales (excludes
replacement stores) replacement stores)
Including Fuel:Excluding strike-affected stores 1.5% 0.9%Including strike-affected stores 0.9% 0.3%
Excluding Fuel:Excluding strike-affected stores (0.2%) (0.8%)Including strike-affected stores (0.7%) (1.3%)
In 2003, total sales increased 2.3% to $35.7 billion from$34.9 billion in 2002 due primarily to the additional week in2003, new store openings and additional fuel sales, partiallyoffset by the estimated impact of the strike in SouthernCalifornia. Excluding the estimated effects of the strike inSouthern California, comparable-store sales were flat, whileidentical-store sales declined 0.4%. Further excluding theeffects of fuel sales, 2003 comparable-store salesdecreased 1.6% and identical-store sales decreased 2.0%.
In 2002, comparable-store sales decreased by 0.7%,while identical-store sales declined 1.7%. Excluding theeffects of fuel sales, 2002 comparable-store sales decreased1.3% and identical-store sales decreased 2.2%. Sales in2002 were impacted by continued softness in the economy,an increase in competitive activity, an overly aggressiveshrink-reduction effort and disruptions associated with thecentralization of buying and merchandising.
2 2 S A F E WAY I N C . 2 0 0 4 A N N U A L R E P O R T
S A F E WAY I N C . A N D S U B S I D I A R I E S
P o r t i o n s o f 2 0 0 4 S a l e s D o l l a r
■ Cost of Goods Sold: 70.4%
■ Operating & Administrative Expense: 26.3%
■ Operating Profit: 3.3%

G R O S S P R O F I T Gross profit represents the portion of salesrevenue remaining after deducting the costs of goods soldduring the period, including purchase and distribution costs.These costs include inbound freight charges, purchasing andreceiving costs, warehouse inspection costs, warehousingcosts, and other costs of Safeway’s distribution network.Advertising and promotional expenses are also a componentof cost of goods sold.
Gross profit margin was 29.58% of sales in 2004, 30.02%in 2003, and 31.49% in 2002.
Gross profit declined 44 basis points in 2004. The strikein Southern California reduced gross profit by an estimated41 basis points, and higher fuel sales (which have a lowergross margin) reduced gross profit by 40 basis points. Grossprofit in 2003 was reduced by 20 basis points due to the$71.0 million charge to accrue estimated inventory losses.The remaining 17-basis-point increase was primarily theresult of targeted pricing and promotion.
Gross profit declined 147 basis points in 2003. Higherfuel sales reduced gross profit by 38 basis points. The $71.0million inventory loss accrual reduced gross profit 20 basispoints. The strike in Southern California reduced gross profitby an estimated five basis points. The remaining 84-basis-point decline was primarily the result of targeted pricingand promotion.
Gross profit improved 19 basis points to 31.49% in 2002primarily due to shrink control, improved buying practicesand private-label growth. The increased gross margin dollarswere largely reinvested in targeted pricing and promotion.
Vendor allowances totaled $2.2 billion in 2004, 2003 and2002. Vendor allowances did not materially impact theCompany’s gross profit in 2004, 2003 and 2002 becauseSafeway spends the allowances received on pricingpromotions, advertising expenses and slotting expenses.Vendor allowances can be grouped into the following broadcategories: promotional allowances, slotting allowancesand contract allowances. All vendor allowances areclassified as an element of cost of goods sold.
Promotional allowances make up nearly three-quarters ofall allowances. With promotional allowances, vendors paySafeway to promote their product. The promotion may beany combination of a temporary price reduction, a feature inprint ads, a feature in a Safeway circular, or a preferredlocation in the store. The promotions are typically one totwo weeks long.
Slotting allowances are a small portion of totalallowances (typically less than 5% of all allowances). Withslotting allowances, the vendor reimburses Safeway for thecost of placing new product on the shelf. Safeway has noobligation or commitment to keep the product on the shelffor a minimum period.
Contract allowances make up the remainder of allallowances. Under the typical contract allowance, a vendorpays Safeway to keep product on the shelf for a minimumperiod of time or when volume thresholds are achieved.
O P E R AT I N G A N D A D M I N I S T R AT I V E E X P E N S E Operatingand administrative expense consists primarily of storeoccupancy costs and backstage expenses, which, in turn,consist primarily of wages, employee benefits, rent,depreciation and utilities.
Operating and administrative expense was 26.30% ofsales in 2004 compared to 26.37% in 2003 and 25.09% in 2002.
Operating and administrative expense decreased sevenbasis points in 2004. Lower impairment charges reducedoperating and administrative expense as a percentage ofsales by 77 basis points and higher fuel sales reducedoperating and administrative expense by 39 basis points.These improvements were offset by a 22-basis-point increasefrom the strike in Southern California and 87 basis points dueto higher wages, benefits and occupancy expense.
Operating and administrative expense increased 128basis points in 2003. Higher Dominick’s impairment chargesincreased operating and administration expense 30 basispoints. Reduced sales from the Southern California strikeincreased operating and administrative expense by anestimated 29 basis points. Higher pension expense added28 basis points, and higher workers’ compensation expense
S A F E WAY I N C . 2 0 0 4 A N N U A L R E P O R T 2 3
S A F E WAY I N C . A N D S U B S I D I A R I E S
2 4 S A F E WAY I N C . 2 0 0 4 A N N U A L R E P O R T
S A F E WAY I N C . A N D S U B S I D I A R I E S
added 15 basis points. The remaining 26-basis-pointincrease was primarily due to higher employee benefitcosts, soft sales and settlement income from thetermination of an in-store banking agreement recorded in2002 operating and administrative expense.
Operating and administrative expense increased 172basis points in 2002. The Dominick’s impairment chargeadded 55 basis points. This increase was partially offset bya decrease of approximately 9 basis points due to incomereceived from a bank for the termination of an in-storebanking agreement with Safeway. The remaining 126-basis-point increase was primarily due to higher employee benefitcosts, higher real estate occupancy costs, higher pensionexpense and soft sales.
I N T E R E S T E X P E N S E Interest expense was $411.2 millionin 2004, compared to $442.4 million in 2003, and $430.8 in2002. Interest expense decreased in 2004 primarily due tolower average borrowings in 2004 compared to 2003.Interest expense increased in 2003 primarily due to higheraverage borrowings in 2003 compared to 2002. Interestexpense declined in 2002 primarily due to lower interestrates in 2002 compared to 2001.
O T H E R I N C O M E ( L O S S ) Other income consists of interestincome, minority interest in a consolidated affiliate andequity in earnings from Safeway’s unconsolidated affiliates.Interest income was $9.7 million in 2004, $5.4 million in2003 and $8.5 million in 2002. Equity in earnings (losses) ofunconsolidated affiliates was income of $12.6 million in2004, a loss of $ 7.1 million in 2003 and a loss of $0.2million in 2002. Equity in losses of unconsolidated affiliatesin 2002 includes approximately $15.8 million in chargesrelated to the resolution of physical inventory count discrep-ancies at Casa Ley.
C r i t i c a l A c c o u n t i n g P o l i c i e s Critical accounting policies are those accounting policiesthat management believes are important to the portrayal ofSafeway’s financial condition and results and requiremanagement’s most difficult, subjective or complexjudgments, often as a result of the need to make estimatesabout the effect of matters that are inherently uncertain.
W O R K E R S ’ C O M P E N S AT I O N The Company is primarilyself-insured for workers’ compensation, automobile andgeneral liability costs. It is the Company’s policy to record itsself-insurance liability, as determined actuarially, based onclaims filed and an estimate of claims incurred but not yetreported, discounted at a risk-free interest rate. Any actuarialprojection of losses concerning workers’ compensation andgeneral liability is subject to a high degree of variability.Among the causes of this variability are unpredictableexternal factors affecting future inflation rates, discountrates, litigation trends, legal interpretations, benefit levelchanges and claim settlement patterns. An example of howchange in discount rates can affect Safeway’s reserveoccurred in 2004 when a 25-basis point increase in theCompany’s discount rate, based on changes in market rates,reduced its liability by approximately $4.3 million.
The majority of the Company’s workers’ compensationliability is from claims occurring in California. Californiaworkers’ compensation has received intense scrutiny fromthe state’s politicians, insurers, employers and providers, aswell as the public in general. Recent years have seenescalation in the number of legislative reforms, judicialrulings and social phenomena affecting this business. Someof the many sources of uncertainty in the Company’s reserveestimates include changes in benefit levels, medical feeschedules, medical utilization guidelines, vocation rehabili-tation and apportionment.
S T O R E C L O S U R E S It is the Company’s policy to recognizelosses relating to the impairment of long-lived assets whenexpected net future cash flows are less than the assets’carrying values. For closed stores that are under long-termleases, the Company records a liability for the futureminimum lease payments and related ancillary costs from

S A F E WAY I N C . 2 0 0 4 A N N U A L R E P O R T 2 5
S A F E WAY I N C . A N D S U B S I D I A R I E S
the date of closure to the end of the remaining lease term,net of estimated cost recoveries. In both cases, fair value isdetermined by estimating net future cash flows anddiscounting them using a risk-adjusted rate of interest. The Company estimates future cash flows based on itsexperience and knowledge of the market in which theclosed store is located and, when necessary, uses realestate brokers. However, these estimates project futurecash flow several years into the future and are affected byvariable factors such as inflation, real estate markets andeconomic conditions.
E M P L O Y E E B E N E F I T P L A N S The determination ofSafeway’s obligation and expense for pension and other post-retirement benefits is dependent, in part, on the Company’sselection of certain assumptions used by its actuaries incalculating these amounts. These assumptions are disclosedin Note I to the consolidated financial statements andinclude, among other things, the discount rate, the expectedlong-term rate of return on plan assets and the rates ofcompensation and health care costs. In accordance withgenerally accepted accounting principles, actual results thatdiffer from the Company’s assumptions are accumulated andamortized over future periods and, therefore, affect itsrecognized expense and recorded obligation in such futureperiods. While Safeway believes its assumptions areappropriate, significant differences in Safeway’s actualexperience or significant changes in the Company’sassumptions may materially affect Safeway’s pension andother post-retirement obligations and its future expense.
When not considering other changes in assumptions oractual return on plan assets, a 100-basis-point reduction inthe year-end 2004 discount rate alone would negativelyimpact 2005 U.S. pension expense by approximately $28million, and a 50-basis-point reduction in expected return onplan assets alone would negatively impact 2005 U.S.pension expense by approximately $8 million.
Not considering any changes in assumptions, a $100million reduction in plan assets in 2004 would impact 2005U.S. pension expense by approximately $18 million. The fairvalue of plan assets can vary significantly from year to year.
G O O D W I L L Safeway accounts for goodwill in accordancewith SFAS No. 142, “Goodwill and Other Intangible Assets.”As required by SFAS No. 142, Safeway tests for goodwillannually using a two-step approach with extensive use ofaccounting judgments and estimates of future operatingresults. Changes in estimates or application of alternativeassumptions and definitions could produce significantlydifferent results. The factors that most significantly affectthe fair value calculation are market multiples andestimates of future cash flows. Fair value is determined by an independent third-party appraiser who primarily used the discounted cash flow method and the guidelinecompany method.
L i q u i d i t y a n d F i n a n c i a l R e s o u r c e sNet cash flow from operating activities was $2,226.4 millionin 2004, $1,609.6 million in 2003, and $2,034.7 million in2002. Net cash flow from operating activities increased in2004 largely due to increased net income and changes inworking capital. Net cash flow from operating activitiesdecreased in 2003 and 2002 primarily due to lower operatingresults and changes in working capital.
Cash flow used by investing activities was $1,070.3million in 2004, $795.0 million in 2003 and $1,395.7 millionin 2002. Cash flow used by investing activities increased in 2004 compared to 2003 because of higher capitalexpenditures. Cash flow used by investing activitiesdecreased in 2003 compared to 2002 because of reducedcapital expenditures in 2003. Cash flow used by investingactivities declined in 2002 compared to 2001 primarilybecause of cash used to acquire Genuardi’s in 2001, as wellas reduced capital expenditures.
Capital expenditures were gradually scaled back in 2003and 2002 as the economy softened. Capital expendituresincreased in 2004 as the Company focused on remodelingits existing stores under its new “Lifestyle Store” prototype.In 2004, Safeway opened 33 new stores and completed 115remodels. In 2003, Safeway opened 40 new stores andremodeled 75 stores. In 2005, Safeway expects to spendapproximately $1.4 billion in cash capital expenditures,open approximately 30 to 35 new stores and completeapproximately 275 to 285 remodels.

S A F E WAY I N C . A N D S U B S I D I A R I E S
should not be considered as an alternative to net income orcash flows from operating activities (which are determinedin accordance with GAAP) and is not being presented as anindicator of operating performance or a measure of liquidity.Other companies may define Adjusted EBITDA differentlyand, as a result, such measures may not be comparable toSafeway’s Adjusted EBITDA.
52 weeks(Dollars in millions) 2004
Adjusted EBITDA:Net income $ 560.2Add (subtract):
Income taxes 233.7LIFO income (15.2)Interest expense 411.2Depreciation and amortization 894.6Equity in earnings of unconsolidated affiliates (12.6)
Total Adjusted EBITDA $2,071.9
Adjusted EBITDA as a multiple of interest expense 5.04x
Total debt at year-end 2004 $6,763.4
Debt to Adjusted EBITDA 3.26x
Total debt, including capital leases, was $6.76 billion in2004, $7.82 billion in 2003 and $8.44 billion in 2002. Totaldebt declined in 2004 and 2003 as Safeway used cash flowfrom operations to pay down debt. Annual debt maturitiesover the next five years are set forth in Note D of theCompany’s 2004 consolidated financial statements.
Based upon the current level of operations, Safewaybelieves that net cash flow from operating activities andother sources of liquidity, including borrowing under theCompany’s commercial paper program and bank creditagreement, will be adequate to meet anticipatedrequirements for working capital, capital expenditures,interest payments and scheduled principal payments for theforeseeable future. There can be no assurance, however,that Safeway’s business will continue to generate cash flowat or above current levels or that the Company will be ableto maintain its ability to borrow under the commercial paperprogram and bank credit agreement.
If the Company’s credit rating were to decline below itscurrent level of Baa2/BBB, the ability to borrow under thecommercial paper program would be adversely affected.Safeway’s ability to borrow under the bank credit agreementis unaffected by Safeway’s credit rating. However, ifSafeway’s 2004 Adjusted EBITDA to interest ratio of 5.04 to1 were to decline to 2.0 to 1, or if Safeway’s year-end 2004debt to Adjusted EBITDA ratio of 3.26 to 1 were to grow to4.0 to 1, Safeway’s ability to borrow under the bank creditagreement would be impaired. The computation of AdjustedEBITDA, as defined by the bank credit agreement, isprovided below solely to provide an understanding of theimpact that Adjusted EBITDA has on Safeway’s ability toborrow under the bank credit agreement. Adjusted EBITDA
2 6 S A F E WAY I N C . 2 0 0 4 A N N U A L R E P O R T
The table below presents significant contractual obligations of the Company at year-end 2004:
(In millions) 2005 2006 2007 2008 2009 Thereafter Total
Long-term debt $ 596.9 $ 818.7 $ 785.2 $ 553.7 $ 502.2 $2,809.9 $6,066.6Capital lease obligations(1) 42.8 40.8 41.8 42.5 43.7 485.2 696.8Operating leases 405.9 396.8 380.9 362.5 328.3 2,778.6 4,653.0Self-insurance liability 142.9 96.2 66.1 46.7 34.5 112.5 498.9Contracts for purchase of property, equipment
and construction of buildings 139.7 – – – – – 139.7Contracts for purchase of inventory 486.9 – – – – – 486.9
(1) Minimum lease payments, less amounts representing interest

S A F E WAY I N C . A N D S U B S I D I A R I E S
N e w A c c o u n t i n g S t a n d a r d sIn January 2004, the FASB issued SFAS No. 106-1,“Accounting and Disclosure Requirements Related to theMedicare Prescription Drug, Improvement and ModernizationAct of 2003.” This statement permits a sponsor to make aone-time election to defer accounting for the effects of theMedicare Prescription Drug, Improvement and ModernizationAct of 2003, or the Prescription Drug Act. The PrescriptionDrug Act, signed into law in December 2003, establishes aprescription drug benefit under Medicare (Medicare Part D)and a federal subsidy to sponsors of retiree health carebenefit plans that provide a benefit that is at least actuariallyequivalent to Medicare Part D. SFAS No. 106-1 does notprovide specific guidance as to whether a sponsor shouldrecognize the effects of the Prescription Drug Act in itsfinancial statements. The Prescription Drug Act introducestwo new features to Medicare that must be consideredwhen measuring accumulated postretirement benefit costs.The new features include a subsidy to the plan sponsorsthat is based on 28% of an individual beneficiary’s annualprescription drug costs between $250 and $5,000 and anopportunity for a retiree to obtain a prescription drug benefitunder Medicare. The Prescription Drug Act is not expected toreduce Safeway’s net postretirement benefit costs.
Safeway has elected to defer adoption of SFAS No. 106-1due to the lack of specific guidance. Therefore, the netpostretirement benefit costs disclosed in the Company’sfinancial statements do not reflect the impacts of thePrescription Drug Act on the plans. The deferral willcontinue to apply until specific authoritative accountingguidance for the federal subsidy is issued. Authoritativeguidance on the accounting for the federal subsidy ispending and, when issued, could require informationpreviously reported in the Company’s financial statementsto change. Safeway is currently investigating the impacts ofSFAS No. 106-1’s initial recognition, measurement anddisclosure provisions on it’s financial statements.
In December 2004, the FASB issued FASB Staff PositionSFAS No. 109-2, "Accounting Disclosure Guidance for theForeign Earnings Repatriation Provision within the AmericanJobs Creation Act of 2004,” which provides accounting anddisclosure guidance for the repatriation provisions of theAmerican Jobs Creation Act of 2004 (the “Act”). The Actprovides for a special one-time tax deduction of certainearnings repatriated in 2005. The Company is evaluatingwhether to take advantage of this provision with respect toits Canadian subsidiary, and expects to complete theevaluation by the fourth quarter of 2005. The Companyanticipates that it could repatriate between zero and $734million, and that the tax cost of the repatriation would bebetween zero and $75 million.
In December 2004, the FASB issued FASB Staff PositionSFAS No. 109-1, “Application of FASB Statement No. 109,Accounting for Income Taxes, to the Tax Deduction onQualified Production Activities Provided by the AmericanJobs Creation Act of 2004,” which provides accounting anddisclosure guidance on the Act’s qualified productionactivities deduction. The Company is currently evaluatingthe impact of this guidance on its effective tax rate for 2005and subsequent periods.
In December 2004, the FASB issued SFAS No. 123(Revised 2004), “Share-Based Payment” (“SFAS No. 123R”),which replaces SFAS No. 123, supersedes APB No. 25 andrelated interpretations and amends SFAS No. 95, “Statementof Cash Flows.” The provisions of SFAS No. 123R aresimilar to those of SFAS No. 123; however, SFAS No. 123Rrequires all share-based payments to employees, includinggrants of employee stock options, to be recognized in thefinancial statements as compensation cost based on theirfair value on the date of grant. Fair value of share-basedawards will be determined using option-pricing models (e.g. Black-Scholes or binomial models) and assumptionsthat appropriately reflect the specific circumstances of theawards. Compensation cost will be recognized over thevesting period based on the fair value of awards thatactually vest.
S A F E WAY I N C . 2 0 0 4 A N N U A L R E P O R T 2 7

2 8 S A F E WAY I N C . 2 0 0 4 A N N U A L R E P O R T
S A F E WAY I N C . A N D S U B S I D I A R I E S
The Company will be required to choose between themodified-prospective and modified-retrospective transitionalternatives in adopting SFAS No. 123R. Under themodified-prospective-transition method, compensation costwill be recognized in financial statements issuedsubsequent to the date of adoption for all shared-basedpayments granted, modified or settled after the date ofadoption, as well as for any unvested awards that weregranted prior to the date of adoption. Under the modified-retrospective-transition method, prior period financialstatements will be restated by recognizing compensationcost as previously reported in the pro forma disclosuresunder SFAS No. 123. The restatement provisions can beapplied to either a) all periods presented or b) to thebeginning of the fiscal year in which SFAS No. 123R isadopted. As the Company previously adopted only the proforma disclosure provisions of SFAS No. 123, Safeway willrecognize compensation cost relating to the unvestedportion of awards granted prior to the date of adoptionusing the same estimate of the grant-date fair value and thesame attribution method used to determine the pro formadisclosures under SFAS No. 123.
SFAS No. 123R is effective at the beginning of the firstinterim or annual period beginning after June 15, 2005, andearly adoption is encouraged. Safeway has elected to earlyadopt this pronouncement beginning in the first quarter of2005. The Company is in the process of evaluating the useof certain option-pricing models as well as the assumptionsto be used in such models. When that evaluation is complete,Safeway will select a transition method.
F o r w a r d - L o o k i n g S t a t e m e n t sThis Annual Report contains certain forward-lookingstatements within the meaning of Section 27A of theSecurities Act of 1933 and Section 21E of the SecuritiesExchange Act of 1934. Such statements relate to, amongother things, capital expenditures, acquisitions, thevaluation of Safeway’s investments, operatingimprovements and costs, tax rate and gross profitimprovement, and are indicated by words or phrases suchas “continuing,” “ongoing,” “expects” and similar words orphrases. The following are among the principal factors thatcould cause actual results to differ materially from theforward-looking statements: general business and economicconditions in our operating regions, including the rate ofinflation, consumer spending levels, population,employment and job growth in our markets; pricingpressures and competitive factors, which could includepricing strategies, store openings and remodels by ourcompetitors; results of our programs to control or reducecosts, improve buying practices and control shrink; resultsof our programs to increase sales, including private-labelsales, improvement in our perishables departments and ourpromotional programs; results of our programs to improvecapital management; the ability to integrate any companieswe acquire and achieve operating improvements at thosecompanies; changes in financial performance of our equityinvestments; increases in labor costs and relations withunion bargaining units representing our employees oremployees of third-party operators of our distributioncenters; changes in state or federal legislation or regulation;the cost and stability of power sources; opportunities,acquisitions or dispositions that we pursue; performance in new business ventures; the rate of return on our pensionassets; and the availability and terms of financing.Consequently, actual events and results may vary signifi-cantly from those included in or contemplated or implied bysuch statements. The Company undertakes no obligation toupdate forward-looking statements to reflect developmentsor information obtained after the date hereof and disclaimsany obligation to do so.

S A F E WAY I N C . 2 0 0 4 A N N U A L R E P O R T 2 9
S A F E WAY I N C . A N D S U B S I D I A R I E S
52 Weeks 53 Weeks 52 Weeks(In millions, except per-share amounts) 2004 2003 2002
Sales and other revenue $ 35,822.9 $ 35,727.2 $ 34,917.2Cost of goods sold (25,227.6) (25,003.0) (23,920.8)
Gross profit 10,595.3 10,724.2 10,996.4 Operating and administrative expense (9,422.5) (9,421.2) (8,760.8)Goodwill impairment charges – (729.1) (1,288.0)
Operating profit 1,172.8 573.9 947.6 Interest expense (411.2) (442.4) (430.8)Other income, net 32.3 9.6 15.5
Income before income taxes and cumulative effect of accounting change 793.9 141.1 532.3
Income taxes (233.7) (310.9) (660.4)
Income (loss) before cumulative effect ofaccounting change 560.2 (169.8) (128.1)
Cumulative effect of accounting change – – (700.0)
Net income (loss) $ 560.2 $ (169.8) $ (828.1)
B a s i c e a r n i n g s ( l o s s ) p e r s h a r e :Income (loss) before cumulative effect of
accounting change $ 1.26 $ (0.38) $ (0.27)Cumulative effect of accounting change – – (1.50)
Net income (loss) $ 1.26 $ (0.38) $ (1.77)
D i l u t e d e a r n i n g s ( l o s s ) p e r s h a r e :Income (loss) before cumulative effect of
accounting change $ 1.25 $ (0.38) $ (0.27)Cumulative effect of accounting change – – (1.50)
Net income (loss) $ 1.25 $ (0.38) $ (1.77)
Weighted average shares outstanding – basic 445.6 441.9 467.3 Weighted average shares outstanding – diluted 449.1 441.9 467.3
See accompanying notes to consolidated financial statements.
C o n s o l i d a t e d S t a t e m e n t s o f O p e r a t i o n s

3 0 S A F E WAY I N C . 2 0 0 4 A N N U A L R E P O R T
Year-end Year-end(In millions) 2004 2003
A s s e t sCurrent assets:
Cash and equivalents $ 266.8 $ 174.8Receivables 339.0 383.2Merchandise inventories, net of LIFO reserve of $48.6 and $63.8 2,740.7 2,642.2 Prepaid expenses and other current assets 251.2 307.5
Total current assets 3,597.7 3,507.7
Property:Land 1,396.0 1,384.9Buildings 4,269.7 3,847.2Leasehold improvements 2,621.9 2,494.8Fixtures and equipment 5,981.3 5,539.8Property under capital leases 773.8 758.1
15,042.7 14,024.8Less accumulated depreciation and amortization (6,353.3) (5,619.0)
Total property, net 8,689.4 8,405.8
Goodwill 2,406.6 2,404.9Prepaid pension costs 321.0 418.7Investments in unconsolidated affiliates 187.6 191.8Other assets 175.1 167.8
Total assets $ 15,377.4 $ 15,096.7
C o n s o l i d a t e d B a l a n c e S h e e t sS A F E WAY I N C . A N D S U B S I D I A R I E S

Year-end Year-end(In millions, except per-share amounts) 2004 2003
L i a b i l i t i e s a n d S t o c k h o l d e r s ’ E q u i t yCurrent liabilities:
Current maturities of notes and debentures $ 596.9 $ 699.5Current obligations under capital leases 42.8 50.5Accounts payable 1,759.4 1,509.6 Accrued salaries and wages 426.4 406.0Income taxes 270.3 134.0Other accrued liabilities 696.3 664.7
Total current liabilities 3,792.1 3,464.3
Long-term debt:Notes and debentures 5,469.7 6,404.0Obligations under capital leases 654.0 668.3
Total long-term debt 6,123.7 7,072.3
Deferred income taxes 463.6 421.9Accrued claims and other liabilities 691.1 493.9
Total liabilities 11,070.5 11,452.4
Commitments and contingencies
Stockholders’ equity:Common stock: par value $0.01 per share; 1,500 shares authorized;
578.5 and 575.4 shares outstanding 5.8 5.8Additional paid-in capital 3,373.1 3,334.6Treasury stock at cost; 130.8 and 131.2 shares (3,879.7) (3,887.4)Deferred stock compensation (15.2) (14.0)Accumulated other comprehensive income 144.9 87.5Retained earnings 4,678.0 4,117.8
Total stockholders’ equity 4,306.9 3,644.3
Total liabilities and stockholders’ equity $ 15,377.4 $ 15,096.7
See accompanying notes to consolidated financial statements.
C o n s o l i d a t e d B a l a n c e S h e e t sS A F E WAY I N C . A N D S U B S I D I A R I E S
S A F E WAY I N C . 2 0 0 4 A N N U A L R E P O R T 3 1

3 2 S A F E WAY I N C . 2 0 0 4 A N N U A L R E P O R T
C o n s o l i d a t e d S t a t e m e n t s o f C a s h F l o w sS A F E WAY I N C . A N D S U B S I D I A R I E S
52 Weeks 53 Weeks 52 Weeks(In millions) 2004 2003 2002
O p e r a t i n g A c t i v i t i e s :Net income (loss) $ 560.2 $ (169.8) $ (828.1)
Cumulative effect of accounting change – – 700.0
Income (loss) before cumulative effect of accounting change 560.2 (169.8) (128.1)Reconciliation to net cash flow from operating activities:
Goodwill impairment charges – 729.1 1,288.0Property impairment charges 39.4 344.9 213.1Miscellaneous equity investment impairment charges – 10.6 –Depreciation and amortization 894.6 863.6 888.3Amortization of deferred finance costs 7.8 8.0 7.8Deferred income taxes (29.2) (77.9) 64.9LIFO income (15.2) (1.3) (17.6)Equity in (earnings) losses of unconsolidated affiliates (12.6) 7.1 0.2Net pension expense 112.9 130.9 30.3Contributions to pension plans (15.1) (12.1) (32.0)Restricted stock expense 4.5 0.2 –Other 2.2 – –Long-term accrued claims and other liabilities 118.1 52.7 11.0 Loss (gain) on property retirements 20.6 (13.4) 19.3Changes in working capital items:
Receivables 46.3 56.6 (39.9)Inventories at FIFO cost (61.9) 144.4 (107.7)Prepaid expenses and other current assets 50.9 (72.8) 55.6 Income taxes 218.1 21.5 (90.7)Payables and accruals 284.8 (412.7) (127.8)
Net cash flow from operating activities 2,226.4 1,609.6 2,034.7
I n v e s t i n g A c t i v i t i e s :Cash paid for property additions (1,212.5) (935.8) (1,467.4)Proceeds from sale of property 194.7 189.0 113.2 Other (52.5) (48.2) (41.5)
Net cash flow used by investing activities (1,070.3) (795.0) (1,395.7)

S A F E WAY I N C . 2 0 0 4 A N N U A L R E P O R T 3 3
52 Weeks 53 Weeks 52 Weeks(In millions) 2004 2003 2002
F i n a n c i n g A c t i v i t i e s :Additions to short-term borrowings $ 11.2 $ 2.6 $ 1.4 Payments on short-term borrowings (1.5) (3.1) (3.5)Additions to long-term borrowings 1,173.5 1,592.0 2,919.3 Payments on long-term borrowings (2,278.6) (2,331.0) (2,063.2)Purchase of treasury stock (0.4) – (1,502.6)Net proceeds from exercise of stock options 24.8 19.1 31.5 Other (6.6) (3.6) (14.2)
Net cash flow used by financing activities (1,077.6) (724.0) (631.3)
Effect of changes in exchange rates on cash 13.5 8.2 (0.2)
Increase in cash and equivalents 92.0 98.8 7.5
C a s h a n d E q u i v a l e n t s :Beginning of year 174.8 76.0 68.5
End of year $ 266.8 $ 174.8 $ 76.0
O t h e r C a s h I n f o r m a t i o n :Cash payments during the year for:
Interest $ 434.8 $ 464.2 $ 440.6 Income taxes, net of refunds 43.8 361.6 686.2
N o n c a s h I n v e s t i n g a n d F i n a n c i n g A c t i v i t i e s :Tax benefit from stock options exercised $ 17.4 $ 13.6 $ 29.2 Capital lease obligations entered into 35.9 113.2 174.9 Mortgage notes assumed in property additions 5.5 – 5.9
See accompanying notes to consolidated financial statements.
C o n s o l i d a t e d S t a t e m e n t s o f C a s h F l o w sS A F E WAY I N C . A N D S U B S I D I A R I E S

3 4 S A F E WAY I N C . 2 0 0 4 A N N U A L R E P O R T
C o n s o l i d a t e d S t a t e m e n t s o f S t o c k h o l d e r s ’ E q u i t yS A F E WAY I N C . A N D S U B S I D I A R I E S
AccumulatedAdditional Deferred Other Total
Common Stock Paid-in Treasury Stock Stock Retained Comprehensive Stockholders’ Comprehensive(In millions) Shares Amount Capital Shares Cost Compensation Earnings (Loss) Income Equity (Loss) Income
Balance, year-end 2001 570.8 $ 5.7 $ 3,267.1 (82.7) $ (2,419.6) – $ 5,115.7 $ (79.3) $ 5,889.6
Net loss – – – – – – (828.1) – (828.1) $(828.1)Translation adjustments – – – – – – – 10.3 10.3 10.3Other – – – – – – – 0.7 0.7 0.7Treasury stock purchased – – – (50.1) (1,502.9) – – – (1,502.9) –Options exercised 2.2 – 40.1 0.8 17.8 – – – 57.9 –
Balance, year-end 2002 573.0 5.7 3,307.2 (132.0) (3,904.7) – 4,287.6 (68.3) 3,627.5 $(817.1)
Net loss – – – – – – (169.8) – (169.8) $(169.8)Translation adjustments – – – – – – – 154.9 154.9 154.9Other – – – – – – – 0.9 0.9 0.9Restricted stock granted 0.7 – 14.2 – – (14.2) – – – –Amortization of restricted stock – – – – – 0.2 – – 0.2 –Options exercised 1.7 0.1 13.2 0.8 17.3 – – – 30.6 –
Balance, year-end 2003 575.4 5.8 3,334.6 (131.2) (3,887.4) (14.0) 4,117.8 87.5 3,644.3 $ (14.0)
Net income – – – – – – 560.2 – 560.2 $ 560.2Translation adjustments – – – – – – – 51.5 51.5 51.5Other – – – – – – – 5.9 5.9 5.9Restricted stock granted 0.3 – 5.7 – – (5.7) – – – –Amortization of restricted stock – – – – – 4.5 – – 4.5 –Treasury stock purchased – – – – (0.4) – – – (0.4) –Options exercised 2.8 – 32.8 0.4 8.1 – – – 40.9 –
Balance, year-end 2004 578.5 $ 5.8 $ 3,373.1 (130.8) $ (3,879.7) $ (15.2) $ 4,678.0 $ 144.9 $ 4,306.9 $ 617.6
See accompanying notes to consolidated financial statements.

N o t e A : T h e C o m p a n y a n d S i g n i f i c a n t A c c o u n t i n g P o l i c i e s
T H E C O M PA N Y Safeway Inc. (“Safeway” or the“Company”) is one of the largest food and drug retailers inNorth America, with 1,802 stores as of year-end 2004.Safeway’s U.S. retail operations are located principally inCalifornia, Oregon, Washington, Alaska, Colorado, Arizona,Texas, the Chicago metropolitan area and the Mid-Atlanticregion. The Company’s Canadian retail operations arelocated principally in British Columbia, Alberta andManitoba/Saskatchewan. In support of its retail operations,the Company has an extensive network of distribution,manufacturing and food processing facilities. The Companyalso has a 49% ownership interest in Casa Ley, S.A. de C.V.(“Casa Ley”), which operates 115 food and generalmerchandise stores in western Mexico. In addition, Safewayhas a strategic alliance with and a 54% ownership interestin GroceryWorks Holdings, Inc. (“GroceryWorks”), anInternet grocer.
B A S I S O F C O N S O L I D AT I O N The consolidated financialstatements include Safeway Inc., a Delaware corporation,and all majority-owned subsidiaries. All significantintercompany transactions and balances have beeneliminated in consolidation. The Company’s investment inCasa Ley is reported using the equity method and isrecorded on a one-month delay basis because financialinformation for the latest month is not available from CasaLey in time to be included in Safeway’s consolidated resultsuntil the following reporting period.
F I S C A L Y E A R The Company’s fiscal year ends on theSaturday nearest December 31. The last three fiscal yearsconsist of the 52-week period ended January 1, 2005, the53-week period ended January 3, 2004 and the 52-weekperiod ended December 28, 2002.
R E C L A S S I F I C AT I O N S Historically, Safeway has classifiedcertain minor revenue items such as partner gift card andvending machine income as a reduction of costs andexpenses. As the value of these items has grown, theCompany has determined that they are more appropriatelyclassified as other revenue in 2004. These items have beenreclassified for prior periods to conform to the 2004 presen-tation. These reclassifications had no effect on previouslyreported operating profit or net income (loss) and aresummarized as follows (in millions):
2004 2003 2002
Sales, before reclassifications $ 35,621.9 $ 35,552.7 $ 34,767.5Reclassifications 201.0 174.5 149.7
Sales and other revenue, as adjusted $ 35,822.9 $ 35,727.2 $ 34,917.2
Cost of goods sold, before reclassifications $(25,230.0) $(25,018.9) $(23,955.5)
Reclassifications 2.4 15.9 34.7
Cost of goods sold, as adjusted $(25,227.6) $(25,003.0) $(23,920.8)
Gross profit, before reclassifications $ 10,391.9 $ 10,533.8 $ 10,812.0
Reclassifications 203.4 190.4 184.4
Gross profit, as adjusted $ 10,595.3 $ 10,724.2 $ 10,996.4
Operating and administrative expense, before reclassifications $ (9,219.1) $ (9,230.8) $ (8,576.4)
Reclassifications (203.4) (190.4) (184.4)
Operating and administrative expense, as adjusted $ (9,422.5) $ (9,421.2) $ (8,760.8)
R E V E N U E R E C O G N I T I O N Revenue is recognized at thepoint of sale for retail sales. Discounts provided tocustomers in connection with loyalty cards are accountedfor as a reduction of sales.
C O S T O F G O O D S S O L D Cost of goods sold includes cost ofinventory sold during the period, including purchase anddistribution costs. These costs include inbound freight charges,purchasing and receiving costs, warehouse inspection costs,warehousing costs and other costs of Safeway’s distributionnetwork. Advertising and promotional expenses are alsoincluded as a component of cost of goods sold. Such costsare expensed in the period the advertisement occurs. Advertisingand promotional expenses totaled $487.8 million in 2004,$419.9 million in 2003 and $384.6 million in 2002.
Vendor allowances totaled $2.2 billion in 2004, 2003 and2002. Vendor allowances did not materially impact theCompany’s gross profit in 2004, 2003 and 2002 becauseSafeway spends the allowances received on pricingpromotions, advertising expenses and slotting expenses.Vendor allowances can be grouped into the following broadcategories: promotional allowances, slotting allowances,and contract allowances. All vendor allowances areclassified as an element of cost of goods sold.
S A F E WAY I N C . 2 0 0 4 A N N U A L R E P O R T 3 5
S A F E WAY I N C . A N D S U B S I D I A R I E S
N o t e s t o C o n s o l i d a t e d F i n a n c i a l S t a t e m e n t s
3 6 S A F E WAY I N C . 2 0 0 4 A N N U A L R E P O R T
S A F E WAY I N C . A N D S U B S I D I A R I E S
Promotional allowances make up nearly three-quarters ofall allowances. With promotional allowances, vendors paySafeway to promote their product. The promotion may be anycombination of a temporary price reduction, a feature in printads, a feature in a Safeway circular, or a preferred location inthe store. The promotions are typically one to two weeks long.
Slotting allowances are a small portion of total allowances(typically less than 5% of all allowances). With slottingallowances, the vendor reimburses Safeway for the cost of placing new product on the shelf. Safeway has noobligation or commitment to keep the product on the shelffor a minimum period.
Contract allowances make up the remainder of allallowances. Under a typical contract allowance, a vendorpays Safeway to keep product on the shelf for a minimumperiod of time or when volume thresholds are achieved.
Prior to the adoption of Emerging Issues Task Force(“EITF”) No. 02-16, slotting allowances were considered areimbursement of Safeway’s costs and recognized when theproduct was first stocked which is generally the point atwhich all the related expenses have been incurred. Promotionalallowances were recognized when the promotion ran.Beginning with the adoption of EITF No. 02-16 in the firstquarter of 2003, slotting and promotional allowances areaccounted for as a reduction in the cost of purchasedinventory and recognized when the related inventory is sold.Contract allowances are recognized as a reduction in thecost of goods sold as volume thresholds are achieved orthrough the passage of time.
U S E O F E S T I M AT E S The preparation of financialstatements in conformity with accounting principlesgenerally accepted in the United States of America requiresmanagement to make estimates and assumptions thataffect the reported amounts of assets and liabilities anddisclosure of contingent assets and liabilities at the date ofthe financial statements, and the reported amounts ofrevenues and expenses during the reporting period. Actualresults could differ from those estimates.
T R A N S L AT I O N O F F O R E I G N C U R R E N C I E S Assets andliabilities of the Company’s Canadian subsidiaries and CasaLey are translated into U.S. dollars at year-end rates ofexchange, and income and expenses are translated at averagerates during the year. Adjustments resulting from translatingfinancial statements into U.S. dollars are reported, net ofapplicable income taxes, as a separate component ofcomprehensive income in the consolidated statements ofstockholders’ equity.
C A S H A N D C A S H E Q U I VA L E N T S Short-term investmentswith original maturities of less than three months areconsidered to be cash equivalents.
M E R C H A N D I S E I N V E N T O R I E S Merchandise inventory of$1,943 million at year-end 2004 and $1,903 million at year-end 2003 is valued at the lower of cost on a last-in, first-out(“LIFO”) basis or market value. Such LIFO inventory had areplacement or current cost of $1,992 million at year-end 2004and $1,967 million at year-end 2003. Liquidations of LIFOlayers resulted in income of $2.3 million in 2004, expense of$1.9 million in 2003 and income of $5.3 million in 2002. Allremaining inventory is valued at the lower of cost on a first-in, first-out (“FIFO”) basis or market value. The FIFO cost ofinventory approximates replacement or current cost. Physicalinventories are taken on a cycle basis. The Company recordsan estimated inventory shrink adjustment for the periodbetween the last physical inventory and the balance sheet date.
P R O P E R T Y A N D D E P R E C I AT I O N Property is stated at cost.Depreciation expense on buildings and equipment is computedon the straight-line method using the following lives:
Stores and other buildings 7 to 40 yearsFixtures and equipment 3 to 15 years
Property under capital leases and leasehold improvementsare amortized on a straight-line basis over the shorter of theremaining terms of the lease or the estimated useful livesof the assets.
S E L F - I N S U R A N C E The Company is primarily self-insuredfor workers’ compensation, automobile and general liabilitycosts. The self-insurance liability is determined actuarially,based on claims filed and an estimate of claims incurred butnot yet reported, and is discounted using a risk-free rate ofinterest. The present value of such claims was calculatedusing a discount rate of 3.25% in 2004 and 3.0% in 2003.
A summary of changes in Safeway’s self-insuranceliability is as follows (in millions):
2004 2003 2002
Beginning balance $409.5 $340.6 $320.4Expense 247.4 235.2 166.5Claim payments (158.0) (166.3) (146.3)
Ending balance $498.9 $409.5 $340.6
Less: current portion (142.9) (124.7) (119.5)
Long-term portion $356.0 $284.8 $221.1

S A F E WAY I N C . 2 0 0 4 A N N U A L R E P O R T 3 7
S A F E WAY I N C . A N D S U B S I D I A R I E S
The current portion of the self-insurance liability isincluded in other accrued liabilities, and the long-termportion is included in accrued claims and other liabilities inthe consolidated balance sheets. The total undiscountedliability was $558.8 million at year-end 2004 and $451.4million at year-end 2003.
R E N T H O L I D AY S Certain of the Company’s operating leasescontain rent holidays. For these leases, the Companyrecognizes the related rent expense on a straight-line basis atthe earlier of the first rent payment or the date of possessionof the leased property. The difference between the amountscharged to expense and the rent paid is recorded as deferredlease incentives and amortized over the lease term.
C O N S T R U C T I O N A L L O WA N C E S As part of certain leaseagreements, the Company receives construction allowancesfrom landlords. The construction allowances are deferredand amortized on a straight-line basis over the life of thelease as a reduction to rent expense.
I N C O M E TA X E S The Company provides income tax expenseor benefit in accordance with Statement of FinancialAccounting Standards (“SFAS”) No. 109, “Accounting forIncome Taxes.” Deferred income taxes represent future nettax effects resulting from temporary differences betweenthe financial statement and tax basis of assets andliabilities using enacted tax rates in effect for the year inwhich the differences are expected to reverse.
O F F - B A L A N C E S H E E T F I N A N C I A L I N S T R U M E N T S TheCompany has, from time to time, entered into interest rateswap agreements to change its portfolio mix of fixed andfloating-rate debt to more desirable levels. Interest rate swapagreements involve the exchange with a counterparty offixed and floating-rate interest payments periodically overthe life of the agreements without exchange of the underlyingnotional principal amounts. The differential to be paid orreceived is recognized over the life of the agreements as anadjustment to interest expense. The Company’s counter-parties have been major financial institutions.
FA I R VA L U E O F F I N A N C I A L I N S T R U M E N T S Generallyaccepted accounting principles require the disclosure of thefair value of certain financial instruments, whether or notrecognized in the balance sheet, for which it is practicableto estimate fair value. Safeway estimated the fair valuespresented below using appropriate valuation methodologies
and market information available as of year-end. Considerablejudgment is required to develop estimates of fair value, andthe estimates presented are not necessarily indicative ofthe amounts that the Company could realize in a currentmarket exchange. The use of different market assumptionsor estimation methodologies could have a material effect onthe estimated fair values. Additionally, these fair valueswere estimated at year-end, and current estimates of fairvalue may differ significantly from the amounts presented.
The following methods and assumptions were used toestimate the fair value of each class of financial instruments:
Cash and equivalents, accounts receivable, accounts payableand short-term debt. The carrying amount of these itemsapproximates fair value.
Long-term debt. Market values quoted on the New York StockExchange are used to estimate the fair value of publiclytraded debt. To estimate the fair value of debt issues thatare not quoted on an exchange, the Company uses thoseinterest rates that are currently available to it for issuanceof debt with similar terms and remaining maturities. Atyear-end 2004, the estimated fair value of debt was $6.4billion compared to a carrying value of $6.1 billion. At year-end 2003, the estimated fair value of debt was $7.5 billioncompared to a carrying value of $7.1 billion.
Off-balance-sheet instruments. The fair value of interestrate swap agreements are the amounts at which they couldbe settled based on estimates obtained from dealers. Thenet unrealized gain on such agreements was $6.1 million atyear-end 2004.
S T O R E C L O S I N G A N D I M PA I R M E N T C H A R G E S Safewayregularly reviews its stores’ operating performance andassesses the Company’s plans for certain store and plantclosures. In accordance with SFAS No. 144, “Accounting forthe Impairment or Disposal of Long-Lived Assets,” lossesrelated to the impairment of long-lived assets are recognizedwhen expected future cash flows are less than the asset’scarrying value. At the time a store is closed or because ofchanges in circumstances that indicate the carrying value ofan asset may not be recoverable, the Company evaluatesthe carrying value of the assets in relation to its expectedfuture cash flows. If the carrying value is greater than thefuture cash flows, a provision is made for the impairment ofthe assets to write the assets down to estimated fair value.

S A F E WAY I N C . A N D S U B S I D I A R I E S
Fair value is determined by estimating net future cash flows,discounted using a risk-adjusted rate of return. The Companycalculates impairment on a store-by-store basis. Theseprovisions are recorded as a component of operating andadministrative expense and are disclosed in Note C.
For stores to be closed that are under long-term leases,the Company records a liability for the future minimum leasepayments and related ancillary costs, from the date of closureto the end of the remaining lease term, net of estimatedcost recoveries that may be achieved through sublettingproperties or through favorable lease terminations, discountedusing a risk-adjusted rate of interest. This liability isrecorded at the time the store is closed. Activity included inthe reserve for store lease exit costs is disclosed in Note C.
S T O C K - B A S E D C O M P E N S AT I O N Safeway accounts forstock-based awards to employees using the intrinsic valuemethod in accordance with Accounting Principles BoardOpinion (“APB”) No. 25, “Accounting for Stock Issued toEmployees.” The following table illustrates the effect on netincome (loss) and earnings (loss) per share if the Companyhad applied the fair value recognition provisions of SFASNo. 123, as amended by SFAS No. 148:
(In millions, except per-share amounts) 2004 2003 2002
Net income (loss) – as reported $560.2 $(169.8) $(828.1)Add:
Stock-based employee compensation expense included in reported net income, net of related tax effects 2.8 0.1 –
Less:Total stock-based employee compensation expense determined under fair value based method for all awards, net of related tax effects (47.6) (51.2) (49.6)
Net income (loss) – pro forma $515.4 $(220.9) $(877.7)
Basic earnings (loss) per share:As reported $1.26 $(0.38) $(1.77)Pro forma 1.16 (0.50) (1.88)
Diluted earnings (loss) per share:As reported $1.25 $(0.38) $(1.77)Pro forma 1.15 (0.50) (1.88)
N E W A C C O U N T I N G S TA N D A R D S In December 2003, theFASB revised SFAS No. 132, “Employer’s Disclosures aboutPensions and Other Postretirement Benefits.” This revisedstatement requires new annual disclosures about the typesof plan assets, investment strategy, measurement date, planobligations and cash flows as well as components of the
net periodic benefit cost recognized in interim periods. Thenew annual disclosure requirements apply to fiscal yearsending after December 15, 2003, except for the disclosureof expected future benefit payment, which must bedisclosed for fiscal years ending after June 15, 2004.Interim period disclosures are generally effective for interimperiods beginning after December 15, 2003. The Companyhas included the disclosures required by SFAS No. 132 in itsfinancial statements for the year ended January 1, 2005.
In January 2004, the FASB issued SFAS No. 106-1,“Accounting and Disclosure Requirements Related to theMedicare Prescription Drug, Improvement and ModernizationAct of 2003.” This statement permits a sponsor to make aone-time election to defer accounting for the effects of theMedicare Prescription Drug, Improvement and ModernizationAct of 2003, or the Prescription Drug Act. The PrescriptionDrug Act, signed into law in December 2003, establishes aprescription drug benefit under Medicare (Medicare Part D)and a federal subsidy to sponsors of retiree health carebenefit plans that provide a benefit that is at least actuariallyequivalent to Medicare Part D. SFAS No. 106-1 does notprovide specific guidance as to whether a sponsor shouldrecognize the effects of the Prescription Drug Act in itsfinancial statements. The Prescription Drug Act introducestwo new features to Medicare that must be considered whenmeasuring accumulated postretirement benefit costs. Thenew features include a subsidy to the plan sponsors that isbased on 28% of an individual beneficiary’s annualprescription drug costs between $250 and $5,000 and anopportunity for a retiree to obtain a prescription drug benefitunder Medicare. The Prescription Drug Act is not expected toreduce Safeway’s net postretirement benefit costs.
Safeway has elected to defer adoption of SFAS No. 106-1due to the lack of specific guidance. Therefore, the netpostretirement benefit costs disclosed in the Company’sfinancial statements do not reflect the impacts of thePrescription Drug Act on the plans. The deferral will continueto apply until specific authoritative accounting guidance forthe federal subsidy is issued. Authoritative guidance on theaccounting for the federal subsidy is pending and, whenissued, could require information previously reported in theCompany’s financial statements to change. Safeway iscurrently investigating the impacts of SFAS No. 106-1’sinitial recognition, measurement and disclosure provisionson its financial statements.
3 8 S A F E WAY I N C . 2 0 0 4 A N N U A L R E P O R T

In December 2004, the FASB issued FASB Staff PositionSFAS No. 109-2, “Accounting Disclosure Guidance for theForeign Earnings Repatriation Provision within the AmericanJobs Creation Act of 2004,” which provides accounting anddisclosure guidance for the repatriation provisions of theAmerican Jobs Creation Act of 2004 (the “Act”). The Actprovides for a special one-time tax deduction of certainearnings repatriated in 2005. The Company is evaluatingwhether to take advantage of this provision with respect toits Canadian subsidiary, and expects to complete theevaluation by the fourth quarter of 2005. The Companyanticipates that it could repatriate between zero and $734million, and that the tax cost of the repatriation would bebetween zero and $75 million.
In December 2004, the FASB issued FASB Staff PositionSFAS No. 109-1, “Application of FASB Statement No. 109,Accounting for Income Taxes, to the Tax Deduction onQualified Production Activities Provided by the AmericanJobs Creation Act of 2004,” which provides accounting anddisclosure guidance on the Act’s qualified productionactivities deduction. The Company is currently evaluatingthe impact of this guidance on its effective tax rate for 2005and subsequent periods.
In December 2004, the FASB issued SFAS No. 123(Revised 2004), “Share-Based Payment” (“SFAS No. 123R”),which replaces SFAS No. 123, supersedes APB 25 andrelated interpretations and amends SFAS No. 95,“Statement of Cash Flows.” The provisions of SFAS No. 123Rare similar to those of SFAS No. 123; however, SFAS No.123R requires all share-based payments to employees,including grants of employee stock options, to be recognizedin the financial statements as compensation cost based ontheir fair value on the date of grant. Fair value of share-based awards will be determined using option-pricing
S A F E WAY I N C . 2 0 0 4 A N N U A L R E P O R T 3 9
S A F E WAY I N C . A N D S U B S I D I A R I E S
N o t e B : G o o d w i l lA summary of changes in Safeway’s goodwill during 2004 and 2003 by geographic area is as follows:
(In millions) 2004 2003
U.S. Canada Total U.S. Canada Total
Balance – beginning of the year $2,328.3 $76.6 $2,404.9 $3,062.9 $62.8 $3,125.7Impairment charges – – – (729.1) – (729.1)Other adjustments (2.7) (1) 4.4 (2) 1.7 (5.5) (1) 13.8(2) 8.3
Balance – end of year $2,325.6 $81.0 $2,406.6 $2,328.3 $76.6 $2,404.9
(1) Primarily represents revised estimate of pre-acquisition tax accrual.(2) Represents foreign currency translation adjustments in Canada.
models (e.g. Black-Scholes or binomial models) andassumptions that appropriately reflect the specific circum-stances of the awards. Compensation cost will berecognized over the vesting period based on the fair valueof awards that actually vest.
The Company will be required to choose between themodified-prospective and modified-retrospective transitionalternatives in adopting SFAS No. 123R. Under the modified-prospective-transition method, compensation cost will berecognized in financial statements issued subsequent to thedate of adoption for all shared-based payments granted,modified or settled after the date of adoption, as well as forany unvested awards that were granted prior to the date ofadoption. Under the modified-retrospective-transition method,prior period financial statements will also be restated byrecognizing compensation cost as previously reported in the proforma disclosures under SFAS No. 123. The restatementprovisions can be applied to either a) all periods presented or b)to the beginning of the fiscal year in which SFAS No. 123R isadopted. As the Company previously adopted only the proforma disclosure provisions of SFAS No. 123, Safeway willrecognize compensation cost relating to the unvested portion ofawards granted prior to the date of adoption using the sameestimate of the grant-date fair value and the same attributionmethod used to determine the pro forma disclosures underSFAS No. 123.
SFAS No. 123R is effective at the beginning of the firstinterim or annual period beginning after June 15, 2005, andearly adoption is encouraged. Safeway has elected to earlyadopt this pronouncement beginning in the first quarter of2005. The Company is in the process of evaluating the useof certain option-pricing models as well as the assumptionsto be used in such models. When that evaluation is complete,Safeway will select a transition method.

4 0 S A F E WAY I N C . 2 0 0 4 A N N U A L R E P O R T
S A F E WAY I N C . A N D S U B S I D I A R I E S
The Company adopted SFAS No. 142, “Goodwill andOther Intangible Assets,” on December 30, 2001. Under thetransitional provisions of SFAS No. 142, the Company’sgoodwill was tested for impairment as of December 30,2001. Each of the Company’s reporting units were tested forimpairment by comparing the fair value of each reportingunit with its carrying value. Fair value was determinedbased on a valuation study performed by an independentthird party who primarily considered the discounted cashflow, guideline company and similar transaction methods.As a result of the Company’s impairment test, the Companyrecorded an impairment loss to reduce the carrying value ofgoodwill at Dominick’s by $589.0 million and Randall’s by$111.0 million to its implied fair value. Impairment in bothcases was due to a combination of factors includingacquisition price, post-acquisition capital expenditures andoperating performance. In accordance with SFAS No. 142,the impairment charge was reflected as a cumulative effectof accounting change in the Company’s statement ofoperations.
As required by SFAS No. 142, Safeway tested goodwillfor impairment again in the fourth quarter of 2002, whichrepresents the annual impairment testing date selected bySafeway. Fair value was determined based on a valuationstudy performed by an independent third party whichprimarily considered the discounted cash flow and guidelinecompany method. As a result of this annual review, Safewayrecorded an impairment charge for Dominick’s goodwill of$583.8 million and for Randall’s goodwill of $704.2 million.These additional charges reflect declining multiples in theretail grocery industry and operating performance.
Also in the fourth quarter of 2003, Safeway performedits annual review of goodwill. Fair value was determinedbased on a valuation study performed by an independentthird party which primarily considered the discounted cashflow and guideline company method. As a result of thisannual review, Safeway recorded an impairment charge forRandall’s goodwill of $447.7 million. The additional chargesreflect declining multiples in the retail grocery industry andoperating performance. There was no remaining goodwillfor Dominick’s or Randall’s on Safeway’s consolidatedbalance sheet at year-end 2003.
Safeway completed its annual impairment test in thefourth quarter of 2004. Fair value was determined based ona valuation study performed by an independent third partywhich primarily considered the discounted cash flow andguideline company method. As a result of this annual review,Safeway concluded that no impairment charge was required.
N o t e C : S t o r e C l o s i n g a n d I m p a i r m e n t C h a r g e s
I M PA I R M E N T W R I T E - D O W N S Safeway recognizedimpairment charges on the write-down of long-lived assetsof $39.4 million in 2004, $344.9 million in 2003 and $213.1million in 2002. This includes Dominick’s impairmentcharges of $311.4 million in 2003 and $201.3 million in2002. These charges are included as a component ofoperating and administrative expense.
In November 2002, Safeway announced the decision tosell Dominick’s and exit the Chicago market due to laborissues. In accordance with SFAS No. 144, Safeway recordeda pre-tax charge for the impairment of long-lived assets of$201.3 million in the fourth quarter of 2002 to adjustDominick’s to its estimated fair market value less cost to sell.
In the first 36 weeks of 2003, Safeway reduced thecarrying value of Dominick’s in part by writing down anadditional $120.7 million of long-lived assets, based onindications of value received during the sale process. InNovember 2003, Safeway announced that it was takingDominick’s off the market. Safeway reclassified Dominick’sfrom an “asset held for sale” to “asset held and used” andadjusted Dominick’s individual long-lived assets to thelower of cost or fair value. As a result, in the fourth quarterof 2003, Safeway incurred a pre-tax, long-lived assetimpairment charge of $190.7 million.
S T O R E L E A S E E X I T C O S T S The reserve for store leaseexit costs includes the following activity for 2004, 2003 and2002 (in millions):
2004 2003 2002
Beginning balance $129.1 $132.1 $132.4 Provision for estimated
net future cash flows of additional closed stores(1) 55.1 3.7 30.6
Net cash flows, interest accretion, changes in estimates of net future cash flows (17.1) (6.7) (30.9)
Ending balance $167.1 $129.1 $132.1
(1) Estimated net future cash flows represents future minimum lease payments andrelated ancillary costs from the date of closure to the end of the remaining lease term, net of estimated cost recoveries that may be achieved through sublettingproperties or through favorable lease terminations.

S A F E WAY I N C . 2 0 0 4 A N N U A L R E P O R T 4 1
S A F E WAY I N C . A N D S U B S I D I A R I E S
Store lease exit costs are included as a component ofoperating and administrative expense and the liability isincluded in accrued claims and other liabilities.
Store lease exit costs related to the Furr’s and Homelandbankruptcies are not included above but are discussed inNote L.
N o t e D : F i n a n c i n gNotes and debentures were composed of the following atyear-end (in millions):
2004 2003
Commercial paper $ 105.0 $1,210.6Bank credit agreement, unsecured – –Other bank borrowings, unsecured 18.2 8.0Mortgage notes payable, secured 26.1 33.79.30% Senior Secured Debentures due 2007 24.3 24.36.85% Senior Notes due 2004, unsecured – 200.07.25% Senior Notes due 2004, unsecured – 400.02.50% Senior Notes due 2005, unsecured 200.0 200.0Floating Rate Senior Notes due 2005, unsecured 150.0 150.03.80% Senior Notes due 2005, unsecured 225.0 225.06.15% Senior Notes due 2006, unsecured 700.0 700.04.80% Senior Notes due 2007, unsecured 480.0 480.07.00% Senior Notes due 2007, unsecured 250.0 250.04.125% Senior Notes due 2008, unsecured 300.0 300.06.50% Senior Notes due 2008, unsecured 250.0 250.07.50% Senior Notes due 2009, unsecured 500.0 500.04.95% Senior Notes due 2010, unsecured 500.0 –6.50% Senior Notes due 2011, unsecured 500.0 500.05.80% Senior Notes due 2012, unsecured 800.0 800.05.625% Senior Notes due 2014, unsecured 250.0 –7.45% Senior Debentures due 2027, unsecured 150.0 150.07.25% Senior Debentures due 2031, unsecured 600.0 600.09.65% Senior Subordinated Debentures
due 2004, unsecured – 81.29.875% Senior Subordinated Debentures
due 2007, unsecured 24.2 24.2Other notes payable, unsecured 13.8 16.5
6,066.6 7,103.5Less current maturities (596.9) (699.5)
Long-term portion $5,469.7 $6,404.0
C O M M E R C I A L PA P E R The amount of commercial paperborrowings is limited to the unused borrowing capacity underthe bank credit agreement. Commercial paper is classified aslong-term because the Company intends to and has the abilityto refinance these borrowings on a long-term basis througheither continued commercial paper borrowings or utilization of thebank credit agreement, which matures in 2006. The weightedaverage interest rate on commercial paper borrowings was1.22% during 2004 and 2.28% at year-end 2004.
B A N K C R E D I T A G R E E M E N T Safeway’s total borrowingcapacity under the bank credit agreement is $2.4 billion. Ofthe $2.4 billion credit line, $1.25 billion matures in 2006 andhas a one-year extension option requiring lender consent.Another $1.15 billion is renewable annually through 2006and can be extended by the Company for an additional yearthrough a term-loan conversion feature or through a one-yearextension option requiring lender consent. The restrictivecovenants of the bank credit agreement limit Safeway withrespect to, among other things, creating liens upon its assetsand disposing of material amounts of assets other than inthe ordinary course of business. Safeway is also required tomaintain a minimum Adjusted EBITDA to interest expenseratio of 2.0 to 1 and not exceed a total debt to AdjustedEBITDA ratio of 4.0 to 1. As part of the second amendmentto the bank credit agreement dated May 20, 2004, the Debtto Adjusted EBITDA ratio was temporarily increased to 4.0to 1 from 3.5 to 1 for a period of one year. At year-end2004, the Company had total unused borrowing capacityunder the bank credit agreement of $2.25 billion.
U.S. borrowings under the bank credit agreement carryinterest at one of the following rates selected by the Company:(i) the prime rate; (ii) a rate based on rates at which Eurodollardeposits are offered to first-class banks by the lenders in thebank credit agreement plus a pricing margin based on theCompany’s debt rating or interest coverage ratio (the “PricingMargin”); or (iii) rates quoted at the discretion of the lenders.Canadian borrowings denominated in U.S. dollars carryinterest at one of the following rates selected by theCompany: (a) the Canadian base rate or (b) the CanadianEurodollar rate plus the Pricing Margin. Canadian borrowingsdenominated in Canadian dollars carry interest at one of thefollowing rates selected by the Company: (i) the Canadianprime rate or (ii) the rate for Canadian bankers acceptancesplus the Pricing Margin.
During 2004, the Company had no outstanding borrowingunder its bank revolving credit agreement. During the year,the Company paid facility fees ranging from 0.08% to 0.145%on the total amount of the credit facility.
O T H E R B A N K B O R R O W I N G S Other bank borrowings atyear-end 2004 have remaining terms ranging from two daysto two years and a weighted average interest rate of 4.0%.

S A F E WAY I N C . A N D S U B S I D I A R I E S
M O R T G A G E N O T E S PAYA B L E Mortgage notes payable atyear-end 2004 have remaining terms ranging from one to 19 years, have a weighted average interest rate of 8.28%and are secured by properties with a net book value ofapproximately $160.2 million.
S E N I O R S E C U R E D I N D E B T E D N E S S The 9.30% SeniorSecured Debentures due 2007 are secured by a deed of trustthat created a lien on the land, buildings and equipment ownedby Safeway at its distribution center in Tracy, California.
S E N I O R U N S E C U R E D I N D E B T E D N E S S In August 2004,Safeway issued senior unsecured debt securities consistingof $500.0 million of 4.95% Notes due 2010 and $250.0million of 5.625% Notes due 2014.
In October 2003, Safeway issued senior unsecured debtfacilities consisting of $150.0 million of Floating Rate Notes(LIBOR plus 0.47%) due 2005, $200.0 million of 2.50% Notesdue 2005 and $300.0 million of 4.125% Notes due 2008.
S E N I O R S U B O R D I N AT E D I N D E B T E D N E S S The 9.875%Senior Subordinated Debentures due 2007 are subordinatedin right of payment to, among other things, the Company’sborrowings under the bank credit agreement, the 9.30%Senior Secured Debentures, the Senior UnsecuredIndebtedness and mortgage notes payable.
O T H E R N O T E S PAYA B L E Other notes payable at year-end2004 have remaining terms ranging from one to 18 yearsand a weighted average interest rate of 1.58%.
A N N U A L D E B T M AT U R I T I E S As of year-end 2004, annualdebt maturities were as follows (in millions):
2005 $ 596.92006 818.72007 785.22008 553.72009 502.2Thereafter 2,809.9
$6,066.6
L E T T E R S O F C R E D I T The Company had letters of credit of$79.0 million outstanding at year-end 2004, of which $41.8million were issued under the bank credit agreement. Theletters of credit are maintained primarily to supportperformance, payment, deposit or surety obligations of theCompany. The Company pays commissions ranging from0.15% to 1.00% on the face amount of the letters of credit.
N o t e E : L e a s e O b l i g a t i o n sApproximately two-thirds of the premises that the Companyoccupies are leased. The Company had approximately 1,600leases at year-end 2004, including approximately 230 thatare capitalized for financial reporting purposes. Most leaseshave renewal options, some with terms and conditionssimilar to the original lease, others with reduced rentalrates during the option periods. Certain of these leasescontain options to purchase the property at amounts thatapproximate fair market value.
As of year-end 2004, future minimum rental paymentsapplicable to non-cancelable capital and operating leaseswith remaining terms in excess of one year were as follows(in millions):
Capital OperatingLeases Leases
2005 $ 111.6 $ 405.92006 105.5 396.82007 102.4 380.92008 99.0 362.52009 96.0 328.3Thereafter 902.1 2,778.6
Total minimum lease payments 1,416.6 $4,653.0
Less amounts representing interest (719.8)
Present value of net minimum lease payments 696.8Less current obligations (42.8)
Long-term obligations $ 654.0
Future minimum lease payments under non-cancelablecapital and operating lease agreements have not beenreduced by minimum sublease rental income of $161.5 million.
Amortization expense for property under capital leaseswas $43.4 million in 2004, $35.4 million in 2003 and $42.4million in 2002. Accumulated amortization of property undercapital leases was $230.9 million at year-end 2004 and$181.6 million at year-end 2003.
The following schedule shows the composition of totalrental expense for all operating leases (in millions). In general,contingent rentals are based on individual store sales.
2004 2003 2002
Property leases:Minimum rentals $406.9 $411.4 $388.7Contingent rentals 20.7 25.6 17.0Less rentals from subleases (28.1) (31.4) (31.3)
399.5 405.6 374.4Equipment leases 24.1 25.2 25.6
$423.6 $430.8 $400.0
4 2 S A F E WAY I N C . 2 0 0 4 A N N U A L R E P O R T

S A F E WAY I N C . A N D S U B S I D I A R I E S
S A F E WAY I N C . 2 0 0 4 A N N U A L R E P O R T 4 3
N o t e F : I n t e r e s t E x p e n s eInterest expense consisted of the following (in millions):
2004 2003 2002
Commercial paper $ 7.8 $ 16.4 $ 32.0Bank credit agreement 4.0 3.5 3.1Other bank borrowings 0.4 0.4 –Mortgage notes payable 2.4 3.3 4.29.30% Senior Secured Debentures 2.3 2.3 2.310% Senior Notes – – 0.57.00% Senior Notes – – 29.43.625% Senior Notes – 12.3 14.56.05% Senior Notes – 18.3 21.26.85% Senior Notes 9.8 13.7 13.77.25% Senior Notes 20.3 29.0 29.02.50% Senior Notes 5.0 0.9 –Floating Rate Senior Notes 2.9 0.4 –3.80% Senior Notes 8.6 8.6 3.36.15% Senior Notes 43.1 43.1 43.14.80% Senior Notes 23.0 23.0 10.57.00% Senior Notes 17.5 17.5 17.54.125% Senior Notes 12.4 2.3 –6.50% Senior Notes 16.3 16.3 16.37.50% Senior Notes 37.5 37.5 37.54.95% Senior Notes 9.7 – –6.50% Senior Notes 32.5 32.5 32.55.80% Senior Notes 46.4 46.4 17.75.625% Senior Notes 5.5 – –7.45% Senior Debentures 11.2 11.2 11.27.25% Senior Debentures 43.5 43.5 43.59.65% Senior Subordinated
Debentures 0.2 7.8 7.89.875% Senior Subordinated
Debentures 2.4 2.4 2.4Other notes payable 0.7 0.7 1.8Medium-term notes – 0.4 1.4Obligations under capital leases 66.0 63.1 57.0Amortization of deferred
finance costs 7.8 8.0 7.8Interest rate swap agreements (8.3) (0.5) 0.6Capitalized interest (19.7) (21.9) (31.0)
$411.2 $442.4 $430.8
The Company effectively converted $500 million of its4.95% fixed-rate debt to floating rate debt through an interestswap agreement in 2004. In 2003, the Company effectivelyconverted $300.0 million of its 4.125% fixed-rate debt tofloating rate debt through an interest rate swap agreement.
N o t e G : C a p i t a l S t o c k
S H A R E S A U T H O R I Z E D A N D I S S U E D Authorized preferredstock consists of 25 million shares, of which none wasoutstanding during 2004, 2003 or 2002. Authorized commonstock consists of 1.5 billion shares at $0.01 par value.Common stock outstanding at year-end 2004 was 447.7million shares (net of 130.8 million shares of treasury stock)
and 444.2 million shares at year-end 2003 (net of 131.2million shares of treasury stock).
S T O C K O P T I O N P L A N S Under Safeway’s stock optionplans, the Company may grant incentive and non-qualifiedoptions to purchase common stock at an exercise price equalto or greater than the fair market value at the grant date, asdetermined by the Compensation and Stock Option Committeeof the Board of Directors. Options generally vest over five orseven years. Vested options are exercisable in part or in fullat any time prior to the expiration date of 10 to 15 yearsfrom the date of the grant. Options to purchase 24.4 millionshares were available for grant at year-end 2004.
On July 31, 2002, the Board of Directors adopted the2002 Equity Incentive Plan of Safeway Inc. (the “2002 Plan”),under which awards of non-qualified stock options and stock-based awards may be made. There are 2.0 million shares ofcommon stock authorized for issuance pursuant to grantsunder the 2002 plan. As of year-end 2004, no options havebeen granted under this plan.
In September 2004, Safeway initiated a voluntaryexchange program for stock options and stock rights having an exercise price greater than $35.00 to eligible employees.The Company’s executive officers, members of the Board of Directors and former employees were not eligible toparticipate. The exchange program ended on October 5, 2004and approximately 9.7 million stock options and rights weresurrendered and cancelled. Replacement stock options andreplacement stock rights totaling approximately 4.5 millionwill be issued on or after April 7, 2005 at the fair marketvalue on the date of the grant to those eligible employees stillemployed at the date of issuance. Such replacement stockoptions will have a six year term and will vest over five years.
R E S T R I C T E D S T O C K The Company awarded 263,135 sharesof restricted stock in 2004 and 706,236 shares of restrictedstock in 2003 to certain officers and key employees. Norestricted stock awards were granted in 2002. These sharesvest over a period of between three to four years and aresubject to certain transfer restrictions and forfeiture prior tovesting. Deferred stock compensation, representing the fairvalue of the stock at the measurement date of the award, isamortized to compensation expense over the vesting period.The amortization of this restricted stock resulted in $4.5million in compensation expense in 2004 and $0.2 million incompensation expense in 2003. As of January 1, 2005,176,554 restricted shares were vested, 792,817 restrictedshares were unvested and 22,730 shares have been returned toSafeway to satisfy tax withholding obligations of employees.

4 4 S A F E WAY I N C . 2 0 0 4 A N N U A L R E P O R T
S A F E WAY I N C . A N D S U B S I D I A R I E S
The following table summarizes stock option information at year-end 2004:
Options Outstanding Options Exercisable
Range of Number Weighted-Average Weighted-Average Number Weighted-AverageExercise Prices of Options Remaining Contractual Life Exercise Price of Options Exercise Price
$ 1.57 to $ 2.81 2,606,969 3.10 years $ 2.75 2,606,969 $ 2.753.00 to 8.87 1,869,411 1.53 4.35 1,869,411 4.358.88 to 19.60 1,794,717 3.53 14.66 1,329,407 13.09
19.76 to 19.99 3,993,710 5.58 19.96 97,452 19.7620.00 to 22.78 3,263,653 5.67 20.90 419,918 20.2522.83 to 27.15 3,565,683 5.95 25.22 1,927,525 25.3027.40 to 40.94 2,900,344 5.06 33.57 1,971,445 33.9841.00 to 50.31 3,925,251 5.28 44.26 2,763,507 43.9850.44 to 62.50 2,894,823 5.89 54.22 2,232,739 53.97
1.57 to 62.50 26,814,561 4.92 26.37 15,218,373 26.35
Activity in the Company’s stock option plans for the three-year period ended January 1, 2005 was as follows:
Weighted AverageOptions Exercise Price
Outstanding, year-end 2001 38,646,881 $29.61
2002 Activity:Granted 5,044,297 39.57Canceled (2,727,671) 39.08Exercised (3,019,997) 10.64
Outstanding, year-end 2002 37,943,510 31.70
2003 Activity:Granted 4,230,118 21.87Canceled (3,355,444) 38.42Exercised (2,511,557) 6.85
Outstanding, year-end 2003 36,306,627 31.51
2004 Activity:Granted 5,871,639 20.60Canceled (12,167,123) 44.07Exercised (3,196,582) 6.78
Outstanding, year-end 2004 26,814,561 26.37
Exercisable, year-end 2002 19,960,460 20.60
Exercisable, year-end 2003 21,697,133 27.24
Exercisable, year-end 2004 15,218,373 26.35
Weighted average fair value of options granted during the year:2002 $18.462003 9.642004 8.57

S A F E WAY I N C . 2 0 0 4 A N N U A L R E P O R T 4 5
S A F E WAY I N C . A N D S U B S I D I A R I E S
A D D I T I O N A L S T O C K P L A N I N F O R M AT I O N The Companyaccounts for its stock-based awards using the intrinsicvalue method in accordance with Accounting PrinciplesBoard Opinion No. 25, “Accounting for Stock Issued toEmployees,” and its related interpretations. Accordingly, nocompensation expense has been recognized in the financialstatements for employee stock option awards granted atfair market value.
SFAS No. 123, “Accounting for Stock-BasedCompensation,” as amended by SFAS No. 148, requires thedisclosure of pro forma net income and earnings per shareas if the Company had adopted the fair value method as ofthe beginning of fiscal 1995. Under SFAS No. 123, the fairvalue of stock-based awards to employees is calculatedthrough the use of option pricing models, even though suchmodels were developed to estimate the fair value of freelytradable, fully transferable options without vestingrestrictions, which significantly differ from the Company’sstock option awards. These models also require subjectiveassumptions, including future stock price volatility andexpected time to exercise, which greatly affect thecalculated values. The Company’s calculations were madeusing the Black-Scholes option pricing model with thefollowing weighted average assumptions: five to sevenyears expected life; stock volatility of 34.8% in 2004, 37.0%in 2003 and 36.0% in 2002; risk-free interest rates of 3.97%in 2004, 3.53% in 2003 and 4.35% in 2002; and nodividends during the expected term.
The Company’s calculations are based on a single-optionvaluation approach and forfeitures are recognized as theyoccur. However, the impact of outstanding unvested stockoptions granted prior to 1995 has been excluded from thepro forma calculation; accordingly, the pro forma resultspresented are not indicative of future period pro formaresults. Had compensation cost for Safeway’s stock optionplans been determined based on the fair value at the grantdate for awards from 1996 through 2002, consistent withthe provisions of SFAS No. 123, the Company’s net incomeand earnings per share would have been reduced to the proforma amounts disclosed in Note A.
N o t e H : Ta x e s o n I n c o m eThe components of income tax expense are as follows (in millions):
2004 2003 2002
Current:Federal $153.5 $251.5 $470.0State 25.7 51.8 63.6Foreign 83.7 85.5 61.9
262.9 388.8 595.5
Deferred:Federal (17.4) (48.5) 81.6State (10.6) (24.5) (15.1)Foreign (1.2) (4.9) (1.6)
(29.2) (77.9) 64.9
$233.7 $310.9 $660.4
Reconciliation of the provision for income taxes at theU.S. federal statutory income tax rate to the Company’sincome taxes is as follows (dollars in millions):
2004 2003 2002
Statutory rate 35% 35% 35%Income tax expense using
federal statutory rate $277.9 $ 49.4 $186.3State taxes on income net
of federal benefit 9.8 17.7 31.5Nondeductible goodwill
impairment – 255.2 450.8Equity earnings of foreign
affiliates (1.5) 7.0 (2.7)Charitable donations of inventory (9.8) (8.5) (7.4)Affiliate’s losses not currently
benefitted 3.3 4.1 18.4Tax settlements (40.0) (6.2) (19.2)Other (6.0) (7.8) 2.7
$233.7 $310.9 $660.4
Significant components of the Company’s net deferredtax liability at year-end were as follows (in millions):
2004 2003
Deferred tax assets:Workers’ compensation and other claims $ 201.1 $ 166.5Reserves not currently deductible 95.1 66.3Accrued claims and other liabilities 34.1 38.6Employee benefits 56.7 24.6Charitable contribution carryforwards 29.0 –Operating loss carryforwards 74.4 66.3Other assets 56.5 108.4
546.9 470.7
Valuation allowance (74.4) (66.3)
$ 472.5 $ 404.4
S A F E WAY I N C . A N D S U B S I D I A R I E S
4 6 S A F E WAY I N C . 2 0 0 4 A N N U A L R E P O R T
2004 2003
Deferred tax liabilities:Property $(514.6) $(440.4)Prepaid pension costs (121.1) (176.5)Inventory (193.9) (175.3)Investments in foreign operations (123.6) (114.8)
(953.2) (907.0)
Net deferred tax liability (480.7) (502.6)
Less: current liability (17.1) (80.7)
Long-term portion $(463.6) $(421.9)
At January 1, 2005, certain undistributed earnings of theCompany’s foreign operations totaling $1,190.7 million wereconsidered to be permanently reinvested. No deferred taxliability has been recognized for the remittance of suchearnings to the United States, since it is the Company’sintention to utilize those earnings in the foreign operationsfor an indefinite period of time, or to repatriate suchearnings only when tax efficient to do so. Determination ofthe amount of unrecognized deferred U.S. income taxliability is not practicable; however, unrecognized foreigntax credits may be available to reduce some portion of theU.S. income tax liability.
At January 1, 2005, GroceryWorks had net operating loss (“NOL”) carryforwards for federal income tax purposes of approximately $209 million and net operating losscarryforwards for state income tax purposes of approximately$38 million. The NOL carryforwards expire at various datesfrom 2006 to 2024. Until sufficient evidence exists thatGroceryWorks will have future taxable income to absorb theNOL carryforwards, Safeway will provide a valuationallowance for the entire deferred tax asset relating to thesecarryforwards. In the case of any subsequent reversal ofthis valuation allowance, approximately $22.3 million of thetax benefit realized will result in a reduction of GroceryWorks’goodwill or other noncurrent intangible assets.
At January 1, 2005 the Company had federal and certainstate charitable contribution tax carryforwards of $78.8million which expire in 2008.
N o t e I : E m p l o y e e B e n e f i t P l a n s a n dC o l l e c t i v e B a r g a i n i n g A g r e e m e n t s
R E T I R E M E N T P L A N S The Company maintains definedbenefit, non-contributory retirement plans for substantiallyall of its employees not participating in multi-employerpension plans.
In connection with the Genuardi’s acquisition in 2001,the Randall’s acquisition in 1999 and the Vons merger in1997, the Company assumed the sponsorship andobligations of Genuardi’s, Randall’s and Vons’ retirementplans. During 2003, the Randall’s plan was merged with theSafeway plan. The actuarial assumptions for the existingGenuardi’s and Vons retirement plans are comparable tothose for the Safeway retirement plan. Genuardi’s and Vons’retirement plans have been combined with Safeway’s forfinancial statement presentation.
The following tables provide a reconciliation of thechanges in the retirement plans’ benefit obligation and fairvalue of assets over the two-year period ended January 1,2005 and a statement of the funded status as of year-end2004 and 2003 (in millions):
2004 2003
Change in benefit obligation:Beginning balance $ 1,820.6 $ 1,519.2Service cost 109.9 95.8Interest cost 107.8 102.2Plan amendments 11.4 7.3Actuarial loss 34.1 129.1Benefit payments (101.7) (93.5)Currency translation adjustment 23.4 60.5
Ending balance $ 2,005.5 $ 1,820.6
2004 2003
Change in fair value of plan assets:Beginning balance $ 1,905.5 $ 1,572.4Actual return (loss) on plan assets 190.3 357.1Employer contributions 15.4 14.2Benefit payments (101.7) (93.5)Currency translation adjustment 20.2 55.3
Ending balance $ 2,029.7 $ 1,905.5
2004 2003
Funded status:Fair value of plan assets $ 2,029.7 $ 1,905.5Projected benefit obligation (2,005.5) (1,820.6)
Funded status 24.2 84.9Adjustment for difference in
book and tax basis of assets (165.1) (165.1)Unamortized prior service cost 90.7 95.9Unrecognized loss 372.0 403.0Other comprehensive loss (0.8) –
Prepaid pension cost $ 321.0 $ 418.7

S A F E WAY I N C . A N D S U B S I D I A R I E S
S A F E WAY I N C . 2 0 0 4 A N N U A L R E P O R T 4 7
The following table provides the components of 2004,2003 and 2002 net pension expense for the retirement plans(in millions):
2004 2003 2002
Estimated return on assets $ 154.0 $ 132.5 $143.7Service cost (109.9) (95.8) (74.6)Interest cost (107.8) (102.2) (82.9)Amortization of prior service cost (16.6) (15.5) (14.7)Amortization of unrecognized
losses (32.6) (49.9) (1.8)
Net pension expense $(112.9) $(130.9) $ (30.3)
Prior service costs are amortized on a straight-line basisover the average remaining service period of active partic-ipants. Actuarial gains and losses are amortized over theaverage remaining service life of active participants whenthe accumulation of such gains and losses exceeds 10% ofthe greater of the projected benefit obligation and the fairvalue of plan assets. The Company uses its fiscal year-enddate as the measurement date for its plans. The accumulatedbenefit obligation for all Safeway plans was $1,703.4 millionat year-end 2004 and $1,545.8 million at year-end 2003.
The actuarial assumptions used to determine year-endprojected benefit obligation were as follows:
2004 2003 2002
Discount rate:United States plans 5.8% 6.0% 6.5%Canadian plans 5.8 6.0 6.5Combined weighted
average rate 5.8 6.0 6.5
Rate of compensation increase:United States plans 5.0% 5.0% 5.0%Canadian plans 3.5 3.5 3.5
The actuarial assumptions used to determine net periodicbenefit cost were as follows:
2004 2003 2002
Discount rate:United States plans 6.0% 6.5% 7.5%Canadian plans 6.0 6.5 7.0Combined weighted average rate 6.0 6.5 7.4
Expected return on plan assets:United States plans 8.5% 8.5% 9.0%Canadian plans 7.0 7.5 8.0
Rate of compensation increase:United States plans 5.0% 5.0% 5.0%Canadian plans 3.5 3.5 5.0
The Company has adopted and implemented aninvestment policy for the defined benefit pension plans thatincorporates a strategic long-term asset allocation mixdesigned to meet the Company’s long-term pensionrequirements. This asset allocation policy is reviewedannually and, on a regular basis, actual allocations arerebalanced to the prevailing targets. The following tablesummarizes actual allocations for Safeway’s plans at year-end 2004 and 2003:
Plan Assets
Asset Category Target 2004 2003
Equity 65% 67.4% 69.1%Fixed income 35 31.5 29.3Cash and other – 1.1 1.6
Total 100% 100.0% 100.0%
The investment policy also emphasizes the following keyobjectives: (1) maintain a diversified portfolio among assetclasses and investment styles, (2) maintain an acceptablelevel of risk in pursuit of long-term economic benefit, (3) maximize the opportunity for value-added returns fromactive management, and (4) maintain adequate controls overadministrative costs.
To meet these objectives, the Company’s investmentpolicy reflects the following major themes: (1) diversifyholdings to achieve broad coverage of both stock and bondmarkets; and (2) use active investment managers withdisciplined, clearly defined strategies, while establishinginvestment guidelines and monitoring procedures for eachinvestment manager to ensure the characteristics of theportfolio is consistent with the original investment mandate.
Expected rates of return on plan assets were developedby determining projected stock and bond returns and thenapplying these returns to the target asset allocations of theemployee benefit trusts, resulting in a weighted averagerate of return on plan assets. Equity returns were basedprimarily on historical returns of the S&P 500 Index. Fixed-income projected returns were based primarily on historicalreturns for the broad U.S. bond market.
Safeway expects to contribute approximately $12.0million to its defined benefit pension plan trusts in 2005.

4 8 S A F E WAY I N C . 2 0 0 4 A N N U A L R E P O R T
S A F E WAY I N C . A N D S U B S I D I A R I E S
R E T I R E M E N T R E S T O R AT I O N P L A N The RetirementRestoration Plan provides death benefits and supplementalincome payments for senior executives after retirement. TheCompany recognized expense of $7.1 million in 2004, $6.7million in 2003 and $5.7 million in 2002. The aggregateprojected benefit obligation of the Retirement RestorationPlan was approximately $74.4 million at year-end 2004 and$73.3 million at year-end 2003.
P O S T R E T I R E M E N T B E N E F I T S O T H E R T H A N P E N S I O N S
In addition to the Company’s retirement plans and theRetirement Restoration Plan benefits, the Companysponsors plans that provide postretirement medical and lifeinsurance benefits to certain employees. Retirees share aportion of the cost of the postretirement medical plans.Safeway pays all the costs of the life insurance plans. Theplans are not funded.
The Company’s accrued postretirement benefit obligation(“APBO”) was $77.8 million at year-end 2004 and $67.8million at year-end 2003. The APBO represents the actuarialpresent value of the benefits expected to be paid afterretirement. Postretirement benefit expense was $10.3 millionin 2004, $9.2 million in 2003 and $8.0 million in 2002.
E S T I M AT E D F U T U R E B E N E F I T PAY M E N T S The followingbenefit payments, which reflect expected future service asappropriate, are expected to be paid (in millions):
Pension OtherBenefits Benefits
2005 $113.9 $ 5.82006 119.8 5.92007 125.2 6.02008 130.2 6.12009 134.3 6.22010 – 2014 741.1 33.8
M U LT I - E M P L O Y E R P E N S I O N P L A N S Safeway participatesin various multi-employer retirement plans, coveringsubstantially all Company employees not covered under theCompany’s non-contributory retirement plans, pursuant toagreements between the Company and various unions.These plans are generally defined benefit plans; however, inmany cases, specific benefit levels are not negotiated withor known by the employer-contributors. Contributions of$196.8 million in 2004, $172.1million in 2003 and $151.6million in 2002 were made and charged to expense.
Under U.S. law applicable to such pension plans, acompany is required to continue funding its proportionateshare of a plan’s unfunded vested benefits in the event of
withdrawal (as defined by the law) from a plan or plantermination. Safeway participates in a number of thesepension plans, and the potential liability as a participant inthese plans may be significant. The information required todetermine the total amount of this contingent liability, aswell as the total amount of accumulated benefits and netassets of such plans, is not readily available. During 1988and 1987, the Company sold certain operations. In mostcases, the party acquiring the operation agreed to continuemaking contributions to the plans. Safeway is relieved of theobligations related to these sold operations to the extentthat the acquiring parties continue to make contributions.Whether such sales could result in withdrawal under ERISAand, if so, whether such withdrawals could result in liabilityto the Company, is not determinable at this time.
C O L L E C T I V E B A R G A I N I N G A G R E E M E N T S At year-end2004, Safeway had approximately 191,000 full and part-timeemployees. Approximately 77% of Safeway’s employees inthe United States and Canada are covered by collectivebargaining agreements negotiated with local unionsaffiliated with one of 10 different international unions.There are approximately 400 such agreements, typicallyhaving three-year terms, with some agreements havingterms up to five years. Accordingly, Safeway renegotiates a significant number of these agreements every year.
N o t e J : I n v e s t m e n t I n U n c o n s o l i d a t e d A f f i l i a t e sAt year-end 2004, 2003 and 2002, Safeway’s investment in unconsolidated affiliates consists of a 49% ownershipinterest in Casa Ley, which operates 115 food and generalmerchandise stores in western Mexico.
Equity in earnings (losses) from Safeway’s unconsol-idated affiliates, which is included in other income(expense), was income of $12.6 million in 2004, a loss of$7.1 million in 2003 and a loss of $0.2 million in 2002.Equity in income in 2002 includes approximately $15.8million in charges related to the resolution of physicalinventory count discrepancies at Casa Ley.
N o t e K : R e l a t e d P a r t y Tr a n s a c t i o n sCasa Ley’s General Director was one of the Company’sdirectors until December 2004. Safeway sold products toCasa Ley totaling approximately $6.8 million in 2004, $12.0million in 2003 and $19.0 million in 2002 for resale in CasaLey’s retail stores.

S A F E WAY I N C . 2 0 0 4 A N N U A L R E P O R T 4 9
S A F E WAY I N C . A N D S U B S I D I A R I E S
N o t e L : C o m m i t m e n t s a n d C o n t i n g e n c i e s
L E G A L M AT T E R S In July 1988, there was a major fire atthe Company’s dry grocery warehouse in Richmond,California. Through March 1, 2005, in excess of 126,000claims for personal injury and property damage arising fromthe fire have been settled for an aggregate amount ofapproximately $125 million. The Company’s loss as a resultof the fire damage to its property and settlement of theabove claims was substantially covered by insurance.
As of March 1, 2005, there were still pending approxi-mately 600 claims against the Company for personal injury(including punitive damages), and approximately 290separate active claims for property damage, arising fromthe smoke, ash and embers generated by the fire. Asubstantial percentage of these claims have been assertedin lawsuits against the Company filed in the Superior Courtfor Alameda County, California. There can be no assurancethat the pending claims will be settled or otherwisedisposed of for amounts and on terms comparable to thosesettled to date. Safeway continues to believe that coverageunder its insurance policy will be sufficient and availablefor resolution of all remaining personal injury and propertydamage claims arising out of the fire.
On August 23, 2000, a lawsuit entitled Baker, et al. v.Jewel Food Stores, Inc., et al. was filed in the Circuit Courtof Cook County, Illinois, against the Company’s subsidiary,Dominick’s Finer Foods, Inc. (predecessor of Dominick’s FinerFoods, LLC), and Jewel Food Stores, a subsidiary ofAlbertson’s, Inc. The complaint alleges, among other things,that Dominick’s and Jewel conspired to fix the retail price ofmilk in nine Illinois counties in the Chicago area, in violationof the Illinois Antitrust Act. The court certified the lawsuit asa class action on behalf of all persons residing in the nine-county area who purchased milk from the defendants’ retailstores in these counties during August 1996 to August 2000.In January 2003, trial began to a judge, without a jury. Attrial plaintiffs’ expert calculated damages against bothdefendants in amounts ranging from $51 million to $126million, which amount would be trebled under applicable law.The judge, after hearing three weeks of testimony, dismissedthe action at the end of plaintiffs’ case, without requiringDominick’s and Jewel to present the defense case. Plaintiffsfiled an appeal in the Illinois Appellate Court, which affirmedthe trial court’s judgment on January 12, 2005. Plaintiffs havesought leave to appeal to the Illinois Supreme Court.
On or about November 21, 2003, four shareholderderivative lawsuits were filed in the California State SuperiorCourt for San Mateo County, California, which actions havebeen consolidated into a single action entitled In re Safeway,Inc. Derivative Litigation, with a single shareholder plaintiff.The action is brought against the nine individuals who wereserving as Safeway’s directors at the time the suit was filed, Kohlberg Kravis Roberts & Co. (“KKR”), two Companyofficers, and the Company as a nominal defendant. Thecomplaint alleges, among other things, that the Company’sdirectors concealed information about poor performance atsome of the Company’s divisions in order to enable KKR andcertain directors and officers to sell shares of Company stockat an inflated price. The complaint asserts causes of actionfor breach of fiduciary duty, abuse of control, violations of the California Corporations Code and other claims. Theparties have entered into a Memorandum of Understandingdated as of March 11, 2005, pursuant to which the Companyhas agreed to implement certain corporate governanceenhancements and the plaintiffs have agreed to dismiss allclaims with prejudice. The Memorandum of Understanding issubject to execution of a definitive stipulation of settlementand approval by the Court.
On February 2, 2004, the Attorney General for the Stateof California filed an action in the United States DistrictCourt for the Central District of California (Los Angeles),entitled State of California, ex rel. Bill Lockyer v. SafewayInc. dba Vons, et al., against the Company’s subsidiary, TheVons Companies, Inc., Albertson’s, Inc. and Ralphs GroceryCompany, a division of the Kroger Company. The complaintalleges that certain provisions of a Mutual Strike AssistanceAgreement entered into by the defendants in connectionwith the Southern California grocery strike that began onOctober 11, 2003 constituted a violation of section 1 of theSherman Antitrust Act. The complaint seeks declaratory andinjunctive relief. Defendants filed a motion for summaryjudgment based on the federal non-statutory labor exemptionto the antitrust laws, which was heard by the court onFebruary 10, 2005.
There are also pending against the Company variousclaims and lawsuits arising in the normal course ofbusiness, some of which seek damages and other relief,which, if granted, would require very large expenditures.
It is management’s opinion that although the amount ofliability with respect to all of the above matters cannot beascertained at this time, any resulting liability, including anypunitive damages, will not have a material adverse effecton the Company’s consolidated financial statements takenas a whole.

S A F E WAY I N C . A N D S U B S I D I A R I E S
5 0 S A F E WAY I N C . 2 0 0 4 A N N U A L R E P O R T
F U R R ’ S A N D H O M E L A N D C H A R G E In 1987, Safewayassigned a number of leases to Furr’s Inc. (“Furr’s”) andHomeland Stores, Inc. (“Homeland”) as part of the sale ofthe Company’s former El Paso, Texas and Oklahoma City,Oklahoma divisions. Safeway is contingently liable if Furr’sand Homeland are unable to continue making rentalpayments on these leases. In 2001, Safeway recorded a pre-tax charge to earnings of $42.7 million to recognize theestimated lease liabilities associated with the Furr’s andHomeland bankruptcies and for a single lease fromSafeway’s former Florida division. In 2002, Furr’s began theliquidation process and Homeland emerged from bankruptcyand, based on the resolution of various leases, Safewayreversed $12.1 million of this accrual.
Safeway is unable to determine its maximum potentialobligation with respect to other divested operations, shouldthere be any similar defaults, because information aboutthe total numbers of leases from these divestitures that arestill outstanding is not available. Based on an internalassessment by the Company, performed by taking the
The following table presents information about the Company by geographic area (in millions):
U.S. Canada Total
2004Sales and other revenue $31,463.0 $4,359.9 $35,822.9Operating profit 928.9 243.9 1,172.8Income before income taxes 550.2 243.7 793.9Long-lived assets, net 7,796.9 892.5 8,689.4Total assets 13,753.5 1,623.9 15,377.4
2003Sales and other revenue $31,678.7 $4,048.5 $35,727.2Operating profit 344.1 229.8 573.9(Loss) income before income taxes (86.2) 227.3 141.1Long-lived assets, net 7,607.9 797.9 8,405.8Total assets 13,679.8 1,416.9 15,096.7
2002Sales and other revenue $31,437.4 $3,479.8 $34,917.2Operating profit 773.0 174.6 947.6Income before income taxes and cumulative effect of accounting change 363.3 169.0 532.3Long-lived assets, net 7,876.8 654.0 8,530.8Total assets 14,948.8 1,098.4 16,047.2
original inventory of assigned leases at the time of thedivestitures and accounting for the passage of time,Safeway expects that any potential losses beyond thoserecorded, should there be any similar defaults, would not bematerial to Safeway’s operating results, cash flow orfinancial position.
C O M M I T M E N T S The Company has commitments undercontracts for the purchase of property and equipment andfor the construction of buildings. Portions of such contractsnot completed at year-end are not reflected in the consol-idated financial statements. These unrecorded commitmentswere $139.7 million at year-end 2004.
N o t e M : S e g m e n t sSafeway’s retail grocery business, which represents morethan 98% of consolidated sales and other revenue andoperates in the United States and Canada, is its onlyreportable segment.

S A F E WAY I N C . 2 0 0 4 A N N U A L R E P O R T 5 1
S A F E WAY I N C . A N D S U B S I D I A R I E S
N o t e N : C o m p u t a t i o n o f E a r n i n g s ( L o s s ) P e r S h a r e
(In millions, except per-share amounts) 2004 2003 2002
Diluted Basic Diluted Basic Diluted Basic
Income (loss) before cumulative effect ofaccounting change $ 560.2 $ 560.2 $(169.8) $(169.8) $(128.1) $(128.1)
Cumulative effect of accounting change – – – – (700.0) (700.0)
Net income (loss) $ 560.2 $ 560.2 $(169.8) $(169.8) $(828.1) $(828.1)
Weighted average common shares outstanding 445.6 445.6 441.9 441.9 467.3 467.3
Common share equivalents 3.5
Weighted average shares outstanding 449.1
Earnings (loss) per common share andcommon share equivalent:
Income (loss) before cumulative effect of accounting change $ 1.25 $ 1.26 $ (0.38) $ (0.38) $ (0.27) $ (0.27)
Cumulative effect of accounting change – – – – (1.50) (1.50)
Net income (loss) $ 1.25 $ 1.26 $ (0.38) $ (0.38) $ (1.77) $ (1.77)
Calculation of common share equivalents:Options to purchase common shares 12.6Common shares assumed purchased with
potential proceeds (9.1)
Common share equivalents 3.5
Calculation of common shares assumed purchased with potential proceeds:
Potential proceeds from exercise of optionsto purchase common shares $ 192.8
Common stock price used under the treasury stock method $ 21.26
Common shares assumed purchased withpotential proceeds 9.1
Anti-dilutive shares totaling 22.3 million in 2004, 26.2 million in 2003 and 21.7 million in 2002 have been excluded from diluted weighted average shares outstanding.
N o t e O : G u a r a n t e e sSafeway has applied the measurement and disclosureprovisions of FASB Interpretation (“FIN”) No. 45 to theCompany’s agreements that contain guarantee and indemni-fication clauses. FIN No. 45 requires that upon issuance ofa guarantee, the guarantor must disclose and recognize aliability for the fair value of the obligation it assumes underthe guarantee. The initial recognition and measurementprovisions of FIN No. 45 were effective for guarantees issuedor modified after December 31, 2002. As of January 1, 2005,Safeway did not have any material guarantees that wereissued or modified subsequent to December 31, 2002.
However, the Company is party to a variety of contractualagreements under which Safeway may be obligated toindemnify the other party for certain matters. These contracts
primarily relate to Safeway’s commercial contracts,operating leases and other real estate contracts, trademarks,intellectual property, financial agreements and various otheragreements. Under these agreements, the Company mayprovide certain routine indemnifications relating torepresentations and warranties (for example ownership ofassets, environmental or tax indemnifications) or personalinjury matters. The terms of these indemnifications range induration and may not be explicitly defined. Historically,Safeway has not made significant payments for theseindemnifications. The Company believes that if it were toincur a loss in any of these manners, the loss would nothave a material effect on the Company’s financial conditionor results of operations.

5 2 S A F E WAY I N C . 2 0 0 4 A N N U A L R E P O R T
S A F E WAY I N C . A N D S U B S I D I A R I E S
Last 16 Third 12 Second 12 First 12(In millions, except per-share amounts) 52 Weeks Weeks(2) Weeks(3) Weeks(4) Weeks(5)
2004 Sales, before reclassifications $35,621.9 $11,325.0 $8,297.0 $8,361.1 $7,638.8Reclassifications(1) 201.0 65.4 46.2 45.4 43.9
Sales and other revenue, as adjusted 35,822.9 11,390.4 8,343.2 8,406.5 7,682.7
Gross profit, before reclassifications 10,391.9 3,295.0 2,416.6 2,403.7 2,276.6Reclassifications(1) 203.4 61.7 49.4 48.0 44.4
Gross profit, as adjusted 10,595.3 3,356.7 2,466.0 2,451.7 2,321.0
Operating profit 1,172.8 406.2 294.5 317.0 155.2Income before income taxes 793.9 303.9 201.7 226.2 62.1Net income 560.2 202.7 159.2 155.2 43.1Net income per share – basic $ 1.26 $ 0.45 $ 0.36 $ 0.35 $ 0.10Net income per share – diluted 1.25 0.45 0.35 0.35 0.10Price range, New York Stock Exchange $ 25.64 $ 21.17 $ 25.64 $ 24.67 $ 23.80
to 17.26 to 17.26 to 19.52 to 19.92 to 19.72
Last 17 Third 12 Second 12 First 12(In millions, except per-share amounts) 53 Weeks Weeks(6) Weeks(7) Weeks(8) Weeks(9)
2003Sales, before reclassifications $35,552.7 $ 10,984.7 $8,276.5 $8,248.1 $8,043.3Reclassifications(1) 174.5 59.1 37.4 41.3 36.7
Sales and other revenue, as adjusted 35,727.2 11,043.8 8,313.9 8,289.4 8,080.0
Gross profit, before reclassifications 10,533.8 3,187.3 2,474.3 2,483.8 2,388.3Reclassifications(1) 190.4 62.9 43.5 42.4 41.6
Gross profit, as adjusted 10,724.2 3,250.2 2,517.8 2,526.2 2,429.9
Operating profit (loss) 573.9 (321.7) 426.1 357.4 112.1Income (loss) before income taxes 141.1 (458.0) 330.1 258.1 10.9Net (loss) income (169.8) (695.9) 202.5 161.0 162.6Net (loss) income per share – basic $ (0.38) $ (1.57) $ 0.46 $ 0.36 $ 0.37Net (loss) income per share – diluted (0.38) (1.57) 0.45 0.36 0.36Price range, New York Stock Exchange $ 25.80 $ 25.76 $ 25.66 $ 20.50 $ 25.80
to 16.45 to 19.87 to 19.79 to 16.45 to 17.59
(1) Reclassifications are discussed in Note A.(2) Net income for the last 16 weeks of 2004 includes an estimated $37.0 million after-tax impact of the Southern California strike and $6.5 million after-tax for an accrual for rent holidays.
Income tax expense includes a tax benefit of $8.8 million due to tax law changes and the resolution of certain tax issues.(3) Net income for the third 12 weeks of 2004 includes an estimated $45.0 million after-tax impact of the Southern California strike partially offset by a tax benefit of $32.4 million arising
from the resolution of certain tax issues.(4) Net income for the second 12 weeks of 2004 includes an estimated $50.0 million after-tax impact of the Southern California strike.(5) Net income for the first 12 weeks of 2004 includes an estimated $122.0 million after-tax impact of the Southern California strike and a $28.5 million after-tax charge related to
closing 12 under-performing Dominick’s stores.(6) Net loss for the last 17 weeks of 2003 includes an estimated $102.9 million after-tax impact of the Southern California strike, a $447.7 million after-tax goodwill impairment charge
for Randall’s, a $24.4 million after-tax goodwill impairment charge and a $116.9 million after-tax property impairment charge for Dominick’s, a $249.6 million reversal of tax benefitsinitially recognized on the proposed sale of Dominick’s during the first 36 weeks of 2003 and reversed when Dominick’s was taken off the market, an after-tax charge of $6.5 million towrite off miscellaneous investments and a $43.5 million after-tax charge for inventory reserve adjustments.
(7) Net income for the third 12 weeks of 2003 includes a $2.9 million after-tax property impairment charge for Dominick’s and restructuring and other expenses totaling $6.0 million, after-tax. (8) Net income for the second 12 weeks of 2003 includes a $41.6 million after-tax property impairment charge for Dominick’s and restructuring and other expenses totaling $9.9 million, after-tax. (9) Net income for the first 12 weeks of 2003 includes a $6.4 million after-tax charge to adopt EITF No. 02-16, a $251.5 million after-tax goodwill impairment charge and a $28.3 million after-tax
property impairment charge for Dominick’s, partially offset by a tax benefit of $249.6 million related to the planned Dominick’s sale that was subsequently reversed in the fourth quarter of 2003.
N o t e P : Q u a r t e r l y I n f o r m a t i o n ( U n a u d i t e d )The summarized quarterly financial data presented below reflect all adjustments which, in the opinion of management, areof a normal and recurring nature necessary to present fairly the results of operations for the periods presented. (Roundingaffects some totals.)

S A F E WAY I N C . 2 0 0 4 A N N U A L R E P O R T 5 3
Management of the Company, including the Chief ExecutiveOfficer and the Chief Financial Officer, is responsible forestablishing and maintaining adequate internal controls overfinancial reporting, as defined in Rules 13a-15(f) and 15d-15(f) of the Securities Exchange Act of 1934, as amended.The Company’s internal controls were designed to providereasonable assurance as to the reliability of its financialreporting and the preparation and presentation of theconsolidated financial statements for external purposes inaccordance with accounting principles generally accepted in the United States and includes those policies andprocedures that (1) pertain to the maintenance of recordsthat in reasonable detail accurately and fairly reflect thetransactions and dispositions of the assets of the Company;(2) provide reasonable assurance that transactions arerecorded as necessary to permit preparation of financialstatements in accordance with generally acceptedaccounting principles, and that receipts and expenditures of the Company are being made only in accordance withauthorizations of management and directors of theCompany; and (3) provide reasonable assurance regardingprevention or timely detection of unauthorized acquisition,use or disposition of the Company's assets that could havea material effect on the financial statements.
The Company conducted an evaluation of theeffectiveness of its internal controls over financial reportingbased on the framework in Internal Control – IntegratedFramework issued by the Committee of SponsoringOrganizations of the Treadway Commission. This evaluationincluded review of the documentation of controls, evaluationof the design effectiveness of controls, testing of theoperating effectiveness of controls and a conclusion on thisevaluation. Through this evaluation, management did notidentify any material weakness in the Company’s internalcontrols. There are inherent limitations in the effectivenessof any system of internal controls over financial reporting;however, based on the evaluation, management hasconcluded the Company’s internal controls over financialreporting were effective as of January 1, 2005.
M a n a g e m e n t ’s A n n u a l R e p o r t o n I n t e r n a l C o n t r o l so v e r F i n a n c i a l R e p o r t i n g
S T E V E N A . B U R DChairman, President andChief Executive OfficerMarch 15, 2005
R O B E R T L . E D W A R D SExecutive Vice Presidentand Chief Financial OfficerMarch 15, 2005
S A F E WAY I N C . A N D S U B S I D I A R I E S

5 4 S A F E WAY I N C . 2 0 0 4 A N N U A L R E P O R T
T h e B o a r d o f D i r e c t o r s a n d S t o c k h o l d e r s o f S a f e w a y I n c :We have audited management’s assessment, included in theaccompanying “Management’s Annual Report on InternalControls Over Financial Reporting,” that Safeway Inc. andsubsidiaries (the “Company”) maintained effective internalcontrol over financial reporting as of January 1, 2005, basedon criteria established in Internal Control– IntegratedFramework issued by the Committee of SponsoringOrganizations of the Treadway Commission. The Company’smanagement is responsible for maintaining effectiveinternal control over financial reporting and for itsassessment of the effectiveness of internal control overfinancial reporting. Our responsibility is to express anopinion on management’s assessment and an opinion on theeffectiveness of the Company’s internal control overfinancial reporting based on our audit.
We conducted our audit in accordance with thestandards of the Public Company Accounting OversightBoard (United States). Those standards require that we planand perform the audit to obtain reasonable assurance aboutwhether effective internal control over financial reportingwas maintained in all material respects. Our audit includedobtaining an understanding of internal control over financialreporting, evaluating management’s assessment, testingand evaluating the design and operating effectiveness ofinternal control, and performing such other procedures aswe considered necessary in the circumstances. We believethat our audit provides a reasonable basis for our opinions.
A company’s internal control over financial reporting is aprocess designed by, or under the supervision of, thecompany’s principal executive and principal financial officers,or persons performing similar functions, and effected by thecompany’s board of directors, management, and otherpersonnel to provide reasonable assurance regarding thereliability of financial reporting and the preparation offinancial statements for external purposes in accordance withgenerally accepted accounting principles. A company’sinternal control over financial reporting includes those policiesand procedures that (1) pertain to the maintenance of recordsthat, in reasonable detail, accurately and fairly reflect thetransactions and dispositions of the assets of the company; (2) provide reasonable assurance that transactions arerecorded as necessary to permit preparation of financial
statements in accordance with generally accepted accountingprinciples, and that receipts and expenditures of the companyare being made only in accordance with authorizations ofmanagement and directors of the company; and (3) providereasonable assurance regarding prevention or timely detectionof unauthorized acquisition, use, or disposition of thecompany’s assets that could have a material effect on thefinancial statements.
Because of the inherent limitations of internal controlover financial reporting, including the possibility ofcollusion or improper management override of controls,material misstatements due to error or fraud may not beprevented or detected on a timely basis. Also, projections ofany evaluation of the effectiveness of the internal controlover financial reporting to future periods are subject to therisk that the controls may become inadequate because ofchanges in conditions, or that the degree of compliancewith the policies or procedures may deteriorate.
In our opinion, management’s assessment that theCompany maintained effective internal control over financialreporting as of January 1, 2005, is fairly stated, in allmaterial respects, based on the criteria established inInternal Control– Integrated Framework issued by theCommittee of Sponsoring Organizations of the TreadwayCommission. Also in our opinion, the Company maintained,in all material respects, effective internal control overfinancial reporting as of January 1, 2005, based on thecriteria established in Internal Control–Integrated Frameworkissued by the Committee of Sponsoring Organizations of theTreadway Commission.
We have also audited, in accordance with the standardsof the Public Company Accounting Oversight Board (UnitedStates), the consolidated financial statements as of and for the year ended January 1, 2005 of the Company, and our report dated March 15, 2005 expressed an unqualifiedopinion (and included an explanatory paragraph relating to the adoption of a new accounting standard) on thoseconsolidated financial statements.
San Francisco, CaliforniaMarch 15, 2005
R e p o r t o f I n d e p e n d e n t R e g i s t e r e d P u b l i c A c c o u n t i n gF i r m o n I n t e r n a l C o n t r o l O v e r F i n a n c i a l R e p o r t i n g

R e p o r t o f I n d e p e n d e n t R e g i s t e r e d P u b l i c A c c o u n t i n g F i r m
S A F E WAY I N C . 2 0 0 4 A N N U A L R E P O R T 5 5
To t h e B o a r d o f D i r e c t o r s a n d S t o c k h o l d e r s o f S a f e w a y I n c :We have audited the accompanying consolidated balancesheets of Safeway Inc. and subsidiaries (the “Company”) asof January 1, 2005 and January 3, 2004, and the relatedconsolidated statements of operations, stockholders’ equity,and cash flows for each of the three years in the periodended January 1, 2005. These financial statements are theresponsibility of the Company’s management. Our responsi-bility is to express an opinion on these financial statementsbased on our audits.
We conducted our audits in accordance with thestandards of the Public Company Accounting OversightBoard (United States). Those standards require that weplan and perform the audit to obtain reasonable assuranceabout whether the financial statements are free ofmaterial misstatement. An audit includes examining, on atest basis, evidence supporting the amounts anddisclosures in the financial statements. An audit alsoincludes assessing the accounting principles used andsignificant estimates made by management, as well asevaluating the overall financial statement presentation.We believe that our audits provide a reasonable basis forour opinion.
In our opinion, such consolidated financial statementspresent fairly, in all material respects, the financial positionof Safeway Inc. and subsidiaries as of January 1, 2005 and
January 3, 2004, and the results of their operations and theircash flows for each of the three years in the period endedJanuary 1, 2005, in conformity with accounting principlesgenerally accepted in the United States of America.
As discussed in Note B to the consolidated financialstatements, in fiscal 2002, the Company changed its methodof accounting for goodwill and other intangible assets toconform to Statement of Financial Accounting StandardsNo. 142, “Goodwill and Other Intangible Assets.”
We have also audited, in accordance with the standardsof the Public Company Accounting Oversight Board (UnitedStates), the effectiveness of the Company’s internal controlover financial reporting as of January 1, 2005, based on thecriteria established in Internal Control– Integrated Frameworkissued by the Committee of Sponsoring Organizations of theTreadway Commission, and our report dated March 15, 2005expressed an unqualified opinion on management’sassessment of the effectiveness of the Company’s internalcontrol over financial reporting and an unqualified opinionon the effectiveness of the Company’s internal control overfinancial reporting.
San Francisco, CaliforniaMarch 15, 2005

5 6 S A F E WAY I N C . 2 0 0 4 A N N U A L R E P O R T
S A F E WAY I N C . A N D S U B S I D I A R I E S
D i r e c t o r s
S T E V E N A . B U R DChairman, President and Chief Executive OfficerSafeway Inc.
P A U L H A Z E NLead Independent DirectorFormer Chairman andChief Executive Officer Wells Fargo & CoDeputy ChairmanVodafone Group PLC
J A N E T E . G R O V EChair and Chief Executive OfficerFederated Merchandising GroupVice ChairFederated Department Stores, Inc.
M O H A N G Y A N IFormer President and Chief Executive OfficerMobility ServicesAT&T Wireless Services, Inc.
R O B E R T I . M A C D O N N E L LRetired PartnerKKR & Co.
D O U G L A S J . M A C K E N Z I EPartnerKleiner Perkins Caufield & Byers
R E B E C C A A . S T I R NBusiness Consultant
W I L L I A M Y. TA U S C H E RManaging MemberThe Tauscher Group
R A Y M O N D G . V I A U L TFormer Vice ChairmanGeneral Mills, Inc.
E x e c u t i v e O f f i c e r s
S T E V E N A . B U R DChairman, President and Chief Executive Officer
B R I A N C . C O R N E L LExecutive Vice President andChief Marketing Officer
R O B E R T L . E D W A R D SExecutive Vice President and Chief Financial Officer
B R U C E L . E V E R E T T EExecutive Vice President
L A R R E E M . R E N D AExecutive Vice PresidentRetail Operations, Human Resources,Public Affairs, Labor and GovernmentRelations, Reengineering andCommunications
D A V I D F. B O N DSenior Vice PresidentFinance and Control
D A V I D T. C H I N GSenior Vice President andChief Information Officer
D I C K W . G O N Z A L E SSenior Vice PresidentHuman Resources
R O B E R T A . G O R D O NSenior Vice President,General Counsel and Chief Governance Officer
M E L I S S A C . P L A I S A N C ESenior Vice PresidentFinance and Investor Relations
K E N N E T H M . S H A C H M U TSenior Vice PresidentReengineering and Marketing Analysis
D A V I D R . S T E R NSenior Vice PresidentPlanning and Business Development
J E R R Y T I D W E L LSenior Vice President Supply Operations
D O N A L D P. W R I G H TSenior Vice PresidentReal Estate and Engineering
D i v i s i o n P r e s i d e n t s
B R U C E L . E V E R E T T EDominick’s Finer Foods, LLC
H E N R Y A . C O M I N I E L L OActing Eastern Division President
S C O T T G R I M M E T TDenver Division
K A R L S C H R O E D E RNorthern California Division
G R E G O R Y A . S P A R K SSeattle Division
D A N I E L J . V A L E N Z U E L APhoenix Division
L Y L E A . W AT E R M A NPortland Division
T H O M A S C . K E L L E RThe Vons Companies, Inc.
S T E V E N R . F R I S B YRandall’s Food & Drugs, LP
M I T C H E L L R H O D E S GroceryWorks Holdings, Inc.(Internet Grocer)
F o r e i g n S u b s i d i a r y
C A N A D A S A F E WAY L I M I T E D
C H U C K M U L V E N N APresident and Chief Operating Officer
E q u i t y A f f i l i a t e
C A S A L E Y, S . A . D E C . V. ( M E X I C O )
J U A N M A N U E L L E Y L O P E ZChairman and Chief Executive Officer
D i r e c t o r s a n d P r i n c i p a l O f f i c e r s

S A F E WAY I N C . 2 0 0 4 A N N U A L R E P O R T 5 7
S A F E WAY I N C . A N D S U B S I D I A R I E S
E x e c u t i v e O f f i c e sMailing Address:Safeway Inc.P.O. Box 99Pleasanton, CA 94566-0009
I n t e r n e t A d d r e s sSafeway’s web site on the Internet canbe accessed at www.safeway.com. Wedo not incorporate the information onour web site into this annual report, andyou should not consider it part of thisannual report.
S t o c k Tr a n s f e r A g e n ta n d R e g i s t r a rEquiServe Trust Company, N.A.P.O. Box 43069Providence, RI 02940-3069877-498-8861Hearing impaired: 800-952-9245www.equiserve.com
F o r m 1 0 - KSafeway’s 2004 Form 10-K filed withthe Securities and ExchangeCommission can be accessed online atwww.safeway. com/investor_relations.Alternately, a copy of the form may beobtained by writing to the InvestorRelations Department at our executiveoffices or by calling 925-467-3790.
C e r t i f i c a t i o n s The company submitted a Section 12(a)CEO certification to the New York StockExchange within 30 days of its 2004Annual Meeting of Stockholders. Thecompany filed the CEO/CFO certifi-cations required under Section 302 ofthe Sarbanes-Oxley Act of 2002 as anexhibit to the company’s 2004 AnnualReport on Form 10-K.
I n d e p e n d e n t A u d i t o r sDeloitte & Touche LLP San Francisco, California
A n n u a l M e e t i n gThe 2005 Annual Meeting ofStockholders will be held on May 25,2005. A notice of the meeting, togetherwith a proxy statement and a form ofproxy, will be mailed to stockholderswithin 120 days of the end of the fiscal year.
S t o c k E x c h a n g e L i s t i n gThe company’s common stock, which trades under the symbol SWY, and certain debentures and notes are listedon the New York Stock Exchange.
I n v e s t o r I n q u i r i e sCommunication regarding investorrecords, including changes of address orownership, should be directed to thecompany’s transfer agent, EquiServeTrust Company, N.A., at the addresslisted on the left. To inquire by phone,please call 877-498-8861, or visit theirweb site at www.equiserve.com.
Investors, security analysts andmembers of the media should directtheir financial inquiries to our InvestorRelations Department at 925-467-3832.
To access or obtain financial reports,please visit our web site at www.safeway. com/investor_relations, writeto our Investor Relations Department orcall 925-467-3790.
E E O - 1 R e p o r tAs an equal opportunity employer,Safeway values and actively supportsdiversity in the workplace. A copy of thecompany’s 2004 summary EEO-1 report,filed with the federal Equal EmploymentOpportunity Commission, is availableupon request at our executive offices.
Tr u s t e e s a n d P a y i n g A g e n t s2.50% Senior Notes3.80% Senior Notes4.125% Senior Notes 4.80% Senior Notes4.95% Senior Notes5.625% Senior Notes5.80% Senior Notes6.15% Senior Notes6.50% Senior Notes7.00% Senior Notes7.25% Senior Debentures7.45% Senior Debentures7.50% Senior Notes9.875% Senior Subordinated
DebenturesFloating Rate Senior Notes
The Bank of New YorkBondholder Relations DepartmentCorporate Trust DivisionFiscal Agencies Department101 Barclay Street, 7-EastNew York, NY 10286800-548-5075
9.30% Senior Secured Debentures
JPMorgan Chase & Co.Institutional Trust ServicesP.O. Box 2320Dallas, TX 75221-2320800-275-2048
I n v e s t o r I n f o r m a t i o nD
ES
IG
N:
B
RO
OM
&
B
RO
OM
,
IN
C.
S
AN
F
RA
NC
IS
CO

SAFEWAY INC.
P.O. Box 99Pleasanton, CA 94566-0009
SA
FEWA
Y IN
C. 2004 A
NN
UA
L REP
OR
T