Safeway 1998 Annual Report
44
Safeway Inc. P.O. Box 99 Pleasanton, CA 94566-0009
Transcript of Safeway 1998 Annual Report

Safeway Inc.P.O. Box 99Pleasanton, CA 94566-0009

P e rf o rm a n ce. P e rf o rm a n ce.
Safeway Inc1998 Annual Repor

Safeway Inc. is one of the largest food and drug
retailers in North America. As of January 2, 1999,
the company operated 1,497 stores (including 324 Vons
stores and 114 Dominick’s stores) in the We s t e rn ,
S o u t h w e s t e rn, Rocky Mountain, Midwestern and Mid-
Atlantic regions of the United States and in western Canada.
In support of its stores, Safeway has an extensive network of
distribution, manufacturing and food processing facilities.
On August 6, 1998, the company signed a definitive merg e r
a g reement to acquire Carr-Gottstein Foods Co., Alaska’s
leading food and drug re t a i l e r, which operated 49 stores and a distribution center in that state at year- e n d
1998. The transaction is expected to be completed in the second quarter of 1999.
Safeway also holds a 49% interest in Casa Ley, S.A. de C.V., which at January 2, 1999 operated 77 food and
general merchandise stores in western Mexico.
Percentage of Stores with Specialty Departments
1998 1993
Bakery 86% 72%
Deli 94 87
Floral 89 87
Pharmacy 60 49
Manufacturing and Processing Facilities
Year-end 1998U.S. Canada
Milk Plants 8 3
Bread Baking Plants 6 2
Ice Cream Plants 5 2
Cheese and Meat Packaging Plants 1 2
Soft Drink Bottling Plants 4 –
Fruit and Vegetable Processing Plants 2 3
Other Food Processing Plants 3 1
Pet Food Plant 1 –■ ■ ■ ■ ■ ■ ■ ■
Total 30 13■ ■ ■ ■ ■ ■ ■ ■
Community InvolvementThe primary recipients of our charitable giving are food
banks and the National Easter Seal Society. During 1998 we
donated approximately $50 million worth of merchandise to
food banks and various feeding programs in the U.S. and
Canada. Since becoming a leading corporate sponsor of
Easter Seals in 1985, the company and its employees have
raised more than $60 million to help people with disabilities
lead more productive, independent lives. In addition, we
support hundreds of local civic, charitable, cultural and edu-
cational organizations throughout our operating areas.
Many Safeway employees lend their time and talents to
community organizations and causes. We encourage and
support such efforts through our Community Pride pro-
gram, augmenting our employees’ good work with financial
contributions from the company.

Financial Highlights
52 Weeks 53 Weeks 52 Weeks(Dollars in millions, except per-share amounts) 1998 1997 1996
For the Year:Sales $24,484.2 $22,483.8 $17,269.0Gross profit 7,124.5 6,414.7 4,774.2Operating profit 1,601.7 1,279.7 891.7Income before extraordinary loss 806.7 621.5 460.6Net income 806.7 557.4 460.6Diluted earnings per share:
Income before extraordinary loss $ 1.59 $ 1.25 $ 0.97Net income 1.59 1.12 0.97
Capital expenditures (Note 1) 1,189.7 829.4 620.3
At Year-End:Common shares outstanding (in millions) (Note 2) 490.3 476.2 442.8Retail square feet (in millions) 61.6 53.2 40.7Number of stores 1,497 1,368 1,052
Note 1: Defined on page 14 under “Capital Expenditure Program.”Note 2: Net of 60.6 million and 61.2 million shares held in treasury in 1998 and 1997.
*Defined on page 17

1998 was another year of solid pro g ress for
S a f e w a y. We improved our operating re s u l t s ,
strengthened our financial position, steppedup
our capital spending program, and completed
one acquisition and initiated another.
Improved Operating Results
Net income was $806.7 million ($1.59 per share )
in the 52 weeks of 1998 compared to $621.5 mil-
lion ($1.25 per share) of income before extraordi-
nary loss in 1997, a 53-week year. Results in 1997
were adversely affected by an extraordinary loss
of $64.1 million ($0.13 per share), arising fro m
the replacement of higher interest rate debt
with lower-rate debt.
Total sales
increased to
$24.5 billion, u p
8.9% from 1997.
Sales of identical
stores (which
exclude replace-
ments) rose 3.7%,
while compara-
ble-store sales
increased 4.1%.
Through year-
end 1998, we had
recorded six con-
secutive years of
positive sales
growth in both identical and comparable stores.
Gross profit increased 57 basis points to
29.10% in 1998, reflecting continuing improve-
ment in buying practices and product mix while
maintaining competitive prices.
Operating and administrative (O&A) expense
as a percentage of sales fell 28 basis points to
22.56%, largely as a result of increased sales
and ongoing eff o rts to reduce or control costs.
Our O&A expense ratio has declined for six
straight years.
Operating cash flow increased to 8.75% of
sales, the highest level on an annual basis in our
72-year history. While we have improved our
cash flow margin by 368 basis points since the
end of 1992, when we began our turn a round, we
believe we can make further progress.
Stronger Financial Position
I n t e rest expense declined slightly to $235.0 mil-
lion in 1998. Our interest coverage ratio (operat-
ing cash flow divided by interest expense)
i m p roved to 9.11 times in 1998 from 7.18 times
in 1997 due to strong operating results.
During 1998 we also reduced the average
i n t e rest rate on debt through a series of re f i n a n c-
ings, had the investment grade ratings on our
senior unsecured debt re a ff i rmed by Standard &
Poor’s and Moody’s, and maintained negative
working capital for the fifth consecutive year.
Standard & Poor’s added Safeway common
stock to its S&P 500 Index in November 1998.
Accelerated Capital Spending
Capital investments increased to $1.2 billion in
1998, up from $829 million the prior year. We
opened 46 new stores, remodeled 234 existing
To Our Stockholders

s t o res and completed construction of a new distri-
bution center in Maryland. During 1999 we plan
to invest approximately $1.2 billion and open 55
to 60 new stores while completing some 250
remodels. As in the recent past, about thre e -
q u a rters of our capital expenditures in the com-
ing year is budgeted for new stores and re m o d e l s .
Continued Growth Through Acquisitions
While improving our store system in existing
markets will remain the central focus of our capi-
tal expenditure program, our long-term gro w t h
strategy remains focused on acquisitions.
In November 1998 we acquired Dominick’s
Supermarkets, Inc., the second largest super-
market operator in the Chicago metropolitan
area with 114 stores and sales of $2.4 billion in
fiscal 1998. As with the Vons merger in 1997,
the combination with Dominick’s enables us to
extend our geographic reach and to benefit from
the exchange of best practices. Dominick’s has an
excellent reputation in the Chicago market and
operates attractive stores in good locations. We
are confident we can build on that success.
The pending acquisition of Carr- G o t t s t e i n
Foods Co., Alaska’s leading food and drug retail-
er, is expected to result in considerable synergies
for our own Alaskan operations. In support of its
49 stores, Carrs operates the state’s largest food
warehouse and freight network.
The U.S. supermarket industry, historically
highly fragmented, is becoming increasingly con-
solidated. Whereas the top five chains had a com-
bined market share of only 19% in 1992, their
s h a re had risen to 24% in
1997, should expand to
36% this year as a result
of pending mergers and,
we believe, is likely to
increase further. Growth
through acquisition will
continue to be a key part
of our strategy.
Review and Outlook
During the past six years, our total market capi-
talization has increased to approximately $29.9
billion from just $1.3 billion in 1992. No other
publicly traded supermarket chain has achieved
even half that growth rate over the same period.
Many of you have participated in this gro w t h .
As illustrated on the facing page, $1,000 invested
in Safeway stock at the beginning of 1993 had
increased in value to $18,750 by year-end 1998.
We are proud of our achievements. T h e y
reflect the dedication and hard work of 170,000
Safeway employees, many of whom are stock-
holders themselves. On their behalf, let me
a s s u re you that all of us on the Safeway team are
committed to building on our past success and
making continued progress in 1999 and beyond.
Steven A. Burd
Chairman, President and
Chief Executive Officer
March 5, 1999

$75
60
45
30
15
090 91 92
Began construction of new 1.8 million sq. ft. distribution center in northern California.
Sold an additional 70 million shares of common stock.
Retired $565 million of 14.5%LBO-related debt.
Total sales surpassed $15 billion mark.
Identical-store sales essentially flat compared to 1990.
Operating and administrative(O&A) expense-to-sales margin rose to 23.51%.
Operating cash flow as percentage of sales increased to 5.74%.
Capital expenditures increased to $635 million.
Identical-store sales declined 1.6%.
O&A expense increased to 24.47% of sales.
Operating cash flow declined to 5.07% of sales from 5.74% in 1991 as recession-wearyconsumers “traded down” to less profitable product mix.
Opened new distribution center in northern California.
Steve Burd, long-time consultant to Safeway, namedpresident.
In fourth quarter, implementedstrategy to reduce costs, increase sales and improvereturns on capital.
Completed refinancing of $1 billion of subordinated debt.
Completed initial public offering(IPO) of Safeway common stock.
Adopted new company name: Safeway Inc.
Announced five-year $3.2 billioncapital expenditure program.
Honored by the President’sCitation Program for PrivateSector Initiatives, for an unprece-dented sixth consecutive year.
Identical-store sales gain slowed to 2.5% from 4.6% a year earlier.
Operating cash flow improved to 5.68% of sales.
Capital expenditures rose 30.3% to $490 million.
Safeway Post-IPO Timeline*

95
Introduced Safeway SELECT line of premium quality private-label products.
Steve Burd elected CEO.
Raised $6.7 million for theNational Easter Seal Society,Safeway’s designated corporate charity.
Identical-store sales increased, reversing three-year decline.
O&A expense margin decreasedfor first time since 1989.
Operating cash flow improved to 5.11% of sales.
Reduced working capital by $275 million.
Reduced debt by $359 million.
Identical-store sales rose 4.4%.
Reduced O&A expense margin for second straight year, to23.52% of sales.
Working capital declined another$176 million.
Operating cash flow improved to 6.06% of sales.
Capital spending increased to $352 million.
Closed six manufacturing plants, resulting in significant savings and higher productivity in remaining plants.
Retired $292 million of senior debt.
Northern California Division donated more than $3 millionworth of computer equipment to local schools.
Identical-store sales up 4.6%.
O&A expense as percentage of sales declined for thirdconsecutive year, to 22.96%.
Operating cash flow rose to 6.52% of sales.
Capital spending increased to $503 million.
Senior unsecured debt giveninvestment grade status byStandard & Poor’s.
Began converting hundreds of private label items previously marketed under 10 other brandnames to Safeway brand name.
Denver Division received Martin Luther King, Jr.Community Service Award.
93 94

96 97 98
ock split two-for-one in January.
ned definitive agreement tochase shares of The Vons
mpanies, Inc. that Safeway not already own.
cycled more than 300 millionunds of corrugated cardboard,addition to large amounts ofstic, glass, aluminum, batteriesd tires.
ntical-store sales increased1%.
A expense margin declined fourth consecutive year,22.48% of sales.
erating cash flow increased 7.18% of sales, marking st time it exceeded 7% on annual basis in Safeway’s-year history.
pital expenditures rose to 20 million.
Completed Vons acquisition.
Began construction of new 762,000 sq. ft. distribution centerin Maryland.
Cumulative fundraising total for Easter Seals, since becoming a corporate sponsor in 1985,exceeded $50 million.
Contributed approximately $40 million worth of food and non-food products to food banks in the U.S. and Canada.
Recorded positive identical-storesales for fifth year in a row.
O&A expense as percentage of sales declined 35 basis pointson a pro forma basis (to reflect acquisition of Vons), continuing a five-year trend.
Operating cash flow marginimproved to 7.70% of sales.
Capital spending increased to $829 million.
Stock split two-for-one in February.
Opened new distribution center in Maryland.
Signed definitive agreement toacquire Carr-Gottstein Foods Co.
Acquired Dominick’sSupermarkets, Inc.
Added to S&P 500 Index.
Identical-store sales increased 3.7%.
O&A expense margin declined 28 basis points to 22.56% of sales.
Operating cash flow as percentageof sales increased to 8.75%.
Capital expenditures exceeded $1 billion.

Safeway has undergone significant change since re e m e rging as a publicly traded
company in mid-1990. Three years after the initial public stock offering, follow-
ing a prolonged period of disappointing operating and financial results, a new
management team set out to transform the company from an industry laggard
into the preeminent food and drug retailer in North America.

Continued Strong Performance
During 1998, Safeway continued to be among the industry leaders in the
following key measures of financial performance:*
• Identical-store sales growth
• Expense ratio reduction
• Working capital management
• Operating cash flow margin
• Earnings per share growth
The value of Safeway common stock on the New York Stock Exchange at the
close of trading in 1998 rose to $60.94 per share, a gain of 92.7% from year-end
1997. We have achieved these results by focusing on the three priorities detailed
on the following pages.
*Based on latest available information

Operating and administrative expense as a percentage
of sales declined for the sixth consecutive year in 1998.
This trend reflects ongoing efforts throughout the
company to streamline support functions, simplify
work practices and maintain labor cost parity. These
e ff o rts are focused on areas invisible to our cus-
tomers – procurement, distribution, manufacturing
and administration. We continuously seek ways to
operate our business at lower cost.
Controlling Expenses
We began consoli-
dating corporate
administrative functions
at Dominick’s into
Safeway’s operations.
We negotiated
competitive labor
agreements in several
key markets.
We continued to
control the frequency
and cost of workers’
compensation
claims in 1998.
Ongoing improvements
in procurement and
category management
have reduced our
cost of goods sold as
a percentage of sales.

By reinvesting savings from our cost-reduction
efforts into the business, we continued to drive
top-line growth in 1998. Identical-store sales
increased for the sixth straight year, despite
the persistence of very low food price inflation in
many of our operating areas. With the recently
completed
acquisition of Dominick’s and pending
acquisition of Carr-Gottstein, we anticipate
significant opportunities to enhance
Safeway’s long-term sales growth.
Increasing Sales
With the Dominick’s
acquisition, completed
in just six weeks, we
increased our store
count and entered a
new geographic market.
The exchange of
best practices among
Vons, Dominick’s and core
Safeway divisions has
resulted in significant
improvements in all
operations.
Six more divisions
introduced the Safeway
Club Card in 1998.
All divisions now have
a card program to
attract and reward
loyal customers.
We added another
139 new items to our
Safeway SELECT
line of premium quality
products, bringing
the total count to
almost 900 items.

Managing Capital
Safeway, Vons and
Dominick’s opened
46 new stores
and remodeled
234 existing stores.
We opened a new
762,000 square foot
distribution center in
Maryland to better
serve our 123-store
Eastern Division.
We maintained
negative working
capital for the fifth
straight year by managing
inventories and
payables effectively.
We replaced
$560 million of
higher rate long-term
debt at Dominick’s
with lower rate
borrowings.
Continued strong operating results enabled us to
increase capital expenditures again, to $1.2 billion in 1998
from $829 million the year before. Over the past five
years, we have invested $3.5 billion to modernize our
stores, support facilities, warehouse and trucking
equipment, and information systems. Despite the
additional debt incurred to finance the Dominick’s
acquisition, our interest coverage ratio rose to
9.11 times in 1998 from 7.18 times in 1997.

Company in Review
Safeway Inc. (“Safeway” or the “Company”) is one of the
largest food and drug chains in North America, with 1,497
stores at year-end 1998.
The Company’s U.S. retail operations are located princi-
pally in nort h e rn California, southern California, Ore g o n ,
Washington, Colorado, Arizona, the Chicago metro p o l i t a n
a rea, and the Mid-Atlantic region. The Company’s Canadian
retail operations are located principally in British Columbia,
A l b e rta and Manitoba/Saskatchewan. In support of its re t a i l
operations, the Company has an extensive network of distrib-
ution, manufacturing and food processing facilities.
In addition, Safeway has a 49% ownership interest in Casa
L e y, S.A. de C.V. (“Casa Ley”) which operates 77 food and
general merchandise stores in western Mexico.
Acquisition of Dominick’s Supermarkets, Inc. (“Dominick’s ” ) I n
November 1998, Safeway completed its acquisition of all
of the outstanding shares of Dominick’s for $49 cash per share ,
or a total of approximately $1.2 billion (the “Dominick’s
Acquisition”). Dominick’s is the second largest supermarket
operator in the Chicago metropolitan area with 114 stores,
two distribution facilities and a dairy processing plant. The
D o m i n i c k ’s Acquisition is accounted for as a purchase. Safeway
funded the Dominick’s Acquisition, including the repayment
of approximately $560 million of debt and lease obligations,
with a combination of bank borrowings and commercial paper.
Dominick’s sales for calendar year 1998 were $2.4 billion.
Acquisition of Carr-Gottstein Foods Co. (“Carrs”) In August 1998,
Safeway and Carrs signed a definitive merger agreement in
which Safeway will acquire all of the outstanding shares of
C a rrs for $12.50 cash per share, or a total of approximately
$110 million. In addition, Carrs has approximately $220 million o f
debt. The acquisition will be accounted for as a purchase and will
be funded initially through the issuance of commercial paper.
C a rrs is Alaska’s largest food and drug re t a i l e r, operating
49 stores as well as the state’s largest food warehouse and
distribution operation, and largest freight company. Carr s ’
sales for calendar year 1998 were $602 million.
The acquisition of Carrs is subject to a number of condi-
tions, including the approval of the holders of a majority of
C a rrs’ outstanding shares, court approval of a consent decre e
with the state of Alaska requiring the sale of six Safeway
s t o res and one Carrs store, and other customary closing condi-
tions. Carrs expects to schedule a shareholder meeting to vote
on the transaction in April 1999. Assuming satisfaction of all
conditions, Safeway and Carrs expect to close the transaction
s h o rtly after receiving shareholder approval and final court
a p p roval of the consent decree.
Stores Safeway operates stores ranging in size from appro x i-
mately 5,900 square feet to over 90,000 square feet. The
Company determines the size of a new store based on a number
of considerations, including the needs of the community the
s t o re serves, the location and site plan, and the estimated
re t u rn on capital invested. Safeway’s primary new store pro t o-
type is 55,000 square feet and is designed to accommodate
changing consumer needs and to achieve certain operating
efficiencies. Most stores offer a wide selection of both food and
general merchandise and feature a variety of specialty depart-
ments such as bakery, delicatessen, floral and pharm a c y. In
most of Safeway’s larger stores, specialty departments are
showcased in each corner and along the perimeter walls of the
s t o re to create a pleasant shopping atmosphere.
Safeway continues to operate a number of smaller store s
which also offer an extensive selection of food and general
m e rchandise, and generally include one or more specialty
d e p a rtments. These stores remain an important part of the
Company’s store network in smaller communities and certain
other locations where larger stores may not be feasible because
of space limitations and/or community needs or restrictions.

The following table summarizes Safeway’s stores by size at
year-end 1998:
Store Ownership At year-end 1998, Safeway owned approxi-
mately one-third of its stores and leased its remaining store s .
In recent years, the Company has pre f e rred ownership
because it provides control and flexibility with respect to
financing terms, remodeling, expansions and closures.
Merchandising S a f e w a y ’s operating strategy is to provide value
to its customers by maintaining high store standards and a
wide selection of high quality products at competitive prices.
To provide one-stop shopping for today’s busy shoppers, the
Company emphasizes high quality produce and meat, as well as
specialty departments including in-store bakery, delicatessen,
floral and pharmacy.
Safeway has developed a line of approximately 900 pre m i u m
corporate brand products since 1993 under the “Safeway
SELECT” banner. The award-winning Safeway SELECT
line is designed to offer premium quality products that the
Company believes are equal or superior in quality to compara-
ble best-selling nationally advertised brands, or that are
unique to the category and not available from national brand
m a n u f a c t u rers. The Safeway SELECT line is being intro d u c e d
in Dominick’s stores during the first quarter of 1999.
The Safeway SELECT line of products includes carbonated
soft drinks; unique salsas; the Indulgence line of cookies and
other sweets; the Verdi line of fresh and frozen pastas, pasta
sauces and olive oils; Artisan fresh-baked breads; Twice-the-
Fruit yogurt; NutraBalance Pet Food; Ultra laundry deter-
gents and dish soaps; and Softly paper products. The Safeway
SELECT line also includes an extensive array of ice cre a m ,
f rozen yogurt and sorbets; Healthy Advantage items such
as low-fat ice cream and low-fat cereal bars; and Gourm e t
Club frozen entrees and hors d’oeuvres.
In addition, Safeway has repackaged over 2,500 corporate
brand products primarily under the Safeway, Lucerne and
Mrs. Wright’s labels.
Number Percent of Stores of Total
Less than 30,000 square feet 348 23%30,000 to 50,000 770 52More than 50,000 379 25
■ ■ ■ ■ ■ ■■■ ■ ■■ ■ ■ ■ ■■Total stores 1,497 100%
■ ■ ■ ■ ■ ■■■ ■ ■■ ■ ■ ■ ■■
Manufacturing and Wholesale The principal function of manufac-
turing operations is to purchase, manufacture and process
private label merchandise sold in stores operated by the
C o m p a n y. As measured by sales dollars, approximately one-
half of Safeway’s private label merchandise is manufactured
in Company-owned plants, and the remainder is purchased
from third parties.
During 1993, Safeway began a review to identify manufac-
turing facilities that were not providing acceptable re t u rn s .
This review resulted in the sale or closure of 20 plants fro m
1993 through 1998 and the reorganization of an administrative
office during 1994. In 1998, Safeway opened a new manufactur-
ing facility in California to replace one that was closed in 1997.
The ongoing review of all remaining manufacturing facilities
may result in additional plant closures.
Safeway’s Canadian subsidiary has a wholesale operation
that distributes both national brands and private label prod-
ucts to independent grocery stores and institutional customers.
Safeway operated the following manufacturing and process-
ing facilities at year-end 1998:
In addition, the Company operates laboratory facilities for
quality assurance and re s e a rch and development in certain of
its plants and at its U.S. manufacturing headquarters in Wa l n u t
C reek, California.
Distribution Each of Safeway’s 11 retail operating areas is
s e rved by a regional distribution center consisting of one or
m o re facilities. Safeway has 15 distribution/warehousing cen-
ters (12 in the United States and three in Canada), which col-
lectively provide the majority of all products to Safeway
stores. Safeway’s distribution centers in northern California
and British Columbia are operated by third parties. During
1998, Safeway completed construction of a re p l a c e m e n t
d i s t r i bution center in Maryland.
U.S. Canada
Milk plants 8 3Bread baking plants 6 2Ice cream plants 5 2Cheese and meat packaging plants 1 2Soft drink bottling plants 4 –Fruit and vegetable processing plants 2 3Other food processing plants 3 1Pet food plant 1 –
■ ■ ■ ■ ■ ■ ■ ■ ■ ■ ■■■■■Total 30 13
■ ■ ■ ■ ■ ■ ■ ■ ■ ■ ■■■■■

Capital Expenditure Program
A component of Safeway’s long-term strategy is its capital
expenditure program. The Company’s capital expenditure
program funds, among other things, new stores, remodels,
manufacturing plants, distribution facilities, and information
technology advances. In the last several years, Safeway man-
agement has significantly strengthened its program to select
and approve new capital investments, resulting in improved
returns on investment.
The table below reconciles cash paid for pro p e rty additions
reflected in the Consolidated Statements of Cash Flows to
S a f e w a y ’s broader definition of capital expenditures, and also
details changes in the Company’s store base during such period:
Improved operations and lower project costs have raised
the return on capital projects, allowing Safeway to increase
capital expenditures to $1.2 billion in 1998 and open 46 stores,
remodel 234 stores and complete construction of the new dis-
tribution center in Maryland. In 1999, Safeway expects to
spend approximately $1.2 billion and open 55 to 60 new store s
and complete approximately 250 remodels.
(Dollars in millions) 1998 1997 1996
Cash paid for property additions $1,075.2 $758.2 $ 541.8
Less: Purchases of previously leased properties (35.7) (28.2) (13.2)
Plus: Present value of all lease obligations incurred 117.4 91.3 91.7
Mortgage notes assumed in property acquisitions 32.8 0.9 –
Vons first-quarter expenditures – 7.2 –
■ ■ ■ ■ ■■ ■ ■■ ■ ■ ■ ■■ ■■ ■ ■ ■ ■Total capital expenditures $1,189.7 $829.4 $ 620.3
■ ■ ■ ■ ■■ ■ ■■ ■ ■ ■ ■■ ■■ ■ ■ ■ ■Capital expenditures as
a percent of sales 4.9% 3.7% 3.6%Dominick’s stores acquired 113 – –Vons stores acquired – 316 –Stores opened 46 37 30Stores closed or sold 30 37 37Remodels (Note 1) 234 181 141Total retail square footage
at year-end (in millions) 61.6 53.2 40.7
Note 1: Defined as store projects (other than maintenance) generally requiring expenditures in excess of $200,000.
Performance-Based Compensation
The Company has perf o rmance-based compensation plans
that cover approximately 12,000 management and pro f e s s i o n a l
employees. Perf o rmance-based compensation plans set overall
bonus levels based upon both operating results and working
capital management. Individual bonuses are based on job
p e rf o rmance. Certain employees are covered by capital invest-
ment bonus plans which measure the performance of capital
projects based on operating performance over several years.
Market Risk from Financial Instruments
Safeway manages interest rate risk through the strategic
use of fixed and variable interest rate debt and, to a limited
extent, interest rate derivatives. At year-end 1998,
S a f e w a y ’s derivative instruments consisted of interest rate
cap agreements and an interest rate swap agreement. The
cap agreements expire in May 1999, and entitle Safeway
to receive the excess of LIBOR over 7% on an $850 million
notional amount. Under the swap agreement, which expires
in the year 2007, Safeway pays interest of 6.2% on a $100 mil-
lion notional amount and receives a variable interest rate
based on Federal Reserve rates quoted for commercial paper.
No derivatives are held for trading purposes.
The following table provides information by year of maturi-
ty about the Company’s other financial instruments that ar e
sensitive to interest rate changes:
(Dollars in millions) 1999 2000 2001 2002 2003 Thereafter
C o m m e rcial paper:P r i n c i p a l – – – $1 , 7 4 5 . 1 – –Weighted a v e r a g e
interest rate – – – 5 . 9 9 % – –Bank borro w i n g s :P r i n c i p a l $ 1 6 1 . 8 – – $ 8 9 . 1 – –Weighted average
interest rate 5 . 8 0 % – – 5 . 5 7 % – –L o n g - t e rm debt:*P r i n c i p a l $ 1 1 8 . 0 $ 4 2 7 . 5 $ 5 4 9 . 6 $ 3 7 . 8 $ 3 7 7 . 6 $1 , 0 1 5 . 9Weighted average
interest rate 8 . 9 7 % 5 . 9 3 % 6 . 8 8 % 8 . 9 5 % 6 . 2 8 % 7 . 2 2 %
*Primarily fixed rate debt

Results of OperationsSales $24,484.2 $22,483.8 $17,269.0 $16,397.5 $15,626.6
■ ■ ■ ■ ■ ■ ■ ■ ■ ■ ■ ■ ■ ■ ■ ■ ■ ■ ■ ■ ■ ■ ■ ■ ■ ■ ■ ■ ■ ■ ■ ■ ■ ■ ■ ■ ■ ■ ■ ■ ■ ■ ■ ■ ■ ■ ■ ■ ■ ■ ■ ■ ■ ■ ■ ■ ■ ■ ■ ■ ■ ■ ■ ■ ■ ■ ■ ■
Gross profit 7,124.5 6,414.7 4,774.2 4,492.4 4,287.3
Operating and administrative expense (5,522.8) (5,135.0) (3,882.5) (3,765.0) (3,675.2)■ ■ ■ ■ ■ ■ ■ ■ ■ ■ ■ ■ ■ ■ ■ ■ ■ ■ ■ ■ ■ ■ ■ ■ ■ ■ ■ ■ ■ ■ ■ ■ ■ ■ ■ ■ ■ ■ ■ ■ ■ ■ ■ ■ ■ ■ ■ ■ ■ ■ ■ ■ ■ ■ ■ ■ ■ ■ ■ ■ ■ ■ ■ ■ ■ ■ ■ ■
Operating profit 1,601.7 1,279.7 891.7 727.4 612.1
Interest expense (235.0) (241.2) (178.5) (199.8) (221.7)
Equity in earnings of unconsolidated
affiliates (Note 1) 28.5 34.9 50.0 26.9 27.3
Other income, net 1.7 2.9 4.4 2.0 6.4■ ■ ■ ■ ■ ■ ■ ■ ■ ■ ■ ■ ■ ■ ■ ■ ■ ■ ■ ■ ■ ■ ■ ■ ■ ■ ■ ■ ■ ■ ■ ■ ■ ■ ■ ■ ■ ■ ■ ■ ■ ■ ■ ■ ■ ■ ■ ■ ■ ■ ■ ■ ■ ■ ■ ■ ■ ■ ■ ■ ■ ■ ■ ■ ■ ■ ■ ■
Income before income taxes
and extraordinary loss 1,396.9 1,076.3 767.6 556.5 424.1
Income taxes (590.2) (454.8) (307.0) (228.2) (173.9)■ ■ ■ ■ ■ ■ ■ ■ ■ ■ ■ ■ ■ ■ ■ ■ ■ ■ ■ ■ ■ ■ ■ ■ ■ ■ ■ ■ ■ ■ ■ ■ ■ ■ ■ ■ ■ ■ ■ ■ ■ ■ ■ ■ ■ ■ ■ ■ ■ ■ ■ ■ ■ ■ ■ ■ ■ ■ ■ ■ ■ ■ ■ ■ ■ ■ ■ ■
Income before extraordinary loss 806.7 621.5 460.6 328.3 250.2
Extraordinary loss, net of tax benefit
of $41.1, $1.3 and $6.7 – (64.1) – (2.0) (10.5)■ ■ ■ ■ ■ ■ ■ ■ ■ ■ ■ ■ ■ ■ ■ ■ ■ ■ ■ ■ ■ ■ ■ ■ ■ ■ ■ ■ ■ ■ ■ ■ ■ ■ ■ ■ ■ ■ ■ ■ ■ ■ ■ ■ ■ ■ ■ ■ ■ ■ ■ ■ ■ ■ ■ ■ ■ ■ ■ ■ ■ ■ ■ ■ ■ ■ ■ ■
Net income $ 806.7 $ 557.4 $ 460.6 $ 326.3 $ 239.7■ ■ ■ ■ ■ ■ ■ ■ ■ ■ ■ ■ ■ ■ ■ ■ ■ ■ ■ ■ ■ ■ ■ ■ ■ ■ ■ ■ ■ ■ ■ ■ ■ ■ ■ ■ ■ ■ ■ ■ ■ ■ ■ ■ ■ ■ ■ ■ ■ ■ ■ ■ ■ ■ ■ ■ ■ ■ ■ ■ ■ ■ ■ ■ ■ ■ ■ ■
Diluted earnings per share:
Income before extraordinary loss $ 1.59 $ 1.25 $ 0.97 $ 0.68 $ 0.51
Extraordinary loss – (0.13) – – (0.02)■ ■ ■ ■ ■ ■ ■ ■ ■ ■ ■ ■ ■ ■ ■ ■ ■ ■ ■ ■ ■ ■ ■ ■ ■ ■ ■ ■ ■ ■ ■ ■ ■ ■ ■ ■ ■ ■ ■ ■ ■ ■ ■ ■ ■ ■ ■ ■ ■ ■ ■ ■ ■ ■ ■ ■ ■ ■ ■ ■ ■ ■ ■ ■ ■ ■ ■ ■
Net income $ 1.59 $ 1.12 $ 0.97 $ 0.68 $ 0.49■ ■ ■ ■ ■ ■ ■ ■ ■ ■ ■ ■ ■ ■ ■ ■ ■ ■ ■ ■ ■ ■ ■ ■ ■ ■ ■ ■ ■ ■ ■ ■ ■ ■ ■ ■ ■ ■ ■ ■ ■ ■ ■ ■ ■ ■ ■ ■ ■ ■ ■ ■ ■ ■ ■ ■ ■ ■ ■ ■ ■ ■ ■ ■ ■ ■ ■ ■
Financial StatisticsIdentical-store sales increases (Note 2) 3.7% 1.3% 5.1% 4.6% 4.4%
Gross profit margin 29.10% 28.53% 27.65% 27.40% 27.44%
Operating and administrative expense margin 22.56% 22.84% 22.48% 22.96% 23.52%
Operating profit margin 6.5% 5.7% 5.2% 4.4% 3.9%
Capital expenditures (Note 3) $ 1,189.7 $ 829.4 $ 620.3 $ 503.2 $ 352.2
Depreciation and amortization 531.4 455.8 338.5 329.7 326.4
Total assets 11,389.6 8,493.9 5,545.2 5,194.3 5,022.1
Total debt 4,972.1 3,340.3 1,984.2 2,190.2 2,196.1
Stockholders’ equity 3,082.1 2,149.0 1,186.8 795.5 643.8
Weighted average shares outstanding –
Diluted (in millions) 508.8 497.7 475.7 481.2 494.2
Other StatisticsDominick’s stores acquired during the year 113 – – – –
Vons stores acquired during the year – 316 – – –
Stores opened during the year 46 37 30 32 20
Stores closed or sold during the year 30 37 37 35 36
Total stores at year-end 1,497 1,368 1,052 1,059 1,062
Remodels completed during the year (Note 4) 234 181 141 108 71
Total retail square footage
at year-end (in millions) 61.6 53.2 40.7 40.1 39.5
52 Weeks 53 Weeks 52 Weeks 52 Weeks 52 Weeks(Dollars in millions, except per-share amounts) 1998 1997 1996 1995 1994
Note 1. Includes equity in Vons’ earnings through the first quarter of 1997.Note 2. Reflects sales increases for stores operating the entire measurement period in both the current and prior periods.
1997 and 1996 identical-store sales exclude British Columbia stores, which were closed during a labor dispute in 1996.Note 3. Defined in the table on page 14 under “Capital Expenditure Program.”Note 4. Defined as store projects (other than maintenance) generally requiring expenditures in excess of $200,000.
Five-Year Summary Financial Information

Financial Review
Acquisition of Dominick’sSupermarkets, Inc.(“Dominick’s”) In November 1998,
Safeway completed its
acquisition of all of the
outstanding shares of
Dominick’s for $49 cash
per share, or a total of
approximately $1.2 bil-
lion (the “Dominick’s
Acquisition”). Dominick’s
is the second largest
supermarket operator
in the Chicago metropoli-
tan area with 114 stores, two distribution facilities and a dairy
processing plant. Safeway funded the Dominick’s Acquisition,
including the repayment of approximately $560 million of debt
and lease obligations, with a combination of bank borro w i n g s
and commercial paper. Sales for fiscal 1998 were $2.4 billion.
Merger with The Vons Companies, Inc. (“Vons”)In April 1997, Safeway completed a merger with Vons pur-
suant to which the Company issued 83.2 million shares of
Safeway common stock for all of the shares of Vons common
stock that it did not already own (the “Vons Merger”).
In connection with the Vons Merger, Safeway repurchased
64.0 million shares of its common stock from a part n e r s h i p
affiliated with KKR &
Co., L.L.C. at $21.50 per
s h a re, for an aggre g a t e
purchase price of $1.376
billion. Safeway funded
the re p u rchase with
bank borrowings.
Results of OperationsSafeway’s net income was
$806.7 million ($1.59 per
s h a re) in 1998, $557.4 mil-
lion ($1.12 per share) in
1997 and $460.6 million
($0.97 per share) in 1996.
In 1997, income before an
e x t r a o rd i n a ry item related to debt refinancing was $621.5 mil-
lion ($1.25 per share).
S a f e w a y ’s 1998 income statement includes Vons’ operating
results for the full year and Dominick’s operating results since
a p p roximately midway through Safeway’s fourth quart e r.
S a f e w a y ’s 1997 income statement includes Vons’ operating
results since the second quarter plus the effect of Safeway’s
34.4% equity interest in Vons in the first quarter of 1997.
The 1996 income statement reflects Safeway’s 34.4% equity
i n t e rest in Vons for the full year. In order to facilitate an
understanding of the Company’s operations, this financial
review presents certain pro forma information based on the
1997 and 1996 combined historical financial statements as if
the Vons Merger had been effective as of the beginning of 1997
and 1996. See Note B to the Company’s 1998 consolidated
financial statements.
During the second quarter of 1997, Safeway was engaged
in a 75-day labor dispute affecting 74 stores in the Albert a ,
Canada operating area. The Company estimates that the strike
reduced 1997 net income by approximately $0.04 per share .
Labor disputes in the British Columbia and Denver operating
a reas reduced 1996 net income by an estimated $0.07 per share.
Sales S t rong store operations helped to increase identical-store
sales (stores operating the entire year in both 1998 and 1997,
excluding replacement stores) 3.7% in 1998, while comparable-
store sales, which includes replacement stores, increased 4.1%.
In 1997, identical-store sales increased 1.3% while comparable-
store sales increased 2.2%. Total sales for the 52 weeks of 1998
w e re $24.5 billion, compared to $22.5 billion for the 53 weeks
of 1997 and $17.3 billion for the 52 weeks of 1996. Total sales
i n c reases are attributed to comparable-store sales increases, the
Vons Merger in 1997, and the Dominick’s Acquisition in 1998.
Gross Profit Safeway’s continuing improvement in buying
practices and product mix helped to increase gross profit to
29.10% of sales in 1998, from 28.53% in 1997 and 27.65% in
1996. On a pro forma basis, gross profit increased to 28.63% in
1997 from 28.20% in 1996. Application of the LIFO method
resulted in an increase in cost of goods sold of $7.1 million in
1998, a decrease of $6.1 million in 1997, and an increase of
$4.9 million in 1996.
Operating and Administrative Expense Operating and administra-
tive expense was 22.56% of sales in 1998 compared to 22.84% in
1997 and 22.48% in 1996. Safeway’s operating and administra-
tive expense-to-sales ratio increased in 1997 because Vo n s ’

operating and administrative expense ratio had historically
been higher than Safeway’s. Increased sales and ongoing eff o rt s
to reduce or control expenses improved this expense ratio in
1998. Goodwill amortization has increased to $56.3 million in
1998 from $41.8 million in 1997 and $10.4 million in 1996 pri-
marily as a result of the Vons Merg e r. On a pro forma basis,
operating and administrative expense declined 35 basis points
to 22.95% in 1997 from 23.30% in 1996.
Interest Expense Interest expense was $235.0 million in 1998,
compared to $241.2 million in 1997 and $178.5 million in 1996.
I n t e rest expense increased in 1997 because of the debt
i n c u rred during the second quarter to re p u rchase stock in
connection with the Vons Merg e r. Interest expense in 1998
included debt incurred in connection with the Dominick’s
Acquisition, which was partially offset by the paydown of
certain other indebtedness.
During 1997, Safeway re c o rded an extraord i n a ry loss of
$64.1 million ($0.13 per share) for the redemption of $589.0 mil-
lion of Safeway’s public debt, $285.5 million of Vons’ public
debt, and $40.0 million of medium-term notes. These re d e m p-
tions were financed with $600 million of new public senior debt
securities and the balance with commercial paper.
In 1997, Safeway entered into interest rate cap agre e m e n t s
which expire in 1999 and entitle the Company to receive fro m
c o u n t e r p a rties the amounts, if any, by which interest at LIBOR
on an $850 million notional amount exceeds 7%. The unamor-
tized cost to purchase the cap agreements was $0.6 million at
year-end 1998.
As of year-end 1998, the Company had effectively convert e d
$100.0 million of its floating rate debt to fixed interest rate
debt through an interest rate swap agreement which expires
in 2007. Under the swap agreement, Safeway pays interest of
6.2% on the $100.0 million notional amount and receives a vari-
able interest rate based on Federal Reserve rates quoted for
commercial paper. Interest rate swap and cap agreements
increased interest expense by $2.8 million in 1998, $3.3 million
in 1997 and $3.0 million in 1996.
Equity in Earnings of Unconsolidated Affiliates S a f e w a y ’s invest-
ment in affiliates consists of a 49% ownership interest in Casa
L e y, S.A. de C.V. (“Casa Ley”), which at year-end 1998 operated
77 food and general merchandise stores in western Mexico.
Through the first quarter of 1997, Safeway also held a 34.4%
interest in Vons. Safeway re c o rds its equity in earnings of
unconsolidated affiliates on a one-quarter delay basis.
Income from Safeway’s equity investment in Casa Ley
i n c reased to $28.5 million in 1998, from $22.7 million in 1997
and $18.8 million in 1996. Casa Ley’s financial results have
been improving since 1995, when Mexico suff e red from the
adverse effects of high interest rates and inflation.
Equity in earnings of unconsolidated affiliates included
Safeway’s share of Vons’ earnings of $12.2 million in the first
quarter of 1997 and $31.2 million for the year in 1996.
Liquidity and Financial ResourcesNet cash flow from operations was $1,252.7 million in 1998,
$1,221.6 million in 1997 and $825.2 million in 1996. Net cash
flow from operations increased in 1997 largely due to incre a s e d
net income and changes in working capital.
Cash flow used by investing activities was $2,186.4 million
in 1998, $607.7 million in 1997 and $482.3 million in 1996. The
i n c reases in cash used by investing activities is primarily
due to the Dominick’s Acquisition in 1998, as well as incre a s e d
capital expenditures in both 1998 and 1997. Safeway opened
46 new stores and remodeled 234 stores in 1998. In 1997,
Safeway opened 37 new stores and remodeled 181 stores.
The Company built a new distribution center in Mary l a n d
during 1997 and 1998, and opened a new manufacturing plant
in California in 1998.
Cash flow from financing activities was $903.4 million
in 1998 primarily due to increased borrowing related to the
D o m i n i c k ’s Acquisition. Cash flow used by financing activities
was $614.6 million in 1997 and $337.5 million in 1996, reflect-
ing Safeway’s reduction of total debt in 1996, followed b y
i n c reased borrowing related to the Vons Merger in 1997.
Net cash flow from operations as presented on the
Statements of Cash Flows is an important measure of cash
generated by the Company’s operating activities. Operating
cash flow, as defined below, is similar to net cash flow fro m
operations because it excludes certain non-cash items.
H o w e v e r, operating cash flow also excludes interest expense
and income taxes. Management believes that operating cash
flow is relevant because it assists investors in evaluating
S a f e w a y ’s ability to service its debt by providing a commonly
used measure of cash available to pay interest. Operating cash
flow also facilitates comparisons of Safeway’s results of opera-
tions with companies having diff e rent capital stru c t u res. Other
companies may define operating cash flow diff e re n t l y, and as a
result, such measures may not be comparable to Safeway’s
operating cash flow. Safeway’s computation of operating cash
flow is as follows:
(Dollars in millions) 1998 1997 1996
Income before income taxes and extraordinary loss $1,396.9 $1,076.3 $ 767.6
LIFO expense (income) 7.1 (6.1) 4.9Interest expense 235.0 241.2 178.5Depreciation and amortization 531.4 455.8 338.5Equity in earnings of
unconsolidated affiliates (28.5) (34.9) (50.0)■ ■ ■ ■■ ■■ ■ ■ ■ ■■ ■■ ■ ■
Operating cash flow $2,141.9 $1,732.3 $1,239.5■ ■ ■ ■■ ■■ ■ ■ ■ ■■ ■■ ■ ■
As a percent of sales 8.75% 7.70% 7.18%■ ■ ■ ■■ ■■ ■ ■ ■ ■■ ■■ ■ ■
As a multiple of interest expense (interest coverage ratio) 9.11x 7.18x 6.94x
■ ■ ■ ■■ ■■ ■ ■ ■ ■■ ■■ ■ ■

Total debt, including capital leases, increased to $4.97 bil-
lion at year-end 1998 from $3.34 billion at year-end 1997 and
$1.98 billion at year-end 1996, primarily due to the Dominick’s
Acquisition and Vons Merger. Annual debt maturities over the
next five years are set forth in Note C of the Company’s 1998
consolidated financial statements.
Based upon the current level of operations, Safeway believes
that operating cash flow and other sources of liquidity, including
b o rrowings under Safeway’s commercial paper program and
bank credit agreement, will be adequate to meet anticipated
re q u i rements for working capital, capital expenditures, intere s t
payments and scheduled principal payments for the fore s e e a b l e
f u t u re. There can be no assurance, however, that the Company’s
business will continue to generate cash flow at or above curre n t
levels. The bank credit agreement is used primarily as a backup
facility to the commercial paper pro g r a m .
Year 2000 ComplianceThe year 2000 issue is the result of computer programs that
were written using two digits rather than four to define the
applicable year. For example, computer programs that have
time-sensitive software may recognize a date using “00” as
the year 1900 rather than the year 2000. To the extent that
the Company’s software applications contain source code that
is unable to interpret appropriately the upcoming calendar
year 2000 and beyond, some level of modification or replace-
ment of such applications will be necessary to avoid system
failures and the temporary inability to process transactions
or engage in other normal business activities.
In 1997, the Company established a year 2000 project gro u p ,
headed by Safeway’s Chief Information Off i c e r, to coord i n a t e
the Company’s year 2000 compliance eff o rts. The project
group is staffed primarily with representatives of Safeway’s
Information Technology department and also uses outside con-
sultants on an as-needed basis. The Chief Information Officer
re p o rts regularly on the status of the year 2000 project to a
steering committee headed by the Chief Executive Officer
and to the Company’s Board of Directors.
The year 2000 project group has identified all computer-
based systems and applications (including embedded systems)
the Company uses in its operations that might not be year 2000
compliant, and has categorized these systems and applications
into three priority levels based on how critical the system or
application is to the Company’s operations. The year 2000 pro-
ject group is determining what modifications or replacements
will be necessary to achieve compliance; implementing the
modifications and replacements; conducting tests necessary
to verify that the modified systems are operational; and trans i-
tioning the compliant systems into the Company’s re g u l a r
operations. The systems and applications in the highest priori-
ty level are being assessed and modified or replaced first.
Management estimates that these actions with respect to all
priority levels are approximately 80% complete at year-end
1998. The Company estimates that all critical systems and
applications will be year 2000 compliant by June 30, 1999.
Safeway completed its acquisition of Dominick’s in
November 1998 and is in the process of identifying which sys-
tems and applications of Dominick’s might not be year 2000
compliant, and integrating those systems and applications into
its year 2000 project. The Company estimates that all critical
systems and applications of Dominick’s will be year 2000 com-
pliant by September 30, 1999.
The year 2000 project group is also examining Safeway’s
relationships with certain key outside vendors and others with
whom the Company has significant business relationships to
determine, to the extent practical, the degree of such outside
p a rties’ year 2000 compliance. The project group has begun test-
ing procedures with certain vendors identified as having poten-
tial year 2000 compliance issues. Management does not believe
that the Company’s relationship with any third party is materi-
al to Safeway’s operations and, therefore, does not believe that
the failure of any particular third party to be year 2000 compli-
ant would have a material adverse effect on the Company.
The year 2000 project group is in the process of establishing
and implementing a contingency plan to provide for viable
a l t e rnatives to ensure that the Company’s core business opera-
tions are able to continue in the event of a year 2000-related
systems failure. Management expects to have a compre h e n s i v e
contingency plan established by March 31, 1999.
Through January 31, 1999, Safeway spent approximately
$20.5 million to address year 2000 compliance issues. The
Company estimates that it will incur an additional $12.5 million,
for a total of $33.0 million, (including $8 million for
D o m i n i c k ’s) to address year 2000 compliance issues for
Safeway and Dominick‘s, which includes the estimated costs of
all modifications, testing and consultants’ fees.
Management believes that, should Safeway or any t h i rd
p a rty with whom the Company has a significant business re l a-
tionship have a year 2000-related systems failure, the most sig-
nificant impact would likely be the inability, with respect to
a group of stores, to conduct operations due to a power failure,
to deliver inventory in a timely fashion, to receive cert a i n
products from vendors or to process electronically customer
sales at store level. The Company does not anticipate that any
such impact would be material to Safeway’s liquidity or re s u l t s
of operations.
Forward-Looking StatementsThis Annual Report contains certain forw a rd-looking state-
ments relating to, among other things, capital expenditure s ,
cost reduction, operating improvements and year 2000 compli-
ance. Such statements are subject to inherent uncertainties and
risks, including among others: business and economic conditions
generally in the Company’s operating regions; pricing pre s s u re s
and other competitive factors; results of the Company’s pro-
grams to reduce costs; the ability to integrate Vons and
D o m i n i c k ’s and continue to achieve operating impro v e m e n t s ;
relations with union bargaining units; and the availability and
t e rms of financing. Consequently, actual events and results may
vary significantly from those included in or contemplated or
implied by such statements.

Sales $ 24,484.2 $ 22,483.8 $ 17,269.0
Cost of goods sold (17,359.7) (16,069.1) (12,494.8)■ ■ ■ ■ ■ ■ ■ ■ ■ ■ ■ ■ ■ ■ ■ ■ ■ ■ ■ ■ ■ ■ ■ ■ ■ ■ ■ ■
Gross profit 7,124.5 6,414.7 4,774.2
Operating and administrative expense (5,522.8) (5,135.0) (3,882.5)■ ■ ■ ■ ■ ■ ■ ■ ■ ■ ■ ■ ■ ■ ■ ■ ■ ■ ■ ■ ■ ■ ■ ■ ■ ■ ■ ■
Operating profit 1,601.7 1,279.7 891.7
Interest expense (235.0) (241.2) (178.5)
Equity in earnings of unconsolidated affiliates 28.5 34.9 50.0
Other income, net 1.7 2.9 4.4■ ■ ■ ■ ■ ■ ■ ■ ■ ■ ■ ■ ■ ■ ■ ■ ■ ■ ■ ■ ■ ■ ■ ■ ■ ■ ■ ■
Income before income taxes and extraordinary loss 1,396.9 1,076.3 767.6
Income taxes (590.2) (454.8) (307.0)■ ■ ■ ■ ■ ■ ■ ■ ■ ■ ■ ■ ■ ■ ■ ■ ■ ■ ■ ■ ■ ■ ■ ■ ■ ■ ■ ■
Income before extraordinary loss 806.7 621.5 460.6
Extraordinary loss related to early retirement of debt,
net of income tax benefit of $41.1 – (64.1) –■ ■ ■ ■ ■ ■ ■ ■ ■ ■ ■ ■ ■ ■ ■ ■ ■ ■ ■ ■ ■ ■ ■ ■ ■ ■ ■ ■
Net income $ 806.7 $ 557.4 $ 460.6■ ■ ■ ■ ■ ■ ■ ■ ■ ■ ■ ■ ■ ■ ■ ■ ■ ■ ■ ■ ■ ■ ■ ■ ■ ■ ■ ■
Basic earnings per share:
Income before extraordinary loss $ 1.67 $ 1.35 $ 1.06
Extraordinary loss – (0.14) –■ ■ ■ ■ ■ ■ ■ ■ ■ ■ ■ ■ ■ ■ ■ ■ ■ ■ ■ ■ ■ ■ ■ ■ ■ ■ ■ ■
Net income $ 1.67 $ 1.21 $ 1.06■ ■ ■ ■ ■ ■ ■ ■ ■ ■ ■ ■ ■ ■ ■ ■ ■ ■ ■ ■ ■ ■ ■ ■ ■ ■ ■ ■
Diluted earnings per share:
Income before extraordinary loss $ 1.59 $ 1.25 $ 0.97
Extraordinary loss – (0.13) –■ ■ ■ ■ ■ ■ ■ ■ ■ ■ ■ ■ ■ ■ ■ ■ ■ ■ ■ ■ ■ ■ ■ ■ ■ ■ ■ ■
Net income $ 1.59 $ 1.12 $ 0.97■ ■ ■ ■ ■ ■ ■ ■ ■ ■ ■ ■ ■ ■ ■ ■ ■ ■ ■ ■ ■ ■ ■ ■ ■ ■ ■ ■
Weighted average shares outstanding – basic 482.8 462.3 436.0
Weighted average shares outstanding – diluted 508.8 497.7 475.7
52 Weeks 53 Weeks 52 Weeks(In millions, except per-share amounts) 1998 1997 1996
Consolidated Statements of Income
See accompanying notes to consolidated financial statements.

AssetsCurrent assets:
Cash and equivalents $ 45.7 $ 77.2
Receivables 200.1 180.8
Merchandise inventories, net of LIFO
reserve of $80.2 and $73.1 1,856.0 1,613.2
Prepaid expenses and other current assets 218.1 158.5■ ■ ■ ■ ■ ■ ■ ■ ■■ ■■ ■■ ■■ ■ ■ ■ ■
Total current assets 2,319.9 2,029.7■ ■ ■ ■ ■ ■ ■ ■ ■■ ■■ ■■ ■■ ■ ■ ■ ■
Property:
Land 794.1 722.2
Buildings 2,069.9 1,719.9
Leasehold improvements 1,498.3 1,247.3
Fixtures and equipment 3,282.6 2,663.1
Property under capital leases 379.2 329.2■ ■ ■ ■ ■ ■ ■ ■ ■■ ■■ ■■ ■■ ■ ■ ■ ■
8,024.1 6,681.7
Less accumulated depreciation and amortization (2,841.5) (2,566.4)■ ■ ■ ■ ■ ■ ■ ■ ■■ ■■ ■■ ■■ ■ ■ ■ ■
Total property, net 5,182.6 4,115.3
Goodwill, net of accumulated amortization of $211.0 and $157.0 3,348.0 1,824.7
Prepaid pension costs 369.6 341.4
Investment in unconsolidated affiliate 115.2 97.7
Other assets 54.3 85.1■ ■ ■ ■ ■ ■ ■ ■ ■■ ■■ ■■ ■■ ■ ■ ■ ■
Total assets $11,389.6 $ 8,493.9■ ■ ■ ■ ■ ■ ■ ■ ■■ ■■ ■■ ■■ ■ ■ ■ ■
Year-End Year-End(In millions) 1998 1997
Consolidated Balance Sheets

Liabilities and Stockholders’ EquityCurrent liabilities:
Current maturities of notes and debentures $ 279.8 $ 277.4
Current obligations under capital leases 41.7 22.0
Accounts payable 1,595.9 1,391.8
Accrued salaries and wages 348.9 310.5
Other accrued liabilities 627.3 536.9■ ■ ■ ■ ■ ■ ■ ■ ■ ■ ■■ ■ ■ ■■ ■ ■ ■ ■
Total current liabilities 2,893.6 2,538.6■ ■ ■ ■ ■ ■ ■ ■ ■ ■ ■■ ■ ■ ■■ ■ ■ ■ ■
Long-term debt:
Notes and debentures 4,242.6 2,817.8
Obligations under capital leases 408.0 223.1■ ■ ■ ■ ■ ■ ■ ■ ■ ■ ■■ ■ ■ ■■ ■ ■ ■ ■
Total long-term debt 4,650.6 3,040.9
Deferred income taxes 216.9 297.0
Accrued claims and other liabilities 546.4 468.4■ ■ ■ ■ ■ ■ ■ ■ ■ ■ ■■ ■ ■ ■■ ■ ■ ■ ■
Total liabilities 8,307.5 6,344.9■ ■ ■ ■ ■ ■ ■ ■ ■ ■ ■■ ■ ■ ■■ ■ ■ ■ ■
Commitments and contingencies
Stockholders’ equity:
Common stock: par value $0.01 per share;
1,500 shares authorized; 550.9 and 537.4 shares outstanding 5.5 5.3
Additional paid-in capital 2,599.9 2,467.4
Accumulated other comprehensive (loss) income (19.7) 0.6
Retained earnings 1,925.0 1,315.0■ ■ ■ ■ ■ ■ ■ ■ ■ ■ ■■ ■ ■ ■■ ■ ■ ■ ■
4,510.7 3,788.3
Less: Treasury stock at cost; 60.6 and 61.2 shares (1,302.6) (1,316.6)
Unexercised warrants purchased (126.0) (322.7)■ ■ ■ ■ ■ ■ ■ ■ ■ ■ ■■ ■ ■ ■■ ■ ■ ■ ■
Total stockholders’ equity 3,082.1 2,149.0■ ■ ■ ■ ■ ■ ■ ■ ■ ■ ■■ ■ ■ ■■ ■ ■ ■ ■
Total liabilities and stockholders’ equity $11,389.6 $ 8,493.9■ ■ ■ ■ ■ ■ ■ ■ ■ ■ ■■ ■ ■ ■■ ■ ■ ■ ■
Year-End Year-End(In millions, except per share amounts) 1998 1997
See accompanying notes to consolidated financial statements.

Cash Flow from OperationsNet income $ 806.7 $ 557.4 $ 460.6
Reconciliation to net cash flow from operations:
Extraordinary loss related to early retirement of debt,
before income tax benefit – 105.2 –
Depreciation and amortization 531.4 455.8 338.5
Amortization of deferred finance costs 1.6 1.7 1.8
Deferred income taxes 59.4 55.9 113.9
LIFO expense (income) 7.1 (6.1) 4.9
Equity in earnings of unconsolidated affiliates (28.5) (34.9) (50.0)
Net pension (income) expense (18.3) (4.1) 4.2
Contributions to Canadian pension plans (6.8) (10.0) (10.6)
Decrease in accrued claims and other liabilities (17.5) (13.9) (17.6)
Other 13.3 (12.4) (12.6)
Changes in working capital items:
Receivables (5.5) 25.8 (8.5)
Inventories at FIFO cost (48.0) 37.5 (99.3)
Prepaid expenses and other current assets (36.9) 2.7 (35.1)
Payables and accruals (5.3) 61.0 135.0■ ■ ■ ■ ■ ■ ■ ■ ■ ■■ ■ ■■ ■ ■ ■ ■ ■ ■ ■ ■ ■ ■ ■■ ■■ ■ ■ ■ ■ ■ ■ ■ ■ ■
Net cash flow from operations 1,252.7 1,221.6 825.2■ ■ ■ ■ ■ ■ ■ ■ ■ ■■ ■ ■■ ■ ■ ■ ■ ■ ■ ■ ■ ■ ■ ■■ ■■ ■ ■ ■ ■ ■ ■ ■ ■ ■
Cash Flow from Investing ActivitiesCash paid for property additions (1,075.2) (758.2) (541.8)
Proceeds from sale of property 47.6 75.6 60.8
Net cash used to acquire Dominick’s (1,144.9) – –
Net cash acquired in merger with Vons – 55.3 –
Other (13.9) 19.6 (1.3)■ ■ ■ ■ ■ ■ ■ ■ ■ ■■ ■ ■■ ■ ■ ■ ■ ■ ■ ■ ■ ■ ■ ■■ ■■ ■ ■ ■ ■ ■ ■ ■ ■ ■
Net cash flow used by investing activities (2,186.4) (607.7) (482.3)■ ■ ■ ■ ■ ■ ■ ■ ■ ■■ ■ ■■ ■ ■ ■ ■ ■ ■ ■ ■ ■ ■ ■■ ■■ ■ ■ ■ ■ ■ ■ ■ ■ ■
52 Weeks 53 Weeks 52 Weeks(In millions) 1998 1997 1996
Consolidated Statements of Cash Flows

Cash Flow from Financing ActivitiesAdditions to short-term borrowings $ 251.7 $ 414.5 $ 227.2
Payments on short-term borrowings (299.9) (287.5) (280.4)
Additions to long-term borrowings 2,722.3 4,254.3 387.1
Payments on long-term borrowings (1,789.9) (3,553.5) (552.0)
Purchase of treasury stock – (1,376.0) –
Purchase of unexercised warrants – – (126.5)
Net proceeds from exercise of warrants and stock options 34.5 43.9 12.6
Premiums paid on early retirement of debt – (97.7) –
Other (15.3) (12.6) (5.5)■ ■ ■ ■ ■ ■ ■ ■■ ■ ■■ ■■ ■ ■ ■ ■ ■ ■ ■ ■ ■ ■ ■■ ■■ ■ ■ ■ ■ ■ ■ ■ ■ ■
Net cash flow from (used by) financing activities 903.4 (614.6) (337.5)■ ■ ■ ■ ■ ■ ■ ■■ ■ ■■ ■■ ■ ■ ■ ■ ■ ■ ■ ■ ■ ■ ■■ ■■ ■ ■ ■ ■ ■ ■ ■ ■ ■
Effect of changes in exchange rates on cash (1.2) (1.8) (0.5)■ ■ ■ ■ ■ ■ ■ ■■ ■ ■■ ■■ ■ ■ ■ ■ ■ ■ ■ ■ ■ ■ ■■ ■■ ■ ■ ■ ■ ■ ■ ■ ■ ■
Increase (decrease) in cash and equivalents (31.5) (2.5) 4.9
Cash and EquivalentsBeginning of year 77.2 79.7 74.8
■ ■ ■ ■ ■ ■ ■ ■■ ■ ■■ ■■ ■ ■ ■ ■ ■ ■ ■ ■ ■ ■ ■■ ■■ ■ ■ ■ ■ ■ ■ ■ ■ ■
End of year $ 45.7 $ 77.2 $ 79.7■ ■ ■ ■ ■ ■ ■ ■■ ■ ■■ ■■ ■ ■ ■ ■ ■ ■ ■ ■ ■ ■ ■■ ■■ ■ ■ ■ ■ ■ ■ ■ ■ ■
Other Cash Flow InformationCash payments during the year for:
Interest $ 241.0 $ 263.6 $ 181.8
Income taxes, net of refunds 468.7 214.6 156.7
Noncash Investing and Financing ActivitiesStock issued for acquisition of Vons – 1,693.0 –
Tax benefit from stock options exercised 85.2 42.4 51.9
Capital lease obligations entered into 34.2 37.3 15.5
Mortgage notes assumed in property additions 32.8 0.9 –
52 Weeks 53 Weeks 52 Weeks(In millions) 1998 1997 1996
See accompanying notes to consolidated financial statements.

Balance, year-end 1995 427.4 $4.2 $ 682.8 $(196.2) $ 284.4 $ 20.3 $ 795.5
Net income – – – – 460.6 – 460.6 $460.6
Translation adjustments – – – – – (8.3) (8.3) (8.3)
Options and warrants
exercised 15.4 0.2 64.3 – – – 64.5 –
Stock bonuses – – 1.0 – – – 1.0 –
Unexercised warrants
purchased – – – (126.5) – – (126.5) –■ ■ ■ ■ ■ ■ ■ ■ ■ ■ ■ ■ ■ ■ ■ ■ ■ ■ ■ ■ ■■ ■ ■ ■ ■ ■ ■ ■ ■ ■ ■ ■ ■ ■ ■ ■ ■ ■ ■ ■ ■ ■ ■ ■ ■ ■ ■ ■ ■ ■ ■■ ■ ■ ■■ ■ ■ ■ ■ ■ ■ ■ ■ ■ ■ ■ ■ ■ ■ ■ ■ ■ ■ ■ ■ ■ ■ ■ ■ ■ ■ ■ ■ ■ ■ ■ ■ ■ ■ ■ ■ ■
Balance, year-end 1996 442.8 4.4 748.1 (322.7) 745.0 12.0 1,186.8 $452.3
Net income – – – – 557.4 557.4 $557.4
Translation adjustments – – – – – (11.4) (11.4) (11.4)
Equity in Vons’ premerger
earnings due to timing
of recording earnings – – – – 12.6 – 12.6 –
Shares issued for
acquisition of Vons 83.2 0.8 1,692.2 – – – 1,693.0 –
Treasury stock purchased – – – (64.0) $(1,376.0) – – – (1,376.0) –
Options and warrants
exercised 11.4 0.1 26.8 2.8 59.4 – – – 86.3 –
Stock bonuses – – 0.3 – – – – – 0.3 –■ ■ ■ ■ ■ ■ ■ ■ ■ ■ ■ ■ ■ ■ ■ ■ ■ ■ ■ ■ ■ ■ ■ ■ ■ ■ ■ ■ ■ ■ ■ ■ ■ ■ ■ ■ ■ ■ ■ ■ ■ ■ ■ ■ ■ ■ ■ ■ ■ ■ ■ ■ ■ ■ ■ ■ ■ ■ ■ ■ ■ ■ ■ ■ ■ ■ ■ ■ ■ ■ ■ ■ ■ ■ ■ ■ ■
Balance, year-end 1997 537.4 5.3 2,467.4 (61.2) (1,316.6) (322.7) 1,315.0 0.6 2,149.0 $546.0
Net income – – – – – – 806.7 – 806.7 $806.7
Translation adjustments – – – – – – – (20.3) (20.3) (20.3)
Dominick’s options converted – – 27.0 – – – – – 27.0 –
Options and warrants
exercised 13.5 0.2 105.5 0.6 14.0 – – – 119.7 –
Warrants canceled – – – – – 196.7 (196.7) – – –■ ■ ■ ■ ■ ■ ■ ■ ■ ■ ■ ■ ■ ■ ■ ■ ■ ■ ■ ■ ■ ■ ■ ■ ■ ■ ■ ■ ■ ■ ■ ■ ■ ■ ■ ■ ■ ■ ■ ■ ■ ■ ■ ■ ■ ■ ■ ■ ■ ■ ■ ■ ■ ■ ■ ■ ■ ■ ■ ■ ■ ■ ■ ■ ■ ■ ■ ■ ■ ■ ■ ■ ■ ■ ■ ■ ■
Balance, year-end 1998 550.9 $5.5 $2,599.9 (60.6) $(1,302.6) $(126.0) $1,925.0 $(19.7) $ 3,082.1 $786.4■ ■ ■ ■ ■ ■ ■ ■ ■ ■ ■ ■ ■ ■ ■ ■ ■ ■ ■ ■ ■ ■ ■ ■ ■ ■ ■ ■ ■ ■ ■ ■ ■ ■ ■ ■ ■ ■ ■ ■ ■ ■ ■ ■ ■ ■ ■ ■ ■ ■ ■ ■ ■ ■ ■ ■ ■ ■ ■ ■ ■ ■ ■ ■ ■ ■ ■ ■ ■ ■ ■ ■ ■ ■ ■ ■ ■
A c c u m u l a t e dO t h e r
A d d i t i o n a l U n e x e rc i s e d C o m p re h e n s i v e To t a l To t a lCommon Stock P a i d - I n Tre a s u ry Stock Wa rr a n t s R e t a i n e d I n c o m e S t o c k h o l d e r s ’ C o m p re h e n s i v e
■ ■ ■ ■ ■ ■ ■ ■ ■ ■ ■ ■ ■ ■ ■ ■ ■ ■ ■ ■ ■ ■ ■ ■ ■ ■ ■ ■ ■ ■ ■ ■ ■ ■ ■ ■ ■ ■ ■
(In millions) S h a re s A m o u n t C a p i t a l S h a re s C o s t P u rc h a s e d E a rn i n g s ( L o s s ) E q u i t y I n c o m e
Consolidated Statements of Stockholders’ Equity and Comprehensive Income
See accompanying notes to consolidated financial statements.

Notes to Consolidated Financial Statements
Note A: The Company and Significant Accounting Policies
The Company Safeway Inc. (“Safeway” or the “Company”)
is one of the largest food and drug chains in North America,
with 1,497 stores as of year-end 1998. Safeway’s U.S. retail
operations are located principally in nort h e rn Californ i a ,
s o u t h e rn California, Oregon, Washington, Colorado, Arizona,
the Chicago metropolitan area and the Mid-Atlantic region . T h e
C o m p a n y ’s Canadian retail operations are located principally
in British Columbia, Alberta and Manitoba/Saskatchewan.
In support of its retail operations, the Company has an
extensive network of distribution, manufacturing and food
p rocessing facilities.
As discussed in Note B, in November 1998 the Company
acquired Dominick’s Supermarkets, Inc. (“Dominick’s”) by
p u rchasing all of the outstanding shares of Dominick’s for
$49 cash per share, or a total of approximately $1.2 billion
(the “Dominick’s Acquisition”). The acquisition was accounted
for as a purchase and Dominick’s operating results have been
consolidated with Safeway’s since approximately midway
through the fourth quarter of 1998.
Also discussed in Note B, in August 1998 Safeway and
C a rr-Gottstein Foods Co. (“Carrs”) signed a definitive merg e r
a g reement in which Safeway will acquire all of the outstanding
s h a res of Carrs for $12.50 cash per share, or a total of appro x i-
mately $110 million (the “Carrs Acquisition”).
In April 1997, Safeway completed a merger with The Vo n s
Companies, Inc. (“Vons”) pursuant to which the Company
issued 83.2 million shares of Safeway common stock for all
of the shares of Vons common stock that it did not already
own (the “Vons Merger”). Beginning in the second quarter
of 1997, Safeway’s consolidated financial statements include
Vons’ financial results.
In addition to these operations, the Company has a 49%
ownership interest in Casa Ley, S.A. de C.V. (“Casa Ley”),
which operates 77 food and general merchandise stores in
western Mexico.
Basis of Consolidation The consolidated financial statements
include Safeway Inc., a Delaware corporation, and all majority-
owned subsidiaries. All significant intercompany transactions
and balances have been eliminated in consolidation. The
C o m p a n y ’s investment in Casa Ley is re p o rted using the
equity method. Prior to the Vons Merger in the second quarter
of 1997, the Company’s investment in Vons was reported using
the equity method.
Fiscal Year The Company’s fiscal year ends on the Saturday
nearest December 31. The last three fiscal years consist
of the 52-week period ended January 2, 1999, the 53-week
period ended January 3, 1998 and 52-week period ended
December 28, 1996.
Use of Estimates The preparation of financial statements in
c o n f o rmity with generally accepted accounting principles
re q u i res management to make estimates and assumptions
that affect the re p o rted amounts of assets, liabilities, re v e n u e s
and expenses, as well as the disclosure of contingent assets
and liabilities. Actual results could differ from those estimates.
Translation of Foreign Currencies Assets and liabilities of the
C o m p a n y ’s Canadian subsidiaries and Casa Ley are translated
into U.S. dollars at year-end rates of exchange, and income and
expenses are translated at average rates during the year.
Adjustments resulting from translating financial statements
into U.S. dollars are re p o rted, net of applicable income taxes,
as a separate component of comprehensive income in the
Statements of Stockholders’ Equity and Comprehensive Income.
Merchandise Inventories M e rchandise inventory of $1,110 million
at year-end 1998 and $1,118 million at year-end 1997 is valued at
the lower of cost on a last-in, first-out (“LIFO”) basis or market
value. Such LIFO inventory had a replacement or current cost
of $1,190 million at year-end 1998 and $1,191 million at year- e n d
1997. Liquidations of LIFO layers during the three years
re p o rted did not have a significant effect on the results of oper-
ations. All remaining inventory is valued at the lower of cost on
a first-in, first-out (“FIFO”) basis or market value. The FIFO
cost of inventory approximates replacement or current cost.
Property and Depreciation P ro p e rty is stated at cost. Depre c i a t i o n
expense on buildings and equipment is computed on the straight-
line method using the following lives:
P ro p e rty under capital leases and leasehold impro v ements
are amortized on a straight-line basis over the shorter of the
remaining terms of the lease or the estimated useful lives of
the assets.
Stores and other buildings 10 to 30 yearsFixtures and equipment 3 to 15 years

Self-Insurance The Company is primarily self-insured for
workers’ compensation, automobile and general liability costs.
The self-insurance liability is determined actuarially, based
on claims filed and an estimate of claims incurred but not yet
reported. The present value of such claims was accrued using
a discount rate of 5.5% in 1998 and 1997. The current portion
of the self-insurance liability of $107.3 million at year-end 1998
and $96.3 million at year-end 1997 is included in other accrued
liabilities in the consolidated balance sheets. The long-term
portion of $265.5 million at year-end 1998 and $230.7 million
at year-end 1997 is included in accrued claims and other liabili-
ties. Claims payments were $98.2 million in 1998, $100.0 million
in 1997 and $66.7 million in 1996. The total undiscounted liabili-
ty was $413.1 million at year-end 1998 and $365.5 million at
year-end 1997.
Income Taxes The Company provides a deferred tax expense or
benefit equal to the change in the deferred tax liability during
the year in accordance with Statement of Financial Accounting
Standards (“SFAS”) No. 109, “Accounting for Income Taxes.”
D e f e rred income taxes re p resent tax credit carry f o rw a rds
and future net tax effects resulting from temporary diff e re n c e s
between the financial statement and tax basis of assets and
liabilities using enacted tax rates in effect for the year in which
the differences are expected to reverse.
Statement of Cash Flows Short-term investments with original
maturities of less than three months are considered to be cash
equivalents. Borrowings with original maturities of less than
three months are presented net of related repayments.
Off-Balance Sheet Financial Instruments As discussed in NoteE,
the Company has entered into interest rate swap and cap
a g reements to limit the Company’s exposure to changes in
market interest rates. Interest rate swap agreements involve
the exchange with a counterparty of fixed and floating-rate
interest payments periodically over the life of the agreements
without exchange of the underlying notional principal amounts.
The differential to be paid or received is recognized over the
life of the agreements as an adjustment to interest expense.
I n t e rest rate cap agreements lock in a maximum intere s t
rate on a notional principal amount by paying a fee to a coun-
t e r p a rty in exchange for the counterpart y ’s promise to pay
to Safeway the diff e rence between a fixed rate and a floating
rate of interest. The fee paid to the counterparty is deferre d
and amortized as an adjustment to interest expense over the
life of the agreement.
The Company’s counterparties are major financial institutions.
Fair Value of Financial Instruments Generally accepted accounting
principles re q u i re the disclosure of the fair value of cert a i n
financial instruments, whether or not recognized in the balance
sheet, for which it is practicable to estimate fair value.
Safeway estimated the fair values presented below using
a p p ropriate valuation methodologies and market inform a t i o n
available as of year-end. Considerable judgment is re q u i red to
develop estimates of fair value, and the estimates presented
a re not necessarily indicative of the amounts that the Company
could realize in a current market exchange. The use of diff e re n t
market assumptions or estimation methodologies could have a
material effect on the estimated fair values. Additionally, these
fair values were estimated at year-end, and current estimates of
fair value may differ significantly from the amounts presented.
The following methods and assumptions were used to esti-
mate the fair value of each class of financial instruments:
Cash and equivalents, accounts receivable, accounts payable
and short-term debt. The carrying amount of these items
approximates fair value.
Long-term debt. Market values quoted on the New York Stock
Exchange are used to estimate the fair value of publicly traded
debt. To estimate the fair value of debt issues that are not
quoted on an exchange, the Company uses those interest rates
that are currently available to it for issuance of debt with
similar terms and remaining maturities. At year-end 1998,
the estimated fair value of debt was $4.6 billion compared to a
carrying value of $4.5 billion. At year-end 1997, the estimated
fair value of debt was $3.2 billion compared to a carrying value
of $3.1 billion.
Off-balance sheet instruments. The fair value of interest rate
swap and cap agreements is the amount at which they could
be settled based on estimates obtained from dealers. At year-
end 1998 and 1997, net unrealized losses on such agre e m e n t s
w e re $7.0 million and $0.4 million.
Impairment of Long-Lived Assets When Safeway decides to
close a store or other facility, the Company accrues estimated
losses, if any, which may include lease payments or other
costs of holding the facility, net of estimated future income
(primarily sublease income) in accordance with the provisions
of SFAS No. 121, “Accounting for the Impairment of Long-
Lived Assets and for Long-Lived Assets to be Disposed of.”
Safeway had an accrued liability of $84.6 million at year- e n d
1998 and $72.0 million at year-end 1997 for the anticipated
f u t u re closure of stores and other facilities, which is included
in Accrued Claims and Other Liabilities in the Company’s
consolidated balance sheets.

Goodwill Goodwill was $3.3 billion at year-end 1998 and $1.8 bil-
lion at year-end 1997, and is being amortized on a straight-line
basis over its estimated useful life. If it became probable that
the projected future undiscounted cash flows of acquired assets
w e re less than the carrying value of the goodwill, Safeway
would recognize an impairment loss in accordance with the
provisions of SFAS No. 121.
Goodwill amortization was $56.3 million in 1998, $41.8 mil-
lion in 1997 and $10.4 million in 1996. Goodwill and re l a t e d
a m o rtization has increased due to the Vons Merger and
Dominick’s Acquisition as discussed in Note B.
Stock-Based Compensation Safeway accounts for stock-based
a w a rds to employees using the intrinsic value method in
accordance with Accounting Principles Board Opinion No. 25,
“Accounting for Stock Issued to Employees.” The disclosure
re q u i rements of SFAS No. 123, “Accounting for Stock-Based
Compensation” are set forth in Note F.
New Accounting Standards In 1998, Safeway adopted the
American Institute of Certified Public Accountants’ (“AICPA ” )
Statement of Position 98-1 (“SOP 98-1”), “Accounting for the
Costs of Computer Software Developed or Obtained for
I n t e rnal Use.” SOP 98-1 defines the types of computer software
p roject costs that may be capitalized. All other costs must be
expensed in the period incurred. In order for costs to be capital-
ized, the computer software project must be intended to cre a t e
a new system or add identifiable functionality to an existing
system. Adoption of this statement did not have a material
impact on the Company’s consolidated financial statements.
In June 1998, the Financial Accounting Standards Board
issued SFAS No. 133, “Accounting for Derivative Instru m e n t s
and Hedging Activities,” which defines derivatives, requires
that derivatives be carried at fair value, and provides for
hedge accounting when certain conditions are met. This state-
ment is effective for Safeway beginning in the year 2000.
Although Safeway has not fully assessed the implications of
this new statement, the Company believes adoption of this
statement will not have a material impact on its consolidated
financial statements.
In April 1998, the AICPA finalized SOP 98-5, “Report i n go n
the Costs of Start-Up Activities,” which re q u i res that costs
i n c u rred for start-up activities, such as store openings, be
expensed as incurred. This SOP, which is effective in the first
quarter of 1999, is not expected to have a material impact on
Safeway’s consolidated financial statements.
Note B: AcquisitionsIn November 1998, Safeway completed its acquisition of all of
the outstanding shares of Dominick’s for $49 cash per share ,
or a total of approximately $1.2 billion. The Dominick’s acqui-
sition was accounted for as a purchase and resulted in addi-
tional goodwill of $1.6 billion which is being amortized over
40 years. Safeway funded the Dominick’s Acquisition, includ-
ing the repayment of approximately $560 million of debt and
lease obligations, with a combination of bank borrowings and
c o m m e rcial paper.
In April 1997, Safeway completed the Vons Merger pur-
suant to which the Company issued 83.2 million shares of
Safeway common stock valued at $1.7 billion for all of the
s h a res of Vons common stock that it did not already own. The
Vons Merger was accounted for as a purchase and resulted in
additional goodwill of $1.5 billion which is being amortized over
40 years. In connection with the Vons Merger, Safeway repur-
chased 64.0 million shares of its common stock from a partner-
ship affiliated with KKR & Co., L.L.C. (“KKR”) at $21.50 per
share, for an aggregate purchase price of $1.376 billion.
Safeway funded the repurchase with bank borrowings.
The following unaudited pro forma combined summary
financial information is based on the historical consolidated
results of operations of Safeway, Vons and Dominick’s, as if
the Vons Merger and the Dominick’s Acquisition had occurre d
as of the beginning of each year presented. This pro form a
financial information is presented for informational purposes
only and may not be indicative of what the actual consolidated
results of operations would have been if the acquisitions had
been effective as of the beginning of the years presented. Pro
forma adjustments were applied to the respective historical
financial statements to account for the Vons Merger and
the Dominick’s Acquisition as purchases. Under purc h a s e
accounting, the purchase price is allocated to acquired assets
and liabilities based on their estimated fair values at the date
of acquisition, and any excess is allocated to goodwill.
For Dominick’s, such allocations are subject to adjustment
when additional analysis concerning asset and liability balances
is finalized. The preliminary allocation of the purchase price to
the assets and liabilities acquired was based in part upon an
independent valuation which, in turn, was based upon certain
estimates and cash flow information provided by management.
Management does not expect the final allocations to differ
materially from the amounts presented herein.
Pro Forma52 Weeks 53 Weeks
(In millions, expect per-share amounts) 1998 1997
Sales $26,487.6 $26,315.9Income before extraordinary loss 742.1 510.6Net income 742.1 423.1Diluted earnings per share:
Income before extraord i n a ry l o s s $ 1.46 $ 1.01Net income 1.46 0.84

In August 1998, Safeway and Carrs signed a definitive
m e rger agreement in which Safeway will acquire all of the
outstanding shares of Carrs for $12.50 cash per share, or a total
of approximately $110 million. In addition, Carrs has appro x i-
mately $220 million of debt. The acquisition will be accounted
for as a purchase and will be funded initially through the
issuance of commercial paper.
The acquisition of Carrs is subject to a number of condi-
tions, including the approval of the holders of a majority of
Carrs’ outstanding shares, court approval of a consent decree
with the state of Alaska requiring the sale of six Safeway
stores and one Carrs store, and other customary closing condi-
tions. Carrs expects to schedule a shareholder meeting to vote
on the transaction in April 1999. Assuming satisfaction of all
conditions, Safeway and Carrs expect to close the transaction
shortly after receiving shareholder approval and final court
approval of the consent decree.
Note C: FinancingNotes and debentures were composed of the following at
year-end (in millions):
1998 1997
Commercial paper $1,745.0 $1,473.5Bank credit agreement, unsecured 89.1 238.29.30% Senior Secured Debentures
due 2007 24.3 24.36.85% Senior Notes due 2004,
unsecured 200.0 200.07.00% Senior Notes due 2007,
unsecured 250.0 250.07.45% Senior Debentures due 2027,
unsecured 150.0 150.05.75% Notes due 2000, unsecured 400.0 –5.875% Notes due 2001, unsecured 400.0 –6.05% Notes due 2003, unsecured 350.0 –6.50% Notes due 2008, unsecured 250.0 –9.35% Senior Subordinated Notes
due 1999, unsecured 66.7 66.710% Senior Subordinated Notes
due 2001, unsecured 79.9 79.99.65% Senior Subordinated
Debentures due 2004, unsecured 81.2 81.29.875% Senior Subordinated
Debentures due 2007, unsecured 24.2 24.210% Senior Notes due 2002,
unsecured 6.1 6.1Mortgage notes payable, secured 115.9 150.8Other notes payable, unsecured 102.7 114.8Medium-term notes, unsecured 25.5 25.5Short-term bank borrowings,
unsecured 161.8 210.0■ ■ ■ ■ ■ ■ ■ ■ ■
4,522.4 3,095.2■ ■ ■ ■ ■ ■ ■ ■ ■
Less current maturities (279.8) (277.4)■ ■ ■ ■ ■ ■ ■ ■ ■
Long-term portion $4,242.6 $2,817.8■ ■ ■ ■ ■ ■ ■ ■ ■
Commercial Paper The amount of commercial paper borro w i n g s
is limited to the unused borrowing capacity under the bank
c redit agreement. Commercial paper is classified as long-term
because the Company intends to and has the ability to re f i-
nance these borrowings on a long-term basis through either
continued commercial paper borrowings or utilization of the
bank credit agreement, which matures in 2002. The weighted
average interest rate on commercial paper borrowings was
5.75% during 1998 and 5.99% at year-end 1998.
Bank Credit Agreement S a f e w a y ’s total borrowing capacity
under the bank credit agreement is $2.9 billion. Of the $2.9 bil-
lion credit line, $2.0 billion matures in 2002 and has two one-
year extension options, and $0.9 million is renewable annually
t h rough 2004. The restrictive covenants of the bank cre d i t
a g reement limit Safeway with respect to, among other things,
c reating liens upon its assets and disposing of material
amounts of assets other than in the ordinary course of busi-
ness. Safeway is also required to meet certain financial tests
under the bank credit agreement. At year-end 1998, the
Company had total unused borrowing capacity under the bank
c redit agreement of $ 2.7 billion ($1.0 billion excluding that por-
tion of the bank credit agreement re s e rved to back up commer-
cial paper borrowings).
U.S. borrowings under the bank credit agreement carry
interest at one of the following rates selected by the Company:
(i) the prime rate; (ii) a rate based on rates at which Euro d o l l a r
deposits are off e red to first-class banks by the lenders in the
bank credit agreement plus a pricing margin based on the
C o m p a n y ’s debt rating or interest coverage ratio (the “Pricing
Margin”); or (iii) rates quoted at the discretion of the lenders.
Canadian borrowings denominated in U.S. dollars carry inter-
est at one of the following rates selected by the Company:
(a) the Canadian base rate; or (b) the Canadian Eurodollar rate
plus the Pricing Margin. Canadian bor rowings denominated in
Canadian dollars carry interest at one of the following rates
selected by the Company: (i) the Canadian prime rate or (ii) the
rate for Canadian bankers acceptances plus the Pricing Marg i n .
The weighted average interest rate on borrowings under
the bank credit agreement was 6.69% during 1998 and 5.57%
at year-end 1998.

Senior Secured Indebtedness The 9.30% Senior Secure d
D e b e n t u res due 2007 are secured by a deed of trust which
c reated a lien on the land, buildings and equipment owned
by Safeway at its distribution center in Tracy, California.
Senior Unsecured Indebtedness In November 1998, Safeway
issued senior unsecured debt securities consisting of 5.75%
Notes due 2000, 5.875% Notes due 2001, 6.05% Notes due
2003, and 6.50% Notes due 2008.
In 1997 Safeway issued senior unsecured debt securities
consisting of 6.85% Senior Notes due 2004, 7.00% Senior Notes
due 2007, and 7.45% Senior Debentures due 2027.
Senior Subordinated Indebtedness The 9.35% Senior
S u b o rdinated Notes due 1999, 10% Senior Subordinated
Notes due 2001, 9.65% Senior Subordinated Debentures due
2004, and 9.875% Senior Subordinated Debentures due 2007
a re subordinated in right of payment to, among other things,
the Company’s borrowings under the bank credit agre e m e n t ,
the 9.30% Senior Secured Debentures, the Senior Unsecure d
Indebtedness, and mortgage notes payable.
Mortgage Notes Payable Mortgage notes payable at year-end
1998 have remaining terms ranging from one to 17 years, have
a weighted average interest rate of 9.36% and are secured by
properties with a net book value of approximately $225 million.
Other Notes Payable Other notes payable at year-end 1998 have
remaining terms ranging from one to 13 years and a weighted
average interest rate of 7.12%.
Redemptions During 1997, the Company redeemed $588.5 million
of the Senior Subordinated Indebtedness, $285.5 million of Vo n s ’
public debt, and $40.0 million of medium-term notes using pro-
ceeds from the Senior Unsecured Indebtedness and commerc i a l
paper program. In connection with these redemptions, Safeway
re c o rded an extraord i n a ry loss of $64.1 million ($0.13 per share ) .
The extraordinary loss represents the payment of redemption
premiums and the write-off of deferred finance costs, net of the
related tax benefits.
Annual Debt Maturities As of year-end 1998, annual debt maturi-
ties were as follows (in millions):
1999 $ 279.82000 427.52001 549.62002 1,872.02003 377.6Thereafter 1,015.9
$4,522.4
Letters of Credit The Company had letters of credit of $143.9
million outstanding at year-end 1998 of which $63.2 million
w e re issued under the bank credit agreement. The letters
of credit are maintained primarily to support perf o rmance,
payment, deposit or surety obligations of the Company.
The Company pays commitment fees ranging from 0.25%
to 1.00% on the outstanding portion of the letters of credit.
Note D: Lease ObligationsApproximately two-thirds of the premises that the Company occu
pies are leased. The Company had approximately 1,400 leases at
year-end 1998, including approximately 220 which are capitalized
for financial reporting purposes. Most leases have renewal
options, some with terms and conditions similar to the original
lease, others with reduced rental rates during the option periods.
Certain of these leases contain options to purchase the property
at amounts that approximate fair market value.
As of year-end 1998, future minimum rental payments applicabl
to non-cancelable capital and operating leases with re m a i n i n g
terms in excess of one year were as follows (in millions):
F u t u re minimum lease payments under non-cancelable
capital and operating lease agreements have not been reduced
by minimum sublease rental income of $210.5 million.
A m o rtization expense for pro p e rty under capital leases was
$22.3 million in 1998, $21.1 million in 1997 and $17.9 million in
1996. Accumulated amortization of pro p e rty under capital leases
was $136.1 million at year-end 1998 and $153.4 million at
year-end 1997.
The following schedule shows the composition of total
rental expense for all operating leases (in millions). In general,
contingent rentals are based on individual store sales.
1998 1997 1996
Property leases:Minimum rentals $208.7 $206.0 $138.2Contingent rentals 19.2 12.3 9.9Less rentals from
subleases (12.0) (13.4) (11.1)■ ■ ■ ■ ■ ■ ■ ■ ■ ■ ■ ■ ■ ■ ■ ■ ■ ■ ■ ■
215.9 204.9 137.0Equipment leases 22.4 19.3 21.0
■ ■ ■ ■ ■ ■ ■ ■ ■ ■ ■ ■ ■ ■ ■ ■ ■ ■ ■ ■$238.3 $224.2 $158.0
■ ■ ■ ■ ■ ■ ■ ■ ■ ■ ■ ■ ■ ■ ■ ■ ■ ■ ■ ■
Capital OperatingLeases Leases
1999 $ 87.9 $ 236.82000 84.5 231.52001 87.0 207.32002 70.1 210.72003 67.4 200.2Thereafter 404.2 1,821.9
■ ■ ■ ■ ■ ■ ■ ■Total minimum lease payments 801.1 $2,908.4Less amounts representing interest (351.4)Present value of net minimum
lease payments 449.7Less current obligations (41.7)Long-term obligations $ 408.0
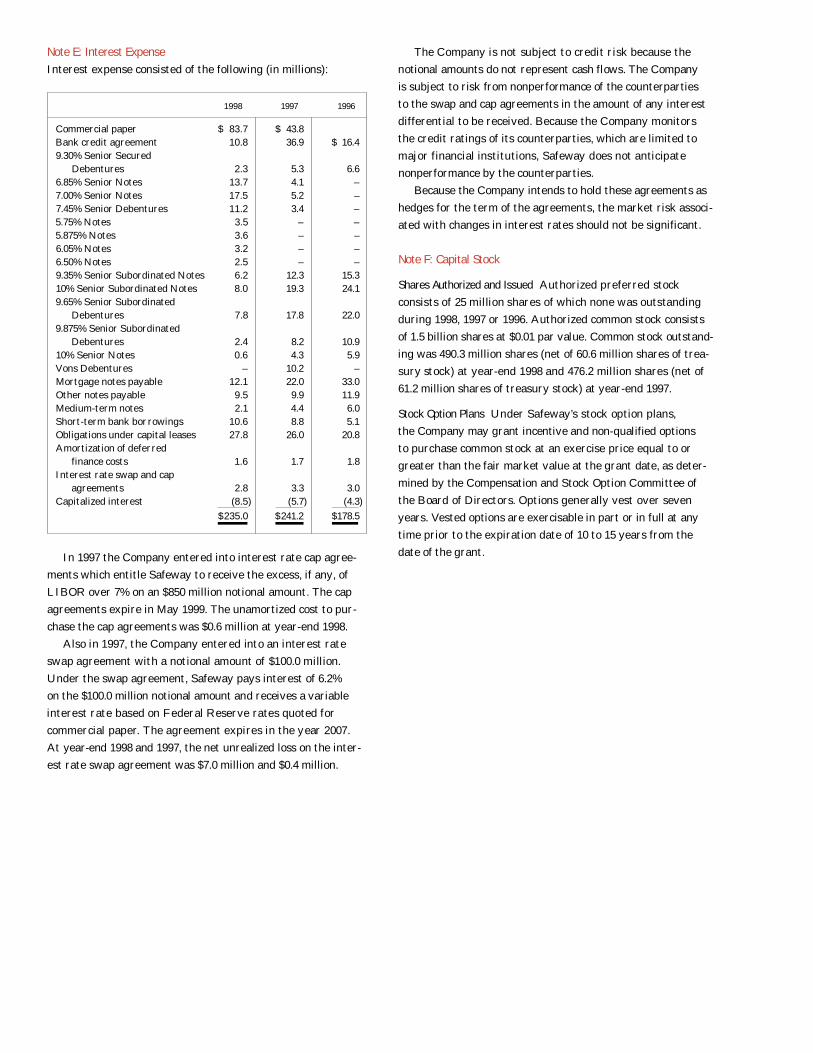
Note E: Interest ExpenseInterest expense consisted of the following (in millions):
In 1997 the Company entered into interest rate cap agree-
ments which entitle Safeway to receive the excess, if any, of
LIBOR over 7% on an $850 million notional amount. The cap
agreements expire in May 1999. The unamortized cost to pur-
chase the cap agreements was $0.6 million at year-end 1998.
Also in 1997, the Company entered into an interest rate
swap agreement with a notional amount of $100.0 million.
Under the swap agreement, Safeway pays interest of 6.2%
on the $100.0 million notional amount and receives a variable
i n t e rest rate based on Federal Reserve rates quoted for
c o m m e rcial paper. The agreement expires in the year 2007.
At year-end 1998 and 1997, the net unrealized loss on the inter-
est rate swap agreement was $7.0 million and $0.4 million.
1998 1997 1996
Commercial paper $ 83.7 $ 43.8Bank credit agreement 10.8 36.9 $ 16.49.30% Senior Secured
Debentures 2.3 5.3 6.66.85% Senior Notes 13.7 4.1 –7.00% Senior Notes 17.5 5.2 –7.45% Senior Debentures 11.2 3.4 –5.75% Notes 3.5 – –5.875% Notes 3.6 – –6.05% Notes 3.2 – –6.50% Notes 2.5 – –9.35% Senior Subordinated Notes 6.2 12.3 15.310% Senior Subordinated Notes 8.0 19.3 24.19.65% Senior Subordinated
Debentures 7.8 17.8 22.09.875% Senior Subordinated
Debentures 2.4 8.2 10.910% Senior Notes 0.6 4.3 5.9Vons Debentures – 10.2 –Mortgage notes payable 12.1 22.0 33.0Other notes payable 9.5 9.9 11.9Medium-term notes 2.1 4.4 6.0Short-term bank borrowings 10.6 8.8 5.1Obligations under capital leases 27.8 26.0 20.8Amortization of deferred
finance costs 1.6 1.7 1.8Interest rate swap and cap
agreements 2.8 3.3 3.0Capitalized interest (8.5) (5.7) (4.3)
■ ■ ■ ■ ■ ■ ■ ■ ■ ■ ■ ■ ■ ■ ■ ■$235.0 $241.2 $178.5
■ ■ ■ ■ ■ ■ ■ ■ ■ ■ ■ ■ ■ ■ ■ ■
The Company is not subject to credit risk because the
notional amounts do not re p resent cash flows. The Company
is subject to risk from nonperf o rmance of the counterparties
to the swap and cap agreements in the amount of any intere s t
d i ff e rential to be received. Because the Company monitors
the credit ratings of its counterparties, which are limited to
major financial institutions, Safeway does not anticipate
nonperformance by the counterparties.
Because the Company intends to hold these agreements as
hedges for the term of the agreements, the market risk associ-
ated with changes in interest rates should not be significant.
Note F: Capital Stock
Shares Authorized and Issued Authorized pre f e rred stock
consists of 25 million shares of which none was outstanding
during 1998, 1997 or 1996. Authorized common stock consists
of 1.5 billion shares at $0.01 par value. Common stock outstand-
ing was 490.3 million shares (net of 60.6 million shares of trea-
s u ry stock) at year-end 1998 and 476.2 million shares (net of
61.2 million shares of treasury stock) at year-end 1997.
Stock Option Plans Under Safeway’s stock option plans,
the Company may grant incentive and non-qualified options
to purchase common stock at an exercise price equal to or
g reater than the fair market value at the grant date, as deter-
mined by the Compensation and Stock Option Committee of
the Board of Directors. Options generally vest over seven
years. Vested options are exercisable in part or in full at any
time prior to the expiration date of 10 to 15 years from the
date of the grant.

Additional Stock Option Plan Information The Company accounts
for its stock-based awards using the intrinsic value method in
accordance with Accounting Principles Board Opinion No. 25,
“Accounting for Stock Issued to Employees,” and its re l a t e d
i n t e r p retations. Accord i n g l y, no compensation expense has
been recognized in the financial statements for employee stock
option awards granted at fair market value.
S FAS No. 123, “Accounting for Stock-Based Compensation,”
requires the disclosure of pro forma net income and earnings
per share as if the Company had adopted the fair value method
as of the beginning of fiscal 1995. Under SFAS 123, the fair
value of stock-based awards to employees is calculated thro u g h
the use of option pricing models, even though such models
w e re developed to estimate the fair value of freely tradable,
fully transferable options without vesting restrictions, which
significantly differ from the Company’s stock option awards.
These models also require subjective assumptions, including
f u t u re stock price volatility and expected time to exerc i s e ,
which greatly affect the calculated values. The Company’s
calculations were made using the Black-Scholes option pricing
model with the following weighted average assumptions: seven
to nine years expected life to vesting; stock volatility of 31% in
both 1998 and 1997, and 30% in 1996; risk-free interest rates
of 5.26% in 1998 and 6.29% in both 1997 and 1996; and no
dividends during the expected term.
The Company’s calculations are based on a single option
valuation approach and forf e i t u res are recognized as they
o c c u r. However, the impact of outstanding non-vested stock
options granted prior to 1995 has been excluded from the pro
f o rma calculation; accord i n g l y, the pro forma results pre s e n t e d
Activity in the Company’s stock option plans for the three-year period ended January 2, 1999 was as follows:
Weighted Average Options Exercise Price
Outstanding, year-end 1995 44,330,644 $ 3.521996 Activity:
Granted 3,991,984 16.65Canceled (724,454) 5.07Exercised (8,825,018) 2.04
Outstanding, year-end 1996 38,773,156 5.071997 Activity:
Granted 3,981,766 26.25Converted Vons options 7,578,098 7.34Canceled (962,522) 10.01Exercised (8,373,270) 5.06
Outstanding, year-end 1997 40,997,228 7.531998 Activity:
Granted 4,987,038 40.28Converted Dominick’s options 922,701 19.70Canceled (848,482) 14.61Exercised (6,680,083) 3.90
Outstanding, year-end 1998 39,378,402 12.15
Exercisable, year-end 1996 23,034,640 4.25
Exercisable, year-end 1997 25,887,094 4.75
Exercisable, year-end 1998 24,447,905 5.79
Weighted average fair value of options granted during the year:1996 $ 7.641997 12.431998 17.06
The following table summarizes stock option information at year-end 1998:
Options Outstanding Options Exercisable■ ■ ■ ■ ■ ■ ■ ■ ■ ■ ■ ■ ■ ■ ■ ■ ■ ■ ■ ■ ■ ■ ■ ■
Range of Number Weighted-Average Weighted-Average Number Weighted-AverageExercise Prices of Options Remaining Contractual Life Exercise Price of Options Exercise Price
$ 0.50 to $ 0.50 1,047,000 0.35 years $ 0.50 1,047,000 $ 0.501.46 to 9.44 25,297,992 7.06 4.71 20,730,918 4.379.67 to 17.63 3,495,840 8.31 13.63 1,756,064 14.78
18.94 to 29.88 4,468,929 8.50 25.59 807,537 24.8731.44 to 39.00 2,261,808 9.19 35.13 25,496 32.8240.06 to 48.06 2,806,833 9.56 41.80 80,890 42.56
■ ■ ■ ■ ■ ■ ■ ■ ■ ■ ■ ■ ■ ■ ■ ■ ■ ■ ■ ■ ■ ■ ■ ■ ■ ■ ■ ■ ■ ■ ■ ■ ■ ■ ■ ■ ■ ■ ■ ■ ■ ■ ■ ■ ■ ■ ■ ■ ■ ■ ■ ■ ■ ■ ■ ■ ■ ■ ■ ■ ■ ■ ■ ■ ■ ■ ■ ■ ■ ■ ■ ■ ■ ■ ■ ■ ■ ■ ■ ■ ■ ■ ■ ■ ■ ■ ■ ■ ■ ■ ■■ ■■ ■ ■0.50 to 48.06 39,378,402 7.46 12.15 24,447,905 5.79
■ ■ ■ ■ ■ ■ ■ ■ ■ ■ ■ ■ ■ ■ ■ ■ ■ ■ ■ ■ ■ ■ ■ ■ ■ ■ ■ ■ ■ ■ ■ ■ ■ ■ ■ ■ ■ ■ ■ ■ ■ ■ ■ ■ ■ ■ ■ ■ ■ ■ ■ ■ ■ ■ ■ ■ ■ ■ ■ ■ ■ ■ ■ ■ ■ ■ ■ ■ ■ ■ ■ ■ ■ ■ ■ ■ ■ ■ ■ ■ ■ ■ ■ ■ ■ ■ ■ ■ ■ ■ ■■ ■■ ■ ■
Options to purchase 18.4 million shares were available for grant at year-end 1998.

below are not indicative of future period pro forma re s u l t s .
Had compensation cost for Safeway’s stock option plans been
d e t e rmined based on the fair value at the grant date for
a w a rds in 1998, 1997 and 1996, consistent with the provisions
of SFAS No. 123, the Company’s net income and earnings per
s h a re would have been reduced to the pro forma amounts
indicated below:
Note G: Taxes on IncomeThe components of income tax expense are as follows
(in millions):
Extraordinary losses are presented net of related tax
benefits. Therefore, 1997 income tax expense excludes the
$41.1 million tax benefit on an extraordinary loss related to
the early retirement of debt. Tax benefits from the exercise of
employee stock options of $85.2 million in 1998, $42.4 million in
1997 and $51.9 million in 1996 were credited directly to paid-in
capital and, therefore, are excluded from income tax expense.
1998 1997 1996
Current:Federal $398.8 $303.6 $162.9State 80.0 57.5 30.7Foreign 52.0 37.8 (0.5)
■ ■ ■ ■ ■ ■ ■ ■ ■ ■ ■ ■ ■ ■ ■ ■■ ■■ ■530.8 398.9 193.1
■ ■ ■ ■ ■ ■ ■ ■ ■ ■ ■ ■ ■ ■ ■ ■■ ■■ ■Deferred:Federal 44.4 40.4 49.3State 12.2 8.4 12.6Foreign 2.8 7.1 52.0
■ ■ ■ ■ ■ ■ ■ ■ ■ ■ ■ ■ ■ ■ ■ ■■ ■■ ■59.4 55.9 113.9
■ ■ ■ ■ ■ ■ ■ ■ ■ ■ ■ ■ ■ ■ ■ ■■ ■■ ■$590.2 $454.8 $307.0
■ ■ ■ ■ ■ ■ ■ ■ ■ ■ ■ ■ ■ ■ ■ ■■ ■■ ■
1998 1997 1996
Net income (in millions):As reported $806.7 $557.4 $ 460.6Pro forma 794.8 553.5 459.0
Basic earnings per share:As reported $ 1.67 $ 1.21 $ 1.06Pro forma 1.65 1.20 1.05
Diluted earnings per share:As reported $ 1.59 $ 1.12 $ 0.97Pro forma 1.56 1.11 0.96
The reconciliation of the provision for income taxes at
the U.S. federal statutory income tax rate to the Company’s
income taxes is as follows (dollars in millions):
Significant components of the Company’s net deferred tax
liability at year-end were as follows (in millions):
Deferred tax assets include net operating losses assumed in
the Dominick’s acquisition which will expire between 2008 and
2010. Such losses are expected to be fully utilized.
1998 1997 1996
Deferred tax assets:Workers’ compensation
and other claims $ 158.5 $ 138.8 $ 91.7Accruals not currently
deductible 106.6 80.3 48.7Accrued claims and other
liabilities 48.0 48.8 47.4Employee benefits 34.7 18.4 9.7U.S. operating loss carry
forward 12.1 – –Canadian operating loss
carryforward – – 2.7Other assets 51.5 14.6 6.0
■ ■ ■ ■ ■ ■ ■ ■ ■ ■ ■ ■ ■ ■■ ■■ ■411.4 300.9 206.2
■ ■ ■ ■ ■ ■ ■ ■ ■ ■ ■ ■ ■ ■■ ■■ ■Deferred tax liabilities:Property (315.7) (280.8) (110.5)Prepaid pension costs (166.4) (161.3) (149.9)LIFO inventory reserves (125.7) (106.0) (66.8)Investments in unconsolidated
affiliates (16.7) (15.3) (48.1)Cumulative translation
adjustments (3.8) (16.2) (23.0)Other liabilities – (18.3) (31.7)
■ ■ ■ ■ ■ ■ ■ ■ ■ ■ ■ ■ ■ ■■ ■■ ■(628.3) (597.9) (430.0)
■ ■ ■ ■ ■ ■ ■ ■ ■ ■ ■ ■ ■ ■■ ■■ ■Net deferred tax liability $(216.9) $(297.0) $(223.8)
■ ■ ■ ■ ■ ■ ■ ■ ■ ■ ■ ■ ■ ■■ ■■ ■
1998 1997 1996
Statutory rate 35% 35% 35%Income tax expense using
federal statutory rate $488.9 $376.7 $268.7State taxes on income net
of federal benefit 59.9 42.8 28.1Taxes provided on equity in
earnings of unconsolidated affiliates at rates below the statutory rate (10.0) (9.4) (10.5)
Taxes on foreign earnings not permanently reinvested 7.9 8.9 7.3
Nondeductible expenses and amortization 17.6 13.6 3.2
Difference between statutory rate and foreign effective rate 11.1 10.6 11.1
Other accruals 14.8 11.6 (0.9)■ ■ ■ ■ ■ ■ ■ ■ ■ ■ ■ ■ ■ ■ ■ ■■ ■■ ■
$590.2 $454.8 $307.0■ ■ ■ ■ ■ ■ ■ ■ ■ ■ ■ ■ ■ ■ ■ ■■ ■■ ■

Note H: Employee Benefit Plans and Collective Bargaining Agreements
Retirement Plans The Company maintains defined benefit,
non-contributory retirement plans for substantially all of its
employees not participating in multi-employer pension plans.
In connection with the Vons Merg e r, the Company assumed
the obligations of Vons’ re t i rement plan. The actuarial assump-
tions for the existing Vons’ re t i rement plan are comparable to the
existing plans of the Company. Vons’ re t i rement plan has been
combined with Safeway’s for financial statement presentation.
The following tables provide a reconciliation of the changes in
the retirement plans’ benefit obligation and fair value of assets
over the two-year period ended January 2, 1999 and a statement
of the funded status as of year-end 1998 and 1997 (in millions):
1998 1997
Funded status:Fair value of plan assets $ 1,766.1 $ 1,662.6Projected benefit obligation (1,165.7) (1,056.8)
■ ■ ■ ■ ■■ ■■Funded status 600.4 605.8Adjustment for difference in book
and tax basis of assets (165.1) (165.1)Unamortized prior service cost 95.5 93.7Unrecognized gain (161.2) (193.0)
■ ■ ■ ■ ■■ ■■Prepaid pension cost $ 369.6 $ 341.4
■ ■ ■ ■ ■■ ■■
1998 1997
Change in fair value of plan assets:Beginning balance $1,662.6 $1,392.0Actual return on plan assets 193.2 263.8Acquisition of Vons – 76.5Employer contributions 6.8 10.0Benefit payments (79.8) (70.3)Currency translation adjustments (16.7) (9.4)
■ ■ ■ ■ ■ ■■ ■■Ending balance $1,766.1 $1,662.6
■ ■ ■ ■ ■ ■■ ■■
1998 1997
Change in benefit obligation:Beginning balance $1,056.8 $ 867.1Service cost 52.5 42.5Interest cost 69.7 60.1Plan amendments 18.2 25.1Actuarial loss 65.1 45.4Acquisition of Vons – 83.9Benefit payments (79.8) (70.3)Change in assumptions (0.5) 12.3Currency translation adjustments (16.3) (9.3)
■ ■ ■ ■ ■ ■■ ■■Ending balance $1,165.7 $1,056.8
■ ■ ■ ■ ■ ■■ ■■
The following table provides the components of 1998 and
1997 net pension income for the re t i rement plans (in millions):
Prior service costs are amortized on a straight-line basis
over the average remaining service period of active part i c i-
pants. Actuarial gains and losses are amortized over the
average remaining service life of active participants when
the accumulation of such gains and losses exceeds 10% of the
g reater of the projected benefit obligation or the fair value
of plan assets.
The actuarial assumptions used to determine year-end plan
status were as follows:
Retirement Restoration Plan The Retirement Restoration Plan
p rovides death benefits and supplemental income payments
for senior executives after re t i rement. The Company re c o g-
nized expense of $5.0 million in 1998, $4.3 million in 1997 and
$4.4 million in 1996. The aggregate projected benefit obligation
of the Retirement Restoration Plan was approximately $53.8
million at year-end 1998 and $48.4 million at year-end 1997.
1998 1997 1996
Discount rate used to determine the projected benefit obligation:
United States Plans 6.5% 7.0% 7.5%Canadian Plans 6.3 6.3 7.0Combined weighted
average rate 6.5 6.8 7.4
Expected return on plan assets:United States Plans 9.0% 9.0% 9.0%Canadian Plans 8.0 8.0 8.0
Rate of compensation increase:United States Plans 5.0% 5.0% 5.5%Canadian Plans 4.5 4.5 5.5
1998 1997 1996
Estimated return on assets $141.5 $118.3 $148.2Service cost (52.5) (42.5) (41.3)Interest cost (69.7) (60.1) (51.7)Amortization of prior
service cost (14.3) (11.6) (56.0)Amortization of
unrecognized gains 13.3 – –■ ■ ■ ■ ■■■ ■ ■ ■ ■ ■ ■■■ ■
Net pension income $ 18.3 $ 4.1 $ (0.8)■ ■ ■ ■ ■■■ ■ ■ ■ ■ ■ ■■■ ■

Multi-Employer Pension Plans Safeway participates in various
multi-employer pension plans, covering virtually all Company
employees not covered under the Company’s non-contributory
pension plans, pursuant to agreements between the Company
and employee bargaining units which are members of such
plans. These plans are generally defined benefit plans; however,
in many cases, specific benefit levels are not negotiated with
or known by the employer-contributors. Contributions of
$119 million in 1998, $130 million in 1997 and $112 million in
1996 were made and charged to expense.
Under U.S. legislation re g a rding such pension plans, a com-
pany is re q u i red to continue funding its pro p o rtionate share
of a plan’s unfunded vested benefits in the event of withdrawal
(as defined by the legislation) from a plan or plan term i n a t i o n .
Safeway participates in a number of these pension plans, and
the potential obligation as a participant in these plans may be
significant. The information re q u i red to determine the total
amount of this contingent obligation, as well as the total amount
of accumulated benefits and net assets of such plans, is not
readily available. During 1988 and 1987, the Company sold cer-
tain operations. In most cases the party acquiring the operation
a g reed to continue making contributions to the plans. Safeway
is relieved of the obligations related to these sold operations to
the extent the acquiring parties continue to make contributions.
Whether such sales could result in withdrawal under ERISA
and, if so, whether such withdrawals could result in liability to
the Company, is not determinable at this time.
Collective Bargaining Agreements At year-end 1998, Safeway
had approximately 170,000 full and part-time employees.
A p p roximately 90% of Safeway’s employees in the United
States and Canada are covered by collective bargaining
a g reements negotiated with local unions affiliated with one
of 12 diff e rent international unions. There are appro x i m a t e l y
400 such agreements, typically having three-year terms, with
some agreements having terms up to five years. Accord i n g l y,
Safeway negotiates a significant number of these agre e m e n t s
every year.
Note I: Investment in Unconsolidated AffiliateAt year-end 1998 Safeway’s investment in unconsolidated
a ffiliate consists of a 49% ownership interest in Casa Ley,
which operates 77 food and general merchandise stores in
western Mexico.
Income from Safeway’s equity investment in Casa Ley,
re c o rded on a one-quarter delay basis, was $28.5 million in
1998, $22.7 million in 1997 and $18.8 million in 1996.
T h rough April 8, 1997, Safeway also owned 15.1 million
common shares, or 34.4% of the total shares outstanding, of
Vons. Vons is now a wholly-owned subsidiary of Safeway, and
as of the beginning of the second quarter of 1997, Safeway’s
consolidated financial statements include Vons’ financial
position and results of operations.
S a f e w a y ’s share of Vons’ earnings was $12.2 million for
the first quarter of 1997 and $31.2 million for the year in 1996.
Note J: Related-Party TransactionsKKR provides management, consulting and financial services
to the Company for an annual fee. Such services include, but
are not necessarily limited to, advice and assistance concerning
any and all aspects of the operation, planning and financing of
the Company. Annual payments for management fees, special
services and reimbursement of expenses were approximately
$1.4 million in 1998, 1997 and 1996.
The Company holds an 80% interest in Pro p e rt y
Development Associates (“PDA”), a partnership formed in 1987
with a company controlled by an affiliate of KKR, to purc h a s e ,
manage and dispose of certain Safeway facilities which are no
longer used in the retail gro c e ry business. The financial state-
ments of PDA are consolidated with those of the Company and
a minority interest of $23.9 million and $24.0 million at year- e n d
1998 and 1997 is included in accrued claims and other liabilities
in the accompanying consolidated balance sheets. During 1997,
the Company contributed to PDA six pro p e rties no longer used
in its retail gro c e ry business which had an aggregate net book
value of $4.9 million. The minority partner contributed cash in
an amount sufficient to maintain its 20% ownership. No gains or
losses were recognized on these transactions. In 1998, no pro p-
e rties were contributed to PDA. Safeway paid PDA $1.9 million
in 1998, $1.5 million in 1997 and $1.6 million in 1996 for re i m-
bursement of expenses related to management and real estate
s e rvices provided by PDA.

Note K: Commitments and Contingencies
Legal Matters In July 1988, there was a major fire at the
C o m p a n y ’s dry gro c e ry warehouse in Richmond, Californ i a .
T h rough January 2, 1999, in excess of 126,000 claims for
personal injury and pro p e rty damage arising from the fire
have been settled for an aggregate amount of approximately
$123.9 million. The Company’s loss as a result of the fire dam-
age to its pro p e rty and settlement of the above claims was
substantially covered by insurance.
As of January 2, 1999, there were still pending appro x i-
mately 3,100 claims against the Company for personal injury
(including punitive damages), and approximately 290 separate
claims for pro p e rty damage, arising from the smoke, ash and
embers generated by the fire. A substantial percentage of
these claims have been asserted in lawsuits against the
Company filed in the Superior Court for Alameda County,
C a l i f o rnia. There can be no assurance that the pending claims
will be settled or otherwise disposed of for amounts and on
terms comparable to those settled to date.
In early 1996, a purported class action was filed in the
Superior Court for Alameda County, California on behalf of
persons allegedly injured as a result of the smoke, ash and
embers generated by the fire. The complaint, which was
amended after the Court sustained the Company’s demurre r
with leave to amend, generally alleged that the Company
fraudulently (i) obtained settlements of certain claims arising
out of the fire and (ii) made statements that induced claimants
not to file actions within the time period under the statute of
limitations. The amended complaint sought compensatory and
punitive damages. In May 1997, the Court dismissed the case,
and in May 1998 the California C o u rt of Appeal aff i rmed the
dismissal. In August 1998, plaintiffs’ petition for review by the
C a l i f o rnia Supreme Court was denied.
On July 10, 1998, Safeway was served with a new case
filed in the Superior Court for Alameda County, California
by the same attorney who handled the purported class action
described in the preceding paragraph. Safeway filed a demur-
rer, and plaintiffs filed an amended complaint. Safeway filed
a demurrer to the amended complaint. The first complaint
a s s e rted allegations that are generally similar to those in the
case described above. The amended complaint contains factual
allegations that materially contradict those contained in the
first complaint and includes a claim for breach of contract.
P l a i n t i ffs seek damages according to proof, plus interest and
punitive damages. The case purports to be filed on behalf of
a p p roximately 21,500 individual plaintiffs. On March 5, 1999,
the Court sustained Safeway’s demurrer to plaintiffs’ fraud
claim and overruled Safeway’s demurrer to plaintiffs’ contract
claim. The Company believes that the claims in the new case
a re without merit and intends to defend this lawsuit vigoro u s l y.
The Company has received notice from its insurance carrier
denying coverage for the claims asserted in the two purported
class action suits described above. Safeway strongly disagrees
with the insurance carrier’s denial of coverage. Safeway contin-
ues to believe that coverage under its insurance policy will be
sufficient and available for resolution of all remaining personal
injury and property damage claims arising out of the fire.
On September 13, 1996, a class action lawsuit entitled
McCampbell et al. v. Ralphs Gro c e ry Company, et al., was filed
in the Superior Court of San Diego County, California against
Vons and two other grocery store chains operating in southern
C a l i f o rnia. In the complaint it is alleged, among other things,
that Vons and the other defendants conspired to fix the re t a i l
price of eggs in southern California. The plaintiffs claim that
the defendants violated provisions of the California Cartwright
Act and engaged in unfair competition. Plaintiffs seek damages
they allege the class has sustained; the amount of damages
sought is not specified. Plaintiffs have produced a damages
study which purports to support damages in excess of
$90 million attributable to Vons. If any damages were to be
awarded, they may be trebled under the applicable statute.
In addition, plaintiffs seek an injunction against future acts
that would be in restraint of trade or that would constitute
unfair competition. An answer has been filed to the complaint
that denies plaintiffs’ allegations and sets forth several defens-
es. On October 3, 1997, the Court issued an order certifying a
class of retail purchasers of white chicken eggs by the dozen
from defendants’ stores within the Counties of Los Angeles,
Riverside, San Bernardino, San Diego, Imperial and Orange
during the period from September 13, 1992 to the present.
On September 23, 1998 the Court denied defendants’ motions
for summary judgment. It is expected that trial will commence
in the third quarter of 1999. The Company believes that Vons

Note L: SegmentsS a f e w a y ’s retail gro c e ry business, which re p resents more than 98% of consolidated sales, is its only re p o rtable segment. The following
table presents information about the Company by geographic area (in millions):
U.S. Canada Total
1998
Sales $21,241.7 $3,242.5 $24,484.2Operating profit 1,467.3 134.4 1,601.7Income before income taxes 1,272.3 124.6 1,396.9Total assets 10,541.9 847.7 11,389.6
1997
Sales $ 19,075.9 $ 3,407.9 $ 22,483.8Operating profit 1,169.6 110.1 1,279.7Income before income taxes and extraordinary loss 978.4 97.9 1,076.3Total assets 7,613.7 880.2 8,493.9
1996
Sales $ 13,797.5 $ 3,471.5 $ 17,269.0Operating profit 752.8 138.9 891.7Income before income taxes 652.2 115.4 767.6Total assets 4,625.4 919.8 5,545.2
has meritorious defenses to plaintiffs’ claims and plans to
defend this lawsuit vigorously.
Safeway acquired Dominick’s in November 1998. At that
time, there was pending against Dominick’s a class action
lawsuit that had been filed in the U.S. District Court for the
N o rt h e rn District of Illinois in March 1995, alleging gender
discrimination and seeking compensatory and punitive dam-
ages in an unspecified amount. The lawsuit also alleges national
origin discrimination, but the court denied plaintiffs’ class
c e rtification motion as to those claims. The Company believes
D o m i n i c k ’s has meritorious defenses and plans to defend this
lawsuit vigoro u s l y.
T h e re are also pending against Company various claims
and lawsuits arising in the normal course of business, some of
which seek damages and other relief, which, if granted, would
require very large expenditures.
It is management’s opinion that although the amount of
liability with respect to all of the above matters cannot be
a s c e rtained at this time, any resulting liability, including any
punitive damages, will not have a material adverse effect on
the Company’s financial statements taken as a whole.
Commitments The Company has commitments under contracts
for the purchase of pro p e rty and equipment and for the con-
s t ruction of buildings. Portions of such contracts not completed
at year-end are not reflected in the consolidated financial state-
ments. These unrecorded commitments were $63.8 million at
year-end 1998.

Note M: Computation of Earnings Per Share
1998 1997 1996■ ■ ■ ■ ■■■ ■■ ■ ■ ■ ■ ■ ■ ■■ ■■ ■ ■ ■ ■ ■
(In millions, except per-share amounts) Diluted Basic Diluted Basic Diluted Basic
Income before extraordinary loss $806.7 $806.7 $621.5 $621.5 $460.6 $460.6 Extraordinary loss – – (64.1) (64.1) – –
■ ■ ■ ■ ■ ■ ■ ■ ■ ■ ■ ■ ■ ■ ■ ■ ■■ ■ ■ ■ ■ ■ ■ ■ ■■ ■ ■ ■ ■ ■ ■ ■ ■ ■ ■ ■■ ■ ■ ■ ■ ■ ■ ■ ■■ ■■Net income $806.7 $806.7 $557.4 $557.4 $460.6 $460.6
■ ■ ■ ■ ■ ■ ■ ■ ■ ■ ■ ■ ■ ■ ■ ■ ■■ ■ ■ ■ ■ ■ ■ ■ ■■ ■ ■ ■ ■ ■ ■ ■ ■ ■ ■ ■■ ■ ■ ■ ■ ■ ■ ■ ■■ ■■
Weighted average common shares outstanding 482.8 482.8 462.3 462.3 436.0 436.0■ ■ ■ ■ ■ ■ ■ ■ ■ ■ ■ ■ ■ ■ ■ ■ ■■ ■ ■ ■■ ■ ■■ ■■■ ■ ■ ■ ■ ■ ■ ■ ■■ ■ ■ ■ ■ ■ ■ ■ ■ ■ ■ ■ ■ ■ ■ ■ ■ ■ ■ ■ ■ ■ ■ ■ ■ ■ ■ ■ ■ ■■ ■■ ■■
Common share equivalents 26.0 35.4 39.7■ ■ ■ ■ ■ ■ ■ ■ ■ ■ ■ ■ ■ ■ ■ ■■ ■■ ■ ■ ■ ■ ■ ■ ■ ■ ■■ ■ ■ ■ ■ ■ ■ ■ ■■ ■ ■ ■ ■ ■ ■ ■ ■ ■ ■ ■ ■■ ■ ■■ ■ ■ ■ ■ ■ ■ ■■ ■ ■ ■ ■ ■ ■ ■ ■■ ■■
Weighted average shares outstanding 508.8 497.7 475.7■ ■ ■ ■ ■ ■ ■ ■ ■ ■ ■ ■ ■ ■ ■ ■■ ■■ ■ ■ ■ ■ ■ ■ ■ ■ ■■ ■ ■ ■ ■ ■ ■ ■ ■■ ■ ■ ■ ■ ■ ■ ■ ■ ■ ■ ■ ■■ ■ ■■ ■ ■ ■ ■ ■ ■ ■■ ■ ■ ■ ■ ■ ■ ■ ■■ ■■
Earnings per common share and common share equivalent:
Income before extraordinary loss $ 1.59 $ 1.67 $ 1.25 $ 1.35 $ 0.97 $ 1.06Extraordinary loss – – (0.13) (0.14) – –
■ ■ ■ ■ ■ ■ ■ ■ ■ ■ ■ ■ ■ ■ ■ ■ ■■ ■ ■ ■ ■ ■ ■ ■ ■■ ■ ■ ■ ■ ■ ■ ■ ■ ■ ■ ■■ ■ ■ ■ ■ ■ ■ ■ ■■ ■■Net income $ 1.59 $ 1.67 $ 1.12 $ 1.21 $ 0.97 $ 1.06
■ ■ ■ ■ ■ ■ ■ ■ ■ ■ ■ ■ ■ ■ ■ ■ ■■ ■ ■ ■ ■ ■ ■ ■ ■■ ■ ■ ■ ■ ■ ■ ■ ■ ■ ■ ■■ ■ ■ ■ ■ ■ ■ ■ ■■ ■■
Calculation of common share equivalents: Options and warrants to purchase
common shares 48.0 58.6 62.6Common shares assumed purchased with
potential proceeds (22.0) (23.2) (22.9)■ ■ ■ ■ ■ ■ ■ ■ ■ ■ ■ ■ ■ ■ ■ ■■ ■■ ■ ■ ■ ■ ■ ■ ■ ■ ■■ ■ ■ ■ ■ ■ ■ ■ ■■ ■ ■ ■ ■ ■ ■ ■ ■ ■ ■ ■ ■■ ■ ■■ ■ ■ ■ ■ ■ ■ ■■ ■ ■ ■ ■ ■ ■ ■ ■■ ■■
Common share equivalents 26.0 35.4 39.7■ ■ ■ ■ ■ ■ ■ ■ ■ ■ ■ ■ ■ ■ ■ ■■ ■■ ■ ■ ■ ■ ■ ■ ■ ■ ■■ ■ ■ ■ ■ ■ ■ ■ ■■ ■ ■ ■ ■ ■ ■ ■ ■ ■ ■ ■ ■■ ■ ■■ ■ ■ ■ ■ ■ ■ ■■ ■ ■ ■ ■ ■ ■ ■ ■■ ■■
Calculation of common shares assumed purchased with potential proceeds:
Potential proceeds from exercise of options and warrants to purchase common shares $913.9 $597.4 $394.3
Common stock price used under the treasury stock method $41.60 $25.75 $17.22
Common shares assumed purchased with potential proceeds 22.0 23.2 22.9

Note N: Quarterly Information (Unaudited)The summarized quarterly financial data presented below reflect all adjustments which, in the opinion of management, are of a
normal and recurring nature necessary to present fairly the results of operations for the periods presented.
Last 16 Third 12 Second 12 First 12(In millions, except per-share amounts) 52 Weeks Weeks Weeks Weeks Weeks
1998
Sales $24,484.2 $7,922.6 $5,589.0 $5,583.3 $5,389.3Gross profit 7,124.5 2,288.1 1,650.1 1,622.2 1,564.1Operating profit 1,601.7 511.8 377.8 380.9 331.2Income before income taxes 1,396.9 441.6 335.5 334.4 285.4Net income 806.7 255.0 193.7 193.2 164.8Earnings per share:Basic $ 1.67 $ 0.52 $ 0.40 $ 0.40 $ 0.34Diluted 1.59 0.50 0.38 0.38 0.33Price range, New York Stock Exchange 613⁄8 613⁄8 463⁄4 407⁄16 371⁄4
to 30 1⁄2 to 375⁄8 to 371⁄4 to 34 to 301⁄2
Last 17 Third 12 Second 12 First 12(In millions, except per-share amounts) 53 Weeks Weeks Weeks Weeks Weeks
1997
Sales $22,483.8 $7,785.4 $5,371.4 $5,249.2 $4,077.8Gross profit 6,414.7 2,211.3 1,552.6 1,505.3 1,145.5Operating profit 1,279.7 439.6 317.3 298.0 224.8Income before income taxes and
extraordinary loss 1,076.3 372.2 259.8 240.2 204.1Extraordinary loss related to early
retirement of debt net of income tax benefit (64.1) – (59.9) (4.2) –
Net income 557.4 214.9 90.1 129.9 122.5Earnings per share:Basic
Income before extraordinary loss $ 1.35 $ 0.46 $ 0.32 $ 0.29 $ 0.28Extraordinary loss (0.14) – (0.13) (0.01) –
■ ■ ■ ■ ■ ■ ■ ■ ■ ■ ■ ■ ■ ■ ■ ■ ■ ■ ■ ■ ■ ■ ■ ■ ■ ■ ■ ■ ■ ■ ■ ■ ■ ■ ■ ■Net income $ 1.21 $ 0.46 $ 0.19 $ 0.28 $ 0.28
■ ■ ■ ■ ■ ■ ■ ■ ■ ■ ■ ■ ■ ■ ■ ■ ■ ■ ■ ■ ■ ■ ■ ■ ■ ■ ■ ■ ■ ■ ■ ■ ■ ■ ■ ■Diluted
Income before extraordinary loss $ 1.25 $ 0.43 $ 0.30 $ 0.27 $ 0.26Extraordinary loss (0.13) – (0.12) (0.01) –
■ ■ ■ ■ ■ ■ ■ ■ ■ ■ ■ ■ ■ ■ ■ ■ ■ ■ ■ ■ ■ ■ ■ ■ ■ ■ ■ ■ ■ ■ ■ ■ ■ ■ ■ ■Net income $ 1.12 $ 0.43 $ 0.18 $ 0.26 $ 0.26
■ ■ ■ ■ ■ ■ ■ ■ ■ ■ ■ ■ ■ ■ ■ ■ ■ ■ ■ ■ ■ ■ ■ ■ ■ ■ ■ ■ ■ ■ ■ ■ ■ ■ ■ ■Price range, New York Stock Exchange $ 312 3⁄3 2 $ 3123⁄32 $ 273⁄4 $ 2413⁄16 $ 26
to 209⁄16 to 2511⁄32 to 231⁄16 to 211⁄8 to 209⁄16

Independent Auditors’ Report
Management’s Report
The Board of Directors and Stockholders of Safeway Inc.:
We have audited the accompanying consolidated balance sheets of Safeway Inc. and subsidiaries as of January 2, 1999and January 3, 1998, and the related consolidated statements of income, stockholders’ equity and comprehensive income and of cash flows for each of the three fiscal years in the period ended January 2, 1999. These financial statements are the responsibility of the Company’s management. Ourresponsibility is to express an opinion on these financial statements based on our audits.
We conducted our audits in accordance with generallyaccepted auditing standards. Those standards require that we plan and perf o rm the audit to obtain reasonable assuranceabout whether the financial statements are free of materialmisstatement. An audit includes examining, on a test basis,evidence supporting the amounts and disclosures in the
financial statements. An audit also includes assessing theaccounting principles used and significant estimates made by management, as well as evaluating the overall financialstatement presentation. We believe that our audits provide a reasonable basis for our opinion.
In our opinion, such consolidated financial statements present fairly, in all material respects, the financial position of Safeway Inc. and subsidiaries as of January 2, 1999 andJ a n u a ry 3, 1998, and the results of their operations and theircash flows for each of the three fiscal years in the period ended January 2, 1999 in conformity with generally acceptedaccounting principles.
San Francisco, CaliforniaFebruary 23, 1999
Financial Statements Safeway Inc. is responsible for thepreparation, integrity and fair presentation of its publishedfinancial statements. The accompanying consolidated financialstatements have been prepared in accordance with generallyaccepted accounting principles and necessarily include amountsthat are based on judgments and estimates made by manage-ment. Safeway also prepared the other information included in the annual report and is responsible for its accuracy and consistency with the financial statements.
The financial statements have been audited by Deloitte &Touche L L P, independent auditors, which was given unre s t r i c t e daccess to all financial re c o rds and related data, including minutes of all meetings of stockholders, the Board of Dire c t o r s ,and committees of the Board. Safeway believes that all repre-sentations made to the independent auditors during their audit were valid and appropriate. The re p o rt of Deloitte &Touche LLP is presented below.
Internal Control System Safeway maintains a system of internal control over financial reporting, which is designed to provide reasonable assurance to management and the Board of Directors regarding the preparation of reliable published financial statements. The system includes a documented organizational stru c t u re and division of re s p o n s i b i l i t y, established policies and pro c e d u res including
a code of conduct to foster a strong ethical climate, which arecommunicated throughout Safeway, and the careful selection,training and development of employees. Internal auditors monitor the operation of the internal control system and reportfindings and recommendations to management and the Board,and corrective actions are taken to address control deficienciesand other opportunities for improving the system as they areidentified. The Board, operating through its Audit Committee,which is composed entirely of outside directors, provides oversight to the financial reporting process.
T h e re are inherent limitations in the effectiveness of any system of internal control, including the possibility of c i rcumvention or overriding of controls. Accord i n g l y, even aneffective internal control system can provide only reasonableassurance with respect to financial statement pre p a r a t i o n .Furthermore, the effectiveness of an internal control systemcan change with circumstances. As of January 2, 1999, Safewaybelieves its system of internal controls over financial re p o rt i n gwas effective for providing reliable financial statements.
Steven A. Burd David G. WeedChairman, President and Executive Vice President and Chief Executive Officer Chief Financial Officer

Directors and Officers
DIRECTORS
Steven A. BurdChairman, President and Chief Executive OfficerSafeway Inc.
James H. Greene, Jr.MemberKKR & Co., LLC
Paul HazenChairmanWells Fargo & Co.
Henry R. KravisMember KKR & Co., LLC
Robert I. MacDonnellMemberKKR & Co., LLC
Peter A. MagowanManaging General Partner and PresidentSan Francisco Giants
George R. RobertsMemberKKR & Co., LLC
William Y. TauscherFormer Chairman and Chief Executive OfficerVanstar Corporation
EXECUTIVE OFFICERS
Steven A. BurdChairman, President andChief Executive Officer
Kenneth W. OderExecutive Vice PresidentLabor Relations, Human Resources,Law, Public Affairs and Information Technology
David G. WeedExecutive Vice President andChief Financial Officer
David F. BondSenior Vice PresidentFinance and Control
David T. ChingSenior Vice President and Chief Information Officer
Dick W. GonzalesSenior Vice PresidentHuman Resources
Lyn C. GordonSenior Vice PresidentStrategic Development
Lawrence V. JacksonSenior Vice PresidentSupply Operations
Melissa C. PlaisanceSenior Vice PresidentFinance and Public Affairs
Larree M. RendaSenior Vice PresidentCorporate Retail Operations
Michael C. RossSenior Vice PresidentSecretary and General Counsel
Gary D. SmithSenior Vice President andDirector of Marketing
Donald P. WrightSenior Vice PresidentReal Estate and Engineering
Richard A. WilsonVice PresidentTax
OTHER OFFICERS
Senior Vice Presidents – Retail
Michael J. BessireEastern Division President
Robert A. DiensSeattle Division President
Bruce EveretteNorthern California Division President
Robert H. HenryPortland Division President
John A. KingDenver Division President
Thomas A. MosseyPhoenix Division President
Richard W. DreilingPresidentThe Vons Companies, Inc.
Timothy J. HakinPresidentDominick’s Finer Foods, Inc.
Vice Presidents – Retail
Howard BefortJohn L. BoyleFrank A. CalfasThomas D. CastleberryHenry A. CominielloGlenn E. DavisAlan J. DobbinsWayne FoxworthySteven R. FrisbyKathleen A. GallagherHoward M. GerelickGordon HarmanRojon HaskerGerard A. HoffmanC. Mark HusseyGerald D. JonesThomas C. KellerTheresa M. KersgieterJames R. LewisDouglas LobsingerMichael F. MallonThomas PankowJ. Gary RhymesGary S. RocheleauScott K. RutherfordKarl SchroederGregory A. SparksLarry D. VanderdoesLyle A. WatermanRonald S. ZinterDavid J. Zylstra
Vice Presidents – Supply
Stephen A. ArmstrongStephen J. KennedyChris D. Moloney
Vice Presidents – Service
Jeffrey D. AhlersMichael J. BoylanRichard E. CancillaRobert S. CarlsonThomas J. ConwayNancy E. CotaThomas J. DeMottBrian G. DowlingDennis J. DunneRobert J. Dunst, Jr.Michael J. FerrellTerry L. GilbrethScott D. GrahamDianne M. LamendolaMichael H. LebTerry C. LeeJonathan O. MayesMichael R. MinasiHarvey K. NaitoThomas D. NartkerRichard S. OasRonald K. ParmeleeRobert W. PerryEric G. RedonaStuart E. RheaKenneth M. ShachmutDonald B. ShawDavid R. SternLinda M. WattDavid R. WeiermanJames E. WhitticomEdgar J. Wright, Jr.
FOREIGN SUBSIDIARY OPERATIONS
CANADA SAFEWAY LIMITED
Directors
Grant M. HansenPresident and Chief Operating Officer
Gerald A. GeoffreyVice President and Chief Financial Officer
M. Bruce Bowman Vice President, General Counsel and Secretary
Other Officers
Vice Presidents – Retail
Chuck J. MulvennaDavid E. Rodych Daniel Skelly
Vice Presidents – Service
Earl R. BrownGord K. CannadyLouis J. HoganJames C. McCullochLinda T. OswaldWilliam Sexsmith
EQUITY AFFILIATE
Casa Ley, S.A. de C.V. (Mexico)
Juan Manuel Ley LopezDirector General

Investor Information
EXECUTIVE OFFICES
Mailing Address:Safeway Inc.P.O. Box 99Pleasanton, CA 94566-0009
STOCK TRANSFER AGENT AND REGISTRAR
First Chicago Trust Company of New YorkP.O. Box 2500Jersey City, NJ 07303-2500800-756-8200
FORM 10-K
A copy of Safeway’s 1998 Form 10-K filed with the Securities and ExchangeCommission may be obtained by writing to the Investor Relations Department at our executive offices, or by calling 925-467-3790.
INDEPENDENT AUDITORS
Deloitte & Touche LLP
San Francisco, California
ANNUAL MEETING
The 1999 Annual Meeting of Stockholderswill be held on May 11, 1999. A notice ofthe meeting, together with a proxy state-ment and a form of pro x y, were mailed to stockholders with this annual re p o rt .
STOCK EXCHANGE LISTING
The company’s common stock, which trades under the symbol SWY, and cert a i nd e b e n t u res and notes are listed on the New York Stock Exchange.
INTERNET ADDRESS
Safeway’s web site on the Internet can be accessed at http://www.safeway.com.
INVESTOR INQUIRIES
Communications regarding investor records, including changes of address or ownership, should be directed to the company’s transfer agent, First ChicagoTrust Company of New York, at the address listed on the left.
To inquire by phone, please call 800-756-8200.
Investors, security analysts and members of the media should direct theirfinancial inquiries to Melissa C. Plaisance,Senior Vice President, Finance and PublicAffairs, at our executive offices.
To obtain or access financial reports,please write to our Investor RelationsDepartment, call 925-467-3790 or check our web site at http://www.safeway.com.
EEO-1 REPORT
As an equal opportunity employer,Safeway values and actively supports diversity in the workplace. A copy of thecompany’s 1998 summary EEO-1 report, filed with the federal Equal EmploymentOpportunity Commission, is available upon request at our executive offices.
TRUSTEES AND PAYING AGENTS
5.75% Notes5.875% Notes6.05% Notes6.50% Notes6.85% Senior Notes7.00% Senior Notes7.45% Senior Debentures9.65% Senior Subordinated Debentures10.00% Senior Subordinated Notes
The Bank of New YorkShareholder Relations DepartmentChurch Street StationP.O. Box 11258New York, NY 10286800-524-4458
9.30% Senior Secured Debentures
The First National Bank of ChicagoCorporate Trust Investor RelationsOne First National Plaza, Suite 0134Chicago, IL 60670-0134800-524-9472
9.35% Senior Subordinated Notes9.875% Senior Subordinated Debentures
Harris Trust and Savings BankP.O. Box 755Chicago, IL 60690312-461-2908
10.00% Senior Notes
Trustee The Chase Manhattan BankCorporate Trust Administration101 California Street, Suite 2725 San Francisco, CA 94111415-954-9581
Paying AgentBankers Trust CompanyCorporate Trust & Agency Group4 Albany Street, 4th FloorNew York, NY 10006212-250-6161