Safer Vehicle Design - Amazon Web Services
31
Safer Vehicle Design S. Mukherjee S. Mukherjee TRIPP IIT Delhi
Transcript of Safer Vehicle Design - Amazon Web Services

Safer Vehicle Design
S. MukherjeeS. Mukherjee
TRIPP
IIT Delhi
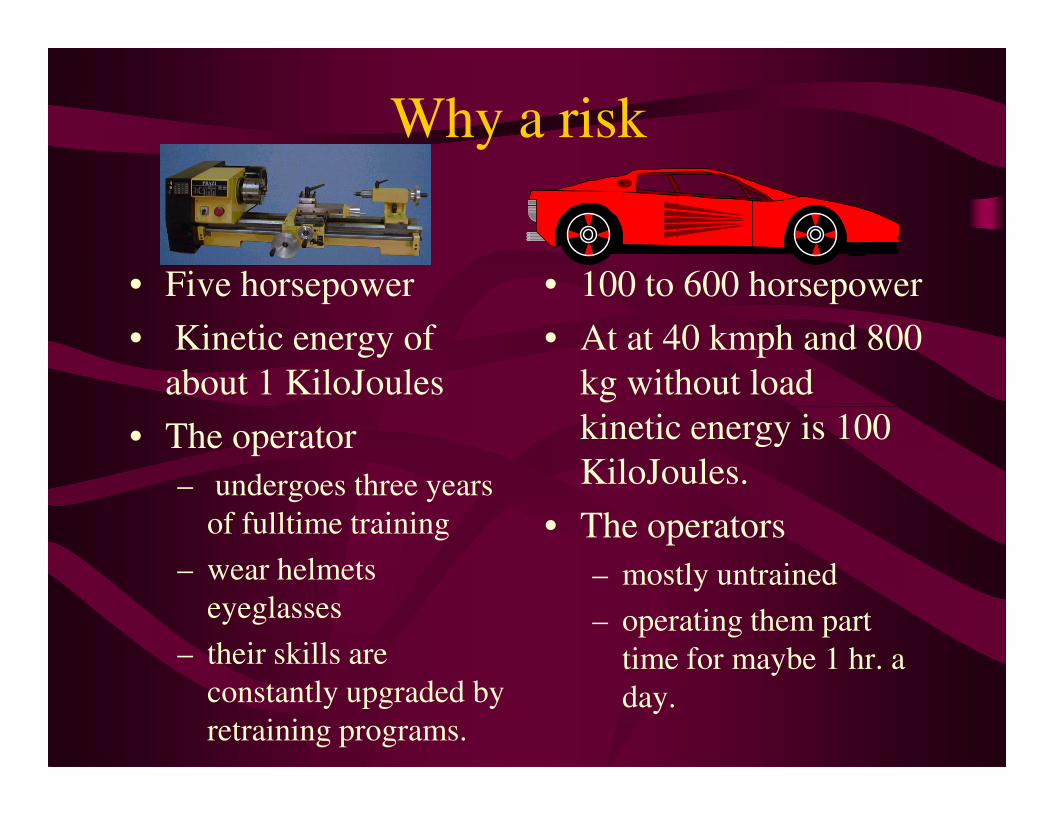
Why a risk
• Five horsepower
• Kinetic energy of
about 1 KiloJoules
• 100 to 600 horsepower
• At at 40 kmph and 800
kg without load
kinetic energy is 100 • The operator
– undergoes three years
of fulltime training
– wear helmets
eyeglasses
– their skills are
constantly upgraded by
retraining programs.
kinetic energy is 100
KiloJoules.
• The operators
– mostly untrained
– operating them part
time for maybe 1 hr. a
day.

Safety cannot be cognitive
• We can convert a typical speed of 40 km/hr.
to the more engineering 11 m/s.
• If the dashboard is 1m away
• If the car comes to a dead halt, • If the car comes to a dead halt,
distance covered in 1/11 sec.
• Flick of an eyelash or three human
synapse
• Three synapse cycles is too small
for any cognitive action.

Safety cannot be reflex• The 5 kg baby has a kinetic energy of
approximately 300 Joules.
• 300 Joules is equivalent to lifting a 60 kg
mass by half a meter against gravity.
• Doing that in tenth of a second is beyond • Doing that in tenth of a second is beyond
the capacity of most humans.
• Parental instinct will just not be backed by
parental muscle power.
• Must be engineered.

Newton and Safety
• Equivalent impact when travelling
in a vehicle at 40 km/hr.
• Velocity attained by a body under
free fall through a height of 6.2 m.
(two floors)
• Vaulting record of Sergei Bubka.
• As a kid, I have jumped down from
one floor height and am still
healthy, but not two floors.

Wear a cushion
• For Mr. Bubka, the IOC
recommends a cushioning of
28” depth.
• Most car users would not like
to strap a cushion the moment to strap a cushion the moment
they sit inside vehicles.
• The cushion appears only when
there is an impact, and is called
an airbag.
• Stringent requirements make
airbags cost $1000.

Slow it down
• If the vehicle speed is halved, the survival height
becomes 1.5 m in place of 6 m
• The bonnet of a car is about a metre.
• If the bonnet compress on impact, then the • If the bonnet compress on impact, then the
dashboard of the vehicle does not stop
instantaneously but travels forward.
• This gives additional space to the designer of the
airbag and seatbelt to bring the rider to rest.
• It is not sufficient to have a crush zone. The
crushing must be supported by appropriate seat
belt design to save lives

Honeycomb
• Honeycomb materials used to design crush
zones as they have good energy absorption
characteristics.
• They can be designed to fit stress corridors
on demand and are lightweight structural on demand and are lightweight structural
materials.

VRU• There are many more people outside the vehicle
than inside in developing countries.
• The principles used in protecting the riders are
applicable in protecting the road user as well.
• One design would be to mandate a crush boundary • One design would be to mandate a crush boundary
layer of half a meter.
• Bonnets that fold on impact, rounding of front
profile, sinking hard pivots of windscreen wiper
below the bonnet are some of the measures
• Present-day bumper and bonnets with small
clearance to engine are not VRU friendly.
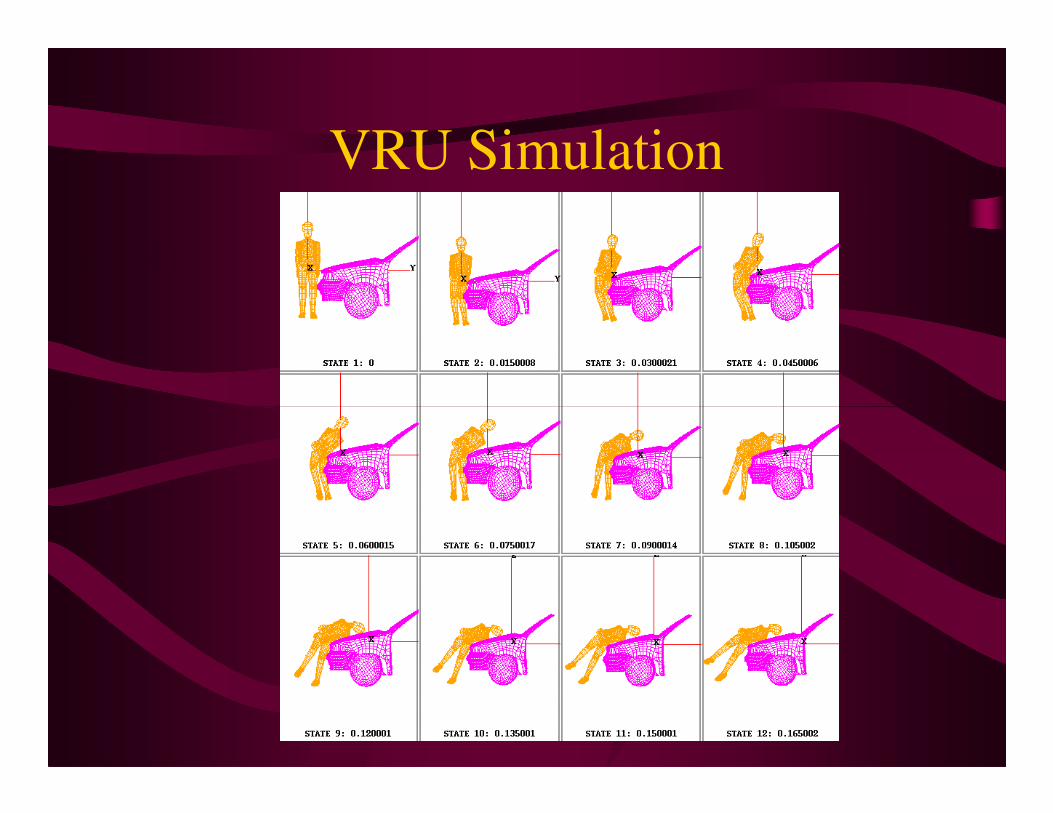
VRU Simulation

Car MC Crash

Airbags
• Airbags have to deploy fully within 5 ms to
avoid ‘slapping’ the rider.
Very effective in
protecting riders
avoid ‘slapping’ the rider.
• The airbag mass is about 200 gm. and
moves at a peak speed of around 100m/s !
• Energy content is about 1000 Joules!
• A slap good enough to break a jaw.
• Plus avoid hot gases scalding the rider.

Airbags
2 ms
48 ms

Nature of Standards
• Common basic methodology for assessing systems
• Standards are based on existing proven technology
• Should be updated whenever necessary.
• Research standards need quantitative measures
• Legislative standards require pass/no-pass evaluations.• Legislative standards require pass/no-pass evaluations.
• Establish the simplest procedures that give standardised,
repeatable, reproducible, realistic, and representative test
conditions
• Inferences’ concerning the relevance of the sample results for
the overall population can be made using statistical or
simulation techniques

Outcome
Injury risk
Injury severity
Inp
ut
Outcome
Exposure
Dosage
Cra
sh s
everity
Injury risk
Injury severity

Outcome
Injury risk
Injury severity
Inp
ut
Outcome
Head A
ccele
ratio
n
Chest C
om
pre
ssio
n
Fem
ur C
om
pre
ssiv
e L
oad
Injury risk
Injury severity

WHAT LEVEL OF INJURY IS
ACCEPTABLE?
• Prevent Death?
• Prevent Permanent Disabilities?
• Prevent AIS 3+ Injuries?• Prevent AIS 3+ Injuries?
• Prevent AIS 3+ to X% of Population?
• Prevent AIS 2+ to Y% of Population?

Injury CriteriaHead Injury Criteria (HIC)
< 1000Max
F + M
F + Mc c< 1Nij=
( )( )
HIC t tt t
a dtt
t= -
-.
2 1
2 1
251
1
2
∫
.
Compression Criteria s(t) < 7.5 cmAcceleration Criteria a(t) < 65 g’sViscous Criteria (V*C) V(t)*s(t)/D < 1 m/s
F < 8 kN
Knee Shear
x < 15 mm
F + M
F + Mc c<1TI =
Force CriteriaF(t) < 10 kN

“Censored” Biomechanical Test Data
Injury X X XXXXXX X X XX X X X X1
TransitionRegion
No InjuryRegion
InjuryRegion
Parameter
No Injury X X X XXXXXX X XX X X X X0

Inju
ry R
isk F
un
ction
.1
.00
Cumulative Frequency Distribution
0.5
0
Pa
ram
ete
r
0.0
0
Cumulative Frequency Distribution
0.5
0
0.4
0.6
0.8
1
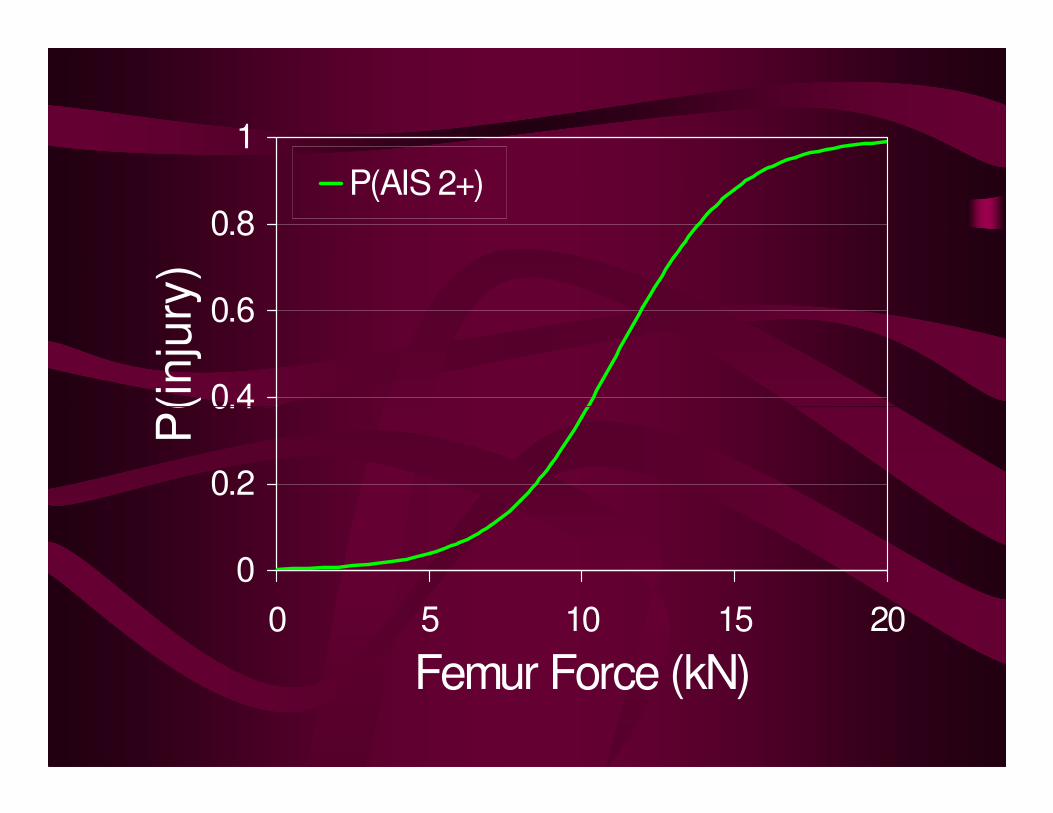
P(i
nju
ry)
P(AIS 2+)
0
0.2
0.4
0 5 10 15 20
Femur Force (kN)
P(i
nju
ry)

0.4
0.6
0.8
1
P(inju
ry)
P(AIS 2+)
P(AIS 3+)
P(AIS 4+)
P(AIS 5+)
0
0.2
0.4
0 20 40 60 80 100
Maximum Chest Compression (mm)
P(inju
ry)

0.4
0.6
0.8
1P
(in
jury
)
P(AIS 2+)
0
0.2
0.4
0 50 100 150 200
Peak Chest Acceleration (g)
P(in
jury
)
P(AIS 2+)
P(AIS 3+)
P(AIS 4+)
P(AIS 5+)

Who is an
average
adult adult
person?


50th percentile adult male
• The 50th percentile is the smallest number for which at least 50% of the numbers are less than or equal to it.
• So a dummy with all dimensions, weight • So a dummy with all dimensions, weight and moment of inertia such that 50% of the US population are less than or equal to that measure.
• What are the implications for your safety?

Converting Injury Risk vs. Crash Severity
Crash
Injury Risk
P(1/x)P(1/x)
Crash
Severity
Dummy Response
Volvo Car Corporation
P(1/x)
What was achieved
• Data reveals that occupants travelling in cars manufactured between 1978 and 1982 are 28% more likely to be seriously injured than those in cars manufactured between 1992 and 1997.
• Newer cars perform even better in crashes.
• Analysis undertaken by the Monash University Accident • Analysis undertaken by the Monash University Accident Research Centre has shown that there is a good correlation between the ANCAP crash test results and the vehicle's actual real world performance as measured in the Used Car Safety Ratings.
• This accords with overseas studies such as a survey by the United States National Highway Traffic Safety Administration which showed that cars that did well in US NCAP crash tests experienced a lower occupant fatality rate in real world crashes than those that did poorly.

The road forward for India
• Establish safety standards with emphasis
on:
– type A and smaller vehicles.
– Vans and other utility vehicles
– Three wheelers
• Pedestrian impact standards irrespective of
what the rest of the world does.
• Include buses and trucks in the standards.
– Include under run protection for two wheelers

• Investigate helmet standards to make it
more suitable to Indian conditions.
• Set up 2 - 3 multidisciplinary crash research
teams.
– The mandate of the teams will be to understand
special conditions and needs in India.special conditions and needs in India.
– Establish epidemology of crashes.
• This data is essential for estimating the
effect of safety systems and change in
standards
Good luck !