SAFE STREETS nyc - Welcome to NYC.gov | City of New … STREETS nyc Traffic Safety Improvements In...
49
SAFE STREETS nyc Traffic Safety Improvements In New York City MICHAEL R BLOOMBERG mayor JANETTE SADIK-KHAN commissioner DEPT OF TRANSPORTATION June 2007
Transcript of SAFE STREETS nyc - Welcome to NYC.gov | City of New … STREETS nyc Traffic Safety Improvements In...

SAFE STREETS nycTraffic Safety Improvements
In New York City
MICHAEL R BLOOMBERG mayor
JANETTE SADIK-KHANcommissioner
DEPT OF TRANSPORTATION
June 2007

Safe Streets NYC:Traffic Safety Improvements in New York City
June 2007
DISCLAIMER: The preparation fo this report was funded by the Federal Highway Administration of the United States Department of Transportation and the New York State Department of Transpor-tation. The contents do not necessarily reflect the official views or policies of the Federal Highway Administration or New York State Department of Transportation. This document is disseminated by the New York City Department of Transportation in the interest of information exchange. This report does not consitute a standard, specification or regulation.
Note:
All new content since the last publication of this report (April 2006) is identified by red bold fonts.
May 2007
IMPROVING TRAFFIC SAFETY 1Fatalities 2NYC Compared to the USA 5Severe Injuries 7Traffic Accidents 8High Accident Locations 9 Locations Discussed in this Report 14
THE BRONX 15Grand Concourse 16Grand Concourse Pedestrian Safety Demonstration Project 20
Grand Concourse and East 170th Street 27Grand Concourse and East 183rd Street 29
South Bronx Churches 31East Fordham Road, East Kingsbridge Road, Bainbridge Avenue 36University Avenue, West 181st Street, Hall of Fame Terrace 40
TABLE OF CONTENTS
BROOKLYN 43Grand Army Plaza 44Improvements in the Vicinity of Eastern Parkway & Kings Highway, Linden Boulevard, Remsen Avenue 48
Eastern Parkway 49Kings Highway, Linden Boulevard, Remsen Avenue 60
Ocean Parkway 69Bushwick Ave, East New York Ave, Jackie Robinson Parkway 71Gerritsen Avenue 75Downtown Brooklyn Traffic Improvements 80
Court Street 82Smith Street 84Fulton Street Corridor 86
MANHATTAN 92
East 20th Street and First Avenue 93Park Avenue and East 33rd Street 97Edgecombe Avenue 101Upper Park Avenue 104West 30th Street and 9th Avenue 109Triangle at Canal, Laight and Varick Streets 112Improvements in the Vicinity of Henry Hudson Parkway and West 95th and 96th Streets 118Henry Hudson Parkway Interchange 120
West 95th Street and Riverside Drive 125West 96th Street and Broadway 128West 95th Street between Riverside Drive, and Amsterdam Avenue 131West 96th Street and West End Avenue 133
QUEENS 135Queens Boulevard 136
Queens Boulevard Pedestrian Study 138Queens Boulevard Pedestrian Study (Phase II) 147Queens Boulevard High Accident Location Improvements 154Queens Boulevard, Woodhaven Blvd, and 59th Avenue 155Queens Boulevard, Van Dam Street and Thompson Avenue 157
Shore Front Parkway 159Rockaway Freeway 163Linden Boulevard and South Conduit Avenue 165Main Street: Southbound Service Road at 68th Drive 167Main Street: Southbound Service Road at 73rd Avenue 169Cooper Avenue Underpass and 74th Street 171Van Wyck Expressway and North Conduit Avenue 174Northern Boulevard Corridor 177Northern Boulevard and Clearview Expressway 181Francis Lewis Boulevard between 120th Avenue/220th Street and 125th Avenue/232nd Street 184Francis Lewis Boulevard between Springfield Boulevard and 120th Avenue/220th Street 18769th Street, Grand Avenue and Long Island Expressway 189Parson’s Boulevard and Kissena Boulevard 19180th Avenue 194
STATEN ISLAND 197Hylan Boulevard 198
Hylan Boulevard Left Turn Improvements 203Hylan Boulevard and Reynolds Street 207
Father Capodanno Boulevard 209Page Avenue and P.S. 6 211Borough Wide Daylighting Initiative 214Forest Avenue, Morningside Road and Richmond Avenue 217Narrows Road South and Richmond Road 220
BROOKLYN / QUEENS 222Atlantic Avenue Safety Improvements 223
Atlantic Avenue- Woodhaven Boulevard to Rockaway Boulevard 225Atlantic Avenue- Brooklyn Corridor 227Atlantic Avenue- Safety Study 229
CITYWIDE INITIATIVES 231Citywide Oversized Street Name Signs 232Improving Safety at Intermodal Transit Stops / Bus Stops under the El 236
36th Avenue and 31st Street 24139th Avenue and 31st Street 242Jerome Avenue and Burnside Avenue 245Bay Parkway and 86th Street 251
Citywide Pedestrian Bridge Safety Project 255
IMPROVING TRAFFIC SAFETY

SAFE STREETS NYC 2
IMPROVING TRAFFIC SAFETY Fatalities
Over the past several years, the Department of Transportation (DOT) has actively accelerated its efforts to improve pedestrian and traffic safety by instituting a proactive and systematic approach to the identification of locations throughout the city where innovative safety mitigation measures need to be implemented. While the scope and scale of these projects vary in terms of improvements, there is no greater testament to the City’s efforts than the decline of both pedestrian and vehicular fatalities over the past seventeen years. Some of the most remarkable strides have been made over the past three years as the Department has seen fatalities reach historic lows. In 2004, a watershed year for traffic safety, traffic-related fatalities fell to 298, the lowest tally since 1910 when there were 332 fatalities. In 2005, fatalities increased slightly to 321, but by 2006 fatalities had fallen again to 315, the second lowest annual total.
Fatalities by Mode - 2004, 2005 and 2006
156
68
361622
156
2122
45
77
162
68
45
24 160
20
40
60
80
100
120
140
160
180
Pedestrians Drivers Passengers Motorcyclists Bicyclists
Tot
al F
atal
ities
2004 2005 2006
Fatalities by Mode: Percentage Share - 2004, 2005 and 2006
12%
5%7%
23%
52%
24%
14%
7% 7%
49%
5%8%
14%
22%
51%
0%
10%
20%
30%
40%
50%
60%
Pedestrians Drivers Passengers Motorcyclists Bicyclists
Fata
litie
s (%
)
2004 2005 2006
SAFE STREETS NYC �
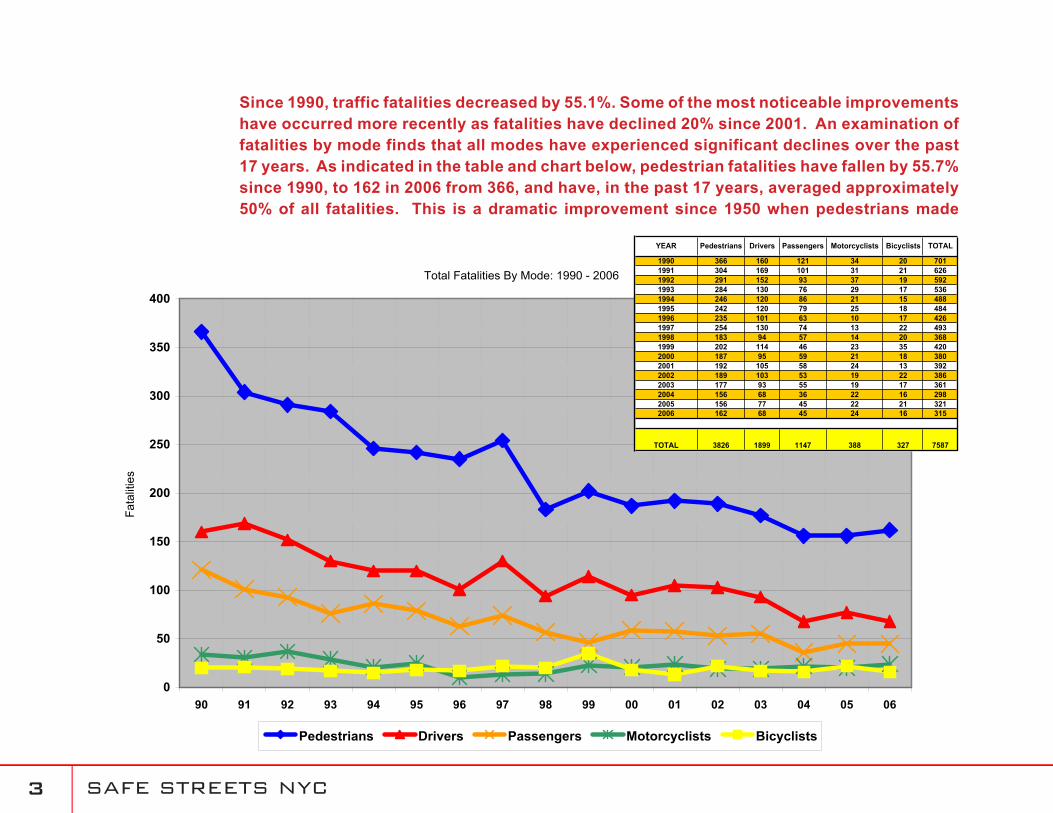
Since 1990, traffic fatalities decreased by 55.1%. Some of the most noticeable improvements have occurred more recently as fatalities have declined 20% since 2001. An examination of fatalities by mode finds that all modes have experienced significant declines over the past 17 years. As indicated in the table and chart below, pedestrian fatalities have fallen by 55.7% since 1990, to 162 in 2006 from 366, and have, in the past 17 years, averaged approximately 50% of all fatalities. This is a dramatic improvement since 1950 when pedestrians made
Total Fatalities By Mode: 1990 - 2006
0
50
100
150
200
250
300
350
400
90 91 92 93 94 95 96 97 98 99 00 01 02 03 04 05 06
Fata
litie
s
Pedestrians Drivers Passengers Motorcyclists Bicyclists
YEAR Pedestrians Drivers Passengers Motorcyclists Bicyclists TOTAL
1990 366 160 121 34 20 7011991 304 169 101 31 21 6261992 291 152 93 37 19 5921993 284 130 76 29 17 5361994 246 120 86 21 15 4881995 242 120 79 25 18 4841996 235 101 63 10 17 4261997 254 130 74 13 22 4931998 183 94 57 14 20 3681999 202 114 46 23 35 4202000 187 95 59 21 18 3802001 192 105 58 24 13 3922002 189 103 53 19 22 3862003 177 93 55 19 17 3612004 156 68 36 22 16 2982005 156 77 45 22 21 3212006 162 68 45 24 16 315
TOTAL 3826 1899 1147 388 327 7587
SAFE STREETS NYC �
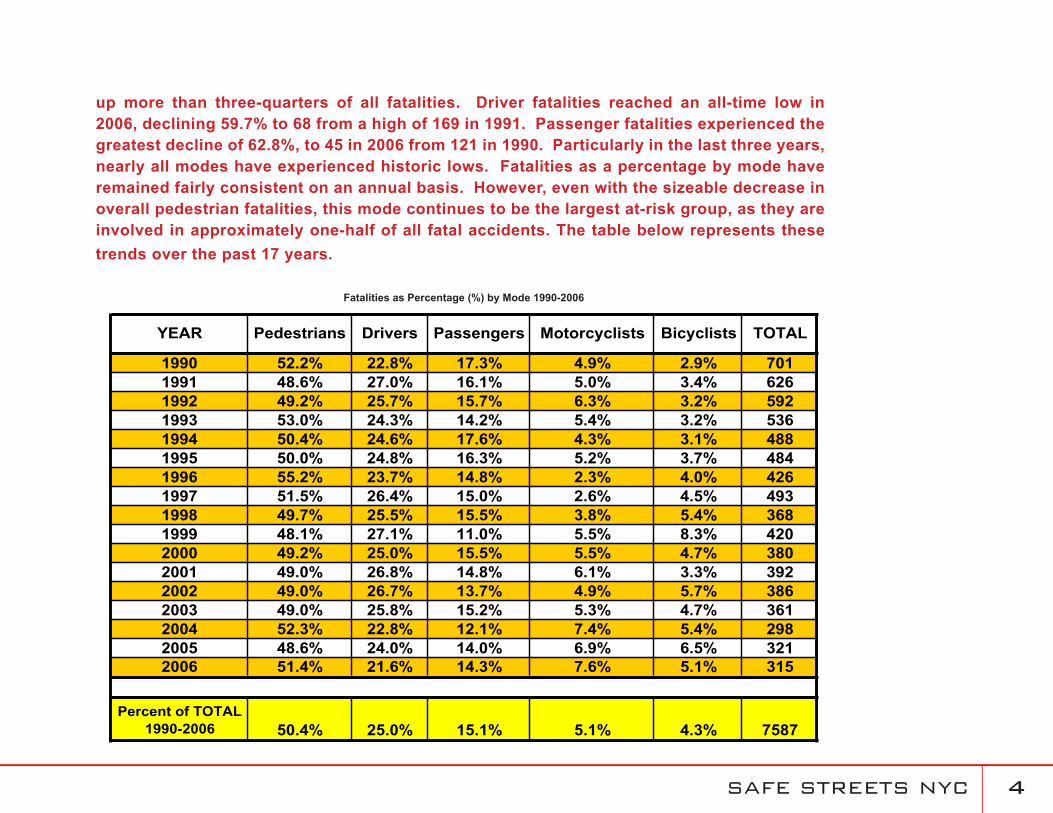
up more than three-quarters of all fatalities. Driver fatalities reached an all-time low in 2006, declining 59.7% to 68 from a high of 169 in 1991. Passenger fatalities experienced the greatest decline of 62.8%, to 45 in 2006 from 121 in 1990. Particularly in the last three years, nearly all modes have experienced historic lows. Fatalities as a percentage by mode have remained fairly consistent on an annual basis. However, even with the sizeable decrease in overall pedestrian fatalities, this mode continues to be the largest at-risk group, as they are involved in approximately one-half of all fatal accidents. The table below represents these trends over the past 17 years.
YEAR Motorcyclists TOTALPedestrians BicyclistsDrivers Passengers
1990 52.2% 22.8% 17.3% 4.9% 2.9% 7011991 48.6% 27.0% 16.1% 5.0% 3.4% 6261992 49.2% 25.7% 15.7% 6.3% 3.2% 5921993 53.0% 24.3% 14.2% 5.4% 3.2% 5361994 50.4% 24.6% 17.6% 4.3% 3.1% 4881995 50.0% 24.8% 16.3% 5.2% 3.7% 4841996 55.2% 23.7% 14.8% 2.3% 4.0% 4261997 51.5% 26.4% 15.0% 2.6% 4.5% 4931998 49.7% 25.5% 15.5% 3.8% 5.4% 3681999 48.1% 27.1% 11.0% 5.5% 8.3% 4202000 49.2% 25.0% 15.5% 5.5% 4.7% 3802001 49.0% 26.8% 14.8% 6.1% 3.3% 3922002 49.0% 26.7% 13.7% 4.9% 5.7% 3862003 49.0% 25.8% 15.2% 5.3% 4.7% 3612004 52.3% 22.8% 12.1% 7.4% 5.4% 2982005 48.6% 24.0% 14.0% 6.9% 6.5% 3212006 51.4% 21.6% 14.3% 7.6% 5.1% 315
Percent of TOTAL 1990-2006 50.4% 25.0% 15.1% 5.1% 4.3% 7587
Fatalities as Percentage (%) by Mode 1990-2006

SAFE STREETS NYC �
NYC compared to the U.S.A.Of all the cities in the nation with populations exceding 250,000, New York City has the lowest traffic fatality rate per 100,000 persons. A 2004 report by the U.S. Department of Transportation found that the City’s rate of 3.7 traffic fatalities per 100,000 persons was the lowest of all major cities. Cities such as Los Angeles, Washington D.C. and Detroit had rates of 6.8, 7.8, and 13.7, respectively. Based on 2000 population data, the rate of traffic fatalities in New York City decreased by half from 1991 to 2005, while across the nation as a whole, the rate of total traffic fatalities increased during this same time period by 4.8%.
USA vs. NYC Traffic Related Fatalities Rates: 1991 - 2005
14.713.9 14.3 14.5
14.9 14.9 14.9 14.7 14.8 14.9 15.0 15.3 15.2 15.2 15.4
7.4
6.1 6.0
5.3
6.2
4.6
5.24.7 4.9 4.8
4.5
3.74.0
7.8
6.7
0
2
4
6
8
10
12
14
16
1991 1992 1993 1994 1995 1996 1997 1998 1999 2000 2001 2002 2003 2004 2005
Traf
fic F
atal
ities
per
100
,000
Per
sons
USA Traffic Fatality Rate NYC Traffic Fatality Rate
SAFE STREETS NYC �
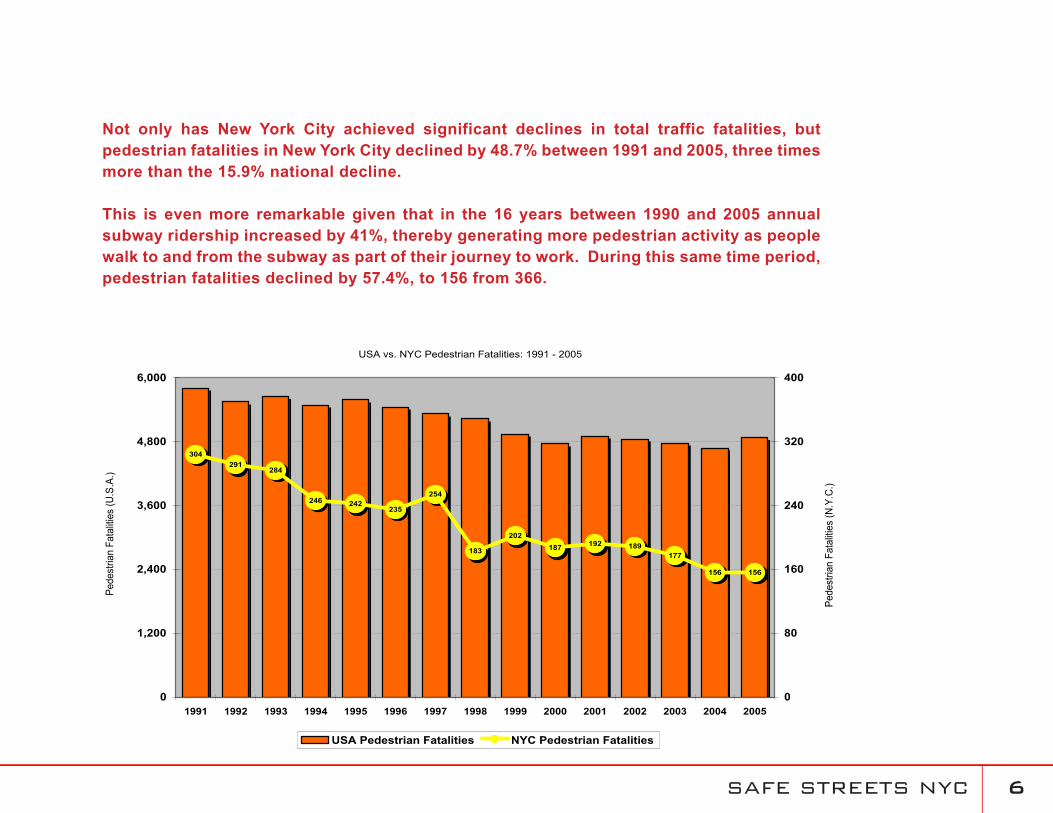
Not only has New York City achieved significant declines in total traffic fatalities, but pedestrian fatalities in New York City declined by 48.7% between 1991 and 2005, three times more than the 15.9% national decline.
This is even more remarkable given that in the 16 years between 1990 and 2005 annual subway ridership increased by 41%, thereby generating more pedestrian activity as people walk to and from the subway as part of their journey to work. During this same time period, pedestrian fatalities declined by 57.4%, to 156 from 366.
USA vs. NYC Pedestrian Fatalities: 1991 - 2005
291284
246 242235
254
183
202187 192 189
177
156 156
304
0
1,200
2,400
3,600
4,800
6,000
1991 1992 1993 1994 1995 1996 1997 1998 1999 2000 2001 2002 2003 2004 2005
Pede
stria
n Fa
taliti
es (U
.S.A
.)
0
80
160
240
320
400
Pede
stria
n Fa
taliti
es (N
.Y.C
.)
USA Pedestrian Fatalities NYC Pedestrian Fatalities
SAFE STREETS NYC 7
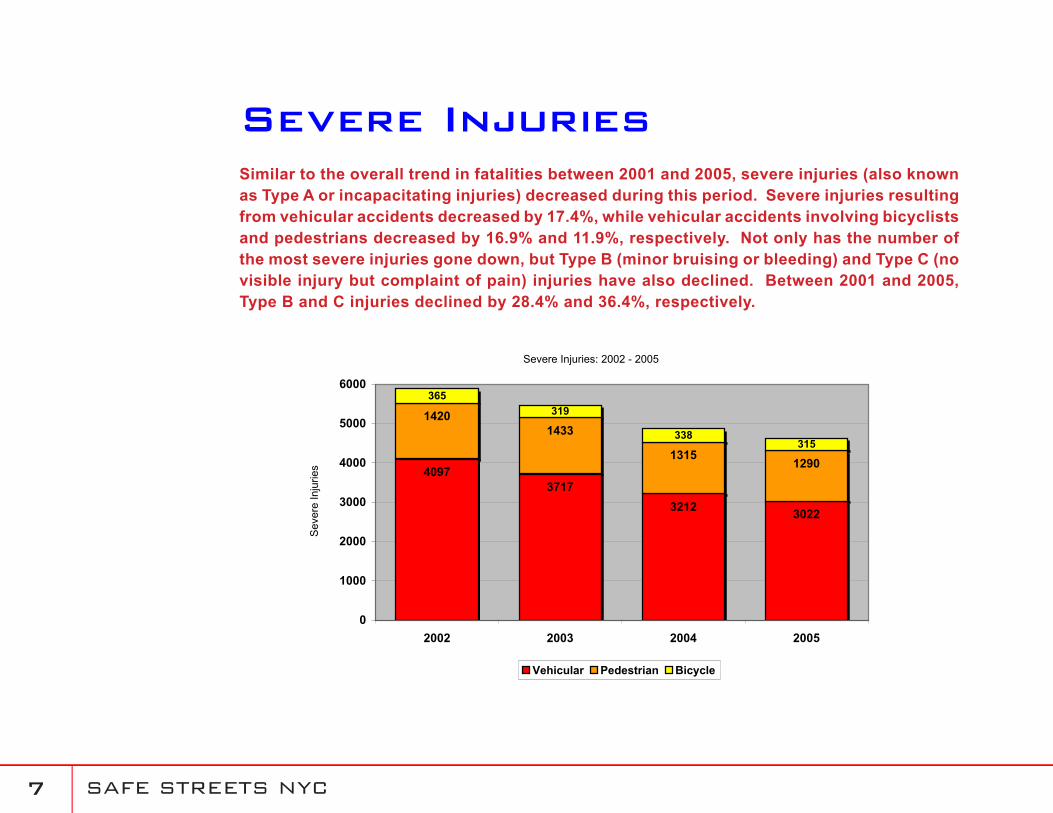
Severe InjuriesSimilar to the overall trend in fatalities between 2001 and 2005, severe injuries (also known as Type A or incapacitating injuries) decreased during this period. Severe injuries resulting from vehicular accidents decreased by 17.4%, while vehicular accidents involving bicyclists and pedestrians decreased by 16.9% and 11.9%, respectively. Not only has the number of the most severe injuries gone down, but Type B (minor bruising or bleeding) and Type C (no visible injury but complaint of pain) injuries have also declined. Between 2001 and 2005, Type B and C injuries declined by 28.4% and 36.4%, respectively.
Severe Injuries: 2002 - 2005
40973717
3212 3022
14201433
13151290
365319
338315
0
1000
2000
3000
4000
5000
6000
2002 2003 2004 2005
Sev
ere
Inju
ries
Vehicular Pedestrian Bicycle
SAFE STREETS NYC �
Total Accidents: 1990 - 2001
0
50,000
100,000
150,000
200,000
250,000
300,000
350,000
1990 1991 1992 1993 1994 1995 1996 1997 1998 1999 2000 2001
Tot
al A
ccid
ents
Total Accidents
Reportable Accidents:2002 - 2005
0
20,000
40,000
60,000
80,000
100,000
120,000
2002 2003 2004 2005
Rep
orta
ble
Acc
iden
ts
Reportable Accidents
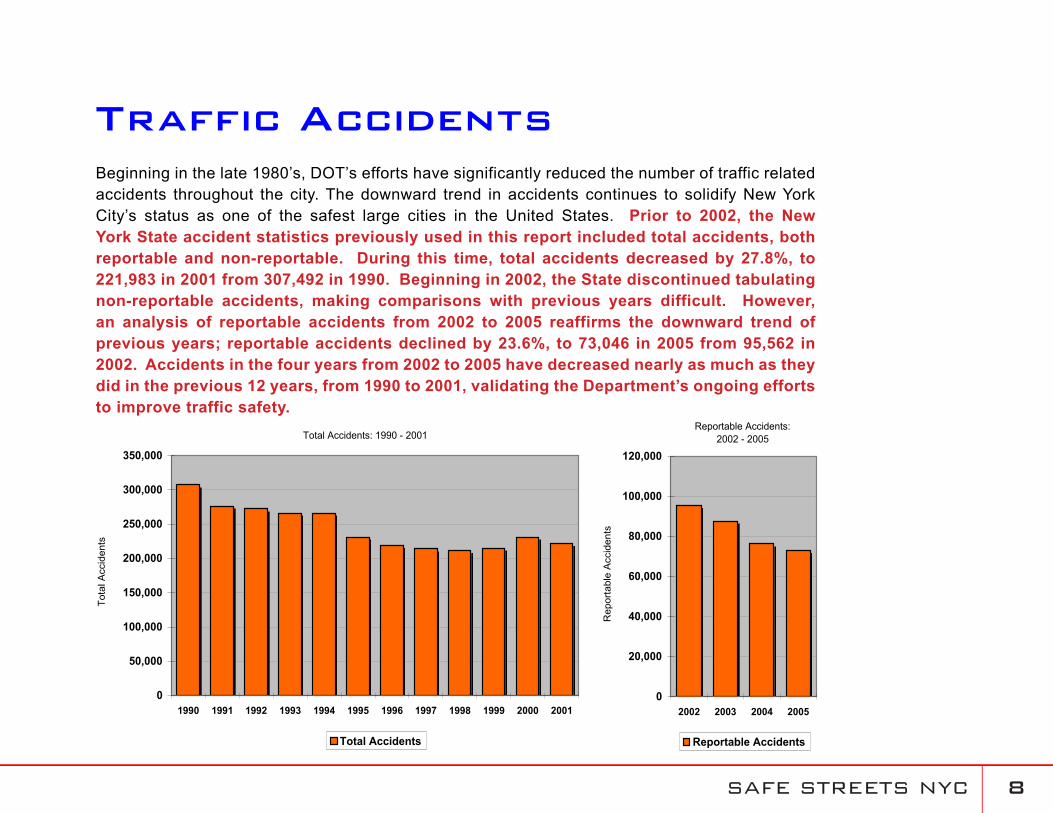
Traffic AccidentsBeginning in the late 1980’s, DOT’s efforts have significantly reduced the number of traffic related accidents throughout the city. The downward trend in accidents continues to solidify New York City’s status as one of the safest large cities in the United States. Prior to 2002, the New York State accident statistics previously used in this report included total accidents, both reportable and non-reportable. During this time, total accidents decreased by 27.8%, to 221,983 in 2001 from 307,492 in 1990. Beginning in 2002, the State discontinued tabulating non-reportable accidents, making comparisons with previous years difficult. However, an analysis of reportable accidents from 2002 to 2005 reaffirms the downward trend of previous years; reportable accidents declined by 23.6%, to 73,046 in 2005 from 95,562 in 2002. Accidents in the four years from 2002 to 2005 have decreased nearly as much as they did in the previous 12 years, from 1990 to 2001, validating the Department’s ongoing efforts to improve traffic safety.
SAFE STREETS NYC �
High Accident LocationsThroughout New York City, there are several corridors and/or intersections which consistently experience a high number of accident occurrences. While each of these locations is unique in its characteristics and layout, these locations are generally more accident prone due to one of four factors: 1) Physical environment (e.g., grade, road alignment, visibility, roadway conditions, lighting, wet pavement); 2) Traffic Conditions (e.g., high volumes, heavy truck activity); 3) Human factors (e.g., driving under the influence, misjudgment, speeding, aggressive or inexperienced driving, illness, unlicensed driver); 4) Equipment (e.g., faulty vehicles, over or under loaded larger vehicles.). Crashes usually involve several of these factors.
In past years, the city has ranked the top accident locations based upon data from the New York State Department of Transportation (NYSDOT). The Department uses the NYSDOT Accident Database to locate high accident locations as this database is the most complete and accurate source of accident information. NYSDOT has recently made reportable accident data from 2002 to 2005 available.
Identifying Locations for Improvement
Many of the high accident locations throughout the city have benefited from the implementation of engineering improvements. More recently, the Department’s focus has been directed toward addressing corridors and intersections where available data and trends indicate that accidents are occurring more frequently. These locations may be identified through the Department’s own review of accident data, as well as suggestions from elected officials, the Police Department and the community. This year, the Department will be initiating a comprehensive study of traffic fatality and severe injury accident locations to further identify intersections that may benefit from additional safety improvements.
SAFE STREETS NYC 10
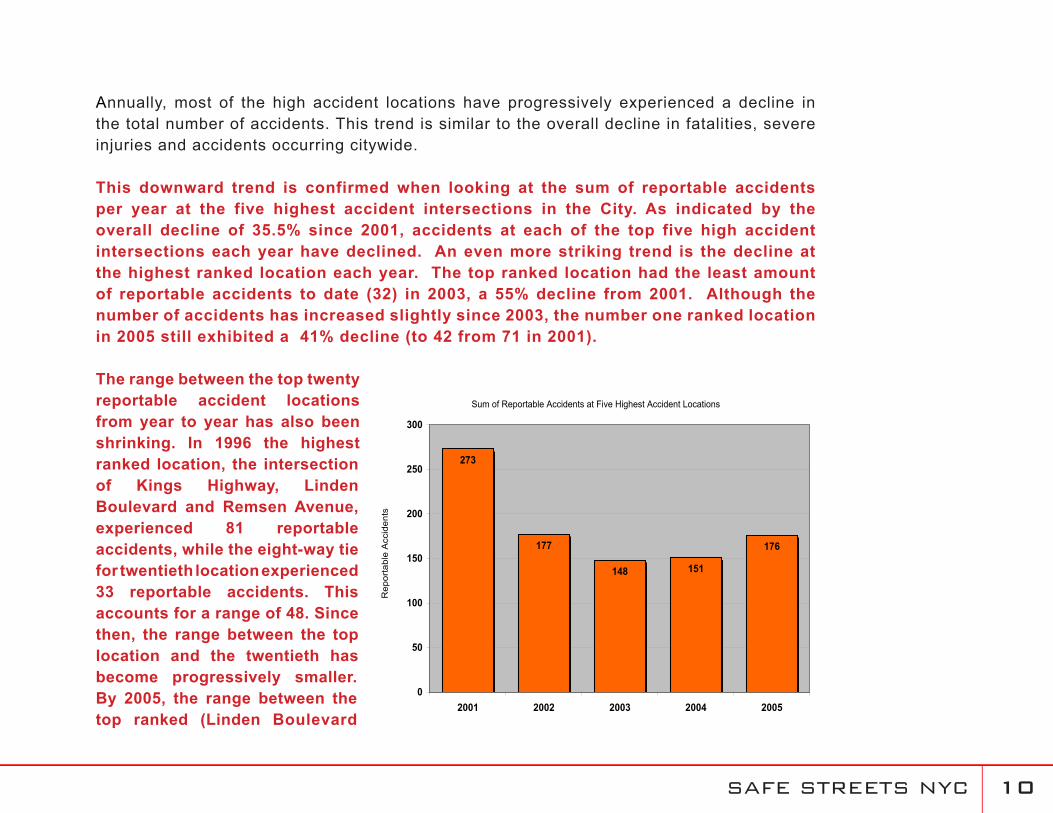
Annually, most of the high accident locations have progressively experienced a decline in the total number of accidents. This trend is similar to the overall decline in fatalities, severe injuries and accidents occurring citywide. This downward trend is confirmed when looking at the sum of reportable accidents per year at the five highest accident intersections in the City. As indicated by the overall decline of 35.5% since 2001, accidents at each of the top five high accident intersections each year have declined. An even more striking trend is the decline at the highest ranked location each year. The top ranked location had the least amount of reportable accidents to date (32) in 2003, a 55% decline from 2001. Although the number of accidents has increased slightly since 2003, the number one ranked location in 2005 still exhibited a 41% decline (to 42 from 71 in 2001).
The range between the top twenty reportable accident locations from year to year has also been shrinking. In 1996 the highest ranked location, the intersection of Kings Highway, Linden Boulevard and Remsen Avenue, experienced 81 reportable accidents, while the eight-way tie for twentieth location experienced 33 reportable accidents. This accounts for a range of 48. Since then, the range between the top location and the twentieth has become progressively smaller. By 2005, the range between the top ranked (Linden Boulevard
Sum of Reportable Accidents at Five Highest Accident Locations
148 151
176
273
177
0
50
100
150
200
250
300
2001 2002 2003 2004 2005
Rep
orta
ble
Acc
iden
ts

SAFE STREETS NYC 11
and Pennsylvania Avenue with 42 reportable accidents) and the seven-way tie for sixteenth ranked location (which only reported 25 accidents) shrank to only 17. Given the smaller range, and the significantly lower accident numbers, even if a location is highly ranked in 2005, the annual accident experience at these locations is frequently lower than those in any preceding year. Cumulatively, these account for a significant reduction in total accidents at these locations.
While there are numerous locations throughout the city that are indicative of these trends, there are some notable locations that have experienced a dramatic decline in their accident experience that can be directly related to the implementation of safety improvements and the declining overall trends.
One such location is Kings Highway at the Linden Boulevard and Remsen Avenue intersection. This is a multi-legged, complex intersection that experienced a high number of accidents before improvements were implemented in 2000 and 2001. From 1998 to 2001, this intersection experienced an average of 71 reportable accidents per year. Data from the first four years after improvements were implemented, 2002 through 2005, show that the average number of accidents per year declined substantially to 23, a 67.6% decline.
Some of the improvements that were implemented at this intersection involved signal timing changes, installation of oversized street name signs, new curbside regulations and modifications to bus stops.
Kings Hwy / Linden Blvd / Remsen Av
81
7268
74 73 71
21
30
1923
0
10
20
30
40
50
60
70
80
90
1996 1997 1998 1999 2000 2001 2002 2003 2004 2005
Rep
orta
ble
Acc
iden
ts

SAFE STREETS NYC 12
Another location that has shown considerable improvement in safety over the past few years is the Grand Concourse corridor. Beginning with improvements implemented in 1992, the Grand Concourse represented the first corridor-wide safety initiative the Department undertook to improve both pedestrian and vehicular safety along an entire corridor. This approach and several of the treatments that were implemented served as a model for other corridors in the city, most notably Queens Boulevard.
Beginning in 1993 and coinciding with improvements made on the Concourse, annual fatalities (both vehicular and pedestrian) began to drop significantly. In 1993, total fatalities decreased 60% (to six from 15 in 1992) and pedestrian fatalities decreased 50% (to five from 10 in 1992). This downward trend in fatalities has continued each year. In 2003, there was only one pedestrian fatality on the corridor. Although fatalities increased slightly to three in 2004, they declined back to one in 2005 and 2006. A comparison of total fatalities for the corridor between the ten years prior to 1993, as compared to the years since (13), indicates that fatalities have declined by 70% (36 Fatalities/29 Pedestrians between 1993-2005 vs. 120 fatalities/101 pedestrians between 1983 and 1992).
Some of the initial treatments that were implemented on the Concourse included the installation of nearly 3,800 linear feet of pedestrian fencing at high pedestrian volume locations to discourage midblock crossings, the modification of traffic signal timing (to a 120 from a 90 second cycle length) to provide increased time for pedestrians to cross the Concourse, the installation of pedestrian signals at 25 intersections, the installation of red light cameras and the simplification of advance and exit directional signage for motorists travelling between the service and main roadways.
Accident Experience on Grand Concourse from East 165th St - East 170th St
77 79
90
61 60
43
31
43
26 17
18
13 16
12
8
81
2
5
2
0
20
40
60
80
100
120
1998 1999 2000 2001 2002 2003 2004 2005
Rep
orta
ble
Acc
iden
ts
Vehicular Pedestrian Bicycle
SAFE STREETS NYC 1�
Over the next decade, the Department continually monitored and implemented improvements to enhance these earlier efforts. These treatments included numerous improvements to signage, markings and signals along the entire Concourse. Initiatives such as oversized street name signs, improved lane assignment treatments for turning movements, and additional signal improvements provided for a safer pedestrian and vehicular environment.
In 1998, the Department focused its efforts on improving pedestrian safety at specific locations along the Grand Concourse. This included a targeted Pedestrian Safety Demonstration Project between East 165th and 170th Streets and at two high accident locations, East 170th Street and East 183rd Street.
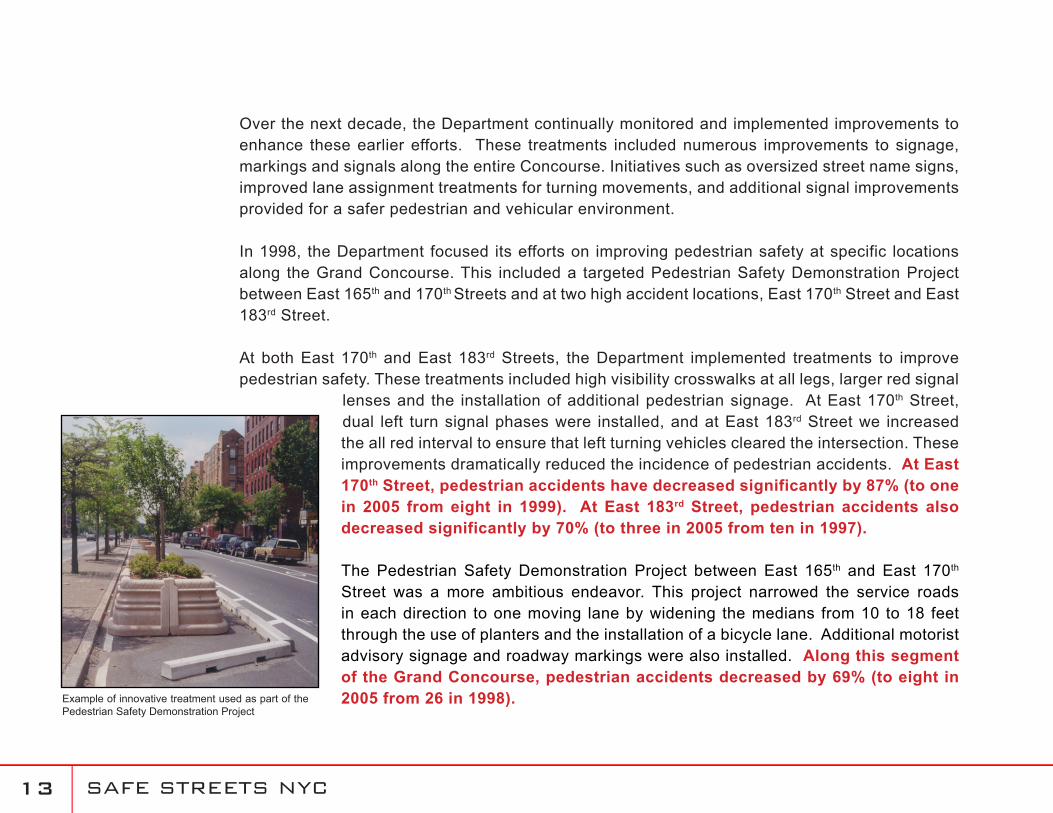
At both East 170th and East 183rd Streets, the Department implemented treatments to improve pedestrian safety. These treatments included high visibility crosswalks at all legs, larger red signal
lenses and the installation of additional pedestrian signage. At East 170th Street, dual left turn signal phases were installed, and at East 183rd Street we increased the all red interval to ensure that left turning vehicles cleared the intersection. These improvements dramatically reduced the incidence of pedestrian accidents. At East 170th Street, pedestrian accidents have decreased significantly by 87% (to one in 2005 from eight in 1999). At East 183rd Street, pedestrian accidents also decreased significantly by 70% (to three in 2005 from ten in 1997).
The Pedestrian Safety Demonstration Project between East 165th and East 170th Street was a more ambitious endeavor. This project narrowed the service roads in each direction to one moving lane by widening the medians from 10 to 18 feet through the use of planters and the installation of a bicycle lane. Additional motorist advisory signage and roadway markings were also installed. Along this segment of the Grand Concourse, pedestrian accidents decreased by 69% (to eight in 2005 from 26 in 1998). Example of innovative treatment used as part of the
Pedestrian Safety Demonstration Project

SAFE STREETS NYC 1�
locations Discussed In This ReportAt each location selected for study, an extensive historical accident review is conducted to ascertain whether any particular type of accident was being repeated or if any other patterns existed. In addition, an on-site investigation is conducted involving various disciplines within the Department. Based upon the investigation, the Department develops sets of mitigation measures to address the noted issues and conditions at each respective location. These may include immediate measures that can be implemented in the near term such as the replacement of missing, defaced or outdated signage or the installation of new or improved signage, street lighting upgrades that require minimal repair work or bulb replacement, improved signal timing, phasing or displays, and the refurbishment or addition of roadway markings. At certain locations, recommendations may involve longer term efforts that usually involve roadway reconfiguration or capital work. However, at many of these locations, the Department tries to utilize shorter-term, temporary measures until the projects can be completed through capital work.
This report describes, in detail, the work undertaken at specific locations or corridors. In many cases, improvements have been implemented over the course of several years, and the Department continues to monitor and improve these locations accordingly.

SAFE STREETS NYC 1�
The Bronx
SAFE STREETS NYC 1�
GRANDCONCOURSE
Background
The Department has performed considerable work in the last two decades to improve vehicular and pedestrian safety on the Grand Concourse. In 1992, the Department initiated a safety study on a four-mile stretch of the Grand Concourse between East 161st Street and the Mosholu Parkway. This location was selected as the site for a Pedestrian Safety Engineering Demonstration Project because, at that time, it was identified as the signalized arterial with the most pedestrian fatalities citywide. This study included comprehensive traffic analyses and the implementation of the following safety improvements throughout the study area.
Modification of traffic signal timing to increase time for pedestrians to cross the Grand Concourse, installation of pedestrian signals at 25 intersections, installation of dual left turn phasing at the East 167th Street and Mt. Eden Avenue intersections, installation of a red light camera at East 167th Street, installation of larger red signal displays, and an increase of the cycle lengths from 90 to 120 seconds to further improve pedestrian crossing during the midday period, at night, and on weekends.
Installation of 3,750 linear feet (nearly ¾-mile) of pedestrian barriers in high pedestrian volume locations to prevent midblock crossings.
Simplification of service road entrance and exit directional signs.
Installation of thermoplastic pavement markings including the refurbishment of lane lines and all crosswalks, and new directional arrows, stop bars, peg-a-tracs to guide motorists making left turns, and the installation of edge lines adjacent to raised medians.
•
•
•
•
SAFE STREETS NYC 17
These improvements (implemented in 1993) resulted in impressive accident reductions. A comparison of statistics for the three years before (1990-1992) and the three years after (1994-1996) the implementation of these measures showed a significant reduction in overall accidents (-27%) and a dramatic decrease in fatalities (-67%).
Additional Improvements
Additional improvements were implemented to enhance these earlier efforts. These are described below:
Existing regulatory signs (e.g., Yield, One-Way Arrows, Stop, and turn restrictions) were refurbished and upgraded in September 1999 to meet current standards. In addition, 75 school crossing signs were refurbished as part of the citywide contract in March 2000.
All crosswalks and Stop bar pavement markings were surveyed and refurbished in August 1999.
All school crosswalk and School Crossing pavement messages were installed in October 2000 as part of the citywide contract.
140 feet of damaged pedestrian barriers were repaired in August 1999.
Dual left turn signal phases were installed at the East 165th and East 170th Street intersections in September 1999.
Additional pedestrian signals were installed on the center median at the East 183rd Street intersection in March 2000. These were upgraded to international pedestrian signals in October 2000.
A study was conducted to determine the need for a left turn phase at the East Tremont Avenue intersection. Left-turn phases for both directions of the Concourse were approved and were installed in April 2001.
A left turn signal phase for the southbound Grand Concourse at East 188th Street was installed
•
•
•
•
•
•
•
•

SAFE STREETS NYC 1�
in June 2000.
Removed “Trucks with Overweight Permit” and “Truck Restriction Ahead” signs at seven locations along the Grand Concourse (southbound at East 196th Street, southbound at East 183rd Street, northbound at Mt. Eden Avenue, southbound at Morris Avenue, southbound at East 161st Street, southbound at East Kingsbridge Road, and northbound at East 170th Street).
All crosswalks and Stop bar pavement markings were surveyed and refurbished in May 2002.
All vehicle and pedestrian signals on the Grand Concourse between East 138th Street and East Tremont Avenue were upgraded to LED and international displays in March 2003.
Left turn signals were installed in both directions of the Grand Concourse at both East Tremont and East Burnside Avenues in September 2003.
Older “Yield to Pedestrian” signage was upgraded to the newer “Attention, Drivers Yield to Pedestrian” signs in July 2004.
“Left Turn on Left Green Arrow” or “Left Turn Signal” signage was installed at intersections with left turn signals in July 2004.
All signage designating individual lanes for various traffic movements were installed at the following intersections in July 2004:
•
•
•
•
•
•
•
East 170th Street
East Tremont Avenue
East 161st Street
East 183rd Street
East Kingsbridge Road
Bedford Park Boulevard
East 196th Street
East Mt. Eden Avenue
•
•
•
•
•
•
•
•
East Burnside Avenue
East 165th Street
East 192nd Street
East 181st Street
East 184th Street
East 198th Street
East 204th Street
Van Cortlandt Avenue East
•
•
•
•
•
•
•
•

SAFE STREETS NYC 1�
Pedestrian Separator Improvements
As part of the continuing efforts to improve pedestrian and vehicular safety, the Department repaired and replaced several pedestrian separators along the Grand Concourse in January 2003. In total, 275 linear feet of new fencing was replaced. The locations of these improvements included:
East median north of East 183rd Street
West median north of East 183rd Street
West median in front of 1675, 2017, 2403, 2295 and 2039 Grand Concourse
West median south of East 177th Street
East median south of Echo Street
East median north of Mt. Eden Avenue in front of Bronx Lebanon Hospital
In October 2005, 370 linear feet of pedestrian separators were repaired on the Grand Concourse southbound between Clifford Place and Mount Eden Avenue.
In the summer of 2006, the Department installed approximately 2,750 linear feet of pedestrian separators along the entire stretch of the Grand Concourse in the southbound direction and installed approximately 2,010 feet in the northbound direction. In 2005 and 2006, a grand total of 4,760 linear feet of pedestrian fencing was installed along this corridor.
•
•
•
•
•
•

SAFE STREETS NYC 20
Description
A targeted pedestrian safety demonstration project was implemented in November 1999 for the 0.7-mile stretch of the Grand Concourse between East 165th and East 170th Streets. The plan narrowed the service roads in each direction to one moving lane by widening the medians from 10 to 18 feet and adding a bicycle lane. The width of the service roads was reduced from 35-37 feet to a continuous 27 feet. Our intention was to further improve vehicular and pedestrian safety by reducing traffic speeds and pedestrian crossing distances, while increasing pedestrian refuge space. The plan, implemented as a pilot, included the following elements:
Roadway Markings: Bicycle lane installation, median widening with striping, lane transitions prior to and at the end of the study area. In addition, existing striping on the service roads were scarified. The markings work was completed in mid-November 1999. The markings were refurbished in April 2002.
•
GRANDCONCOURSEPedestrian SafetyDemonstration Project
Panoramic View of Grand Concourse prior to implementation of Pedestrian Safety Demonstration Project
SAFE STREETS NYC 21
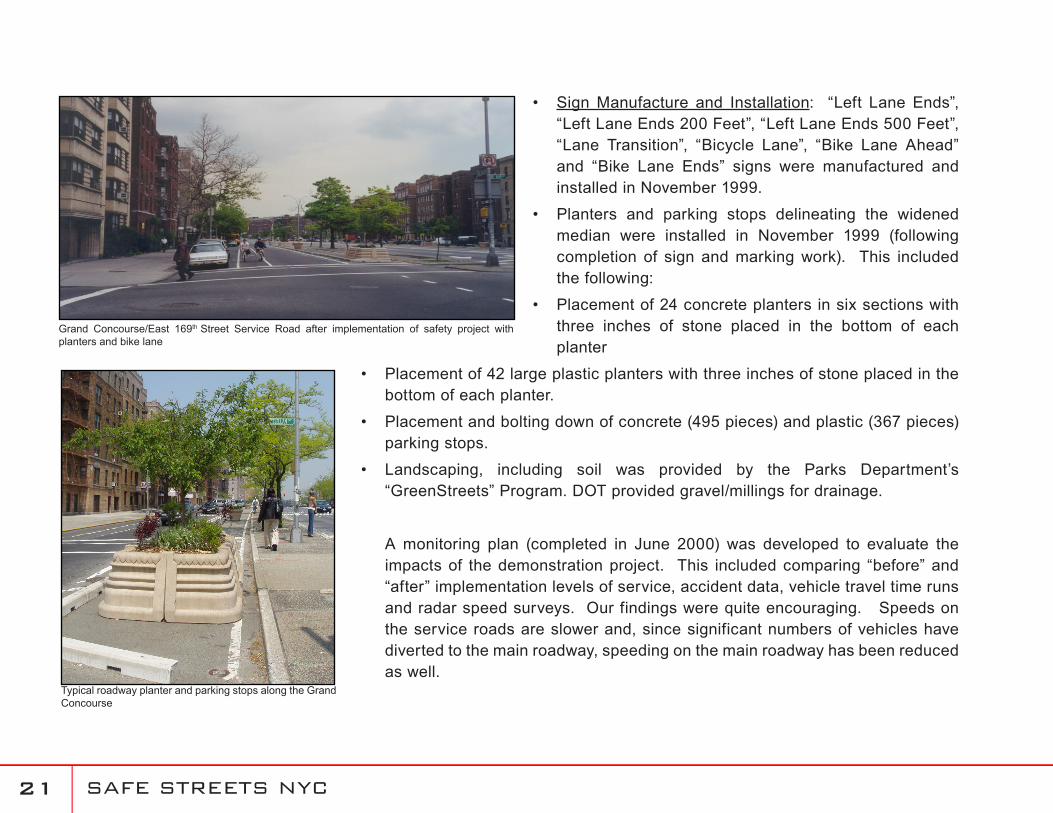
Grand Concourse/East 169th Street Service Road after implementation of safety project with planters and bike lane
Typical roadway planter and parking stops along the Grand Concourse
Sign Manufacture and Installation: “Left Lane Ends”, “Left Lane Ends 200 Feet”, “Left Lane Ends 500 Feet”, “Lane Transition”, “Bicycle Lane”, “Bike Lane Ahead” and “Bike Lane Ends” signs were manufactured and installed in November 1999.
Planters and parking stops delineating the widened median were installed in November 1999 (following completion of sign and marking work). This included the following:
Placement of 24 concrete planters in six sections with three inches of stone placed in the bottom of each planter
Placement of 42 large plastic planters with three inches of stone placed in the bottom of each planter.
Placement and bolting down of concrete (495 pieces) and plastic (367 pieces) parking stops.
Landscaping, including soil was provided by the Parks Department’s “GreenStreets” Program. DOT provided gravel/millings for drainage.
A monitoring plan (completed in June 2000) was developed to evaluate the impacts of the demonstration project. This included comparing “before” and “after” implementation levels of service, accident data, vehicle travel time runs and radar speed surveys. Our findings were quite encouraging. Speeds on the service roads are slower and, since significant numbers of vehicles have diverted to the main roadway, speeding on the main roadway has been reduced as well.
•
•
•
•
•
•

SAFE STREETS NYC 22
Key findings:Accidents
Overall, the accident experience along this section of the Grand Concourse has shown a significant improvement in pedestrian and vehicular safety since 1998. In 1998, there were a total of 105 reportable accidents, of which 26 involved pedestrians. In 1999, the year in which the pedestrian safety demonstration project was implemented (November), reportable accidents declined to 101, of which only 17 involved pedestrians. For comparison purposes we are using the full year (1998) for “before” data because the project was not implemented until late 1999. In 2000, although reportable accidents increased to 110, pedestrian accidents decreased by 31% (to 18 from 26 in 1998). In 2001, reportable accidents fell 30% (to 74 from 105 in 1998) and pedestrian accidents fell significantly by 50% (to 13 from 26 in 1998). In both 2003 and 2004, pedestrian accidents declined significantly when compared to the previous year (to 12 in 2003 from 16 in 2002, a 25% decline, and to eight in 2004 from 12 in 2003, a 33% decline). In 2004, reportable accidents decreased by 62% (to 40 from 105 in 1998), while pedestrian accidents decreased by 69% in both 2004 and 2005 (to eight from 26 in 1998). In 1998, there was one fatality and in June 1999 there were two fatalities, both of which were the result of a single accident. Since 1999, there have been no fatalities along this portion of the Grand Concourse.
Overall, the Department believes the impacts of the treatments implemented at this location have been successful, especially in reducing the number of pedestrian accidents along this stretch of the Grand Concourse. The Department continues to support these treatments and is actively engaged in trying to make these safety improvements permanent.
Accident Experience on Grand Concourse from East 165th St - East 170th St
77 79
90
61 60
43
31
43
26 17
18
13 16
12
8
8
25
2
1
0
20
40
60
80
100
120
1998 1999 2000 2001 2002 2003 2004 2005
Rep
orta
ble
Acc
iden
ts
Vehicular Pedestrian Bicycle
SAFE STREETS NYC 2�
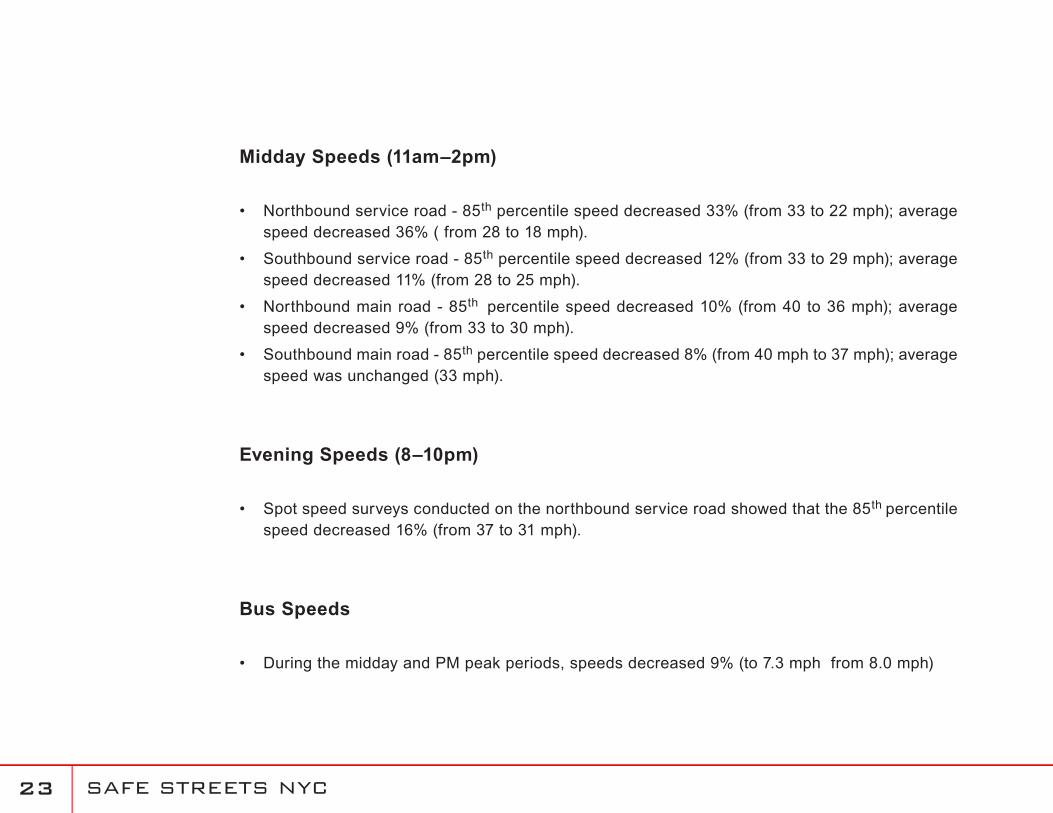
Midday Speeds (11am–2pm)
Northbound service road - 85th percentile speed decreased 33% (from 33 to 22 mph); average speed decreased 36% ( from 28 to 18 mph).
Southbound service road - 85th percentile speed decreased 12% (from 33 to 29 mph); average speed decreased 11% (from 28 to 25 mph).
Northbound main road - 85th percentile speed decreased 10% (from 40 to 36 mph); average speed decreased 9% (from 33 to 30 mph).
Southbound main road - 85th percentile speed decreased 8% (from 40 mph to 37 mph); average speed was unchanged (33 mph).
Evening Speeds (8–10pm)
Spot speed surveys conducted on the northbound service road showed that the 85th percentile speed decreased 16% (from 37 to 31 mph).
Bus Speeds
During the midday and PM peak periods, speeds decreased 9% (to 7.3 mph from 8.0 mph)
•
•
•
•
•
•
SAFE STREETS NYC 2�
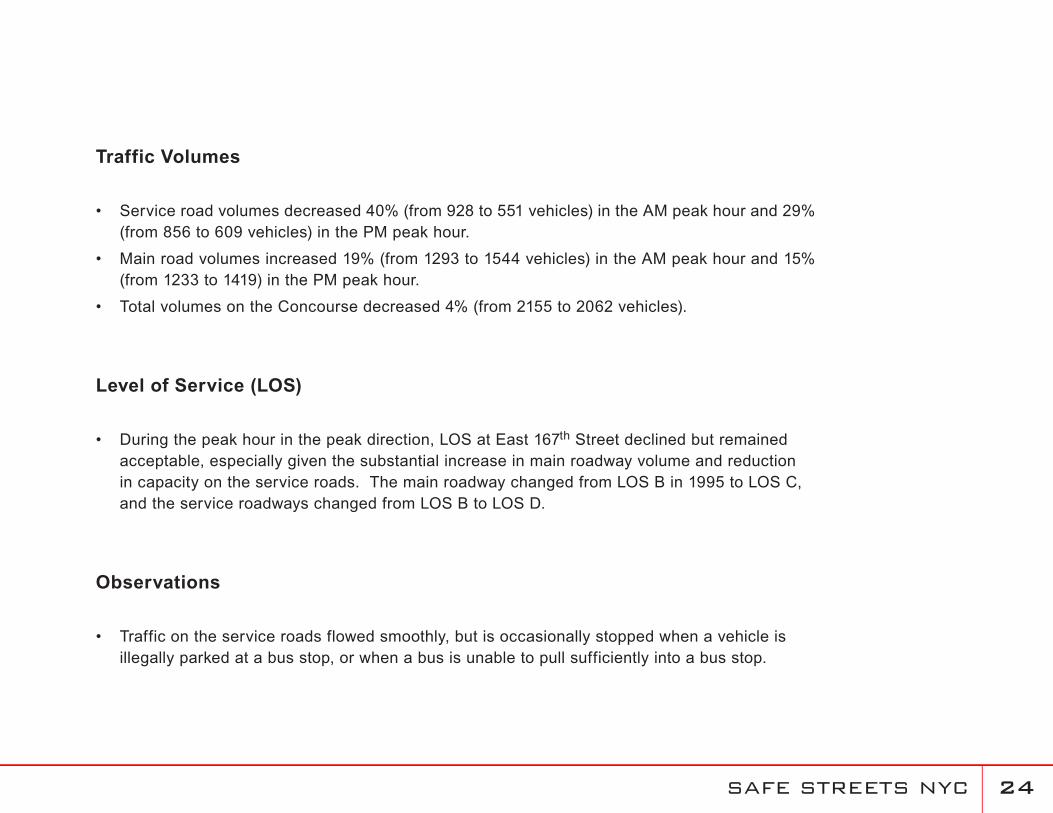
Traffic Volumes
Service road volumes decreased 40% (from 928 to 551 vehicles) in the AM peak hour and 29% (from 856 to 609 vehicles) in the PM peak hour.
Main road volumes increased 19% (from 1293 to 1544 vehicles) in the AM peak hour and 15% (from 1233 to 1419) in the PM peak hour.
Total volumes on the Concourse decreased 4% (from 2155 to 2062 vehicles).
Level of Service (LOS)
During the peak hour in the peak direction, LOS at East 167th Street declined but remained acceptable, especially given the substantial increase in main roadway volume and reduction in capacity on the service roads. The main roadway changed from LOS B in 1995 to LOS C, and the service roadways changed from LOS B to LOS D.
Observations
Traffic on the service roads flowed smoothly, but is occasionally stopped when a vehicle is illegally parked at a bus stop, or when a bus is unable to pull sufficiently into a bus stop.
•
•
•
•
•

SAFE STREETS NYC 2�
Recommendations
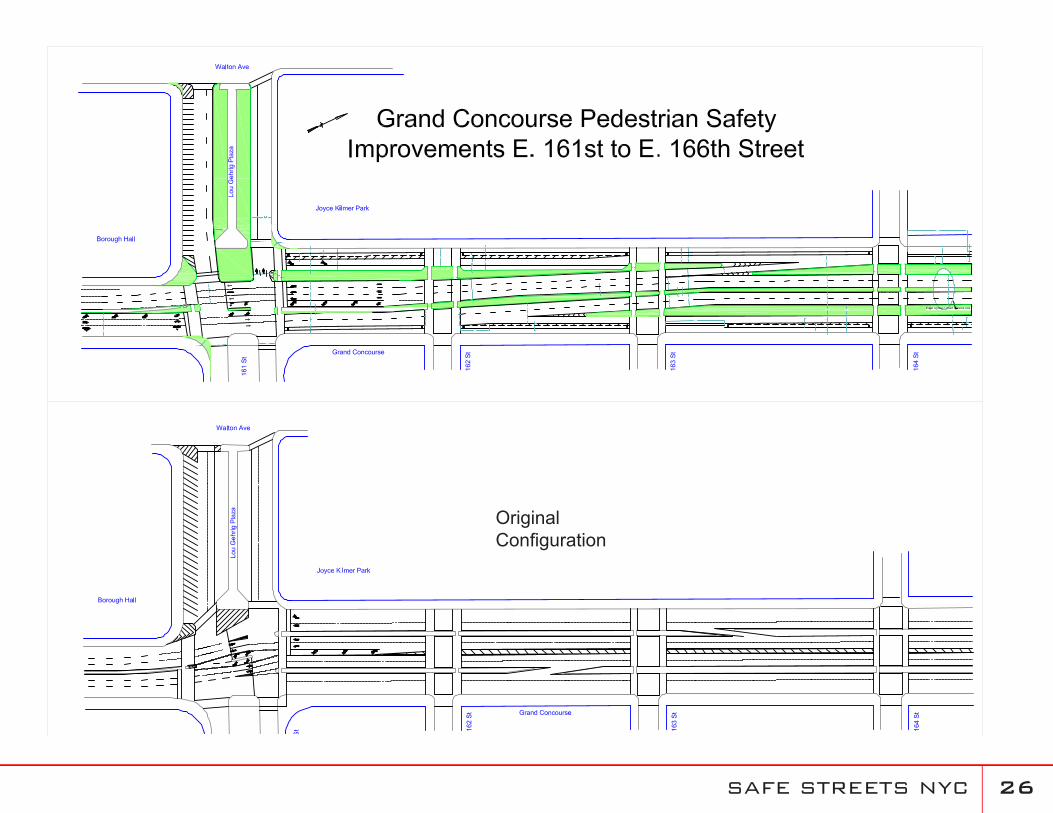
The one-lane service road design can be extended throughout the Grand Concourse from East 163rd Street to Mosholu Parkway with the exception of the East Fordham Road area which warrants further study. The width of the service road should be 28 feet (12 feet wide moving lane, five feet wide bicycle lane with a three feet wide channelized buffer separating the bike lane from motor vehicle traffic, and an eight feet wide parking lane). This is one foot wider than the test configuration to enable traffic to pass buses and other vehicles temporarily double parked.
The section of the Concourse between East 161st Street and the Bronx Museum of the Arts (north of East 165th Street) will be reconstructed as part of the East 161st Street Bridge reconstruction project, which began in late March 2006. During these reconstruction projects, NYCDOT will replace the East 161st Street Underpass Arch Structure, incorporate landscaped urban design features for Lou Gehrig Plaza and add more open space to the neighborhood. Additionally as part of the bridge reconstruction project, the Grand Concourse/East 161st Street intersection, where the service and main roads merge in the center of the intersection resulting in multiple conflict points between vehicles and pedestrians and between vehicles with other vehicles, will be reconfigured. The plan shifts the northbound merge between the service and main roads to a midblock non-pedestrian location, and lengthens the merge for a smoother transition. The southbound merge between the service and main roads will be removed by forcing traffic on the service road to turn right onto westbound East 161st Street.
The roadway realignment is shown on the following page.
•
•
SAFE STREETS NYC 2�
Original Configuration

SAFE STREETS NYC 27
Description
The intersection of East 170th Street and the Grand Concourse is signalized and very wide (142 feet). On the Grand Concourse main roadway approach, there are two moving lanes and a left-turn lane in each direction and two moving lanes and one parking lane in each direction on the northbound and southbound service roads. There are raised medians between the main and service roads that provide refuge for pedestrians. The east side of East 170th Street has one moving lane in each direction separated by angle parking in the center. The west side of East 170th Street has one lane in each direction separated by a tunnel. The BX1 and BX2 buses run along the Grand Concourse and the BX11 and BX18 run along East 170th Street. The C and D subway entrances are on the southwest and southeast corners of the intersection.
In terms of the accident experience, in 1997 this location ranked second amongst the top 20 pedestrian accident locations with a total of 14 accidents involving pedestrians. Most of these accidents were the result of pedestrians crossing against the signal or negligent driving on the part of the vehicle operator. In 1998, pedestrian accidents decreased 50% (to seven from 14). In 1999 and 2000 there were eight pedestrian accidents. In 2001, 2003 and 2004, pedestrian accidents decreased significantly to three which is 79% less than 1997. Pedestrian accidents declined to two in 2002 and in 2005, pedestrian accidents had declined to just one.
Grand Concourse / East 170th StreetHigh Pedestrian Accident Location Improvements
Accident Experience at Grand Concourse and East 170th St
14
78
7
32
3 3
10
2
4
6
8
10
12
14
16
1997 1998 1999 2000 2001 2002 2003 2004 2005
Pede
stria
n Ac
cide
nts

SAFE STREETS NYC 2�
Grand Concourse / East 170th StreetHigh Pedestrian Accident Location Improvements
Concerns
Northbound articulated buses destined to far side bus stop spill back across intersection
Pedestrians cross against signals
Vehicle operators make U-turns on the main roadway
Pedestrians cross mid-block on the Grand Concourse
Steep upgrade causes visibility problems on eastbound East 170th Street approaching the Grand Concourse
Implemented Improvements
Installed 12” Red Lenses on all signals
Installed Peg-a-Tracs to guide traffic across wide intersection
Replaced all missing signs (September 1999)
Upgraded Yield to Pedestrian signs
Installed additional No U-turn signs
Upgraded all crosswalks to high visibility
Installed pedestrian crossing signals on all medians and upgraded them to international pedestrian signals in October 2000
Installed dual left turn signal phases (October 1999)
Installed signs stating “Left Turn on Green Arrow Only” in coordination with the installation of the left-turn signal
Installed “Wait For Walk Signal” signs on all signal posts
•
•
•
•
•
•
•
•
•
•
•
•
•
•
•
SAFE STREETS NYC 2�
Grand Concourse / East 1��rd StreetHigh Pedestrian Accident Location Improvements
Description
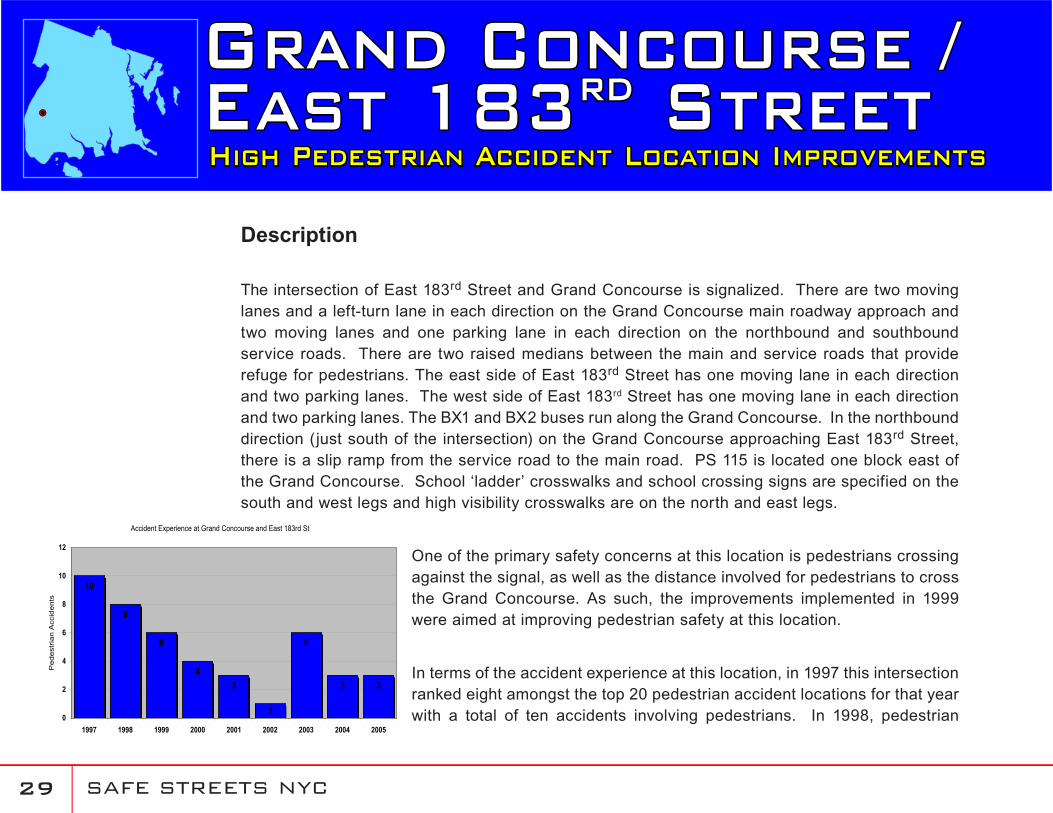
The intersection of East 183rd Street and Grand Concourse is signalized. There are two moving lanes and a left-turn lane in each direction on the Grand Concourse main roadway approach and two moving lanes and one parking lane in each direction on the northbound and southbound service roads. There are two raised medians between the main and service roads that provide refuge for pedestrians. The east side of East 183rd Street has one moving lane in each direction and two parking lanes. The west side of East 183rd Street has one moving lane in each direction and two parking lanes. The BX1 and BX2 buses run along the Grand Concourse. In the northbound direction (just south of the intersection) on the Grand Concourse approaching East 183rd Street, there is a slip ramp from the service road to the main road. PS 115 is located one block east of the Grand Concourse. School ‘ladder’ crosswalks and school crossing signs are specified on the south and west legs and high visibility crosswalks are on the north and east legs.
One of the primary safety concerns at this location is pedestrians crossing against the signal, as well as the distance involved for pedestrians to cross the Grand Concourse. As such, the improvements implemented in 1999 were aimed at improving pedestrian safety at this location.
In terms of the accident experience at this location, in 1997 this intersection ranked eight amongst the top 20 pedestrian accident locations for that year with a total of ten accidents involving pedestrians. In 1998, pedestrian
Accident Experience at Grand Concourse and East 183rd St
10
8
6
43
6
3 3
10
2
4
6
8
10
12
1997 1998 1999 2000 2001 2002 2003 2004 2005
Ped
estr
ian
Acc
iden
ts
SAFE STREETS NYC �0
Grand Concourse / East 1��rd StreetHigh Pedestrian Accident Location Improvements
accidents decreased 20% (to eight from 10 accidents). In 1999, pedestrian accidents decreased to six from eight accidents, which is 40% less than 1997. In 2000, the first full year after the treatments were installed, pedestrian accidents decreased to four, which is 60% less than 1997. In 2001, pedestrian accidents declined to three, which is 70% less than 1997. In 2002, pedestrian accidents declined even further to one. Before improvements were implemented, accidents averaged nine per year. From 2000 to 2005, after implementation, the average decreased to 3.3 accidents per year. There was one pedestrian fatality in both 2001 and 2005.
The overall decline in accidents since 1997 represents a major accomplishment for the Department at this location. The decline can be attributed to the Department’s ongoing efforts along the Grand Concourse corridor and the targeted pedestrian improvements made at locations along the corridor.
Improvements Implemented in 1999
12” red lenses on signal faces
High visibility crosswalks installed at all four legs of the intersection
Pedestrian barriers installed at medians to prevent mid-block crossings
Modified the signal timing to allow for increased time for pedestrian crossing
Replaced all missing signs
Installed “Wait for Walk Signal” signs
Installed pedestrian crossing signals on all medians and upgraded them to international pedestrian signals in October 2000
Repaired three streetlights
Increased the all-red interval to ensure that left-turning vehicles clear the intersection
•
•
•
•
•
•
•
•
•

SAFE STREETS NYC �1
South BronxChurches
Description
South Bronx Churches (SBC) is a 15-year old organization whose membership includes area congregations and resident/tenant organizations. In the past few years, the housing stock, population and environment of the South Bronx has changed dramatically. SBC has constructed 146 new Nehemiah homes just south of St. Mary’s Park in the past three years and traffic congestion has increased in the area.
Implemented Improvements
In October 2001, SBC submitted their recommendations to improve pedestrian and vehicular safety in the area bounded by East 138th and East 163rd Streets between Bruckner Boulevard and Willis Avenue. All recommendations were reviewed and the following improvements were implemented:
Installed truck loading zones on St. Ann’s Avenue between East 138th and East 139th Streets in January 2002.
Installed an All-Way Stop control at the East 139th Street/Cypress Avenue intersection in February 2002.
Installed “No Parking Anytime” signs on the east curb of Cypress Avenue between East 138th and East 139th Streets in January 2002.
Installed “Do Not Enter” signs at Brook Avenue near the Major Deegan Expressway
•
•
•
•
SAFE STREETS NYC �2
South BronxChurches southbound exit ramp in January 2002.
Installed a bus stop on the west curb of Bruckner Boulevard near the East 138th Street intersection in December 2001.
Added five seconds (from 35 to 40 seconds) to cross Bruckner Boulevard at East 138th Street in February 2002.
Installed “Keep Intersection Clear” signs at the Jackson Avenue/East 138th Street intersection in February 2002.
Installed “Dead End” signs on Beech Terrace at St. Mary’s Park South in December 2001.
Removed one parking space on the northwest corner of Westchester Avenue in January 2002.
Installed additional “Yield to Pedestrian”, curve warning and reduced speed signs on St. Mary’s Park South in February 2002.
Installed two speed reducers on Tinton Avenue between East 150th and East 152nd Streets and one on Union Avenue between East 150th and East 151st Streets in February 2002.
Daylighting was installed at the intersection of East 137th Street and Cypress Avenue in April 2002.
A painted median was installed on Tinton Avenue between East 156th and East 152nd Streets to narrow the roadway width in September 2002.
Two speed reducers were installed on Jackson Avenue between East 147th and East 149th
Streets in June 2002, and one reducer was installed on East 140th Street between Cypress and St. Ann’s Avenues in January 2003.
Additional markings were installed or refurbished at the following locations:
Bruckner Boulevard/ East 138th Street - peg-a-tracs were installed in July 2002 to guide motorists across Bruckner Boulevard.
Tinton Avenue between East 152nd and East 156th Streets - a center median and a mid-block school crosswalk (along with necessary school crossing signs and word messages)
•
•
•
•
•
•
•
•
•
•
•
•
•
SAFE STREETS NYC ��
were installed in October 2002.
East 152nd Street between Jackson and Union Avenues - a lane line was installed in August 2002 to better define the moving lanes.
Jackson Avenue/Westchester Avenue/East 152nd Street - high visibility crosswalks, school crosswalk, and school crossing messages refurbished in October 2002.
Westchester Avenue/Tinton Avenue/East 156th Street - pedestrian and school crosswalks refurbished and Stop lines installed in October 2002.
Tinton Avenue/East 152nd Street - school crosswalks, school crossing messages, Stop lines refurbished in October 2002.
Cypress Avenue/East 138th Street - pedestrian and school crosswalks, school crossing messages refurbished in August 2002.
Cypress Avenue/East 139th Street - school crosswalks, school crosswalk messages, Stop line, Stop messages refurbished in August 2002.
Cypress Avenue/East 139th Street – Installed All-way stop with ‘Stop Ahead’ and ‘Stop’ message in Winter 2003.
Cypress Avenue/East 137th Street – Completed daylighting of intersection in Winter 2003.
Jackson Avenue/East 138th Street – Repositioned two ‘Keep Intersection Clear’ signs in January 2003.
A two-way modified Class 3 bicycle route (signs and bike symbol pavement markings) was installed on St. Ann’s Avenue between East 135th and East 149th Streets (.8 miles in each direction) in April 2003. A Class 2 bicycle lane (signs and bike symbol and long line pavement markings) was installed on St. Ann’s Avenue between East 149th and East 161st Streets (.8 miles in each direction) in April 2003.
•
•
•
•
•
•
•
•
•
•
SAFE STREETS NYC ��
Street lighting improvements were completed in May 2003 at:
Franklin Avenue between East 167th and East 168th Streets
Upgraded four existing luminaries in this area to the newer, more efficient 250 watt High Pressure Sodium (HPS) fixtures. Added light pole with new 250 watt HPS directly in front of St. Augustine Church.
Morris Avenue between 163rd and 164th Streets
Installed two new 250 HPS lighting fixtures to improve visibility.
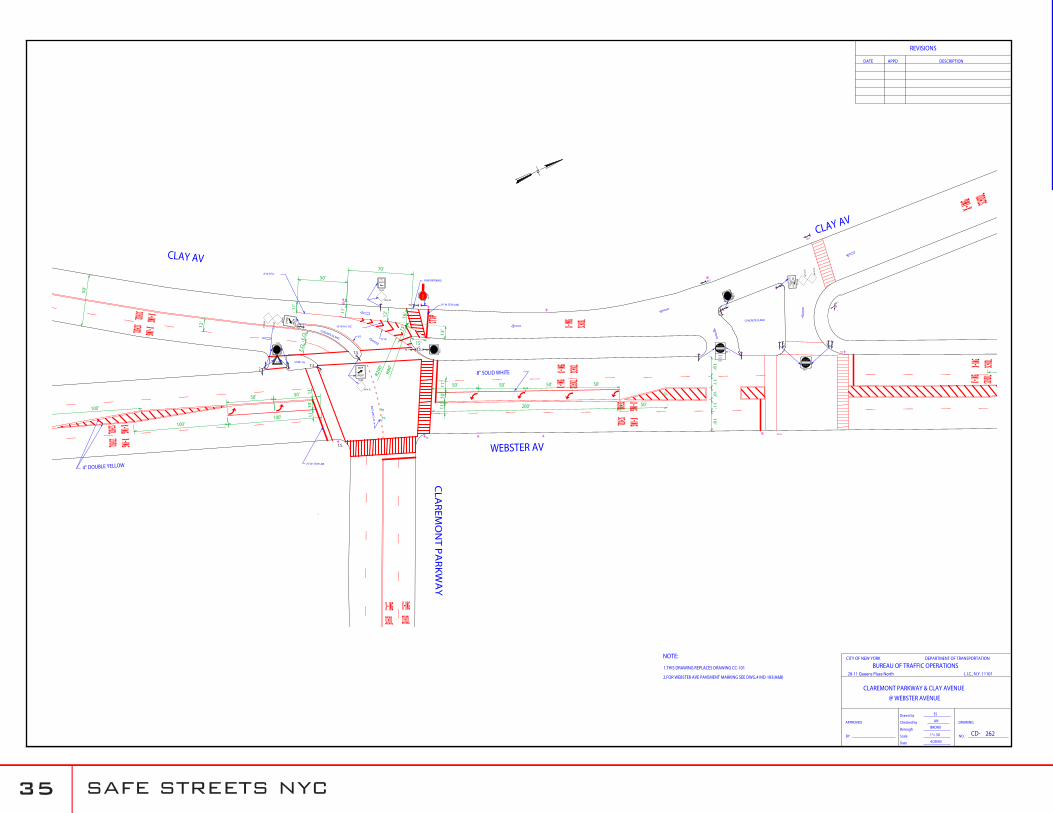
Additional markings and signs were installed in the vicinity of Our Lady of Victory Church (the intersection of Claremont Parkway @ Webster Avenue) in May 2003. Implemented improvements include:
Installed school crosswalk on the north leg of the intersection
Installed stop word messages on the north service road
Installed three school crossing messages on the north leg, two on the south leg, two on the main road, and one on the service road
Added stop lines at all approaches
Installed peg-a-tracs to guide turning vehicles through the intersection
Added new yield markings
At the intersection of Webster and Clay Avenues, installed stop lines on the north, south and west legs
Installed new advance school crossing signs on the north and south legs
The improvements are shown on the following page.
•
•
•
•
•
•
•
•
•
•
•
•
SAFE STREETS NYC ��
L.I.C., N.Y. 11101
DEPARTMENT OF TRANSPORTATION
BY
Date
Scale NO.
28-11 Queens Plaza North
BUREAU OF TRAFFIC OPERATIONS
Borough
Checked by
Drawn by
APPROVED
CITY OF NEW YORK
DRAWING
REVISIONS
DATE APPD DESCRIPTION
BRONX
AN
ES
1"= 30'
4/28/03
CD-
CLAREMONT PARKWAY & CLAY AVENUE
NOTE:
1.THIS DRAWING REPLACES DRAWING CC-101
@ WEBSTER AVENUE
262
2.FOR WEBSTER AVE PAVEMENT MARKING SEE DWG.# MD-183(A&B)
CLAY AV
WEBSTER AV
CLA
RE
MO
NT
PA
RK
WA
Y
N
50' 50'
4" DOUBLE YELLOW
100'
100'
19
'1
1'
10
'1
1'
19
'
50' 50' 50' 50'
200' 50'
16"
8" SOLID WHITE
50
'
100'
TRAFFICALL
R3-9L
R3
-2
T
T
CONCRETE ISLAND
CONCRETE ISLAND
T
R6-1R6-1
T
TR
1-1
ST
OP
T
T TRIDER
T.S.
R6-1
T
CONC. ISL.
TR6-1
R6-1
TT.S.
T
R3-2
T.S.
T.S.
T R6-1
TTR6-1
R3-
2
T
T T
R6
-1 TR6-1 T
ENTER
DO NOT
R5-1
T.S.
T.S.
R6-1
L
T.S.T
TT.S.
L
L
L
L
L
L
L
L
R4
-8R
RIGHT
KEEP
R1-2
YIELD
RIGHT
KEEP
R4-8R
DO NOT
ENTER
EXCEPT
BUSES
R5-1
WE
BS
TE
R
SI-
44
B
CLA
RE
MO
NT
AV
E.
PK
WY
24" W. STOP LINE
CLAY AV
R200
'
W14-2C
W14-2C
W1
4-2
C
W1
4-2
C
W1
4-2
C
W1
4-2
C
LL
70'
PARK ENTRANCE
11
'
50'8".W C/S/L
R80
'
13
'15'
12
'11
'
16
'
15'
2'
4'
4"
D.Y
.SK
IPLI
NE
12
'
11
'1
0'
11
'
11
'1
0'
11
'
E.Q
.E.
Q.
8" W
16" W @ 6' O/C
E/L
24" W. STOP LINE
SAFE STREETS NYC ��
Description
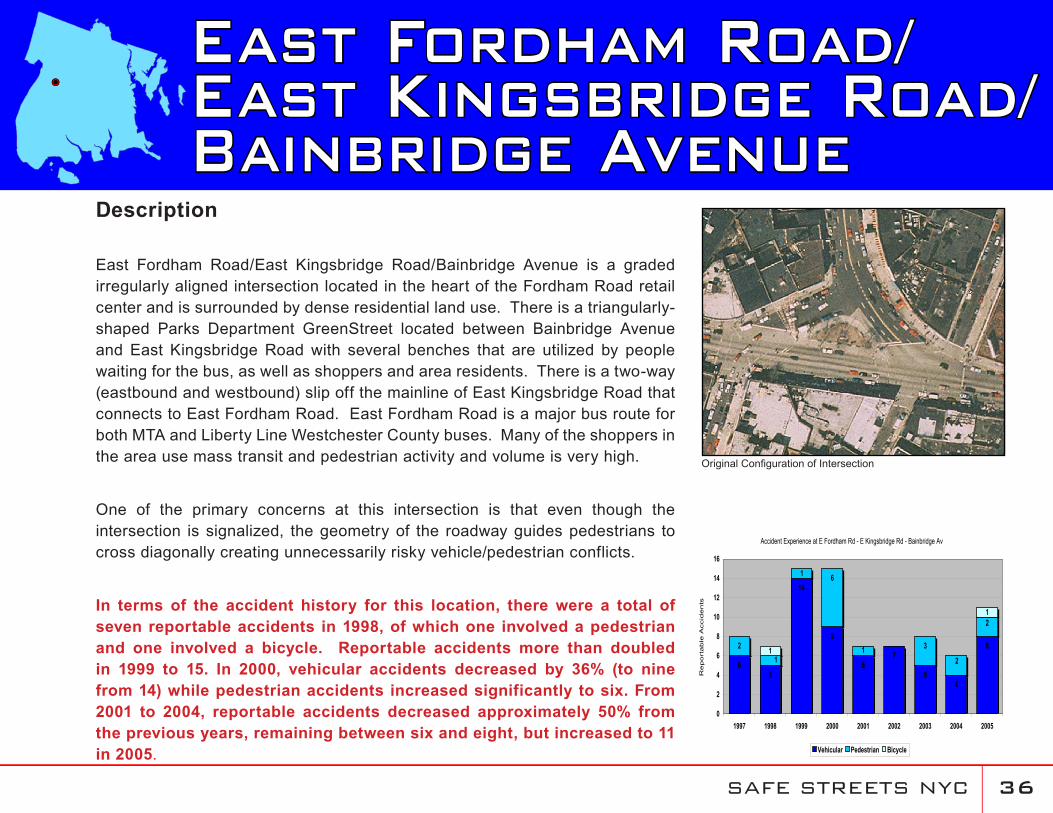
East Fordham Road/East Kingsbridge Road/Bainbridge Avenue is a graded irregularly aligned intersection located in the heart of the Fordham Road retail center and is surrounded by dense residential land use. There is a triangularly-shaped Parks Department GreenStreet located between Bainbridge Avenue and East Kingsbridge Road with several benches that are utilized by people waiting for the bus, as well as shoppers and area residents. There is a two-way (eastbound and westbound) slip off the mainline of East Kingsbridge Road that connects to East Fordham Road. East Fordham Road is a major bus route for both MTA and Liberty Line Westchester County buses. Many of the shoppers in the area use mass transit and pedestrian activity and volume is very high.
One of the primary concerns at this intersection is that even though the intersection is signalized, the geometry of the roadway guides pedestrians to cross diagonally creating unnecessarily risky vehicle/pedestrian conflicts.
In terms of the accident history for this location, there were a total of seven reportable accidents in 1998, of which one involved a pedestrian and one involved a bicycle. Reportable accidents more than doubled in 1999 to 15. In 2000, vehicular accidents decreased by 36% (to nine from 14) while pedestrian accidents increased significantly to six. From 2001 to 2004, reportable accidents decreased approximately 50% from the previous years, remaining between six and eight, but increased to 11 in 2005.
East Fordham Road/East Kingsbridge Road/Bainbridge Avenue
Accident Experience at E Fordham Rd - E Kingsbridge Rd - Bainbridge Av
65
14
9
67
54
83
1
21
6
12
2
1
1
0
2
4
6
8
10
12
14
16
1997 1998 1999 2000 2001 2002 2003 2004 2005
Re
po
rta
ble
Accid
en
ts
Vehicular Pedestrian Bicycle
Original Configuration of Intersection

SAFE STREETS NYC �7
Improvements Implemented in September 2002
Converted the East Kingsbridge Road slip roadway to one-way westbound from East Kingsbridge Road to East Fordham Road mainline to reduce conflicts and improve safety.
Widened the triangular park to the west and north with pavement markings and flexible delineators to narrow the street, discourage double parking, increase pedestrian sidewalk space, and decrease crossing distance.
Installed a modified neckdown on the northwest corner of the East Kingsbridge Road slip/East Fordham Road intersection to increase pedestrian
•
•
•
Detailed view of several of the improvements including one-way conversion of slip ramp, modified neckdown and flexible delineators surrounding the park
Flexible delineators and markings for increased pedestrian and vehicular safety
SAFE STREETS NYC ��
sidewalk space and decrease crossing distance.
Widened the East Fordham Road north sidewalk (and installed delineators) approaching Bainbridge Avenue/East Kingsbridge Road and widened the east sidewalk of East Kingsbridge Road west of Bainbridge Avenue to reduce pedestrian crossing distance and provide more sidewalk space.
Installed Stop bars, lane assignment arrows, and double yellow and lane lines as appropriate.
Modified signal faces as appropriate.
The improvements are shown on the following page and were done in coordination with the installation of priority rush hour bus lanes (in both directions) on Fordham Road between University Avenue and Southern Boulevard.
•
•
•

SAFE STREETS NYC ��
INSTALL EDGE AND PEG-A-
GENERAL NOTES:
* INSTALL REFLECTIVE EDGE MARKINGS ON SIDESOF ZEBRA PAVERS TO IMPROVE VISIBILITY OF CROSSWALKS AT NIGHT TO APPROACHING MOTORISTS.* INSTALL STOP BARS ON ALL APPROACHES.* EXISTING ZEBRA PAVERS SHOWN TO REMAIN.
E. KINGSBRIDGE RD
BAINBRIDGE AVE
EAST FORDHAM ROAD
TIEBOUT AVE.
ELM PL.
MARION AVE.
BUILDING LINE
INSTALL SURFACE MOUNTED DELINEATORS
30'
24'
65'
BUILDING LINE
BUILDING LINE
BUILDING LINE
BUILDING LINE
BUILDING LINE
10'
10'
10'10'11'
20' 15'
BUS STOP
10'
10'
10'
10'10' 10'
6'
2'
INSTALL SURFACE MOUNTED
BAINBRIDGE AVE
EAST FORDHAM RD.
TIEBOUT AVE.
ELM PL.
BUILDING LINE
E. KINGSBRIDGE RD
OriginalConfiguration
Reconfigured Intersection
East Fordham Road @ East Kingsbridge RoadSafety Improvements

SAFE STREETS NYC �0
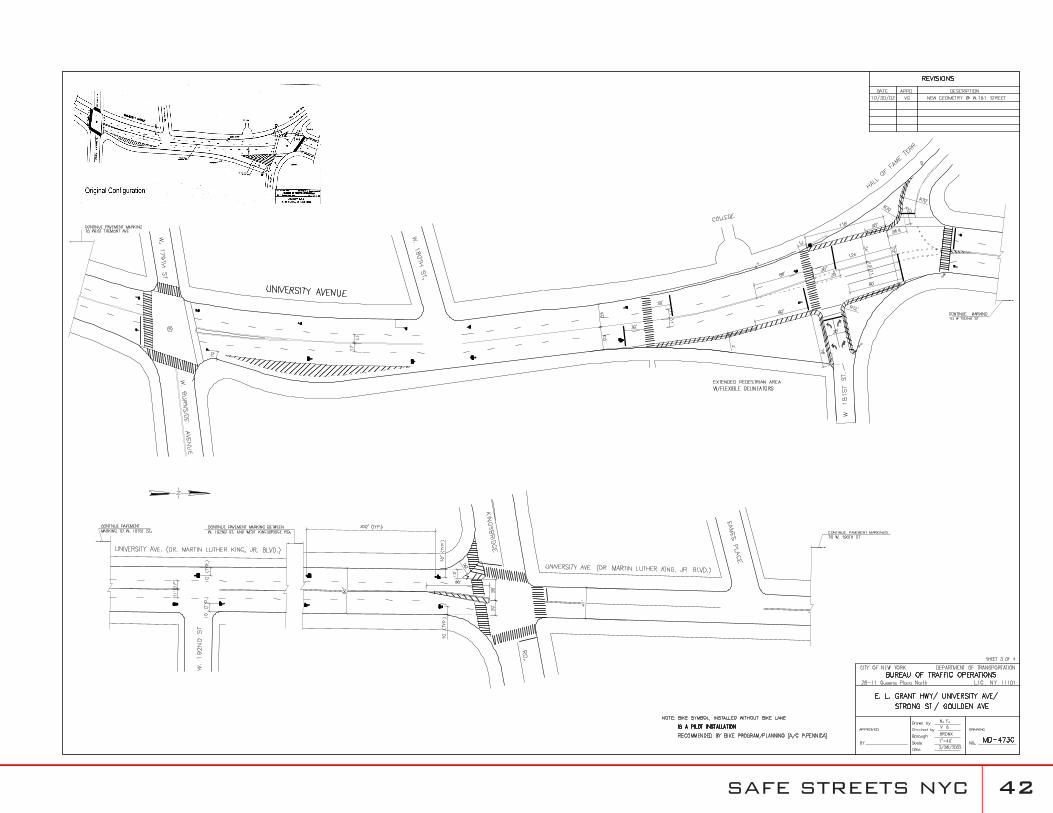
DescriptionIn its original configuration, the intersection of University Avenue, West 181st Street and Hall of Fame Terrace was unusually wide. Due to this configuration, the roadway was configured with large painted islands that channelized traffic resulting in Stop controlled roadways and unusual approaches and turning movements. Hall of Fame Terrace is offset from West 181st Street across University Avenue and there is a steep grade on Hall of Fame Terrace approaching the intersection. Surrounding land uses include Bronx Community College, a park, a library and a church all generating high pedestrian activity.
One of the primary concerns at this location was frequent jaywalking across University Avenue, (approximately 230 feet south of the signal) which was the result of a natural pedestrian path from a park on the east side of University Avenue to the entrance of Bronx Community College on the west. While not a high accident location, this intersection was of concern to the Department due to the surrounding land uses and increase in accidents in 2000, leading the Department to take a proactive approach at this location to address the safety concerns. In terms of the accident experience at this intersection, there was a 36% increase to 11 in 2000 from 7 in 1999, but in 2001 and 2002 they declined by 45% and 73% to six and three, respectively. After improvements were made in 2002, the average number of accidents per year decreased by 46% to 4.3 from an average of 8.0 from 1999 to 2001. Overall, the Department believes the improvements made at this intersection will continue to improve both pedestrian and vehicular safety.
University Avenue/West 1�1st Street/Hall of Fame Terrace
W18
1ST
DR M L KING JR BL
W 180 ST
HALL OF FAME TE
Accident Experience at University Av - West 181st St - Hall of Fame Terrace
7
11
6
3
7
5
10
2
4
6
8
10
12
1999 2000 2001 2002 2003 2004 2005
Re
po
rta
ble
Acc
ide
nts
Original Configuration of Intersection

SAFE STREETS NYC �1
Improvements Implemented in October 2002
Reconfigured the intersection with new channelization markings in combination with curb mounted delineators to create additional pedestrian space.
Reconstructed the existing signal to conform to the new geometry. The signal provides separate phases for Hall of Fame Terrace and West 181st Street which now operate concurrently.
Removed “Stop” controlled slip roadways to improve pedestrian safety.
Installed a left turn lane for northbound University Avenue.
Upgraded crosswalk markings to high visibility on the south leg of University Avenue and West 181st Street.
Installed a new pedestrian crossing signal with a high visibility crosswalk (approximately 230 feet south of West 181st Street) at the park walkway.
Installed a pedestrian separator on the west side of University Avenue (in front of the entrance/exit of Bronx Community College) to direct pedestrians to the signalized crossings.
The improvements are shown on the following page.
•
•
•
•
•
•
•
Detailed views of additional pedestrian space created by the use of curb mounteddelineators and markings
SAFE STREETS NYC �2