SACRAMENTO METROPOLITAN FIRE DISTRICT - …metrofir/phocadownloadpap/Finance/smfd... · The...
53
SACRAMENTO METROPOLITAN FIRE DISTRICT Audited Financial Statements June 30, 2011 and 2010
Transcript of SACRAMENTO METROPOLITAN FIRE DISTRICT - …metrofir/phocadownloadpap/Finance/smfd... · The...

SACRAMENTO METROPOLITAN FIRE DISTRICT
Audited Financial Statements
June 30, 2011 and 2010

SACRAMENTO METROPOLITAN FIRE DISTRICT
AUDITED FINANCIAL STATEMENTS
June 30, 2011 and 2010
TABLE OF CONTENTS
Independent Auditor's Report ....................................................................................................................... 1 Management’s Discussion and Analysis ....................................................................................................... 3
Basic Financial Statements
Statement of Net Assets and Governmental Fund Balance Sheet ............................................................... 18 Statement of Activities and Governmental Fund Revenues, Expenditures,
and Changes in Fund Balances ........................................................................................................... 20 Statement of Revenues, Expenditures and Changes in Fund Balance – Budget and Actual ...................... 22 Statement of Fiduciary of Net Assets ......................................................................................................... 24 Statement of Changes in Fiduciary Net Assets ........................................................................................... 25
Notes to the Basic Financial Statements ..................................................................................................... 26

Richardson & Company 550 Howe Avenue, Suite 210 Sacramento, California 95825
Telephone: (916) 564-8727
FAX: (916) 564-8728
1
INDEPENDENT AUDITOR’S REPORT
Board of Directors Sacramento Metropolitan Fire District Sacramento, California
We have audited the accompanying financial statements of the governmental activities and General Fund of the Sacramento Metropolitan Fire District (the District), as of and for the years then ended June 30, 2011 and 2010, which collectively comprise the District’s basic financial statements as listed in the table of contents. These financial statements are the responsibility of the District’s management. Our responsibility is to express opinions on these financial statements based on our audits.
We conducted our audits in accordance with auditing standards generally accepted in the United States of America and the standards applicable to financial audits contained in Government Auditing Standards, issued by the Comptroller General of the United States. We also conducted our audit in accordance with the State Controller’s Minimum Audit Requirements for California Special Districts. Those standards require that we plan and perform the audit to obtain reasonable assurance about whether the financial statements are free of material misstatement. An audit includes examining, on a test basis, evidence supporting the amounts and disclosures in the financial statements. An audit also includes assessing the accounting principles used and significant estimates made by management, as well as evaluating the overall financial statement presentation. We believe that our audits provide a reasonable basis for our opinions.
In our opinion, the financial statements referred to above present fairly, in all material respects, the respective financial position of the governmental activities and the General Fund as of June 30, 2011 and 2010 and the respective changes in financial position thereof and the budgetary comparison for the General Fund for the years then ended in conformity with accounting principles generally accepted in the United States of America.
In accordance with Government Auditing Standards, we have also issued our report dated January 27, 2012 on our consideration of the District’s internal control over financial reporting and our tests of its compliance with certain provisions of laws, regulations, contracts, and grant agreements and other matters. The purpose of that report is to describe the scope of our testing of internal control over financial reporting and compliance and the results of the testing, and not to provide an opinion on the internal control over financial reporting or on compliance. That report is an integral part of an audit performed in accordance with Government Auditing Standards and should be considered in assessing the results of our audits.
Sacramento Metropolitan Fire District Board of Directors
2
The management’s discussion and analysis and required supplementary information is not a required part of the basic financial statements but are supplementary information required by accounting principles generally accepted in the United States of America. We have applied certain limited procedures, which consisted principally of inquiries of management regarding the methods of measurement and presentation of the required supplementary information. However, we did not audit the information and express no opinion on it.
January 27, 2012

3
SACRAMENTO METROPOLITAN FIRE DISTRICT Management’s Discussion and Analysis For the Fiscal Years Ended June 30, 2011
The June 30, 2011, management discussion and analysis is presented in conjunction with the audited financial statements immediately following this section. In addition, discussion is provided regarding revenue collections and budgetary actions that have occurred to date in fiscal year 2012.
DISTRICT OVERVIEW
The Sacramento Metropolitan Fire District (District) is an independent special district created more than 10 years ago as a consolidation of 16 predecessor fire agencies, some founded as early as the 1920s. Upon the establishment of the District, it became the largest fire district in the County of Sacramento (County) and the seventh largest in the State of California (State). The District’s service area contains both incorporated cities and unincorporated areas of the County, with only the cities of Sacramento, Folsom, and Elk Grove still providing their own fire protection services. Its service area covers 417 square miles, including Mather and McClellan Fields, former United States Air Force bases, now converted into commercial/business uses.
Fire protection and life safety services are provided to more than 640,000 residents. These services include: fire suppression, fire prevention (inspections, investigations, and building plan review), public education services, emergency medical advanced life support services (EMS), rescue services, and hazardous material response. The District responds to approximately 65,000 emergency calls annually. Because most emergency calls are medical in nature, all firefighters are also certified as paramedics or emergency medical technicians (EMT).
The District owns 42 fire stations: 37 fire stations for fire suppression/EMS responses, one station for air operations, and four stations closed for cost savings. The District also owns its headquarters building, a fire prevention/supply warehouse building, a training facility, a fleet maintenance shop, and two surplus office buildings.
District resources also include 330 vehicles and units of equipment consisting of fire engines, fire trucks, ambulances, a hazardous materials truck, aerial ladder trucks, an aerial platform truck, rescue boats, one heavy rescue unit, two firefighting rescue helicopters, a bulldozer, a decontamination unit and multiple support staff vehicles.
Currently, the District has 615 employees, which is 179 employees fewer than pre‐recession staffing levels.
All of these resources are in place to serve the District’s mission “To provide professional and compassionate protection, education and service to our community.”

4
GOVERNANCE
A nine‐member board of directors (Board) governs the District. The Board is responsible for establishing District policies, adopting the annual budget, and for appointing the fire chief. Board members are elected to four‐year staggered terms, by resident voters within nine geographical divisions. Four of the nine Board members joined the Board after November 2010. Two of the Board members were elected in November 2010 and two others were recently appointed to fill Board member vacancies. In April 2011, the Board promoted Kurt P. Henke to the position of Fire Chief. Chief Henke uses his 30 years of fire service experience to oversee all aspects of the District’s fire protection and life safety services.
FINANCIAL SUMMARY REVENUE Funding for the services provided by the District primarily comes from property taxes. Since 2008, property values in the District’s service areas have declined, resulting in reduced property tax revenues. This in turn reduces funding for the District’s vital services. The property tax revenue for fiscal year 2011 was $19 million less than the amount received in 2008. It is projected that the overall reduction will reach $21 million in fiscal year 2012. In addition, development fees – used to fund District infrastructure – have dropped another $1.5 million from the amount received in 2008. Facing these challenges, steps were taken in fiscal year 2010, 2011 and 2012 to address the huge drop in revenue. Costs saving measures were implemented and new revenue sources pursued. Changes were initiated in fiscal year 2010 were fully implemented during fiscal year 2011. Cost‐saving measures made in fiscal year 2011 were in place less than the 12‐month period in fiscal year 2011. As a result, financial results show $21 million more in expenditures than revenues in fiscal year 2011. Further changes occurring in fiscal year 2012 will not be reflected in the current expenses. EXPENSES As a result of the decline in revenue, the District was forced to close two of its 42 fire stations in fiscal year 2010. Two additional stations were closed in fiscal year 2012. Management is making every effort to minimize the impact to the citizens by putting in place a strategic service delivery model. The model works to shorten dispatch time by strategically changing ambulance locations, leveraging technology, decentralizing training, and implementing dynamic movement of emergency units for maximum coverage. Within months of the closing, the District also assigned advance life support services to every fire engine.
The most significant actions taken to balance the District’s budget were reducing labor costs.

5
• In fiscal year 2010, 41 positions received pay cuts. Twenty‐seven (27) Fire Captain and
Engineer positions had temporary rank reductions. Fourteen (14) support personnel returned to lower positions previously held to avoid layoffs.
• In fiscal year 2011, cost containment measures included 34 labor force reductions. In total, 26 support staff were laid off, and eight employees voluntarily accepted incentives to leave District employment.
• Existing labor contracts were reopened in fiscal year 2011 to seek employee concessions. Management and labor agreed to a package of concessions that will generate a savings of $28 million over a three‐year contract period.
o District employees agreed to provide 12% funding to retirement benefits, which results in a commensurate reduction in take‐home pay. The deductions are being phased in with the first change beginning in the last quarter of fiscal year 2011, more changes will be phased in during fiscal year 2012 and the full 12% contribution will begin in fiscal year 2013. Concessions were also made to lower the rate of pay for overtime and callback pay.
o Cost of living wage increases were eliminated in the current labor contracts. o Additionally, second‐tier of lower benefits for vesting in retiree medical has been
instituted for new hires. • The pay package for the position of Fire Chief has also been reduced, with the current
contract representing a 21% reduction in total compensation, saving the District $89,000 annually.
Discussions are currently underway with management for additional concessions for further reducing labor costs. Many of these budget‐saving efforts reduced operating costs in fiscal year 2011 and are projected to save the District $13.5 million annually. No safety positions were cut. In fact, to replace retiring firefighters and to put in federally funded safety positions, 45 firefighters were hired in fiscal year 2011. CAPITAL Funding for infrastructure historically has come from development fees. With the virtual halt of construction in the area, the District was unable to fund infrastructure improvements and replacements in its usual way. To begin funding the District’s aging infrastructure and fire service apparatus needs, $11.2 million in debt was incurred in fiscal year 2011, and another $13 million was incurred in fiscal year 2012. A large portion of the fiscal year 2012 debt proceeds repaid the District’s reserves which had been advanced to purchase the headquarters building. Offsetting the fiscal year 2012 debt service payments is lease revenue from Sutter Health, the District’s new tenant sharing space in the District’s headquarters building located on the former Mather Air Force Base in Rancho Cordova. District operations were relocated to the headquarters building at the end of calendar year 2011. The move allowed a consolidation of all Administrative Staff to one location for maximum efficiency and staff coordination. When fully executed the leasing of the two formerly District occupied office buildings will generate

6
positive cash flow for further reinvestment in infrastructure replacement. Despite these efforts, the District is still unable to fully meet its infrastructure needs and is continuing to defer other needed facilities projects and equipment replacement. CHANGES To mitigate property tax losses, revenue enhancements have been put into place by increasing district‐wide emergency medical services and fees. Charge for Services was up $1.5 million in fiscal year 2011 from reducing the scope of ambulance services provided through a contract with American Medical Response (“AMR”), and instead using internal District resources. Fee increases were also put in place effective July 1, 2011, and therefore will serve to increase future revenue. The District also has put in place an active grant program to garner $1.1 million in fiscal year 2011 and is projected to bring in $7.6 million in fiscal year 2012. A portion of that includes a $5.5 million two‐year federal grant, “Staffing for Adequate Fire and Emergency Response,” awarded to the District in May 2011. This grant provides funding for 24 new firefighters and two fire trucks, but will expire in May of 2013. Economic analyses show the Sacramento region still faces serious economic woes which may result in further reductions in revenue. In sum, the District is making tough decisions in tough economic times and is working with its employees to reduce costs and replace lost revenue. Fortunately, the Board of Directors, Management, Labor and employees are all working collaboratively to serve the public’s interests. FINANCIAL INDICATORS
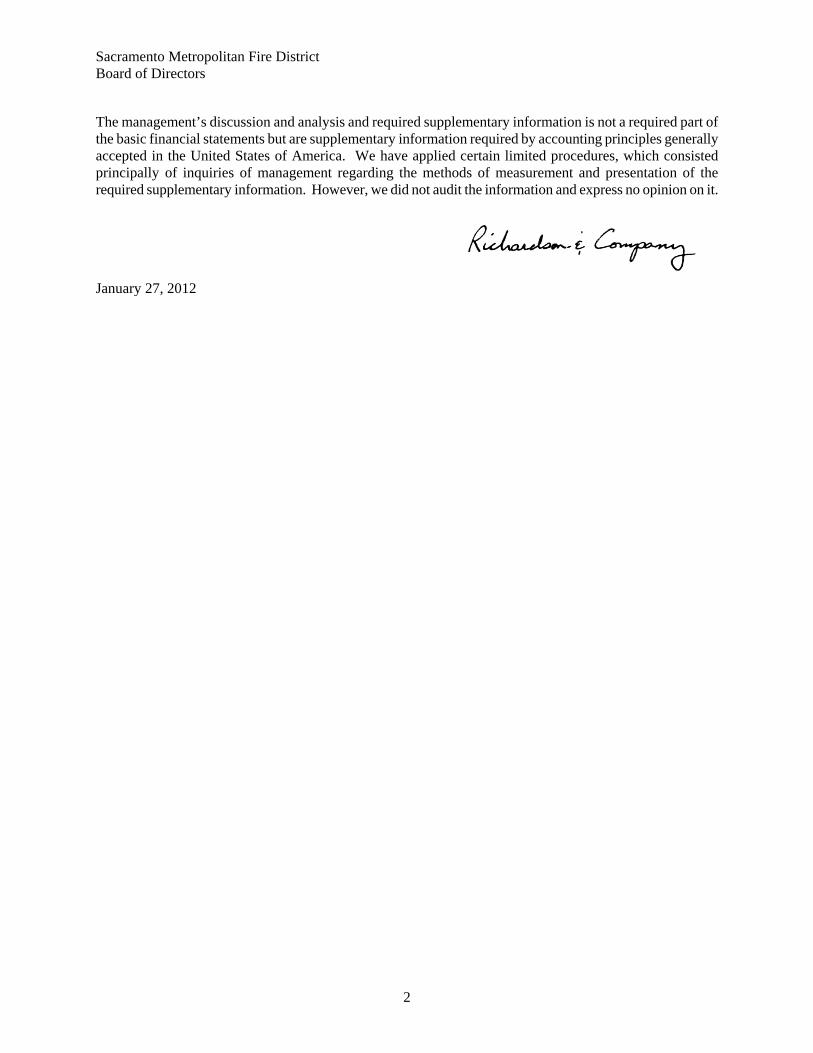
• The District’s total revenues declined by $22.1 million from 2008 to 2011, including a drop of $1.6 million in 2011. Had it not been for the efforts noted above with respect to ambulance transports and aggressively seeking grant revenue, the District would have experienced a much greater decline in 2011.
June 30,2009
159,377,000$
June 30,2010
143,706,000$
June 30,2011
142,097,000$
TOTAL REVENUES
$130,000,000
$140,000,000
$150,000,000
$160,000,000
$170,000,000
June 30,2009
June 30,2010
June 30,2011
• In fiscal year 2011, property tax revenue dropped another $3.7 million for a total
property tax loss of $19 million since 2008. The cumulative property tax revenue losses

7
including the District’s fiscal year 2012 budget are $21 million, as more reductions in property taxes are forecast.
• Expenses for the year were up $2.9 million in fiscal year 2011 even with the cost reduction efforts noted above. Service and supplies had a $3.3 million increase mostly from increases in medical supplies, utilities, fleet maintenance and fuel.
• Expenses exceeded revenue by $21 million in 2011, reducing the District’s net assets by that amount.
June 30,2009
80,285,000$
June 30,2010
64,071,000$
June 30,2011
43,370,000$
NET ASSETS
$20,000,000
$40,000,000
$60,000,000
$80,000,000
$100,000,000
June 30,2009
June 30,2010
June 30,2011
• Nearly $21 million was invested in infrastructure in fiscal year 2011. That amount includes the $11.2 million in replacement apparatus (see the discussion below regarding capital lease transactions under LIABILITIES), $1.5 million for site improvements for the Zinfandel training center, $5.9 million to purchase the headquarters building, and $2.2 million for improvements to the headquarters building.
June 30,2009
77,964,000$
June 30,2010
74,713,000$
June 30,2011
91,374,000$
CAPITAL ASSETS
$60,000,000
$70,000,000
$80,000,000
$90,000,000
$100,000,000
June 30,2009
June 30,2010
June 30,2011
• Long‐term obligations at June 30, 2011, are up $23 million or 18% due to the new lease obligation for fire apparatus ($11.2 million) and unfunded post‐retirement obligations ($15.6 million), less debt service payments.
• Lastly, the District’s auditors removed their audit opinion qualification from the prior years’ audits indicating the audited financial statements are fairly presented.

8
OVERVIEW OF THE BASIC FINANCIAL STATEMENTS
The District’s basic financial statements are: the Statement of Net Assets and Governmental Fund Balance Sheet; Statement of Activities and Governmental Fund Revenues, Expenditures, and Changes in Fund Balances; Statement of Revenues, Expenditures, and Changes in Fund Balances – Budget and Actual; and the Statement of Fiduciary Net Assets. Governmental funds financial statements focus on near‐term inflows and outflows of spendable resources, as well as of balances of spendable resources available at the end of the fiscal year. Such information may be useful in evaluating the District’s near‐term requirements. Government‐wide financial statements provide broad financial information using the accrual basis of accounting. This basis of accounting reports all assets and liabilities, including capital assets and outstanding debt, which is not shown in the Governmental fund financial statements. Accrual basis accounting also records revenue and expenses in the year earned regardless of the timing of cash received or paid. The Statement of Net Assets and Governmental Fund Balance Sheet show first the Governmental Funds and then have adjustments to arrive at the Government‐wide Statement of Net Assets. The Statement of Activities and Governmental Fund Revenues, Expenditures, and Changes in Fund Balances also show first the Governmental General Fund and then have adjustments to arrive at the Government‐wide Statement of Activities. See Note M for specific information on the adjustments. Financial statement notes are an important part of the basic financial statements. They provide the readers additional information required by GAAP. Preceding the basic financial statements is Management’s Discussion and Analysis, which is required supplementary information to the basic financials statements. The District adopts an appropriated budget for its governmental fund and actual to budget comparisons are shown in the Statement of Revenues, Expenditures, and Changes in Fund Balances – Budget and Actual. This required supplementary information demonstrates budget compliance.

9
NET ASSETS
The condensed Statement of Net Assets below show the District continues to struggle financially as indicated by significant decline in net assets in both fiscal years 2011 and 2010,. The statement also shows the District invested in new Capital Assets by incurring long‐term debt.
2009 2010 2011Change
2009 to 2011% of
Change
53,768 $ 54,857 $ 40,311 $ (13,457) $ ‐25.0% 67,789 69,246 72,408 4,619 6.8% 77,964 74,713 91,374 13,410 17.2% 199,521 198,816 204,093 4,572 2.3%
14,050 15,882 19,393 5,343 38.0% 105,186 118,863 141,330 36,144 34.4% 119,236 134,745 160,723 41,487 34.8%
77,964 74,713 80,148 2,184 2.8% 7,061 7,609 2,901 (4,160) ‐58.9% (4,740) (18,251) (39,679) (34,939) 737.2% 80,285 $ 64,071 $ 43,370 $ (36,915) $ ‐46.0%
Total Liabilities
CONDENSED STATEMENT OF NET ASSETSFISCAL YEARS ENDED JUNE 30, 2009, 2010 AND 2011
Assets:Current and otherPension assetCapital assetsTotal Assets
Liabilities:CurrentLong‐Term
(in thousands)
Net Assets:
RestrictedUnrestricted
TOTAL NET ASSETS
net of related debtInvestment in capital assets,
$0
$10,000,000
$20,000,000
$30,000,000
$40,000,000
$50,000,000
$60,000,000
$70,000,000
$80,000,000
$90,000,000
2009 2010 2011
TOTAL NET ASSETS OVER TIME

10
The District’s net assets have been declining for several years due primarily to declining property tax revenue and the inclusion of post‐retirement medical costs in the operating expenses. In 2009, GASB 45 required the recording unfunded annual required contributions (ARC) for other post‐retirement benefits (OPEB). The financial statement liabilities include $37 million for OPEB since this change in 2009, and the fiscal year 2011 unfunded ARC is $10 million. Of the 2011 ARC, 40% represents benefits promised to current employees and 60% is the liability for District retirees. It is the intent of management to set up an OPEB trust with the objective to start pre‐funding OPEB liabilities by June 30, 2012. This will allow investment earnings to contribute to these costs. In addition, management and labor will be meeting to make a cooperative effort to make contributions to the trust. The District’s Chief is the first employee to contractually agree to make contributions for OPEB and he will be asking others to follow suit. In addition, as of June 30, 2011, the District had set aside $1.7 million for payment of future post‐employment medical benefits. This money will be deposited in the trust once it is open.
REVENUES Property taxes represent the District’s largest general revenue source averaging 79.3% of total revenues for the last three years. This makes the District vulnerable to economic downturns. The loss of $19 million in property tax revenue between 2008 and 2011, makes it extremely challenging for the District to maintain current service levels. Other large revenue sources are charges for services and grant revenue. In prior years development fees were significant, but this is no longer the case with just $671,000 from development fees in 2011 to invest in infrastructure.
11
A summary of the District’s Revenue Sources is presented below:
2009 2010 2011Change
2009 to 2011% of
Change
General revenues126,816$ 114,845$ 111,182$ (15,635)$ ‐12.3%
Intergovernmental 2,219 2,456 2,308 89 4.0%Use of money & property 1,157 327 101 (1,056) ‐91.3%Miscellaneous 461 422 145 (317) ‐68.6%
340 506 (132) (472) ‐138.7%Total general revenues 130,993 118,556 113,603 (17,390) ‐13.3%
Program revenuesCharges for services 18,163 18,158 19,676 1,513 8.3%Development fees 1,368 893 671 (696) ‐50.9%
5,097 4,371 7,079 1,982 38.9%
Reimbursements/Other 3,756 1,728 1,066 (2,690) ‐71.6%Total revenues 28,383 25,150 28,493 109 0.4%
Total revenues 159,376$ 143,706$ 142,096$ (17,280)$ ‐10.8%
Capital grants, oper grants, contributions
CONDENSED STATEMENT OF REVENUES BY SOURCEFISCAL YEARS ENDED JUNE 30, 2009, 2010 AND 2011
Property taxes & assessments
Gain (loss) disposal of assets
(in thousands)
$125,000,000
$135,000,000
$145,000,000
$155,000,000
$165,000,000
$175,000,000
2009 2010 2011
TOTAL REVENUES

12
EXPENSES Overall expenses for fiscal year 2011 increased by $2.9 million over fiscal year 2010, but were still $9.9 below fiscal year 2009. Labor cost increases in 2011 were held to an increase of 1.7%, or $2.2 million, over 2010 and were 5.9% below 2009. Service and supplies had a $3.6 million increase in 2011 over 2010 mostly from increases in medical supplies, utilities, fleet maintenance and fuel. Offsetting these increases was a significant decrease in the OPEB expense for fiscal year 2011. The lower OPEB expense was the result of a recent actuarial valuation. Fewer covered employees due to the workforce reductions, as well as revisions to future insurance premiums, both contributed to a lower annual required contribution, or “ARC.”
125,000,000
135,000,000
145,000,000
155,000,000
165,000,000
175,000,000
2009 2010 2011
TOTAL EXPENSES

13
2009 2010 2011Change
2009 to 2011% of
Change
Public protection137,078$ 126,844$ 129,058$ (8,020)$ ‐5.9%
13,886 13,228 10,027 (3,859) ‐27.8%
11,746 10,117 13,728 1,982 16.9%
1,764 2,019 1,983 219 12.4%Total public protection 164,474 152,208 154,796 (9,678) ‐5.9%
Interest 4,305 3,872 4,139 (166) ‐3.9%Depreciation 3,968 3,841 3,864 (104) ‐2.6%
TOTAL EXPENSES 172,747$ 159,920$ 162,799$ (9,948)$ ‐5.8%
Services, supplies and materialsTaxes, licenses and assessments
CONDENSED STATEMENT OF EXPENSESFISCAL YEARS ENDED JUNE 30, 2009, 2010 AND 2011
Salaries and personnelOther Post Employment Benefits
(in thousands)
CHANGES IN NET ASSETS As noted earlier changes of net assets is trending downward from 2009 to 2011. This is a result of the use of reserves to address the budget deficits generated by the significant property tax revenue losses.
June 30, 2009 80,285,000$
June 30, 2010 64,071,000$
June 30, 2011 43,370,000$
NET ASSETS
$0
$20,000,000
$40,000,000
$60,000,000
$80,000,000
$100,000,000
2009 2010 2011
14
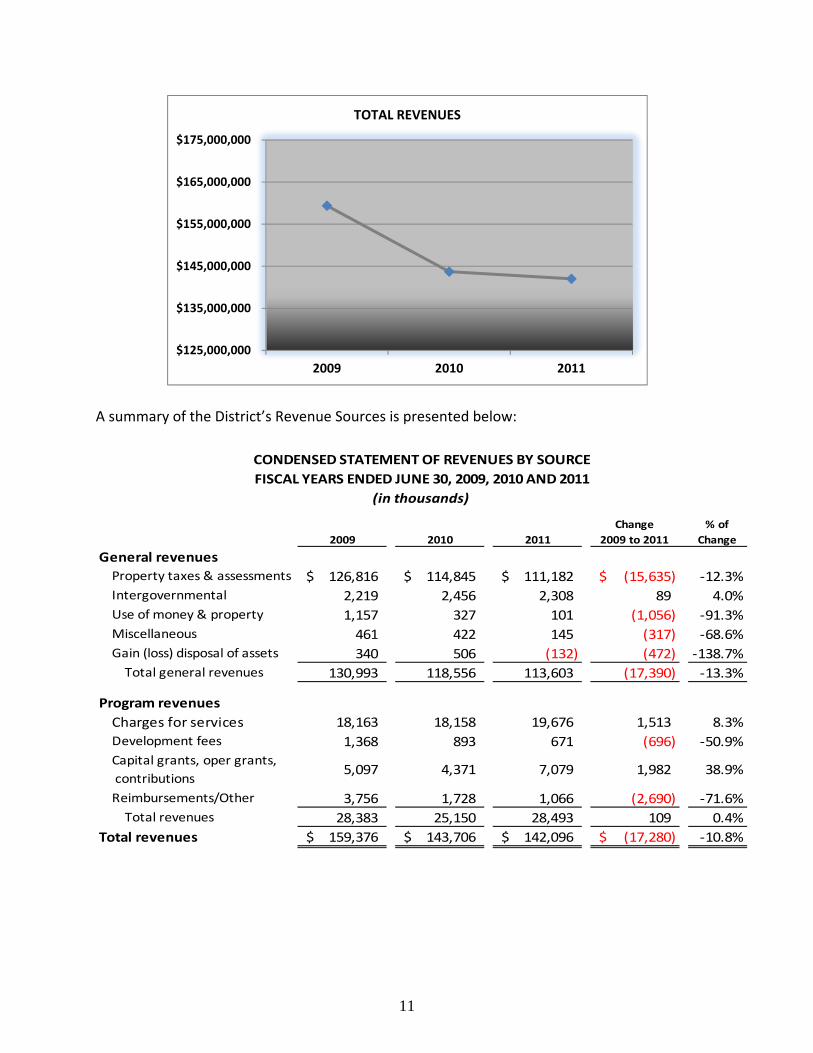
ASSETS As shown on page 7, the District’s assets are comprised of Current and Other Assets, Pension Assets, and Capital Assets. Current and Other Assets decreased $14.6 million from fiscal year 2010 to 2011 due to the use of cash reserves to fund the District’s deficit. Pension Assets increased $3.2 million from 2010 to 2011, due to an additional year of investment income, offset by the amortization of the net pension asset. Lastly, Capital Assets increased $16.7 million from 2010 to 2011 due to the new assets purchased for District operations as previously discussed.
LIABILITIES
Current liabilities include amounts for trade payables, salaries and benefits payable, deferred and unearned revenue, accrued interest payable and the current portion of long‐term liabilities. Those amounts increased by a total of $3.5 million in fiscal year 2011. The largest increase was from amounts due within one year on the new capital lease of $1.1 million. Long‐term liabilities include the capital lease, pension obligation bonds, compensated absences, OPEB liability and workers’ compensation liability. Since the recession hit, the District has been postponing its emergency fleet purchases. Facing an aging emergency vehicle fleet and increased demands for services, the District financed $11.2 million of emergency response apparatus in fiscal year 2011. The new capital lease was used for the financing. The emergency response apparatus includes 12 ambulances, 20 pumper engines and 2 tractor drawn aerials. Pumpers and aerials are financed for ten years at 2.88% with annual payments of $1.1 million, and the Ambulance Units are financed for five years at 2.17% with annual payments of $340,000.
$40,311,000
$72,408,000 $91,374,000
Current assets
Pension asset
Capital assets
15
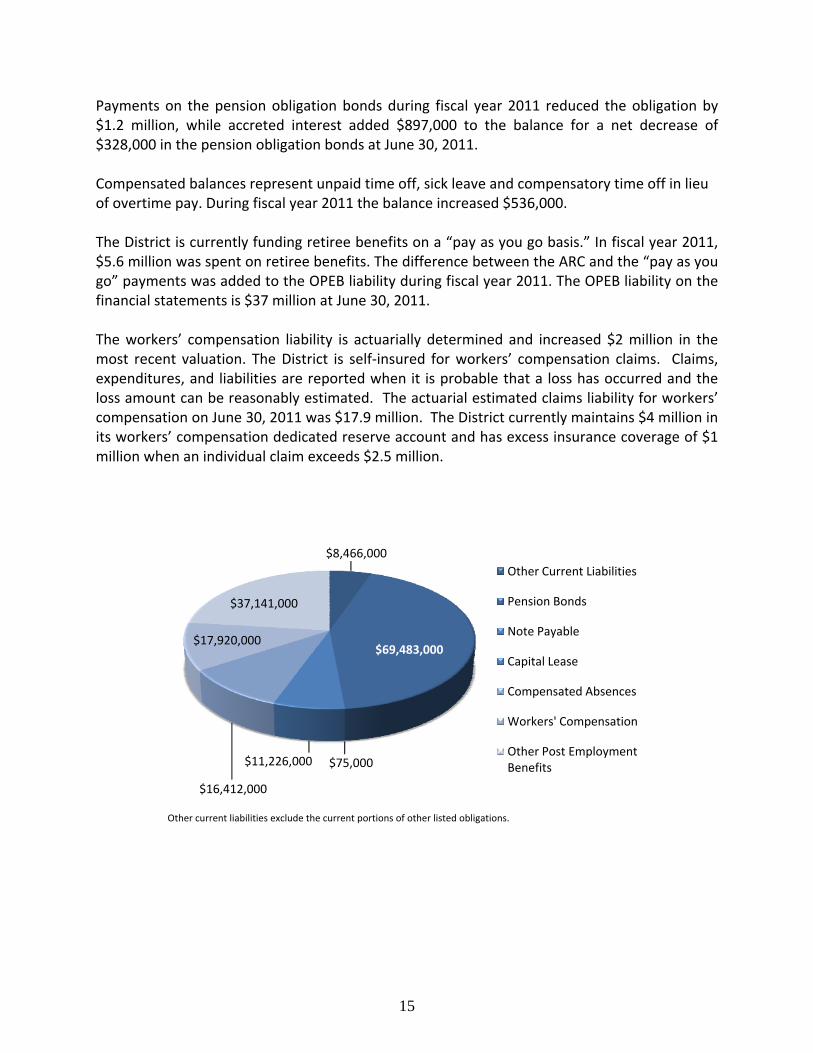
Payments on the pension obligation bonds during fiscal year 2011 reduced the obligation by $1.2 million, while accreted interest added $897,000 to the balance for a net decrease of $328,000 in the pension obligation bonds at June 30, 2011. Compensated balances represent unpaid time off, sick leave and compensatory time off in lieu of overtime pay. During fiscal year 2011 the balance increased $536,000. The District is currently funding retiree benefits on a “pay as you go basis.” In fiscal year 2011, $5.6 million was spent on retiree benefits. The difference between the ARC and the “pay as you go” payments was added to the OPEB liability during fiscal year 2011. The OPEB liability on the financial statements is $37 million at June 30, 2011. The workers’ compensation liability is actuarially determined and increased $2 million in the most recent valuation. The District is self‐insured for workers’ compensation claims. Claims, expenditures, and liabilities are reported when it is probable that a loss has occurred and the loss amount can be reasonably estimated. The actuarial estimated claims liability for workers’ compensation on June 30, 2011 was $17.9 million. The District currently maintains $4 million in its workers’ compensation dedicated reserve account and has excess insurance coverage of $1 million when an individual claim exceeds $2.5 million.
Other current liabilities exclude the current portions of other listed obligations.
$8,466,000
$69,483,000
$75,000 $11,226,000
$16,412,000
$17,920,000
$37,141,000
Other Current Liabilities
Pension Bonds
Note Payable
Capital Lease
Compensated Absences
Workers' Compensation
Other Post Employment Benefits
16
FUND BALANCE
In fiscal year 2011 the District implemented GASB Statement No. 54, Fund Balance Reporting and Governmental Fund Type Definitions. This statement established new fund balance classifications that comprise a hierarchy of fund balance resources that have been reflected in the General Fund, fund balances. For more information see Note H to the financial statements. Overall fund balance declined $12.7 million during fiscal year 2011. Large items contributing to the decreasing in fund balance were the excess of expenditures over revenues, and the investment of $20.8 million in capital assets. One large item increasing the fund balance in 2011 was the funds received from the $11.2 million capital lease discussed earlier.
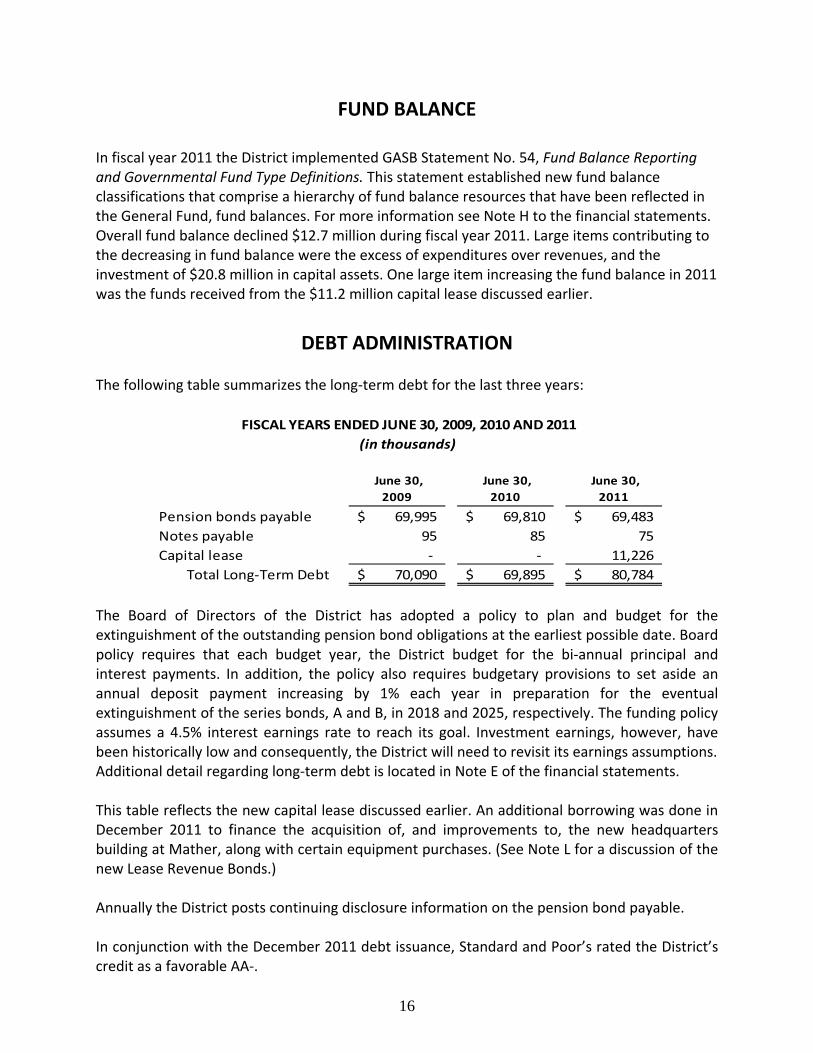
DEBT ADMINISTRATION
The following table summarizes the long‐term debt for the last three years:
June 30,2009
June 30,2010
June 30,2011
Pension bonds payable 69,995$ 69,810$ 69,483$ Notes payable 95 85 75 Capital lease ‐ ‐ 11,226
Total Long‐Term Debt 70,090$ 69,895$ 80,784$
FISCAL YEARS ENDED JUNE 30, 2009, 2010 AND 2011(in thousands)
The Board of Directors of the District has adopted a policy to plan and budget for the extinguishment of the outstanding pension bond obligations at the earliest possible date. Board policy requires that each budget year, the District budget for the bi‐annual principal and interest payments. In addition, the policy also requires budgetary provisions to set aside an annual deposit payment increasing by 1% each year in preparation for the eventual extinguishment of the series bonds, A and B, in 2018 and 2025, respectively. The funding policy assumes a 4.5% interest earnings rate to reach its goal. Investment earnings, however, have been historically low and consequently, the District will need to revisit its earnings assumptions. Additional detail regarding long‐term debt is located in Note E of the financial statements. This table reflects the new capital lease discussed earlier. An additional borrowing was done in December 2011 to finance the acquisition of, and improvements to, the new headquarters building at Mather, along with certain equipment purchases. (See Note L for a discussion of the new Lease Revenue Bonds.) Annually the District posts continuing disclosure information on the pension bond payable. In conjunction with the December 2011 debt issuance, Standard and Poor’s rated the District’s credit as a favorable AA‐.

17
GENERAL FUND BUDGETARY HIGHLIGHTS Budgetary fund variances are monitored by the Board of Directors at each monthly Finance Committee meeting. During the year, the District revised its budget to lower revenue by $6 million as revenue came in lower than expected from just about all sources. Actual revenue was an additional $867,000 below the budget as revised. Overall expenditures were $696,000 below budget. So the net budget variance is a negative $165,000. The fiscal year 2011 expenditures over revenue on the governmental fund budget was a $14.7 million deficit. District reserves were used to make up the shortfall. Fiscal year 2012 budget was originally in balance without the use of reserve funds. As discussed previously, a budget assessment is currently being done due to negative variances in labor cost and property tax receipts.
OBTAINING ADDITIONAL INFORMATION These financial reports are intended to provide The District’s elected officials, citizens, investors, and creditors with an assessment of the District’s financial condition and an accounting of the public’s money. If you have questions about this report or need more financial information, contact: Office of the Fire Chief, Sacramento Metropolitan Fire District, 10565 Armstrong Avenue, Mather, CA 95655. More information on the District’s operations can also be found on its website www.sacmetro.com.

Statement General Adjustments of Net
Fund (Note M) AssetsASSETS
Cash and investments 24,236,246$ 24,236,246$ Receivables, net of
allowance for uncollectibles:Medic fees receivable 4,391,410 4,391,410Interest receivable 21,372 21,372Taxes receivable 2,479,761 2,479,761Other receivables 12,700 12,700
Due from other governments 2,468,395 2,468,395Inventory 2,742,172 2,742,172Prepaid costs and other assets 123,123 123,123Restricted assets:
Cash and investments 3,382,337 3,382,337Unamortized bond issuance costs 453,007$ 453,007Pension asset 72,407,929 72,407,929Capital assets:
Not being depreciated 42,334,768 42,334,768Being depreciated, net 49,039,597 49,039,597
TOTAL ASSETS 39,857,516$ 164,235,301 204,092,817
LIABILITIESAccounts payable and accrued expenses 3,476,670 3,476,670 Salaries and benefits payable 4,236,406 4,236,406Deferred and unearned revenue 4,878,945 (4,878,945)Accrued interest payable 64,661 689,792 754,453Long-term liabilities:
Due within one year 342,629 10,582,894 10,925,523Due in more than one year 141,330,173 141,330,173
TOTAL LIABILITIES 12,999,311 147,723,914 160,723,225
FUND BALANCES/NET ASSETSFund balance:
Nonspendable 2,865,795 (2,865,795)Restricted 2,901,130 Committed 13,621,642 (13,621,642) Unassigned 7,469,638 (7,469,638)
Total fund balances 26,858,205 (23,957,075)
39,857,516$
Net assets:Invested in capital assets, net of related debt 80,148,451 80,148,451Restricted 2,901,130Unrestricted (39,679,989) (39,679,989)
TOTAL NET ASSETS 16,511,387$ 43,369,592$
The accompanying notes are an integral part of these financial statements.
SACRAMENTO METROPOLITAN FIRE DISTRICT
STATEMENT OF NET ASSETS AND GOVERNMENTAL FUND BALANCE SHEET
June 30, 2011
TOTAL LIABILITIES AND FUND BALANCES
18

Statement General Adjustments of Net
Fund (Note M) AssetsASSETS
Cash and investments 33,364,130$ 33,364,130$ Receivables, net of
allowance for uncollectibles:Medic fees receivable 3,327,151 3,327,151Interest receivable 177,051 177,051Taxes receivable 3,334,992 3,334,992Other receivables 381,026 381,026
Due from other governments 3,786,558 3,786,558Inventory 2,331,265 2,331,265Prepaid costs and other assets 39,143 39,143Restricted assets:
Cash and investments 7,628,134 7,628,134Unamortized bond issuance costs 487,854$ 487,854Pension asset 69,245,984 69,245,984Capital assets:
Not being depreciated 22,976,014 22,976,014Being depreciated, net 51,736,896 51,736,896
TOTAL ASSETS 54,369,450$ 144,446,748 198,816,198
LIABILITIESAccounts payable and accrued expenses 2,628,154$ 2,628,154 Salaries and benefits payable 2,871,553 2,871,553Deferred and unearned revenue 6,912,280 (6,912,280) - Accrued interest payable 3,365 456,958 460,323Long-term liabilities:
Due within one year 354,584 9,567,064 9,921,648Due in more than one year 118,863,383 118,863,383
TOTAL LIABILITIES 12,769,936 121,975,125 134,745,061
FUND BALANCES/NET ASSETSFund balance:
Nonspendable 2,370,908 (2,370,908)Restricted 7,608,994 Committed 19,103,311 (19,103,311)Unassigned 12,516,301 (12,516,301)
Total fund balances 41,599,514 (33,990,520)
54,369,450$
Net assets:Invested in capital assets, net of related debt 74,712,910 74,712,910Restricted 7,608,994Unrestricted (18,250,767) (18,250,767)
TOTAL NET ASSETS 22,471,623$ 64,071,137$
The accompanying notes are an integral part of these financial statements.
SACRAMENTO METROPOLITAN FIRE DISTRICT
STATEMENT OF NET ASSETS AND GOVERNMENTAL FUND BALANCE SHEET
June 30, 2010
TOTAL LIABILITIES AND FUND BALANCES
19

General Adjustments StatementFund (Note M) of Activities
PROGRAM REVENUESCharges for services 18,521,065$ 1,155,374$ 19,676,439$ Reimbursements from other agencies 1,417,163 (359,142) 1,058,021 Development fees 670,997 670,997 Capital grants and contributions 1,337,199 571,783 1,908,982 Operating grants and contributions 7,079,009 (1,908,834) 5,170,175 Fines, forfeitures, and penalties 8,169 8,169
TOTAL PROGRAM REVENUES 29,033,602 (540,819) 28,492,783
EXPENDITURES/EXPENSESCurrent:
Public protection 145,362,703 9,433,091 154,795,794 Capital outlay 20,790,074 (20,790,074) - Debt service:
Principal 1,235,675 (1,235,675) - Interest 2,973,820 1,165,026 4,138,846
Depreciation 3,863,875 3,863,875 TOTAL EXPENDITURES/EXPENSES 170,362,272 (7,563,757) 162,798,515
NET PROGRAM EXPENSE (141,328,670) 7,022,938 (134,305,732)
GENERAL REVENUESProperty taxes and assessments 112,080,077 (898,187) 111,181,890 Intergovernmental 2,897,007 (589,250) 2,307,757 Use of money and property 100,611 100,611 Miscellaneous 150,584 (5,079) 145,505 Gain on disposal of assets (131,576) (131,576)
TOTAL GENERAL REVENUES 115,228,279 (1,624,092) 113,604,187
EXCESS (DEFICIENCY) OFREVENUES OVER EXPENDITURES (26,100,391) 5,398,846 (20,701,545)
OTHER FINANCING SOURCES:Proceeds from capital leases 11,225,914 (11,225,914) - Proceeds from sale of assets 133,168 (133,168) -
TOTAL OTHER FINANCINGSOURCES (USES) 11,359,082 (11,359,082) -
(14,741,309) (5,960,236) (20,701,545)
Fund balance/net assets, beginning of year 41,599,514 22,471,623 64,071,137
FUND BALANCE/NET ASSETS, END OF YEAR 26,858,205$ 16,511,387$ 43,369,592$
The accompanying notes are an integral part of these financial statements.
OVER EXPENDITURES
SACRAMENTO METROPOLITAN FIRE DISTRICT
STATEMENT OF ACTIVITIES AND GOVERNMENTAL FUND REVENUES,EXPENDITURES, AND CHANGES IN FUND BALANCES
For the Year Ended June 30, 2011
EXCESS (DEFICIENCY) OF REVENUES ANDOTHER FINANCING SOURCES
20

General Adjustments StatementFund (Note M) of Activities
PROGRAM REVENUESCharges for services 18,464,189$ (305,388)$ 18,158,801$ Reimbursements from other agencies 1,843,061 (128,442) 1,714,619 Development fees 893,121 893,121 Capital grants and contributions 82,667 82,667 Operating grants and contributions 3,071,405 1,216,441 4,287,846 Fines, forfeitures, and penalties 13,834 13,834
TOTAL PROGRAM REVENUES 24,285,610 865,278 25,150,888
EXPENDITURES/EXPENSESCurrent:
Public protection 140,181,808 12,025,924 152,207,732 Capital outlay 739,765 (739,765) - Debt service:
Principal 1,044,981 (1,044,981) - Interest 2,987,504 884,418 3,871,922
Depreciation 3,840,572 3,840,572 TOTAL EXPENDITURES/EXPENSES 144,954,058 14,966,168 159,920,226
NET PROGRAM EXPENSE (120,668,448) (14,100,890) (134,769,338)
GENERAL REVENUESProperty taxes and assessments 116,508,904 (1,663,873) 114,845,031 Intergovernmental 2,588,949 (132,838) 2,456,111 Use of money and property 326,570 326,570 Miscellaneous 440,295 (18,054) 422,241 Gain on disposal of assets 505,604 505,604
TOTAL GENERAL REVENUES 119,864,718 (1,309,161) 118,555,557
EXCESS (DEFICIENCY) OFREVENUES OVER EXPENDITURES (803,730) (15,410,051) (16,213,781)
OTHER FINANCING SOURCES:Proceeds from sale of assets 631,008 (631,008) -
TOTAL OTHER FINANCINGSOURCES (USES) 631,008 (631,008) -
(172,722) (16,041,059) (16,213,781)
Fund balance/net assets, beginning of year 41,772,236 38,512,682 80,284,918
FUND BALANCE/NET ASSETS, END OF YEAR 41,599,514$ 22,471,623$ 64,071,137$
The accompanying notes are an integral part of these financial statements.
SACRAMENTO METROPOLITAN FIRE DISTRICT
STATEMENT OF ACTIVITIES AND GOVERNMENTAL FUND REVENUES,EXPENDITURES, AND CHANGES IN FUND BALANCES
For the Year Ended June 30, 2010
EXCESS (DEFICIENCY) OF REVENUES ANDOTHER FINANCING SOURCES
OVER EXPENDITURES
21

Variance withFinal Budget
Original Positive/Budget Final Budget Actual (Negative)
REVENUESTaxes and assessments 115,194,689$ 113,818,592$ 112,080,077$ (1,738,515)$ Intergovernmental 13,091,680 11,307,908 11,313,215 5,307 Charges for services 20,171,018 18,422,642 18,521,065 98,423 Reimbursements from other agencies 1,417,163 1,417,163 Development fees 1,350,000 1,000,000 670,997 (329,003) Use of money and property 348,165 176,165 100,611 (75,554) Fines, forfeitures, and penalties 14,456 10,935 8,169 (2,766) Miscellaneous 823,600 392,855 150,584 (242,271)
TOTAL REVENUES 150,993,608 145,129,097 144,261,881 (867,216)
EXPENDITURESCurrent:
Public protectionSalaries and personnel 133,846,286 130,054,992 129,650,797 404,195 Services and supplies 13,350,537 13,964,819 13,728,419 236,400 Other 2,110,721 1,987,779 1,983,487 4,292
Capital outlay 14,956,024 13,793,224 9,564,160 4,229,064 Debt service:
Principal 9,500 1,235,675 (1,226,175) Interest 12,000 22,000 2,973,820 (2,951,820)
TOTAL EXPENDITURES 164,275,568 159,832,314 159,136,358 695,956
(DEFICIENCY) EXCESS OFREVENUES OVER EXPENDITURES (13,281,960) (14,703,217) (14,874,477) (171,260)
OTHER FINANCING SOURCESProceeds from sale of assets 251,207 126,602 133,168 6,566
TOTAL OTHER FINANCING SOURCES 251,207 126,602 133,168 6,566
NET CHANGE IN FUND BALANCE (13,030,753)$ (14,576,615)$ (14,741,309)$ (164,694)$
The accompanying notes are an integral part of these financial statements.
SACRAMENTO METROPOLITAN FIRE DISTRICT
STATEMENT OF REVENUES,EXPENDITURES, AND CHANGES IN FUND BALANCES - BUDGET AND ACTUAL
For the Year Ended June 30, 2011
22

Variance withFinal Budget
Original Positive/Budget Final Budget Actual (Negative)
REVENUESTaxes and assessments 118,758,712$ 118,758,710$ 116,508,904$ (2,249,806)$ Intergovernmental 9,749,761 9,749,761 5,660,354 (4,089,407) Charges for services 18,002,515 18,002,515 18,464,189 461,674 Reimbursements from other agencies 1,843,061 1,843,061 Development fees 1,627,091 1,627,091 893,121 (733,970) Use of money and property 303,274 622,863 326,570 (296,293) Fines, forfeitures, and penalties 20,587 20,587 13,834 (6,753) Miscellaneous 1,244,615 1,244,615 440,295 (804,320)
TOTAL REVENUES 149,706,555 150,026,142 144,150,328 (5,875,814)
EXPENDITURESCurrent:
Public protectionSalaries and personnel 132,188,893 132,188,893 128,045,471 4,143,422 Services and supplies 12,869,634 12,869,634 10,117,137 2,752,497 Other 2,036,440 2,036,440 2,019,200 17,240
Capital outlay 2,530,680 2,535,680 739,765 1,795,915 Debt service:
Principal 127,000 127,000 1,044,981 (917,981) Interest 257,000 257,000 2,987,504 (2,730,504)
TOTAL EXPENDITURES 150,009,647 150,014,647 144,954,058 5,060,589
(DEFICIENCY) EXCESS OFREVENUES OVER EXPENDITURES (303,092) 11,495 (803,730) (815,225)
OTHER FINANCING SOURCESProceeds from sale of assets 1,183 1,183 631,008 629,825
TOTAL OTHER FINANCING SOURCES 1,183 1,183 631,008 629,825
NET CHANGE IN FUND BALANCE (301,909)$ 12,678$ (172,722)$ (185,400)$
The accompanying notes are an integral part of these financial statements.
SACRAMENTO METROPOLITAN FIRE DISTRICT
STATEMENT OF REVENUES,EXPENDITURES, AND CHANGES IN FUND BALANCES - BUDGET AND ACTUAL
For the Year Ended June 30, 2010
23

2011 2010ASSETS:
Cash and investments, at fair value 11,610$ 28,099$
Total assets 11,610$ 28,099$
NET ASSETS:Held in trust for pension benefits 11,610$ 28,099$
Total net assets 11,610$ 28,099$
The accompanying notes are an integral part of these financial statements.
SACRAMENTO METROPOLITAN FIRE DISTRICT
STATEMENT OF FIDUCIARY NET ASSETS
June 30, 2011 and 2010
24

2011 2010Additions:
Investment income 868$ 112,858$ Employer contributions 5,000
Total revenues 5,868 112,858
Deductions:Benefits paid 22,347 830,610 Administrative fees 10 1,873
Total expenditures 22,357 832,483
Change in net assets (16,489) (719,625)
Net assets, beginning of year 28,099 747,724
Net assets, end of year 11,610$ 28,099$
The accompanying notes are an integral part of these financial statements.
SACRAMENTO METROPOLITAN FIRE DISTRICT
STATEMENT OF CHANGES IN FIDUCIARY NET ASSETS
For the year ended June 30, 2011 and 2010
25
SACRAMENTO METROPOLITAN FIRE DISTRICT
NOTES TO THE BASIC FINANCIAL STATEMENTS
June 30, 2011 and 2010
26
NOTE A–REPORTING ENTITY AND SUMMARY OF SIGNIFICANT ACCOUNTING POLICIES
The basic financial statements of the District have been prepared in conformity with accounting principles generally accepted in the United States of America as applied to government units. The Governmental Accounting Standards Board (GASB) is the standard-setting body for establishing governmental accounting and financial reporting principles. The District’s significant accounting policies are described below.
Scope of Financial Reporting Entity: The District was established under Health & Safety Code Section 13800 on December 1, 2000, as a result of the merger between the American River and Sacramento County Fire Protection Districts. It is governed by a nine member Board of Directors elected by geographic division. The District’s boundaries cover approximately 417 square miles that include Sacramento and Placer counties with a population exceeding 640,000 residents. The District provides fire protection services including fire suppression, fire prevention, inspection, plan checking, and public education programs. It also provides emergency medical services, advanced life support and rescue services, and ambulance services. It operates forty-two fire stations, an administration building, a fire prevention/supply warehouse building, a training facility, fleet maintenance shops, and employs approximately 750 people.
Joint Power Authorities or Jointly Governed Organizations: The District is a member of the Northern California Fire and Rescue Training Authority (CFRTA), the Sacramento Regional Fire/EMS Communications Center (SRFECC) and the Special District Risk Management Authority (SDRMA), for which the District participation does not involve an ongoing financial interest or responsibility. The amounts paid to SDRMA are for insurance coverage. The amounts paid to these jointly governed organizations consist of the following:
2011 2010
CFRTA 45,000$ 46,000$ SRFECC 2,487,853 2,448,674 SDRMA 443,416 454,119
Basis of presentation - Government-wide Financial Statements: The government-wide financial statements (i.e., the statement of net assets and the statement of activities) report information on all of the activities of the District. The effect of interfund activity has been removed from these statements. The District has only governmental activities, which are supported primarily by taxes, intergovernmental revenues and charges for services.
The statement of activities demonstrates the degree to which the direct expenses of a given function or segment is offset by program revenues. Direct expenses are those that are clearly identifiable with a specific function or segment. Program revenues include 1) charges to customers who purchase, use or directly benefit from goods, services, or privileges provided by a given function or segment and 2) grants and contributions that are restricted to meeting the operational or capital requirements of a particular function or segment. Taxes and other items not properly included among program revenues are reported instead as general revenues.
The government-wide financial statements are reported using the economic resources measurement focus and the accrual basis of accounting. Revenues are recorded when earned and expenses are recorded when a liability is incurred, regardless of the timing of related cash flows. Property taxes are recognized as revenues in the year of which they are levied. Grants and similar items are recognized as revenue when all eligibility requirements have been met.

SACRAMENTO METROPOLITAN FIRE DISTRICT
NOTES TO THE BASIC FINANCIAL STATEMENTS
June 30, 2011 and 2010
27
NOTE A–REPORTING ENTITY AND SUMMARY OF SIGNIFICANT ACCOUNTING POLICIES (CONTINUED)
When both restricted and unrestricted resources are available for use, it is the District’s policy to use restricted resources first, then unrestricted resources as they are needed.
Basis of Presentation - Fund Financial Statements: The accounts of the District are organized on the basis of funds. A fund is a separate accounting entity with a self-balancing set of accounts. All of the District’s activities are reported in the General Fund.
Governmental fund financial statements are reported using the current financial resources measurement focus and the modified accrual basis of accounting. Revenues are recognized as soon as they are both measurable and available. Revenues are considered to be available when they are collectible within the current period or soon enough thereafter to pay liabilities of the current period. For this purpose, the District considers all revenues to be available if they are collected within 90 days of the end of the current fiscal period. Expenditures generally are recorded when a liability is incurred, as under accrual accounting. However, debt service expenditures, as well as expenditures related to compensated absences and workers compensation claims, are recorded only when payment is due. General capital asset acquisitions are reported as expenditures in governmental funds. Payable balances consist primarily of payables to vendors. Property taxes, charges for services, intergovernmental revenues, rental income, and investment earnings associated with the current fiscal period are all considered to be susceptible to accrual and so have been recognized as revenues of the current fiscal period. All other revenue items are considered to be measurable and available only when cash is received by the government.
The District reports a General Fund that is used to account for all financial resources except those required or designated by the Board of Directors to be accounted for in another fund. The Pension Trust Fund is a fiduciary fund used to report resources that are required to be held in trust for the members and beneficiaries of the Sacramento County Fire Protection District Defined Benefit Pension Plan.
Budgetary Principles: As required by the laws of the State of California, the District prepares and legally adopts a final balanced operating budget on or before October 1 of each fiscal year. Public hearings are conducted on the proposed final budget to review all appropriations, sources of financing, and to provide opportunities for public comment.
Operating budgets are adopted for the General Fund on the modified accrual basis of accounting. Budgetary control and the legal level of control are at the object level. Significant amendments, appropriation transfers between objects, and transfers from contingencies, must be approved by the District’s Board of Directors. Supplemental appropriations financed by unanticipated revenues also must be approved by the Board. No significant supplemental appropriations were required during the years ended June 30, 2011 and 2010. The final budget data contained in the financial statements reflects the effect of all approved budget amendments.
The Statements of Revenues, Expenditures and Changes in Fund Balances – Budget and Actual is prepared on the budgetary basis of accounting and does not include the capital lease proceeds of $11,225,914 that are recorded as proceeds from capital lease and capital outlay expenditures on the GAAP basis.
Restricted Assets: The District’s restricted assets consist of fees collected to defray the cost of constructing facilities to serve new construction, amounts held for payment of workers compensation claims and amounts held for the District’s flexible spending plan.

SACRAMENTO METROPOLITAN FIRE DISTRICT
NOTES TO THE BASIC FINANCIAL STATEMENTS
June 30, 2011 and 2010
28
NOTE A–REPORTING ENTITY AND SUMMARY OF SIGNIFICANT ACCOUNTING POLICIES (CONTINUED)
Medic Fees Receivable: Accounts receivable arise from billings to insurance companies and patients medic services. The District has provided an allowance for doubtful accounts of $4,046,009 and $2,950,492 at June 30, 2011 and 2010, respectively.
Capital Assets: Capital assets for governmental fund types are not capitalized in the funds used to acquire or construct them. Capital acquisitions are reflected as an expenditure in the governmental fund, and the related assets are reported in the government-wide financial statements. Capital assets are defined by the District as assets with an initial, individual cost of more than $5,000. Such assets are recorded at historical cost if purchased or constructed. Donated capital assets are recorded at the estimated fair market value at the date of donation. For certain older assets, including infrastructure, estimated historical costs are used. The costs of normal maintenance and repairs that do not add to the value of the asset or materially extended assets lives are not capitalized.
Capital assets are depreciated using the straight-line method over the following useful lives:
Asset Class YearsBuildings and Improvements 25 to 50Equipment 5 to 20
Costs of assets sold or retired (and related amounts of accumulated depreciation) are eliminated from the accounts in the year of sale or retirement and the resulting gain or loss is included in the operating statement of the related fund. In governmental funds, the sale of general capital assets is included in the statement of revenues, expenditures and changes in fund balances as proceeds from sale.
Inventory: Inventories are stated at the lower of average cost or market. Inventories consist of medical and other supplies, vehicle parts, helicopter parts and fuel maintained in tanks.
Prepaid Costs: Certain payments to vendors reflect costs applicable to future accounting periods and are recorded as prepaid costs in both government-wide and fund financial statements. Prepaid costs of governmental funds are offset by a reservation of fund balance to indicate they do not constitute resources available for future appropriation.
Deferred and Unearned Revenues: Unearned revenues arise when resources are received by the District before it has legal claim to them (i.e., when grant monies are received prior to the incurrence of qualifying expenditures). Deferred revenues in governmental funds arise when a potential revenue source does not meet both the “measurable” and “available” criteria for recognition in the current period. Revenues deferred because they were not received in the availability period are recognized for the government-wide presentation.
Compensated Absences: Regular, full-time District employees are granted vacation, sick and holiday leave in varying amounts based upon length of service. Any accrued hours, not in excess of the maximum allowable, which are unused during the current period, are carried forward to following years. Additionally, certain employees are allowed compensated time-off in lieu of overtime compensation and/or from working on

SACRAMENTO METROPOLITAN FIRE DISTRICT
NOTES TO THE BASIC FINANCIAL STATEMENTS
June 30, 2011 and 2010
29
NOTE A–REPORTING ENTITY AND SUMMARY OF SIGNIFICANT ACCOUNTING POLICIES (CONTINUED)
holidays. District employees may receive from 36% to 38% of accumulated sick leave in cash upon termination, with the remainder applied as an additional service credit for the purpose of determining pension benefits under the Public Employees’ Retirement System.
Compensated absences are accrued in the government-wide financial statements when earned. A liability for compensated absences is reported in governmental funds only if they have matured, for example, as a result of employee resignations and retirements and is currently payable. Each year’s budget includes a provision for the estimated expenditure for the current year.
Long-term Obligations: In the government-wide financial statements, long-term debt and other long-term obligations are reported as liabilities in the applicable government activities. Issuance costs are reported as deferred charges and are amortized over the life of the related debt.
In the fund financial statements, governmental fund types recognize bond premiums and discounts, as well as issuance costs, during the current period. The face amount of the debt issued is reported as other financing sources. Premiums received on debt issuances are reported as other financing sources while discounts on debt issuances are reported as other financing uses. Issuance costs, even if withheld from the actual net proceeds received, are reported as debt service expenditures.
Property Taxes: The County of Sacramento is responsible for the collection and allocation of property taxes. Under California law, property taxes are assessed and collected by the County of Sacramento up to 1% of the full cash value of taxable property, plus other increases approved by the voters and distributed in accordance with statutory formulas. The District recognizes property taxes when the individual installments are due provided they are collected within 60 days after year-end.
Secured property taxes are levied on or before the first day of September of each year. They become a lien on real property on March 1 preceding the fiscal year for which taxes are levied. These taxes are paid in two equal installments; the first is due November 1 and delinquent with penalties after December 10; the second is due February 1 and delinquent with penalties after April 10. Secured property taxes, which are delinquent and unpaid as of June 30, are declared to be tax defaulted and are subject to redemption penalties, cost, and interest when paid. If the delinquent taxes are not paid at the end of five years, the property is sold at public auction and the proceeds are used to pay the delinquent amounts due. Any excess is remitted, if claimed, to the taxpayer. Additional tax liens are created when there is a change in ownership of property or upon completion of new construction. Tax bills for these new tax liens are issued throughout the fiscal year and contain various payments and delinquent dates, but are generally due within one year. If the new tax liens are lower, the taxpayer receives a tax refund rather than a tax bill. Unsecured personal property taxes are not a lien against real property. These taxes are due on March 1, and become delinquent, if unpaid on August 31.
The County uses the alternative method of property tax apportionment known as the “Teeter Plan.” Under this method of property tax apportionment, the County purchases the delinquent secured taxes at June 30 of each fiscal year. These taxes are accrued as intergovernmental receivables only if they are received from the County within 60 days after year-end for the governmental funds and are accrued when earned for the government-wide presentation regardless of the timing of the related cash flows.

SACRAMENTO METROPOLITAN FIRE DISTRICT
NOTES TO THE BASIC FINANCIAL STATEMENTS
June 30, 2011 and 2010
30
NOTE A–REPORTING ENTITY AND SUMMARY OF SIGNIFICANT ACCOUNTING POLICIES (CONTINUED)
Reimbursements from Other Agencies: The District incurs costs associated with deploying strike teams to fight fires for which it receives reimbursement from other agencies for the salary and other costs reimbursed by the District. The District reflects these revenues as an offset to expenses for budgetary purposes.
New Accounting Pronouncements: In March 2009, GASB issued Statement No. 54, Fund Balance Reporting and Governmental Fund Type Definitions. This Statement establishes fund balance classifications that comprise a hierarchy based primarily on the extent to which a government is bound to observe constraints imposed upon the use of the resources reported in governmental funds. This Statement was implemented as of June 30, 2011.
NOTE B–CASH AND INVESTMENTS
At June 30, 2011 and 2010, the District’s cash and investments are classified in the accompanying financial statements as follows:
2011 2010
Cash and investments 24,236,246$ 33,364,130$ Restricted cash and investments 3,382,337 7,628,134 Investments in fiduciary fund 11,610 28,099
27,630,193$ 41,020,363$
Cash and investments as of June 30, 2011 and 2010 consisted of the following:
2011 2010
Cash on hand 500$ 500$ Deposits with financial institutions 182,745 239,785 Total cash 183,245 240,285
Investment in Sacramento County Pooled Investment FundInvestment Fund 19,668,441 32,984,889
Held by pension plan trusteeMoney market mutual funds 6,071 3,081 Mutual funds 5,539 25,018
Held by pension bond trusteeMoney market mutual funds 7,766,897 7,767,090
Total investments 27,446,948 40,780,078
Total 27,630,193$ 41,020,363$

SACRAMENTO METROPOLITAN FIRE DISTRICT
NOTES TO THE BASIC FINANCIAL STATEMENTS
June 30, 2011 and 2010
31
NOTE B–CASH AND INVESTMENTS (CONTINUED)
Deposit and Investment Policies: Investments are stated at fair value. California statutes authorize special districts to invest idle or surplus funds in a variety of credit instruments as provided for in the California Government Code, Section 53600, Chapter 4 - Financial Affairs. The table below identifies the investment types that are authorized for the District by the California Government Code (or the District’s investment policy, where more restrictive) that address interest rate risk, credit risk, and concentration of credit risk.
Maximum MaximumMaximum Percentage Investment
Authorized Investment Type Maturity Of Portfolio In One Issue
Local agency bonds 5 years None NoneU.S. Treasury obligations 5 years None NoneU.S. Agency securities 5 years None NoneCalifornia Local Agency debt 5 years None NoneBankers acceptances 180 days 40% 30%High grade commercial paper 270 days 25% 10%Negotiable certificates of deposit 5 years 30% NoneMedium term corporate notes 5 years 30% NoneMutual funds N/A 20% 10%Money market mutual funds N/A 20% 10%Mortgage pass-through securities 5 years 20% NoneCollateralized negotiable investments 5 years None NoneRepurchase agreements 92 days 20% NoneLAIF N/A None NoneLocal government investment pools N/A None None
The District complied with the provisions of California Government Code (or the District’s investment policy, where more restrictive) pertaining to the types of investments held, institutions in which deposits were made and security requirements. The District will continue to monitor compliance with applicable statutes pertaining to public deposits and investments.

SACRAMENTO METROPOLITAN FIRE DISTRICT
NOTES TO THE BASIC FINANCIAL STATEMENTS
June 30, 2011 and 2010
32
NOTE B–CASH AND INVESTMENTS (CONTINUED)
Interest rate risk: Interest rate risk is the risk that changes in market interest rates will adversely affect the fair value of an investment. Generally, the longer the maturity of an investment, the greater the sensitivity of its fair value to changes in market interest rates. Information about the sensitivity of the fair values of the District’s investments to market fluctuations is provided by the following table that shows the distribution of its investments by maturity:
Total12 Months Or
Less25 to 60 Months
Investment in Sacramento County PooledInvestment Fund 19,668,441$ 19,668,441$
Held by pension plan trusteeMoney market mutual funds 6,071 6,071 Mutual funds 5,539 5,539$
Held by pension bond trusteeMoney market mutual funds 7,766,897 7,766,897
Total at June 30, 2011 27,446,948$ 27,441,409$ 5,539$
Effective Duration
Credit risk: Generally, credit risk is the risk that an issuer of an investment will not fulfill its obligation to the holder of the instrument. This is measured by the assignment of a rating required by (where applicable) the California Government Code or the District’s Investment Policy, and the actual rating as of the year end for each investment type. Presented below is the minimum rating required by (where applicable) the California Government Code, and the actual rating as of year-end for each investment type.
Total
Minimum Legal Rating AAA Not Rated
Investment in Sacramento County PooledInvestment Fund 19,668,441$ N/A 19,668,441$
Held by pension plan trusteeMoney market mutual funds 6,071 N/A 6,071$ Mutual funds 5,539 N/A 5,539
Held by pension bond trusteeMoney market mutual funds 7,766,897 N/A 7,766,897
Total at June 30, 2011 27,446,948$ 7,772,968$ 19,673,980$
Ratings as of Year End
SACRAMENTO METROPOLITAN FIRE DISTRICT
NOTES TO THE BASIC FINANCIAL STATEMENTS
June 30, 2011 and 2010
33
NOTE B–CASH AND INVESTMENTS (CONTINUED)
Concentration of credit risk: The District had no investment policy limiting the amount that can be invested in any one issuer beyond that stipulated by the California Government Code. At June 30, 2011 and 2010, the District had no investments in one issuer (other than mutual funds and the Sacramento County Pooled Investment Fund) that represented 5% or more of total District investments.
Custodial credit risk: Custodial risk for deposits is the risk that, in the event of the failure of a depository financial institution, a government will not be able to recover its deposits or will not be able to recover collateral securities that are in the possession of an outside party. The California Government Code and the District’s investment policy do not contain legal or policy requirements that would limit the exposure to custodial credit risk for deposits, other than the following provision for deposits: The California Government Code requires that a financial institution secure deposits be made by state or local governmental units by pledging securities in an undivided collateral pool held by a depositary regulated under state law (unless so waived by the governmental unit). The market value of the pledged securities must be equal to at least 110% of the total amount deposited by the public agencies. California law also allows financial institutions to secure public agency deposits by pledging first trust deed mortgage notes having a value of 150% of the secured deposits.
At June 30, 2011, the carrying value of the District’s deposits was $182,745 and the balance in financial institutions was $305,355. Of the balance in financial institutions, $259,251 was covered by federal deposit insurance and $46,104 was uninsured, but collateralized. At June 30, 2010, the carrying value of the District’s deposits was $239,785 and the balance in financial institutions was $315,527. Of the balance in financial institutions, $254,034 was covered by federal deposit insurance and $61,493 was uninsured. State Law (Government Code Section 53630) requires that the uninsured amount be collateralized by the pledging financial institution with assets held in a common pool for the District and other governmental agencies, but not in the name of the District.
Investment in Sacramento County Pooled Investment Fund: The District’s investments in the Sacramento County pooled investment fund are stated at fair value or amortized cost, which approximates fair value. The total amount invested by all public agencies as of June 30, 2011 was $2,527,299,059 and as of June 30, 2010 was $2,463,940,790 and is managed by the Sacramento County Treasurer. Sacramento County does not invest in any derivative financial products directly. The Sacramento County Treasury Investment Oversight Committee (Committee) has oversight responsibility for Sacramento County’s cash and investment pool. The Committee consists of ten members as required by State law. The value of pooled shares in Sacramento County that may be withdrawn is determined on an amortized cost basis, which is different than the fair value of the District’s position in the pool.

SACRAMENTO METROPOLITAN FIRE DISTRICT
NOTES TO THE BASIC FINANCIAL STATEMENTS
June 30, 2011 and 2010
34
NOTE C–CAPITAL ASSETS
Capital asset activity for the years ended June 30, 2011 and 2010 was as follows:
Balance BalanceJuly 1, 2010 Additions Transfers Disposals June 30, 2011
Capital assets, not being depreciated:Land 22,000,942$ 2,717$ (51,300)$ 21,952,359$ Construction-in-progress 975,072 19,950,109 (542,772)$ 20,382,409 Total capital assets, not being depreciated 22,976,014 19,952,826 (542,772) (51,300) 42,334,768
Capital assets, being depreciated: Buildings and improvements 47,453,494 215,686 47,669,180 Equipment 48,648,350 621,562 542,772 (2,080,091) 47,732,593 Total capital assets, being depreciated 96,101,844 837,248 542,772 (2,080,091) 95,401,773
Less accumulated depreciation for:Buildings and improvements (13,652,587) (973,923) (14,626,510) Equipment (30,712,361) (2,889,952) 1,866,647 (31,735,666) Total accumulated depreciation (44,364,948) (3,863,875) 1,866,647 (46,362,176)
Total capital assets, being depreciated, net 51,736,896 (3,026,627) 542,772 (213,444) 49,039,597
Total capital assets for governmental activities 74,712,910$ 16,926,199$ -$ (264,744)$ 91,374,365$
Balance BalanceJuly 1, 2009 Additions Transfers Disposals June 30, 2010
Capital assets, not being depreciated:Land 22,095,142$ (94,200)$ 22,000,942$ Construction-in-progress 668,553 332,315$ (25,796)$ 975,072
Total capital assets, not being depreciated 22,763,695 332,315 (25,796) (94,200) 22,976,014
Capital assets, being depreciated: Buildings and improvements 47,567,821 139,756 24,142 (278,225) 47,453,494 Equipment 48,685,886 267,694 (305,230) 48,648,350
Total capital assets, being depreciated 96,253,707 407,450 24,142 (583,455) 96,101,844
Less accumulated depreciation for:Buildings and improvements (12,944,633) (982,826) 274,872 (13,652,587) Equipment (28,108,860) (2,857,746) 254,245 (30,712,361)
Total accumulated depreciation (41,053,493) (3,840,572) 529,117 (44,364,948)
Total capital assets, being depreciated, net 55,200,214 (3,433,122) 24,142 (54,338) 51,736,896
Total capital assets for governmental activities 77,963,909$ (3,100,807)$ (1,654)$ (148,538)$ 74,712,910$
Net depreciation expense of $3,863,875 and $3,840,572 was recorded for the years ended June 30, 2011 and 2010, respectively.

SACRAMENTO METROPOLITAN FIRE DISTRICT
NOTES TO THE BASIC FINANCIAL STATEMENTS
June 30, 2011 and 2010
35
NOTE D–RETIREMENT PLAN
Plan Descriptions: The District contributes to four defined benefit pension plans as follows:
The Safety Plan of the Sacramento Metropolitan Fire District (the Safety Plan), an agent multiple-employer defined benefit pension plan administered by the California Public Employees’ Retirement System (PERS).
The Miscellaneous Plan of the Sacramento Metropolitan Fire District (the Miscellaneous Plan), a cost-sharing multiple-employer defined benefit pension plan administered by PERS.
The Sacramento County Employees Retirement System Safety Tier 1 Plan (the SCERS Plan), a cost-sharing multiple-employer defined benefit pension plan administered by the County of Sacramento.
The Sacramento County Fire Protection District Pension Plan (the SCFPDP Plan), a single-employer defined benefit pension plan administered by U.S. Bank Institutional Financial Services.
Benefit provisions and all other requirements for PERS are established by State statute and benefit provisions and all other requirements for SCERS are established by Section 31584 of the County of the Sacramento Retirement Law of 1932. The establishment and amendment of specific benefit provisions of the plans are authorized by resolutions of the Board.
Each plan provides retirement and disability benefits, annual cost-of-living adjustments and death benefits to plan members and beneficiaries. PERS acts as a common investment and administrative agent for participating public entities within the State of California. All permanent and part-time employees working at least 1,000 hours per year are enrolled in PERS. Under PERS, benefits vest after five years of service. Upon retirement, participants are entitled to an annual retirement benefit, payable for life, in an amount equal to a benefit factor multiplied by their highest average monthly salary over 12 consecutive months of employment. Only the plans administered by PERS are open for new enrollment. The Miscellaneous Plan participates in the PERS Miscellaneous 3% at 60 Risk Pool. PERS issues publicly available financial reports for its plans. Copies of the PERS annual financial report and pertinent past trend information may be obtained from their Executive Office at 400 P Street, Sacramento, CA 95814. SCERS issues a publicly available financial report for its plans. Copies of the SCERS annual report may be obtained from their Executive Offices at 980 9th Street, Suite 1800, Sacramento, CA 95814.
The SCFPDP Plan is maintained by the District as a trust fund for one retired former employee and one surviving spouse of a retired employee. Benefits to participants are payable for life at a fixed monthly amount. Payments to a surviving spouse continue until the 120th month following the first payment to the retiree.

SACRAMENTO METROPOLITAN FIRE DISTRICT
NOTES TO THE BASIC FINANCIAL STATEMENTS
June 30, 2011 and 2010
36
NOTE D–RETIREMENT PLAN (CONTINUED)
Funding Policy: The District is required by statute to contribute the actuarially determined amounts necessary to fund the benefits for participants in each of its plans. The District’s policy is to pay the employees’ share of required contributions. Required contributions of active plan members and of the District were as follows:
2011 2010PERS Safety Plan:
Plan participants 9.00% 9.00%District
Rate 27.326% 25.715%Optional annual lump sum
prepayment 20,469,069$ 18,914,261$ See Annual Pension Cost and Net Pension Asset section for actual contributions
PERS Miscellaneous Plan:Plan participants 8.00% 8.00%District
Rate 13.179% 12.763%Optional annual lump sum prepayment 938,706$ 862,946$ Required contributions 1,357,490$ 1,325,140$ Contributions made 1,357,490$ 1,325,140$
SCERS Plan (Safety Tier 1):Plan participants 12.30% 12.16%District 49.86% 39.25%Required contributions 188,995$ 194,294$ Contributions made 188,995$ 194,294$
Fiscal Years Ended June 30,
Contribution rates and amounts for each plan are actuarially determined annually by the respective administrators. For the fiscal years ended June 30, 2011 and 2010, the District funded the lump sum prepayment amount for the employer portion of the plans administered by PERS. All other required contributions were made each pay period, based on required contribution rates.
Contribution rates for the Safety Plan are individually determined for the District by PERS. Contribution rates for the Miscellaneous Plan are determined with reference to the risk pool to which it belongs. Additionally, PERS manages a Side Fund for the Miscellaneous Plan, that was created at the time the District joined the plan, to reflect the difference between the funded status of the District’s plan and the funded status of the risk pool. The Side Fund is invested and is being amortized to reduce the normal required contributions.
Contribution rates and amounts for the SCERS Plan are determined annually by SCERS.
There are no active employees enrolled in the SCFPDP Plan. The one former retired employee took a lump-sum distribution in November, 2009, leaving one surviving spouse of a retired employee as the sole remaining participant in the SCFPDP Plan. No contributions were required or made during the year ending June 30 2010. The District made a $5,000 contribution to the SCFPDP Plan during the year ended June 30, 2011.

SACRAMENTO METROPOLITAN FIRE DISTRICT
NOTES TO THE BASIC FINANCIAL STATEMENTS
June 30, 2011 and 2010
37
NOTE D–RETIREMENT PLAN (CONTINUED)
Additional contributions will be made by the District as needed to fund the benefit payments to the sole remaining participant, which expire in December, 2012.
Annual Pension Cost and Net Pension Asset—PERS Safety Plan: For the PERS Safety Plan, the annual pension cost and net pension asset was as follows:
2011 2010
Annual required contribution (ARC) 26,146,048$ 24,852,574$ Less interest on net pension asset (4,581,049) (4,505,359) Plus amortization of pension asset 2,589,032 3,528,714 Annual pension cost 24,154,031 23,875,929 Contributions made 26,146,048 24,852,574 Increase in net pension asset 1,992,017 976,645 Net pension asset - beginning of year 59,110,313 58,133,668
Net pension asset - end of year 61,102,330$ 59,110,313$
Year ended June 30,
Fiscal Year Ending
Annual Pension
Cost (APC)
Percentage of APC
ContributedNet Pension
Asset
6/30/2009 19,890,410$ 105% 58,133,668$ 6/30/2010 23,875,929 104% 59,110,313 6/30/2011 24,154,031 108% 61,102,330
Three-year Trend Information for PERS Safety Plan
Since no activity occurred for the SCFPDP Plan other than interest earned on the trust account, the disclosures above were omitted for the SCFPDP Plan.
Funded Status and Funding Progress: As of June 30, 2010, the most recent actuarial valuation date, the Safety Plan was 80% funded. The actuarial liability for benefits was $757.9 million and the actuarial value of assets was $603.0 million, resulting in an unfunded actuarial accrued liability (UAAL) of $154.9 million. The covered payroll (annual payroll of active employees covered by the plan) was $62.7 million, and the ratio of the UAAL to the covered payroll was 247%.
The schedule of funding progress, presented as RSI below, presents multi-year trend information about whether the actuarial value of plan assets are increasing or decreasing over time relative to the actuarial accrued liability for benefits.

SACRAMENTO METROPOLITAN FIRE DISTRICT
NOTES TO THE BASIC FINANCIAL STATEMENTS
June 30, 2011 and 2010
38
NOTE D–RETIREMENT PLAN (CONTINUED)
Actuarial Methods and Assumptions: In the June 30, 2010 and 2009, actuarial valuation for the Safety Plan, the entry age normal cost method was used to determine the required contribution. The actuarial assumptions included (a) 7.75% investment rate of return (net of administrative expenses), (b) projected salary increases ranging from 3.55% to 13.15% depending on age, service and type of employment and (c) an inflation component of 3.0%, which is included in the salary increase assumptions. The actuarial value of assets was determined using techniques that spread the effects of short term volatility in the market value of investments over a 15-year period. The UAAL is being amortized as a level percentage of projected payroll on an open basis. The remaining rolling amortization period at June 30, 2010 and 2009, was 30 years.
Other Pension Assets: In addition to the Net Pension Asset with respect to the Safety Plan set forth in the Annual Pension Cost and Net Pension Asset section above, pension assets exist for the Miscellaneous Plan and SCERS Plan as follows:
2011 2010
Miscellaneous Plan 1,083,619$ 967,373$ SCERS Plan 10,221,980 9,168,298
11,305,599$ 10,135,671$
Actuarial Valuation
Date
Actuarial Value of Assets
(a)
Actuarial Accrued Liability (AAL)
-Entry Age(b)
Unfunded AAL
(UAAL)(b-a)
Funded Ratio(a/b)
Covered Payroll
(c)
UAAL as aPercentageof Covered
Payroll[(b-a)/c]
6/30/2005 420,950,938$ 453,098,511$ 32,147,573$ 93% 57,413,898$ 56%6/30/2006 456,310,774 506,081,753 49,770,979 90% 61,503,795 81%6/30/2007 501,988,835 599,888,655 97,899,820 84% 69,364,626 141%6/30/2008 542,351,006 664,882,903 122,531,897 82% 70,203,763 175%6/30/2009 570,524,919 720,740,716 150,215,997 79% 68,303,685 220%6/30/2010 603,000,919 757,949,033 154,948,114 80% 62,741,464 247%
REQUIRED SUPPLEMENTARY INFORMATIONSchedule of Funding Progress for the PERS Safety Plan

SACRAMENTO METROPOLITAN FIRE DISTRICT
NOTES TO THE BASIC FINANCIAL STATEMENTS
June 30, 2011 and 2010
39
NOTE E–LONG-TERM LIABILITIES
The following is a summary of long-term obligation transactions for the years ended June 30, 2011 and 2010.
Amounts Due Balance Balance within One
July 1, 2010 Additions Repayments June 30, 2011 Year
Pension bonds payable 69,810,255$ 897,345$ (1,225,000)$ 69,482,600$ 1,420,000$ Note payable 85,184 (10,675) 74,509 11,419 Compensated absences 15,876,431 535,663 16,412,094 4,740,990 Capital lease 11,225,914 11,225,914 1,150,189 Workers compensation liability 15,898,999 4,912,549 (2,891,754) 17,919,794 3,602,925 Liability for other
post-employment benefits 27,114,162 15,626,819 (5,600,196) 37,140,785
128,785,031$ 33,198,290$ (9,727,625)$ 152,255,696$ 10,925,523$
Amounts Due Balance Balance within One
July 1, 2009 Additions Repayments June 30, 2010 Year
Pension bonds payable 69,995,340$ 849,915$ (1,035,000)$ 69,810,255$ 1,225,000$ Note payable 95,165 (9,981) 85,184 10,676 Compensated absences 17,131,840 (1,255,409) 15,876,431 4,917,909 Workers compensation liability 14,341,379 3,770,714 (2,213,094) 15,898,999 3,768,063 Liability for other
post-employment benefits 13,886,293 17,889,926 (4,662,057) 27,114,162
115,450,017$ 22,510,555$ (9,175,541)$ 128,785,031$ 9,921,648$
Pension Bonds Payable: In October 2004, the District issued pension obligation bonds in the original amount of $69,998,975. The proceeds were used to reduce the unfunded actuarial liabilities in three of its pension plans. The bonds were issued in four series and bear interest at rates of 4.79% to 5.51%. Three series require semi-annual payments of interest. The remaining series accretes interest, which results in increases to principal, until November 15, 2018. Principal repayments, which are made annually, began May 15, 2005 for one series, and begin May 15, 2020, 2026 and 2031 for the other three series, respectively. The interest rates for two of the series change to auction rate as of November 15, 2018 and 2025, respectively. The bonds mature at various dates from May 15, 2019 to 2034. In the following maturity schedule, an interest rate of 5% is assumed at the point in time where the rates change to auction rates.

SACRAMENTO METROPOLITAN FIRE DISTRICT
NOTES TO THE BASIC FINANCIAL STATEMENTS
June 30, 2011 and 2010
40
NOTE E–LONG-TERM LIABILITIES (CONTINUED)
At June 30, 2011, pension bonds payable maturities based on the fully accreted amounts are as follows:
Year ended June 30, Principal Interest Total
2012 1,420,000$ 2,711,785$ 4,131,785$ 2013 1,635,000 2,643,767 4,278,767 2014 1,860,000 2,565,450 4,425,450 2015 2,105,000 2,476,357 4,581,357 2016 2,365,000 2,375,527 4,740,527
2017-2021 12,725,000 13,214,569 25,939,569 2022-2026 13,360,000 13,119,526 26,479,526 2027-2031 22,600,000 8,613,750 31,213,750 2032-2034 19,950,000 2,058,750 22,008,750
78,020,000$ 49,779,481$ 127,799,481$
Note Payable: The District is obligated under a loan evidenced by a note payable secured by a deed of trust on one of its fire stations. The loan bears interest at 6.75% and matures January 28, 2017. Monthly principal and interest payments of $1,342 are required.
At June 30, 2011, the note payable maturities are as follows:
Year ended June 30, Principal Interest Total
2012 11,419$ 4,680$ 16,099$ 2013 12,214 3,885 16,099 2014 13,065 3,035 16,100 2015 13,974 2,125 16,099 2016 14,948 1,152 16,100 2017 8,889 196 9,085
74,509$ 15,073$ 89,582$
This note payable was paid in full in November, 2011. (See Note L.)

SACRAMENTO METROPOLITAN FIRE DISTRICT
NOTES TO THE BASIC FINANCIAL STATEMENTS
June 30, 2011 and 2010
41
NOTE E–LONG-TERM LIABILITIES (CONTINUED)
Capital Lease Obligation: The District leased equipment under capital leases which have yearly payments of $1,122,164 through September 27, 2020 and $340,008 through September 27, 2015, including interest at 2.88% and 2.17%, respectively. Fixed assets acquired under the capital leases consist of equipment totaling $11,225,913. There was no accumulated depreciation at June 30, 2011 because the assets were not yet placed into service. As of June 30, 2011, future minimum lease payments under the capital lease obligation are as follows:
Fiscal Year Ending June, 30:2012 1,462,172$ 2013 1,462,1722014 1,462,1722015 1,462,1722016 1,462,1722017-2021 5,610,820 Total payments 12,921,680 Less: amounts representing interest (1,695,766)
Net present value of future minimum lease payments 11,225,914$
NOTE F—INSURANCE
The District is a member of the Special District Risk Management Authority (SDRMA). The SDRMA is a risk-pooling self-insurance authority, created under the provisions of the California Government Code Sections 6500 et. seq. The purpose of the SDRMA is to provide a full risk management program for California local governments.
The District pays an annual premium to SDRMA for general and auto liability, errors and omissions, property, boiler and machinery and employee dishonesty insurance coverage. The District annual premium is based on its pro-rata share of charges for the pooled risk, claims adjusting and legal costs, and administrative and other costs to operate the SDRMA. Aviation insurance continues to be covered through a commercial insurer.
The District’s deductible and coverage are as follows:
Coverage SDRMA Deductible
General and auto liability(includes errors and omissions) 10,000,000$ $ 500 to $25,000
Property damage 1,000,000,000 2,000 Boiler and machinery 100,000,000 1,000 Employee dishonesty 400,000 25,000
The District is self-insured for all losses from workers compensation claims from 2003, when it terminated its excess liability insurance coverage until 2009. Beginning in 2010, the District obtained excess Commercial coverage for the first $1,000,000 of losses in excess of $2,500,000, for each claim. Claims expenditures and

SACRAMENTO METROPOLITAN FIRE DISTRICT
NOTES TO THE BASIC FINANCIAL STATEMENTS
June 30, 2011 and 2010
42
NOTE F–INSURANCE (CONTINUED)
liabilities are reported when it is probable that a loss has occurred and the amount of that loss can be reasonably estimated. The liability for claims is based on historical cost and/or actuarial estimates of the amounts needed to pay prior and current year claims, and to allow the accrual of estimated incurred but not reported claims and incremental claims expense. Changes in the District’s claims liability for the fiscal years ended June 30, 2011 and 2010 are as follows:
Fiscal year
ending June 30
Beginning of Fiscal Year
Liability
Current Claims and Changes in
Prior Estimates
Payments on Claims
End of Fiscal Year Liability
2010 14,341,379$ 3,770,714$ (2,213,094)$ 15,898,999$ 2011 15,898,999 4,912,549 (2,891,754) 17,919,794
NOTE G—OTHER POST-EMPLOYMENT BENEFITS
Plan Description: The Sacramento Metropolitan Fire District Retiree Healthcare Plan (“Plan”) is a single-employer defined benefit healthcare plan administered by the District. The Plan provides healthcare benefits to eligible retirees and their dependents through the California Public Employees’ Retirement System healthcare program (PEMHCA). Benefit provisions are established and may be amended through agreements and memorandums of understanding between the District, its non-represented employees and the unions representing District employees. The Retiree Healthcare Plan does not issue financial statements.
The District provides a retiree medical contribution for employees who retire directly from the District under CalPERS. The District contribution is capped at the greater of the non-Medicare eligible Blue Shield and Kaiser family premiums ($1,584 for 2011 and $1,501 for 2010). The benefit continues to surviving spouses and dependents. Since PEMHCA is a community-rated plan, an implied subsidy is not valued under GASB 45.
The District also provides subsidy/offset payments for certain retirees receiving benefits through the Sacramento Employees Retirement System. The benefit continues at 50% for surviving spouses of retirees. For the fiscal years 2011 and 2010, the amount of the retiree subsidy/offset ranged from $128 to $256 depending on the length of service.
Funding Policy: The contribution requirements of the Plan participants and the District are established by and may be amended by the District pursuant to agreements with its non-represented employees and the unions representing District employees. The District contributed $5,600,196 and $4,662,057 during the years ended June 30, 2011 and 2010, respectively, on a pay-as-you go basis for current benefit payments. Retired plan members and their beneficiaries pay the annual premium cost not paid by the employer.
Annual OPEB Cost and Net OPEB Obligation: The District’s annual other post-employment benefit cost (expense) is calculated based on the annual required contribution (ARC) of the employer. The ARC represents a level of funding that, if paid on an ongoing basis, is projected to cover the normal cost each year and amortize any unfunded actuarial liabilities (or funding excess) over a period not to exceed 30 years.

SACRAMENTO METROPOLITAN FIRE DISTRICT
NOTES TO THE BASIC FINANCIAL STATEMENTS
June 30, 2011 and 2010
43
NOTE G—OTHER POST-EMPLOYMENT BENEFITS (CONTINUED)
The following table shows the components of the District’s annual OPEB cost for the year, the amount actually contributed to the Plan, and changes in the District’s Net OPEB obligation:
2011 2010
Annual required contribution $ 15,591,519 $ 18,316,000 Interest on net OPEB obligation 1,220,137 624,883 Adjustment to annual required contribution (1,184,837) (1,050,957)Annual OPEB cost (expense) 15,626,819 17,889,926 Contributions made (premium payments made) (5,600,196) (4,662,057)Increase in net OPEB obligation 10,026,623 13,227,869 Net OPEB obligation, beginning of year 27,114,162 13,886,293
Net OPEB obligation, end of year $ 37,140,785 $ 27,114,162
The OPEB obligation will be increased prospectively to the actuarial accrued liability amount. The District’s annual OPEB cost, the percentage of annual OPEB cost contributed to the Plan, and the net OPEB obligation for fiscal year 2011 and the two preceding fiscal years were as follows:
Percentage of Net
Fiscal Year Annual Annual OPEB OPEB Ended OPEB Cost Cost Contributed Obligation
6/30/2009 18,331,000$ 24.20% 13,886,293$ 6/30/2010 17,889,926 26.06% 27,114,162 6/30/2011 15,626,819 35.84% 37,140,785
Funded Status and Funding Progress: The funded status of the Plan as of June 30, 2011, the Plan’s most recent actuarial valuation date, was as follows:
Actuarial accrued liability (AAL) $ 225,418,331 Actuarial value of Plan assets -
Unfunded actuarial accrued liability (UAAL) 225,418,331 Funded ratio (actuarial value of Plan assets/AAL) 0%Covered payroll (active Plan participants) 48,543,708 UAAL as a percentage of covered payroll 464.36%

SACRAMENTO METROPOLITAN FIRE DISTRICT
NOTES TO THE BASIC FINANCIAL STATEMENTS
June 30, 2011 and 2010
44
NOTE G—OTHER POST-EMPLOYMENT BENEFITS (CONTINUED)
Actuarial valuations of an ongoing plan involve estimates of the value of expected benefit payments and assumptions about the probability of occurrence of events far into the future. Examples include assumptions about future employment, mortality, and the healthcare cost trend. Amounts determined regarding the funded status of the plan and the annual required contributions of the employer are subject to continual revision as actual results are compared with past expectations and new estimates are made about the future. The schedule of funding progress, presented as required supplementary information following the notes to the financial statements, presents multi-year trend information about whether the actuarial value of plan assets is increasing or decreasing over time relative to the actuarial accrued liabilities for benefits.
Actuarial Methods and Assumptions: Projections of benefits for financial reporting purposes are based on the substantive plan (the plan as understood by the employer and the plan participants) and include the types of benefits provided at the time of each valuation and the historical pattern of sharing of benefit costs between the employer and plan participants to that point. The actuarial methods and assumptions used include techniques that are designed to reduce the effects of short-term volatility in actuarial accrued liabilities and the actuarial value of assets, consistent with the long-term perspective of the calculations.
For the June 30, 2011 actuarial valuation, the entry age normal actuarial cost method was used. The actuarial assumptions included a 4.5% investment rate of return (net of administrative expenses) and a 3.25% increase in salaries. Premiums were assumed to increase from 9% in 2012, grading down to 4.5% for 2019 and thereafter. The initial UAAL was amortized as a level percentage of projected payroll over a fixed 28-year period as of June 30, 2011.
Actuarial Value of Assets
Actuarial Accrued Liability
Unfunded Actuarial Accrued Liability
Funded Ratio
Covered Payroll
UAAL as a Percentage of
Covered Payroll
(a) (b) (b-a) (a/b) (c) ((b-a)/c)
6/30/2009 $ - $ 194,809,000 $ 194,809,000 0% $ 66,540,000 292.08%6/30/2011 $ - $ 225,418,331 $ 225,418,331 0% $ 48,543,708 464.36%
Required Supplementary InformationOther Postemployment Benefits Plan
Schedule of Funding Progress
Actuarial Valuation
Date
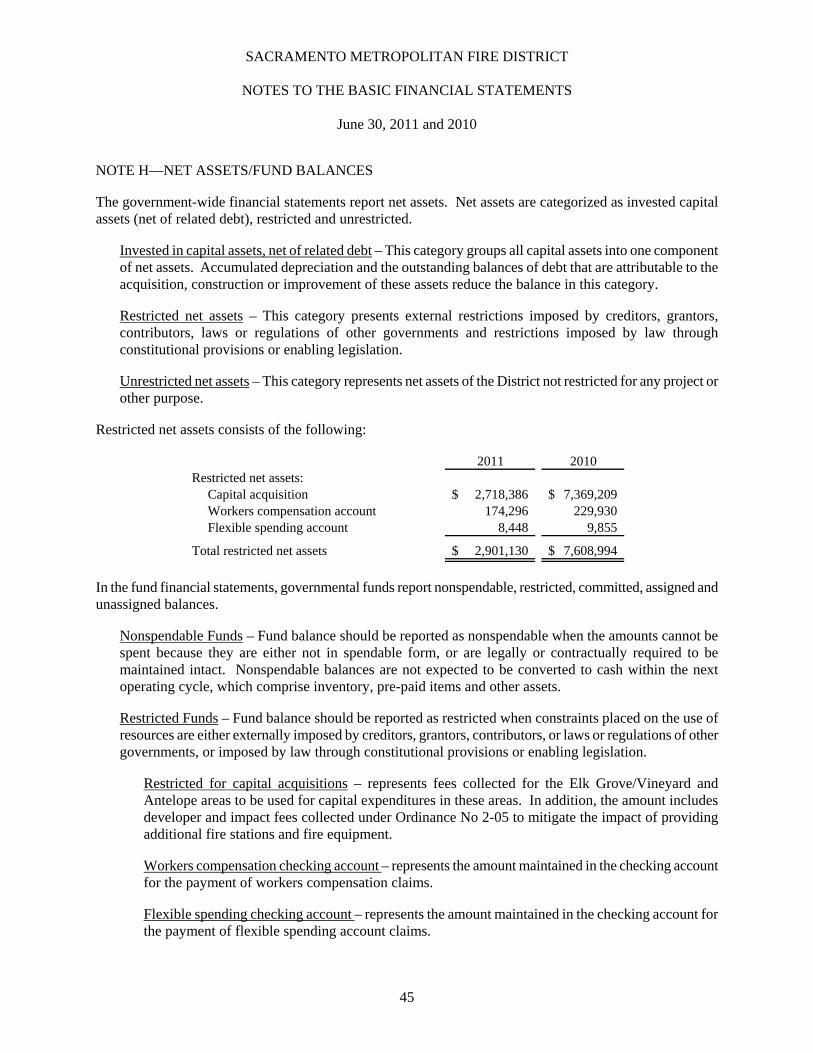
SACRAMENTO METROPOLITAN FIRE DISTRICT
NOTES TO THE BASIC FINANCIAL STATEMENTS
June 30, 2011 and 2010
45
NOTE H—NET ASSETS/FUND BALANCES
The government-wide financial statements report net assets. Net assets are categorized as invested capital assets (net of related debt), restricted and unrestricted.
Invested in capital assets, net of related debt – This category groups all capital assets into one component of net assets. Accumulated depreciation and the outstanding balances of debt that are attributable to the acquisition, construction or improvement of these assets reduce the balance in this category.
Restricted net assets – This category presents external restrictions imposed by creditors, grantors, contributors, laws or regulations of other governments and restrictions imposed by law through constitutional provisions or enabling legislation.
Unrestricted net assets – This category represents net assets of the District not restricted for any project or other purpose.
Restricted net assets consists of the following:
2011 2010Restricted net assets:
Capital acquisition 2,718,386$ 7,369,209$ Workers compensation account 174,296 229,930 Flexible spending account 8,448 9,855
Total restricted net assets 2,901,130$ 7,608,994$
In the fund financial statements, governmental funds report nonspendable, restricted, committed, assigned and unassigned balances.
Nonspendable Funds – Fund balance should be reported as nonspendable when the amounts cannot be spent because they are either not in spendable form, or are legally or contractually required to be maintained intact. Nonspendable balances are not expected to be converted to cash within the next operating cycle, which comprise inventory, pre-paid items and other assets.
Restricted Funds – Fund balance should be reported as restricted when constraints placed on the use of resources are either externally imposed by creditors, grantors, contributors, or laws or regulations of other governments, or imposed by law through constitutional provisions or enabling legislation.
Restricted for capital acquisitions – represents fees collected for the Elk Grove/Vineyard and Antelope areas to be used for capital expenditures in these areas. In addition, the amount includes developer and impact fees collected under Ordinance No 2-05 to mitigate the impact of providing additional fire stations and fire equipment.
Workers compensation checking account – represents the amount maintained in the checking account for the payment of workers compensation claims.
Flexible spending checking account – represents the amount maintained in the checking account for the payment of flexible spending account claims.

SACRAMENTO METROPOLITAN FIRE DISTRICT
NOTES TO THE BASIC FINANCIAL STATEMENTS
June 30, 2011 and 2010
46
NOTE H—NET ASSETS/FUND BALANCES (CONTINUED)
Committed Funds – Fund balance should be reported as committed when the amounts can only be used for specific purposes pursuant to constraints imposed by formal action of the government’s highest level of decision-making authority. These amounts cannot be used for any other purpose unless the government’s Board of Directors modifies, or removes the fund balance commitment.
Workers compensation claims – represents the amount recommended for contingency reserves in the actuarial reports.
Deferred compensation administration – to provide for the costs of administering the deferred compensation program.
Other post-employment benefits – to set aside amounts for payment of future post-employment benefits.
Pension bond retirement – to set aside amounts for the retirement of the pension bonds prior to their repricing at auction rates in 2018 and 2025.
Assigned Funds – Fund balance should be reported as assigned when the amounts are constrained by the government’s intent to be used for specific purposes, but are neither restricted nor committed.
Unassigned Funds – Unassigned fund balance is the residual classification of the District’s funds and includes all spendable amounts that have not been restricted, committed, or assigned to specific purposes.
Although the Board has established a contingency reserve for unanticipated or extraordinary expenditures at a minimum of five percent of the General Operating Budget Expenditures, this reserve does not meet the definition of a committed fund balance.

SACRAMENTO METROPOLITAN FIRE DISTRICT
NOTES TO THE BASIC FINANCIAL STATEMENTS
June 30, 2011 and 2010
47
NOTE H—NET ASSETS/FUND BALANCES (CONTINUED)
The following are components of fund balances:
2011 2010
Nonspendable:Inventory 2,742,172$ 2,331,265$ Prepaid expenses and other assets 123,123 39,143 Petty cash 500 500
2,865,795 2,370,908
Restricted for:Capital acquisition 2,718,386 7,369,209
174,296 229,930 Flexible spending account 8,448 9,855
2,901,130 7,608,994
Committed for: Workers compensation claims 4,000,000 4,000,000 Deferred compensation 103,990 86,300 Other post-employment benefits 1,750,770 5,662,885 Pension bond retirement 7,766,882 9,354,126
13,621,642 19,103,311
Unassigned 7,469,638 12,516,301
26,858,205$ 41,599,514$
Workers compensation account
Total nonspendable fund balance
Total restricted fund balance
Total committed fund balance
Total fund balance
NOTE I–LEASES
The District leases office space and equipment under various non-cancelable operating leases that expire from August, 2011 to May, 2012. As of June 30, 2011, the future minimum non-cancelable operating lease payments are as follows:
Payments
4,686$
4,686$
Year ending June 30
2012
Total rental payments for operating leases recorded in the general fund for the years ended June 30, 2011 and 2010, were $94,260 and $84,487, respectively.

SACRAMENTO METROPOLITAN FIRE DISTRICT
NOTES TO THE BASIC FINANCIAL STATEMENTS
June 30, 2011 and 2010
48
NOTE J – COMMITMENTS AND CONTINGENCIES
Commitments: The District has several outstanding purchase commitments as of June 30, 2011 totaling $880,589. Unexpended amounts on contracts related to the training center project totaled $367,581 at June 30, 2011.
Claims: The District is a defendant in a number of lawsuits, which have arisen in the normal course of business. While substantial damages are alleged in some of these actions, their outcome cannot be predicted with certainty. In the opinion of Management and the legal counsel, these actions, when finally adjudicated will not have a material adverse effect on the financial position of the District.
NOTE K – BORROWINGS
The District has borrowings available from the County of Sacramento equal to 85% of estimated tax revenues for July 1 to December 10 and 42.50% of estimated revenues for December 10 to April 10. These borrowings are permitted until the last Monday of April each year. The amount available as of June 30, 2011 is $54,037,454. The interest rate charged is the rate earned by the County investment pool.
NOTE L – SUBSEQUENT EVENTS
On July 27, 2011, the District signed a lease with Sutter Health for a base rent of $743,544 annually, expected to begin January 1, 2012, for 63 months for a portion of the Armstrong building. The base rent will increase by 3% per year.
On November 15, 2011, the District sold its Lease Revenue Bonds at an average interest rate of 4.89% with a face value of $12,960,000, of which $11,786,000 is available to replenish reserves for the headquarters building fund, building improvements, purchase of firefighting and computer equipment and to pay off the note payable of $74,009. The debt service on the bonds is $1,322,000 per year until May 15, 2016 and then drops to $675,000 per year until 2041. Standard & Poor’s Rating Agency rated the bonds at AA-. The District estimates that $10.4 million of the proceeds has been spent and the remaining $2.7 million will be drawn down as expenditures are incurred.
On December 19, 2011, the District entered into a ground lease agreement with the California Fire and Rescue Training Authority (CFRTA) whereby the District will lease eight and one quarter acres of land to CFRTA within the property owned by the District for 55 years at a minimum rental fee of $30,000 per year, to be increased by $10,000 per year upon additional agencies joining CFRTA. In addition, the CFRTA reimbursed the District $1,521,794, received upon the signing of the lease on December 19, 2011, for costs incurred in the planning, design and construction of the civil work on the leased property.
On December 8, 2011, the Board approved executing an agreement for the development and construction of an emergency management and Homeland Security simulator to be funded with a grant from the California Emergency Management Agency of up to $4 million.

SACRAMENTO METROPOLITAN FIRE DISTRICT
NOTES TO THE BASIC FINANCIAL STATEMENTS
June 30, 2011 and 2010
49
NOTE M– RECONCILIATION OF GOVERNMENT-WIDE AND FUND FINANCIAL STATEMENTS
Amounts reported for governmental activities in the governmental funds balance sheet are being adjusted to arrive at the statement of net assets. The adjustments are as follows:
2011 2010
Fund balances - Total Governmental Funds 26,858,205$ 41,599,514$
When capital assets that are to be used in governmental activities are purchased orconstructed, the costs of those assets are reported as expenditures in governmentalfunds. However, the statement of net assets includes those capital assets amongthe assets of the District as a whole. 91,374,365 74,712,910
Pension asset of the governmental activities is not a financial resource and,therefore, is not reported in the funds. 72,407,929 69,245,984
Governmental funds report debt issuance costs (deferred charges) as part of debtservice expenditures, whereas these amounts are deferred and amortized in theGovernment-wide Statement of Activities. 453,007 487,854
Certain receivables are not available to pay current period expenditures andtherefore are deferred in the governmental funds. 4,878,945 6,912,280
Long-term liabilities applicable to the District's governmental activities are notdue and payable in the current period and accordingly are not reported as fundliabilities. All liabilities, both current and long-term, are reported in the statementof net assets.
Pension bonds payable (69,482,600) (69,810,255) Note payable (74,509) (85,184) Compensated absences (16,224,232) (15,647,878) Interest payable on long-term debt (689,792) (456,958) Workers compensation liability (17,765,027) (15,772,968) Liability for other post-employment benefits (37,140,785) (27,114,162) Capital lease (11,225,914)
(152,602,859) (128,887,405)
NET ASSETS OF GOVERNMENTAL ACTIVITIES 43,369,592$ 64,071,137$

SACRAMENTO METROPOLITAN FIRE DISTRICT
NOTES TO THE BASIC FINANCIAL STATEMENTS
June 30, 2011 and 2010
50
NOTE M– RECONCILIATION OF GOVERNMENT-WIDE AND FUND FINANCIAL STATEMENTS (CONTINUED)
Amounts reported for governmental activities in the Governmental Fund Statement of Revenues, Expenditures, and Changes in Fund Balances are adjusted to arrive at the Statement of Activities for Government-wide presentation. The adjustments are as follows:
2011 2010
Net Change in Fund Balance - Total Governmental Funds (14,741,309)$ (172,722)$
Governmental funds report capital outlay as expenditures. However, in theGovernment-wide Statement of Activities the cost of those assets when completedis allocated over their estimated useful lives as depreciation expense.
Cost of assets capitalized 20,790,074 739,765 Depreciation expense (3,863,875) (3,840,572)
In the Government-wide Statement of Activities, only the gain or (loss) on thesale of capital assets is reported, whereas in the governmental funds, proceedsfrom sales increase financial resources.
Proceeds from sale (133,168) (631,008) Gain (loss) on disposal of assets (131,576) 505,604
Debt proceeds provide current financial resources to governmental funds, butissuing debt increases long-term liabilities in the Government-wide Statement ofNet Assets. Repayment of principal is an expenditure in the governmental funds,but the repayment reduces long-term liabilities in the Statement of Net Assetsprincipal payments on long-term debt.
Principal payments 1,235,675 1,044,981Bond accretion (897,345) (849,915) Proceeds from capital lease (11,225,914)
Governmental funds report debt issuance costs (deferred charges) as currentexpenditures, whereas these costs are deferred and amortized in the Government-wide Statement of Activities. This is the amount of issuance costs, net ofamortization. (34,847) (34,847)
Worker's compensation claims that are estimated to have been incurred and notreported (IBNR) do not require the use of current financial resources andtherefore are not reported as expenditures in governmental funds. This amountrepresents the net change in the Worker's Compensation IBNR liability. (1,992,059) (1,647,189)
Some expenses reported in the Government-wide Statement of Activities do notrequire the use of current financial resources and therefore are not expenditures inthe governmental funds.
Change in accrued interest payable (232,834) 344 Change in compensated absences (576,354) 1,393,797Change in other post-employment benefits liability (10,026,623) (13,227,869)
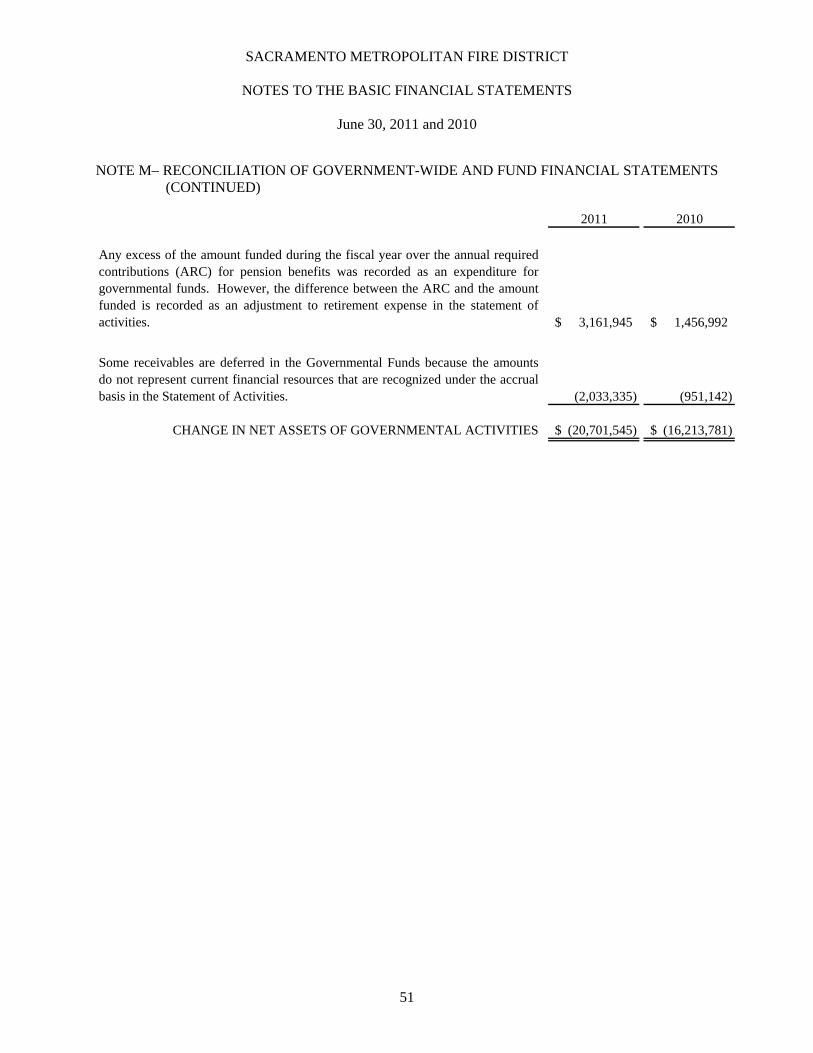
SACRAMENTO METROPOLITAN FIRE DISTRICT
NOTES TO THE BASIC FINANCIAL STATEMENTS
June 30, 2011 and 2010
51
NOTE M– RECONCILIATION OF GOVERNMENT-WIDE AND FUND FINANCIAL STATEMENTS (CONTINUED)
2011 2010
Any excess of the amount funded during the fiscal year over the annual requiredcontributions (ARC) for pension benefits was recorded as an expenditure forgovernmental funds. However, the difference between the ARC and the amountfunded is recorded as an adjustment to retirement expense in the statement ofactivities. 3,161,945$ 1,456,992$
Some receivables are deferred in the Governmental Funds because the amountsdo not represent current financial resources that are recognized under the accrualbasis in the Statement of Activities. (2,033,335) (951,142)
CHANGE IN NET ASSETS OF GOVERNMENTAL ACTIVITIES (20,701,545)$ (16,213,781)$