SACOMBANK (STB VN) · Page 2 SACOMBANK Source: Bloomberg, Yuanta Vietnam Research estimates Key...
26
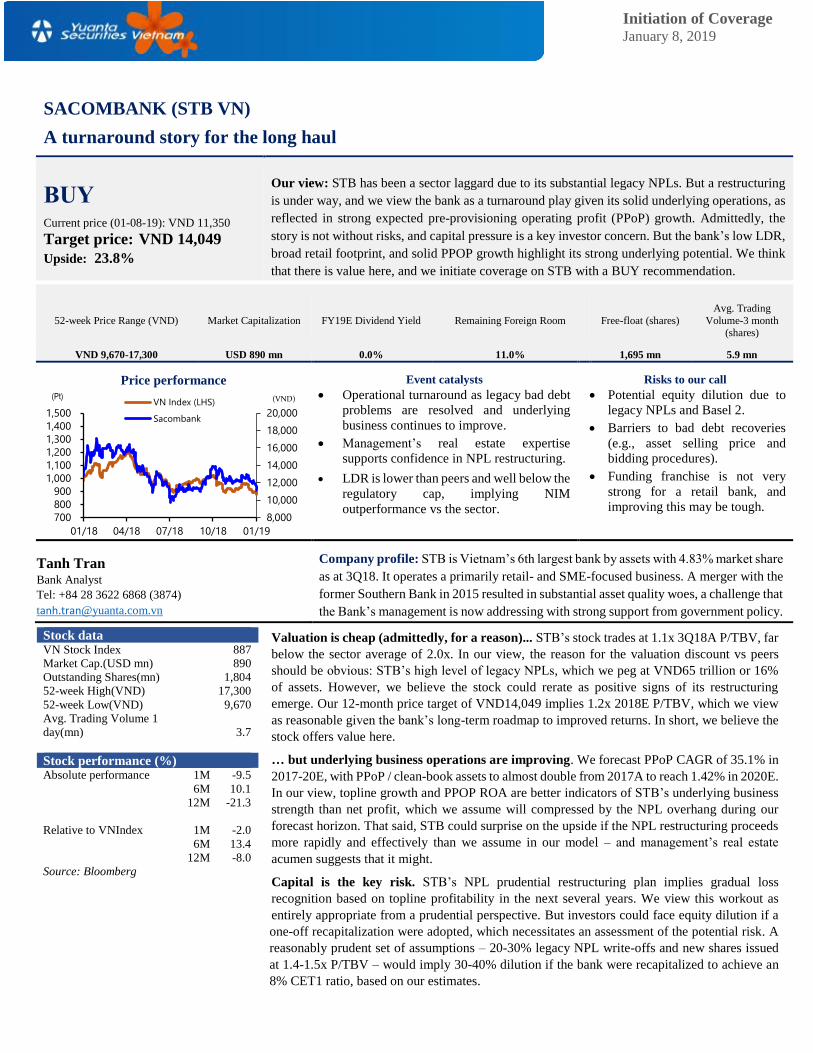
Initiation of Coverage January 8, 2019 SACOMBANK (STB VN) A turnaround story for the long haul BUY Current price (01-08-19): VND 11,350 Target price: VND 14,049 Upside: 23.8% Our view: STB has been a sector laggard due to its substantial legacy NPLs. But a restructuring is under way, and we view the bank as a turnaround play given its solid underlying operations, as reflected in strong expected pre-provisioning operating profit (PPoP) growth. Admittedly, the story is not without risks, and capital pressure is a key investor concern. But the bank’s low LDR, broad retail footprint, and solid PPOP growth highlight its strong underlying potential. We think that there is value here, and we initiate coverage on STB with a BUY recommendation. 52-week Price Range (VND) Market Capitalization FY19E Dividend Yield Remaining Foreign Room Free-float (shares) Avg. Trading Volume-3 month (shares) VND 9,670-17,300 USD 890 mn 0.0% 11.0% 1,695 mn 5.9 mn Price performance Event catalysts Operational turnaround as legacy bad debt problems are resolved and underlying business continues to improve. Management’s real estate expertise supports confidence in NPL restructuring. LDR is lower than peers and well below the regulatory cap, implying NIM outperformance vs the sector. Risks to our call Potential equity dilution due to legacy NPLs and Basel 2. Barriers to bad debt recoveries (e.g., asset selling price and bidding procedures). Funding franchise is not very strong for a retail bank, and improving this may be tough. Tanh Tran Bank Analyst Tel: +84 28 3622 6868 (3874) tanh.tran@yuanta.com.vn Company profile: STB is Vietnam’s 6th largest bank by assets with 4.83% market share as at 3Q18. It operates a primarily retail- and SME-focused business. A merger with the former Southern Bank in 2015 resulted in substantial asset quality woes, a challenge that the Bank’s management is now addressing with strong support from government policy. Valuation is cheap (admittedly, for a reason)... STB’s stock trades at 1.1x 3Q18A P/TBV, far below the sector average of 2.0x. In our view, the reason for the valuation discount vs peers should be obvious: STB’s high level of legacy NPLs, which we peg at VND65 trillion or 16% of assets. However, we believe the stock could rerate as positive signs of its restructuring emerge. Our 12-month price target of VND14,049 implies 1.2x 2018E P/TBV, which we view as reasonable given the bank’s long-term roadmap to improved returns. In short, we believe the stock offers value here. … but underlying business operations are improving. We forecast PPoP CAGR of 35.1% in 2017-20E, with PPoP / clean-book assets to almost double from 2017A to reach 1.42% in 2020E. In our view, topline growth and PPOP ROA are better indicators of STB’s underlying business strength than net profit, which we assume will compressed by the NPL overhang during our forecast horizon. That said, STB could surprise on the upside if the NPL restructuring proceeds more rapidly and effectively than we assume in our model – and management’s real estate acumen suggests that it might. Capital is the key risk. STB’s NPL prudential restructuring plan implies gradual loss recognition based on topline profitability in the next several years. We view this workout as entirely appropriate from a prudential perspective. But investors could face equity dilution if a one-off recapitalization were adopted, which necessitates an assessment of the potential risk. A reasonably prudent set of assumptions – 20-30% legacy NPL write-offs and new shares issued at 1.4-1.5x P/TBV – would imply 30-40% dilution if the bank were recapitalized to achieve an 8% CET1 ratio, based on our estimates. 8,000 10,000 12,000 14,000 16,000 18,000 20,000 700 800 900 1,000 1,100 1,200 1,300 1,400 1,500 01/18 04/18 07/18 10/18 01/19 VN Index (LHS) Sacombank (VND) (Pt) Stock data VN Stock Index 887 Market Cap.(USD mn) 890 Outstanding Shares(mn) 1,804 52-week High(VND) 17,300 52-week Low(VND) 9,670 Avg. Trading Volume 1 day(mn) 3.7 Stock performance (%) Absolute performance 1M -9.5 6M 10.1 12M -21.3 Relative to VNIndex 1M -2.0 6M 13.4 12M -8.0 Source: Bloomberg
Transcript of SACOMBANK (STB VN) · Page 2 SACOMBANK Source: Bloomberg, Yuanta Vietnam Research estimates Key...
Initiation of Coverage January 8, 2019
SACOMBANK (STB VN)
A turnaround story for the long haul
BUY Current price (01-08-19): VND 11,350
Target price: VND 14,049
Upside: 23.8%
Our view: STB has been a sector laggard due to its substantial legacy NPLs. But a restructuring
is under way, and we view the bank as a turnaround play given its solid underlying operations, as
reflected in strong expected pre-provisioning operating profit (PPoP) growth. Admittedly, the
story is not without risks, and capital pressure is a key investor concern. But the bank’s low LDR,
broad retail footprint, and solid PPOP growth highlight its strong underlying potential. We think
that there is value here, and we initiate coverage on STB with a BUY recommendation.
52-week Price Range (VND) Market Capitalization FY19E Dividend Yield Remaining Foreign Room Free-float (shares)
Avg. Trading
Volume-3 month (shares)
VND 9,670-17,300 USD 890 mn 0.0% 11.0% 1,695 mn 5.9 mn
Price performance
Event catalysts
Operational turnaround as legacy bad debt
problems are resolved and underlying
business continues to improve.
Management’s real estate expertise
supports confidence in NPL restructuring.
LDR is lower than peers and well below the
regulatory cap, implying NIM
outperformance vs the sector.
Risks to our call
Potential equity dilution due to
legacy NPLs and Basel 2.
Barriers to bad debt recoveries
(e.g., asset selling price and
bidding procedures).
Funding franchise is not very
strong for a retail bank, and
improving this may be tough.
Tanh Tran Bank Analyst
Tel: +84 28 3622 6868 (3874)
Company profile: STB is Vietnam’s 6th largest bank by assets with 4.83% market share
as at 3Q18. It operates a primarily retail- and SME-focused business. A merger with the
former Southern Bank in 2015 resulted in substantial asset quality woes, a challenge that
the Bank’s management is now addressing with strong support from government policy.
Valuation is cheap (admittedly, for a reason)... STB’s stock trades at 1.1x 3Q18A P/TBV, far
below the sector average of 2.0x. In our view, the reason for the valuation discount vs peers
should be obvious: STB’s high level of legacy NPLs, which we peg at VND65 trillion or 16%
of assets. However, we believe the stock could rerate as positive signs of its restructuring
emerge. Our 12-month price target of VND14,049 implies 1.2x 2018E P/TBV, which we view
as reasonable given the bank’s long-term roadmap to improved returns. In short, we believe the
stock offers value here.
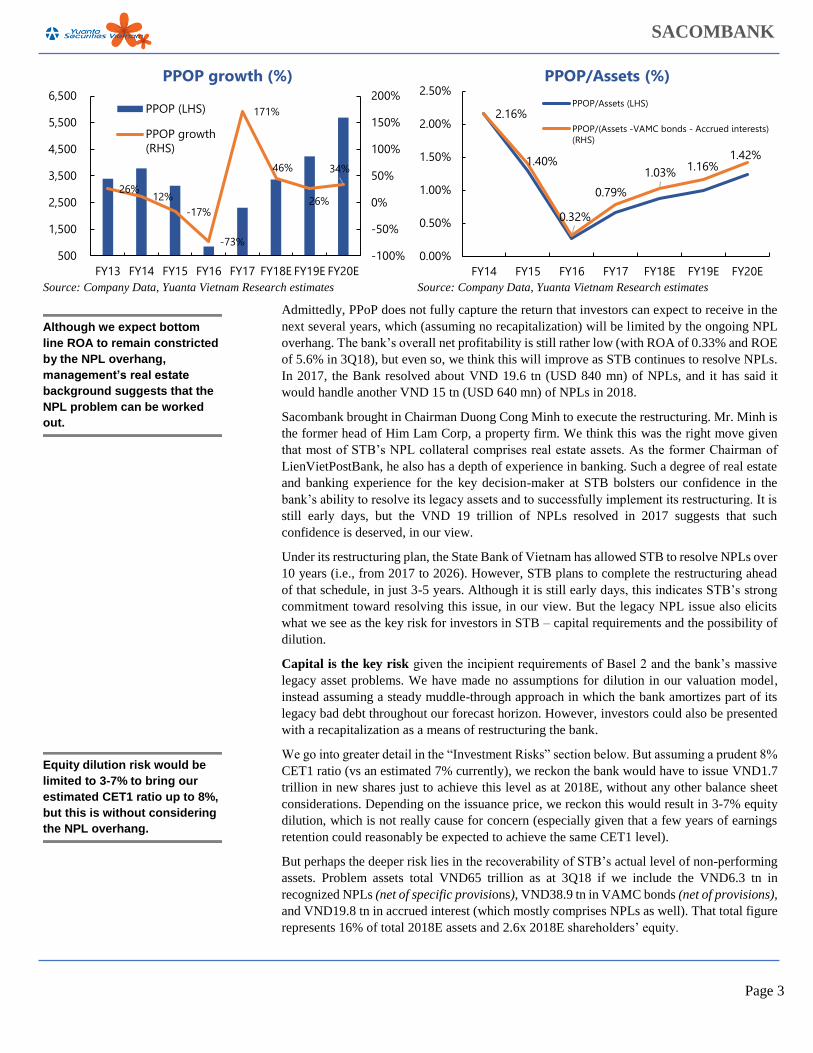
… but underlying business operations are improving. We forecast PPoP CAGR of 35.1% in
2017-20E, with PPoP / clean-book assets to almost double from 2017A to reach 1.42% in 2020E.
In our view, topline growth and PPOP ROA are better indicators of STB’s underlying business
strength than net profit, which we assume will compressed by the NPL overhang during our
forecast horizon. That said, STB could surprise on the upside if the NPL restructuring proceeds
more rapidly and effectively than we assume in our model – and management’s real estate
acumen suggests that it might.
Capital is the key risk. STB’s NPL prudential restructuring plan implies gradual loss
recognition based on topline profitability in the next several years. We view this workout as
entirely appropriate from a prudential perspective. But investors could face equity dilution if a
one-off recapitalization were adopted, which necessitates an assessment of the potential risk. A
reasonably prudent set of assumptions – 20-30% legacy NPL write-offs and new shares issued
at 1.4-1.5x P/TBV – would imply 30-40% dilution if the bank were recapitalized to achieve an
8% CET1 ratio, based on our estimates.
8,000
10,000
12,000
14,000
16,000
18,000
20,000
700800900
1,0001,1001,2001,3001,4001,500
01/18 04/18 07/18 10/18 01/19
VN Index (LHS)
Sacombank
(VND)(Pt)
Stock data
VN Stock Index 887
Market Cap.(USD mn) 890
Outstanding Shares(mn) 1,804
52-week High(VND) 17,300
52-week Low(VND) 9,670
Avg. Trading Volume 1
day(mn)
3.7
Stock performance (%)
Absolute performance 1M -9.5
6M 10.1
12M -21.3
Relative to VNIndex 1M -2.0
6M 13.4
12M -8.0
Source: Bloomberg

Page 2
SACOMBANK
Source: Bloomberg, Yuanta Vietnam Research estimates
Key Scenario Metrics
Scenarios Assumptions Target Price: VND14,049 (+23.8%) Our target price based on residual income model. Cost of equity: 12.15% (with 0.2%
annual reduction); Final year ROTCE: 11.0%
Bull case: VND18,475 (62.8%)
Sharp turnaround
2019E adjusted EPS (*): VND 1,053
2019E Fee income: VND 3,717 bn
2019E Provision costs: VND 1,889 bn
2019E Net interest income: VND 8,023 bn
2019E adjusted CIR (*): 65.6%
2019E P/TBV: 1.46x
Base case: VND14,049 (+23.8%)
Steady turnaround
2019E adjusted EPS (*): VND 847
2019E Fee income: VND 3,380 bn
2019E Provision costs: VND 1,933 bn
2019E Net interest income: VND 7,821 bn
2019E adjusted CIR (*): 67.6%
2019E P/TBV: 1.13x
Bear case: VND5,355 (-52.8%)
Failed turnaround
2019E adjusted EPS (*): VND 464
2019E Fee income: VND 2,784 bn
2019E Provision costs: VND 2,061 bn
2019E Net interest income: VND 6,344 bn
2019E adjusted CIR (*): 68.4%
2019E P/TBV: 0.44x
(*) adjusted for bonus and welfare
INVESTMENT THESIS Valuation is cheap (admittedly, for a reason) ... STB trades at a 3Q18A P/TBV ratio of
1.12x, well below the peer average of 1.97x. In our view, the reason for the valuation gap with
the rest of the sector should be obvious: STB is in a restructuring phase and will have to
recognize substantial provisioning for its high level of NPLs, which are mostly a legacy of the
2015 Southern Bank merger. However, we believe the stock could rerate as positive signs of
the restructuring emerge.
.. but the underlying business operations are improving. Business efficiency has improved
remarkably since 2016, and growth in pre-provisioning operating profit (PPoP) should remain
solid. In our view, topline PPoP growth is a better indicator of the strength of the bank’s
underlying business than net profit, which we assume will continue to be flattened by
provisioning for legacy assets. Topline growth should be driven by improving NIMs as the
Bank’s very low LDR rises toward the regulatory cap, higher consumer banking fee income
as the bank better leverages its attractive retail franchise, and improved efficiencies as
management shakes off the effects of the 2015 merger with Southern Bank. Despite the legacy
NPL issues, we thus see STB’s underlying business as very solid and a key attractive feature
of the stock. As a result, we forecast PPoP CAGR of 35.1% in 2017-20E, with PPoP / average
clean-book assets (i.e., adjusting out the legacy bad debt from total assets) rising from 0.79%
to reach 1.42% in 2020E.
0
3,000
6,000
9,000
12,000
15,000
18,000
21,000
Historical PricePrice TargetBull CaseBear Case
STB’s stock valuation reflects
its substantial exposure to
legacy NPLs
But its underlying operations
are solid, and we expect PPoP
CAGR of 35.1% in 2017A-20E
Current price: VND 11,500
(Jan 07, 2019) Bull case: VND 18,475 (+62.8%)
Base case: VND 14,049 (+23.8%)
Bear case: VND 5,355 (-52.8%)
TABLE OF CONTENTS
INVESTMENT THESIS.……………. 2
KEY DRIVERS.……………………... 4
VALUATION.…………………….…. 8
INVESTMENT RISKS.……………... 12
BUSINESS OPERATIONS.………… 14
COMPANY BACKGROUND.……… 21
Page 3
SACOMBANK
Source: Company Data, Yuanta Vietnam Research estimates Source: Company Data, Yuanta Vietnam Research estimates
Admittedly, PPoP does not fully capture the return that investors can expect to receive in the
next several years, which (assuming no recapitalization) will be limited by the ongoing NPL
overhang. The bank’s overall net profitability is still rather low (with ROA of 0.33% and ROE
of 5.6% in 3Q18), but even so, we think this will improve as STB continues to resolve NPLs.
In 2017, the Bank resolved about VND 19.6 tn (USD 840 mn) of NPLs, and it has said it
would handle another VND 15 tn (USD 640 mn) of NPLs in 2018.
Sacombank brought in Chairman Duong Cong Minh to execute the restructuring. Mr. Minh is
the former head of Him Lam Corp, a property firm. We think this was the right move given
that most of STB’s NPL collateral comprises real estate assets. As the former Chairman of
LienVietPostBank, he also has a depth of experience in banking. Such a degree of real estate
and banking experience for the key decision-maker at STB bolsters our confidence in the
bank’s ability to resolve its legacy assets and to successfully implement its restructuring. It is
still early days, but the VND 19 trillion of NPLs resolved in 2017 suggests that such
confidence is deserved, in our view.
Under its restructuring plan, the State Bank of Vietnam has allowed STB to resolve NPLs over
10 years (i.e., from 2017 to 2026). However, STB plans to complete the restructuring ahead
of that schedule, in just 3-5 years. Although it is still early days, this indicates STB’s strong
commitment toward resolving this issue, in our view. But the legacy NPL issue also elicits
what we see as the key risk for investors in STB – capital requirements and the possibility of
dilution.
Capital is the key risk given the incipient requirements of Basel 2 and the bank’s massive
legacy asset problems. We have made no assumptions for dilution in our valuation model,
instead assuming a steady muddle-through approach in which the bank amortizes part of its
legacy bad debt throughout our forecast horizon. However, investors could also be presented
with a recapitalization as a means of restructuring the bank.
We go into greater detail in the “Investment Risks” section below. But assuming a prudent 8%
CET1 ratio (vs an estimated 7% currently), we reckon the bank would have to issue VND1.7
trillion in new shares just to achieve this level as at 2018E, without any other balance sheet
considerations. Depending on the issuance price, we reckon this would result in 3-7% equity
dilution, which is not really cause for concern (especially given that a few years of earnings
retention could reasonably be expected to achieve the same CET1 level).
But perhaps the deeper risk lies in the recoverability of STB’s actual level of non-performing
assets. Problem assets total VND65 trillion as at 3Q18 if we include the VND6.3 tn in
recognized NPLs (net of specific provisions), VND38.9 tn in VAMC bonds (net of provisions),
and VND19.8 tn in accrued interest (which mostly comprises NPLs as well). That total figure
represents 16% of total 2018E assets and 2.6x 2018E shareholders’ equity.
26%12%
-17%
-73%
171%
46%
26%
34%
-100%
-50%
0%
50%
100%
150%
200%
500
1,500
2,500
3,500
4,500
5,500
6,500
FY13 FY14 FY15 FY16 FY17 FY18E FY19E FY20E
PPOP growth (%)
PPOP (LHS)
PPOP growth(RHS)
2.16%
1.40%
0.32%
0.79%
1.03% 1.16%1.42%
0.00%
0.50%
1.00%
1.50%
2.00%
2.50%
FY14 FY15 FY16 FY17 FY18E FY19E FY20E
PPOP/Assets (%)
PPOP/Assets (LHS)
PPOP/(Assets -VAMC bonds - Accrued interests)(RHS)
Although we expect bottom
line ROA to remain constricted
by the NPL overhang,
management’s real estate
background suggests that the
NPL problem can be worked
out.
Equity dilution risk would be
limited to 3-7% to bring our
estimated CET1 ratio up to 8%,
but this is without considering
the NPL overhang.

Page 4
SACOMBANK
The figure below represents the total capital that we reckon would be needed to achieve a
CET1 ratio of 8% based on a range of legacy bad debt loss assumptions from 0% to 100%.
Sensitivity analysis of NPL losses to total capital raising (unit: VND bn)
Exactly how much of this will have to be written off is difficult to determine. In our view, it
would be unreasonable to assume 100% losses on these assets given 1) they have already been
partially provisioned against, 2) overall collateral values are likely to be higher now than when
the asset was created, and 3) the bank’s key decision makers have deep property market
experience and thus should be able to handle NPLs efficiently. This should potentially suggest
eventual recoveries, but we believe a more reasonable loss assumption should be around 20-
30%, implying an additional capital requirement of VND15-21 trillion. However, the eventual
losses are clearly uncertain, and we therefore provide the dilution sensitivities for as much as
100% write-offs of the legacy assets (please see the “Risks” section for details).
Estimating the potential dilution risk also requires a discussion of the price of the new capital.
At the stock’s current price, writing off 30% of legacy bad debt and raising CET1 to 8% would
require equity dilution of roughly 50% to current shareholders. We therefore do not see issuing
shares at the current valuation as a particularly attractive option. However, a case can be made
for raising capital at a higher-than-market price. Typically, such a transaction would also
involve changes in the composition of management. Clearly this is all speculative, but STB
offers an attractive foundation for retail banking growth, which could be attractive for a
strategic investor.
Again, we go into greater detail in the “Risks” section, but the table below indicates the
estimated dilution to current shareholders of a recapitalization to 8% CET1 based on legacy
asset loss assumptions of zero to 100% (the Y column) and the valuation at which the new
capital is issued (the X column), based on whether or not a strategic shareholder premium is
part of the price. A reasonable combination of assumptions (i.e., 20-30% losses on legacy
assets and new capital issuance valuation of 1.4-1.5x P/TBV) which would imply c. 30-40%
dilution. Caveat emptor, but we think the stock’s current valuation has more than priced in
such an outcome.
Sensitivity analysis of share ownership dilution risk (unit: %)
Source: Yuanta Vietnam Research estimates
PATH TO DOUBLE-DIGIT ROTCE 1) Despite the many obstacles to NPL resolution, we believe that STB will be successful
with its restructuring, with ROTCE to climb once provisioning normalizes. In our view,
Vietnam’s banks are on track to resolving their bad loan issues given:
A favorable macroeconomic environment (i.e., solid GDP growth and a strong property
market),
VAMC provides a mechanism to recover bad loans.
% Total NPLs loss 0% 10.0% 20.0% 30.0% 40.0% 50.0% 60.0% 70.0% 80.0% 90.0% 100.0%
Capital Raising 1,712 8,214 14,716 21,218 27,720 34,222 40,724 47,226 53,728 60,230 66,732
Price of newly issued shares 12,000 14,000 16,000 18,000 20,000 22,000 24,000 26,000
P/TBV of newly issued shares 1.02x 1.18x 1.35x 1.52x 1.69x 1.86x 2.03x 2.20x
0% 7% 6% 6% 5% 5% 4% 4% 4%
10% 28% 25% 22% 20% 19% 17% 16% 15%
20% 40% 37% 34% 31% 29% 27% 25% 24%
30% 50% 46% 42% 40% 37% 35% 33% 31%
40% 56% 52% 49% 46% 43% 41% 39% 37%
50% 61% 58% 54% 51% 49% 46% 44% 42%
60% 65% 62% 59% 56% 53% 51% 48% 46%
70% 69% 65% 62% 59% 57% 54% 52% 50%
80% 71% 68% 65% 62% 60% 58% 55% 53%
90% 74% 70% 68% 65% 63% 60% 58% 56%
100% 76% 73% 70% 67% 65% 63% 61% 59%
Loss
on
Leg
acy
Bad
Deb
ts
Assuming a 20-30% loss on
total NPLs, the bank would
require additional capital of
VND15-21 tn, implying an
estimated 20-30% dilution to
current shareholders.
Page 5
SACOMBANK
Resolution 42/2017/QH14 allows banks to more actively manage NPLs via rapid
repossession of collateral.
Admittedly the legal mechanism is not perfect, but these policies clearly indicate the
Government’s strong commitment to resolving Vietnam’s estimated USD 20 bn of NPLs,
equivalent to about 10% of total GDP. Clearly NPLs are not specific to any particular bank,
but rather a national issue that needs to be resolved to ensure macroeconomic stability. Total
loans in the banking system account for more than 120% of Vietnam’s real GDP, a level that
is 2 to 3 times that of comparable ASEAN countries. Thus, a high rate of NPLs are a major
concern, not just for the banking system but for overall national financial security.
Thus, we believe that the Government will work to help banks clear bad debts efficiently.
One such policy could be the establishment of a market to sell bad debt, preferably with the
participation of domestic and foreign investors.
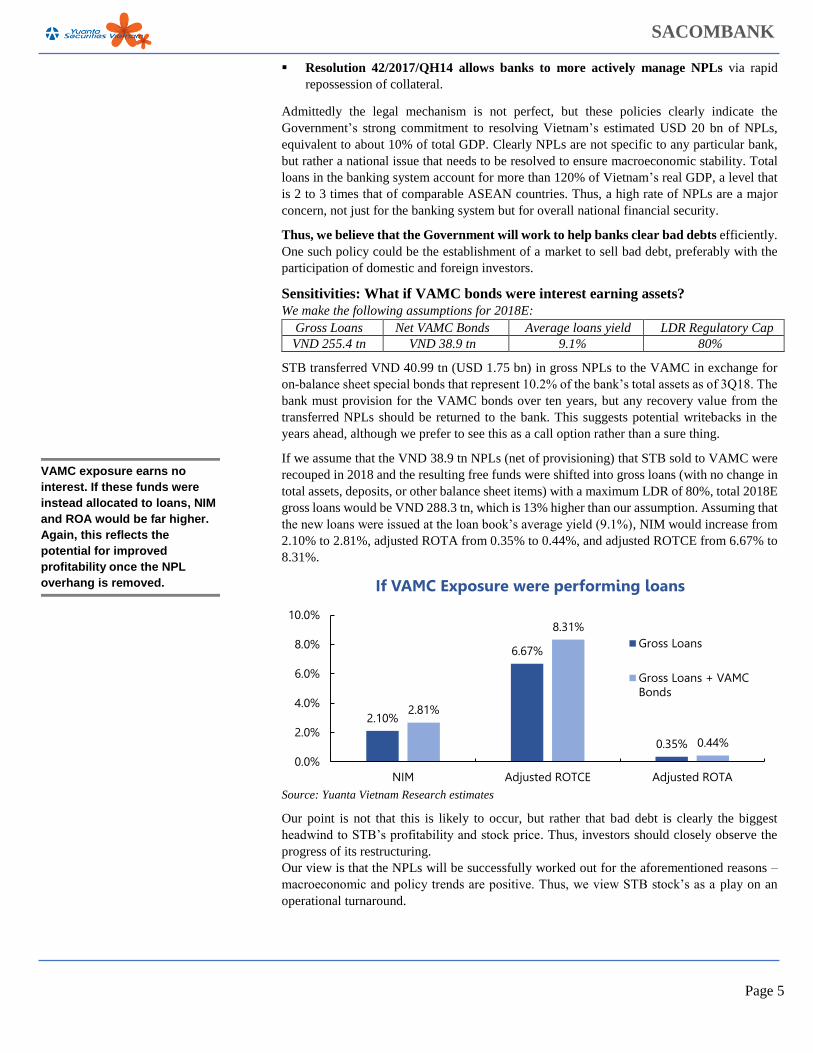
Sensitivities: What if VAMC bonds were interest earning assets?
We make the following assumptions for 2018E:
Gross Loans Net VAMC Bonds Average loans yield LDR Regulatory Cap
VND 255.4 tn VND 38.9 tn 9.1% 80%
STB transferred VND 40.99 tn (USD 1.75 bn) in gross NPLs to the VAMC in exchange for
on-balance sheet special bonds that represent 10.2% of the bank’s total assets as of 3Q18. The
bank must provision for the VAMC bonds over ten years, but any recovery value from the
transferred NPLs should be returned to the bank. This suggests potential writebacks in the
years ahead, although we prefer to see this as a call option rather than a sure thing.
If we assume that the VND 38.9 tn NPLs (net of provisioning) that STB sold to VAMC were
recouped in 2018 and the resulting free funds were shifted into gross loans (with no change in
total assets, deposits, or other balance sheet items) with a maximum LDR of 80%, total 2018E
gross loans would be VND 288.3 tn, which is 13% higher than our assumption. Assuming that
the new loans were issued at the loan book’s average yield (9.1%), NIM would increase from
2.10% to 2.81%, adjusted ROTA from 0.35% to 0.44%, and adjusted ROTCE from 6.67% to
8.31%.
Source: Yuanta Vietnam Research estimates
Our point is not that this is likely to occur, but rather that bad debt is clearly the biggest
headwind to STB’s profitability and stock price. Thus, investors should closely observe the
progress of its restructuring.
Our view is that the NPLs will be successfully worked out for the aforementioned reasons –
macroeconomic and policy trends are positive. Thus, we view STB stock’s as a play on an
operational turnaround.
2.10%
6.67%
0.35%
2.81%
8.31%
0.44%
0.0%
2.0%
4.0%
6.0%
8.0%
10.0%
NIM Adjusted ROTCE Adjusted ROTA
If VAMC Exposure were performing loans
Gross Loans
Gross Loans + VAMCBonds
VAMC exposure earns no
interest. If these funds were
instead allocated to loans, NIM
and ROA would be far higher.
Again, this reflects the
potential for improved
profitability once the NPL
overhang is removed.

Page 6
SACOMBANK
2) Fee income to reduce earnings volatility
Aside from NPL resolution, boosting fee income is another goal of the Bank to improve its
ROTCE over the long term. We expect net fee revenues to account for 27.5% of total revenues
on average in the 2018-20E period, up from 22.1% in 2015-17A. Despite its well-publicized
problems, STB has a very strong branch network and large retail customer base (see page 11
of the 2017 annual report for details). We therefore believe that the Bank’s outlook is strong
for consumer banking fees, including segment such as:
Card transaction fees and other card-related fees. STB ranks third highest in Vietnam in
terms of Visa transactions.
Other retail-focused fee-based services such as internet and mobile banking, and
Bancassurance, where STB has tied up with Dai-Ichi Life.
Source: Company Data, Yuanta Vietnam Research estimates
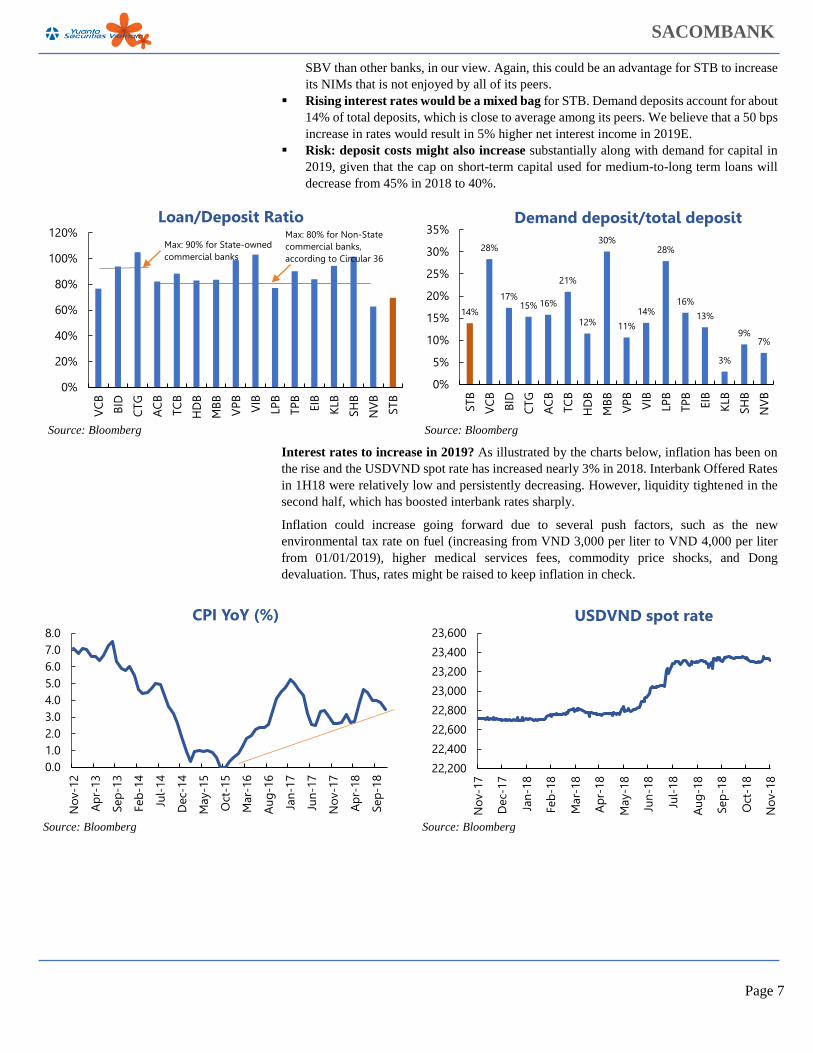
3) STB has more room than its peers to expand loan growth by boosting LDR
LDR was 69.7% as of 3Q18, well below the regulatory cap of 80%. By contrast, most
other banks have already reached or exceeded the regulatory limit of 80% for non-state
commercial banks and 90% for state commercial banks. Current average LDR of listed
banks is 88.4% and that of listed non-state banks is 87.5%, suggesting limited room to
push LDRs higher among competitor banks. We see this as a key attractive feature for
STB, given that it has room to increase its LDR, and thus also improve its NIM, going
forward.
Higher LDR = Higher profitability. The tables below present our sensitivity analysis of
the Bank’s LDR to its NIM, ROE, and ROA. (In this exercise, LDR increases from our
initial assumptions to the regulatory cap of 80%, whereas other numbers remained
unchanged.)
FY18E FY19E FY20E
Current LDR assumptions 70.0% 74.0% 77.0%
NIM 2.10% 2.18% 2.42%
Adjusted ROTCE 6.67% 7.05% 8.93%
Adjusted ROTA 0.35% 0.36% 0.46%
Source: Yuanta Vietnam Research estimates
FY18E FY19E FY20E
Regulatory cap LDR 80.0% 80.0% 80.0%
NIM 2.47% 2.74% 2.74%
Adjusted ROTCE 7.52% 9.02% 9.98%
Adjusted ROTA 0.40% 0.48% 0.53%
Not surprisingly, NIM, ROE, and ROA improve significantly when LDR increases from
our base case assumptions of 70% in FY18E, 74% in FY19E, and 77% in FY20E to 80%
for all three years. The higher LDR also boosts the implied fair value by about 4.0% to
VND 14,612 (+28.7% vs. the current level) compared to our base fair value of VND
14,049 (+23.8% vs. the current stock price).
An increased LDR is not just an academic exercise. Banks that are undergoing
restructuring such as STB are likely to be allowed higher loan growth rates from the
0%
20%
40%
60%
80%
100%
FY13 FY14 FY15 FY16 FY17 FY18E FY19E FY20E
Services Income Plays a Bigger Role
% Net Interest Income % Net Services Income
Net fee income account for
27.5% of total revenues on
average in the 2018-20E
LDR (69.7% in 3Q18) is well
below other listed banks on
average in the same period
(88.4%), implying NIM
outperformance going forward.
Page 7
SACOMBANK
SBV than other banks, in our view. Again, this could be an advantage for STB to increase
its NIMs that is not enjoyed by all of its peers.
Rising interest rates would be a mixed bag for STB. Demand deposits account for about
14% of total deposits, which is close to average among its peers. We believe that a 50 bps
increase in rates would result in 5% higher net interest income in 2019E.
Risk: deposit costs might also increase substantially along with demand for capital in
2019, given that the cap on short-term capital used for medium-to-long term loans will
decrease from 45% in 2018 to 40%.
Source: Bloomberg
Source: Bloomberg
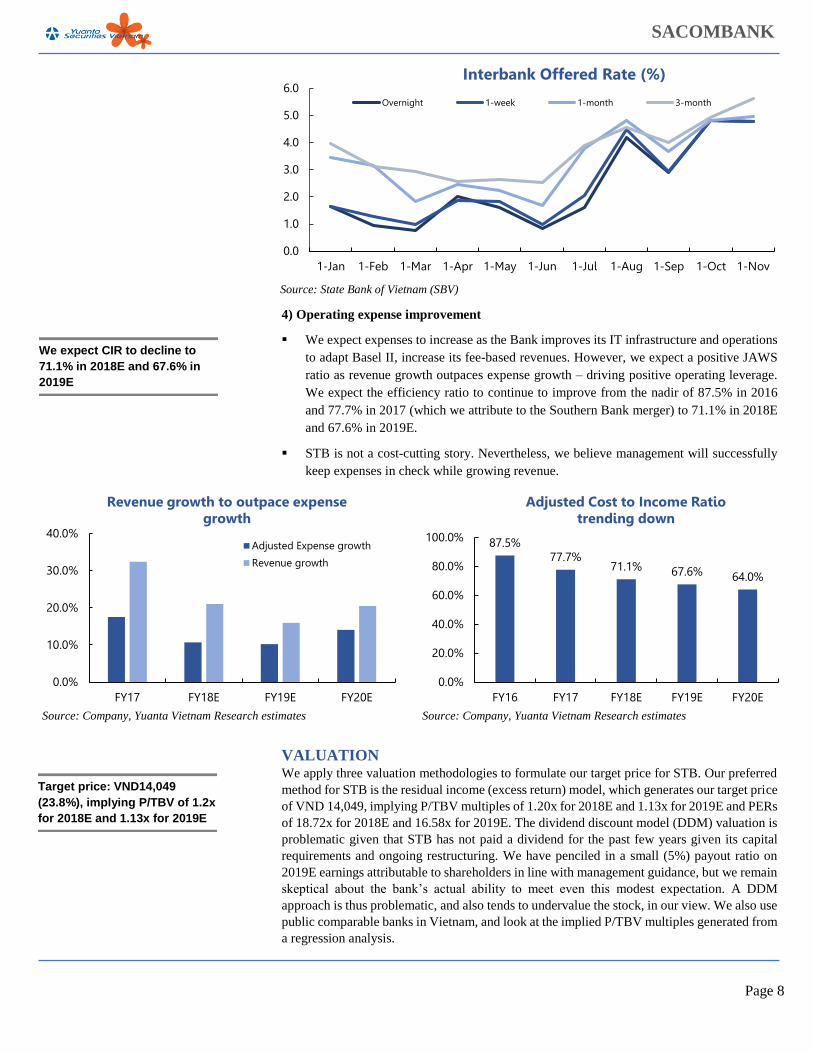
Interest rates to increase in 2019? As illustrated by the charts below, inflation has been on
the rise and the USDVND spot rate has increased nearly 3% in 2018. Interbank Offered Rates
in 1H18 were relatively low and persistently decreasing. However, liquidity tightened in the
second half, which has boosted interbank rates sharply.
Inflation could increase going forward due to several push factors, such as the new
environmental tax rate on fuel (increasing from VND 3,000 per liter to VND 4,000 per liter
from 01/01/2019), higher medical services fees, commodity price shocks, and Dong
devaluation. Thus, rates might be raised to keep inflation in check.
Source: Bloomberg
Source: Bloomberg
0%
20%
40%
60%
80%
100%
120%
VC
B
BID
CTG
AC
B
TCB
HD
B
MBB
VPB VIB
LPB
TPB
EIB
KLB
SHB
NV
B
STB
Loan/Deposit Ratio
Max: 90% for State-owned commercial banks
Max: 80% for Non-State commercial banks, according to Circular 36
14%
28%
17%15% 16%
21%
12%
30%
11%
14%
28%
16%
13%
3%
9%7%
0%
5%
10%
15%
20%
25%
30%
35%
STB
VC
B
BID
CTG
AC
B
TCB
HD
B
MBB
VPB VIB
LPB
TPB
EIB
KLB
SHB
NV
B
Demand deposit/total deposit
0.01.02.03.04.05.06.07.08.0
Nov
-12
Apr
-13
Sep-
13
Feb-
14
Jul-
14
Dec
-14
May
-15
Oct
-15
Mar
-16
Aug
-16
Jan-
17
Jun-
17
Nov
-17
Apr
-18
Sep-
18
CPI YoY (%)
22,200
22,400
22,600
22,800
23,000
23,200
23,400
23,600
Nov
-17
Dec
-17
Jan-
18
Feb-
18
Mar
-18
Apr
-18
May
-18
Jun-
18
Jul-
18
Aug
-18
Sep-
18
Oct
-18
Nov
-18
USDVND spot rate
Page 8
SACOMBANK
Source: State Bank of Vietnam (SBV)
4) Operating expense improvement
We expect expenses to increase as the Bank improves its IT infrastructure and operations
to adapt Basel II, increase its fee-based revenues. However, we expect a positive JAWS
ratio as revenue growth outpaces expense growth – driving positive operating leverage.
We expect the efficiency ratio to continue to improve from the nadir of 87.5% in 2016
and 77.7% in 2017 (which we attribute to the Southern Bank merger) to 71.1% in 2018E
and 67.6% in 2019E.
STB is not a cost-cutting story. Nevertheless, we believe management will successfully
keep expenses in check while growing revenue.
Source: Company, Yuanta Vietnam Research estimates
Source: Company, Yuanta Vietnam Research estimates
VALUATION We apply three valuation methodologies to formulate our target price for STB. Our preferred
method for STB is the residual income (excess return) model, which generates our target price
of VND 14,049, implying P/TBV multiples of 1.20x for 2018E and 1.13x for 2019E and PERs
of 18.72x for 2018E and 16.58x for 2019E. The dividend discount model (DDM) valuation is
problematic given that STB has not paid a dividend for the past few years given its capital
requirements and ongoing restructuring. We have penciled in a small (5%) payout ratio on
2019E earnings attributable to shareholders in line with management guidance, but we remain
skeptical about the bank’s actual ability to meet even this modest expectation. A DDM
approach is thus problematic, and also tends to undervalue the stock, in our view. We also use
public comparable banks in Vietnam, and look at the implied P/TBV multiples generated from
a regression analysis.
0.0
1.0
2.0
3.0
4.0
5.0
6.0
1-Jan 1-Feb 1-Mar 1-Apr 1-May 1-Jun 1-Jul 1-Aug 1-Sep 1-Oct 1-Nov
Interbank Offered Rate (%)
Overnight 1-week 1-month 3-month
0.0%
10.0%
20.0%
30.0%
40.0%
FY17 FY18E FY19E FY20E
Revenue growth to outpace expense growth
Adjusted Expense growth
Revenue growth
87.5%77.7%
71.1% 67.6% 64.0%
0.0%
20.0%
40.0%
60.0%
80.0%
100.0%
FY16 FY17 FY18E FY19E FY20E
Adjusted Cost to Income Ratio trending down
We expect CIR to decline to
71.1% in 2018E and 67.6% in
2019E
Target price: VND14,049
(23.8%), implying P/TBV of 1.2x
for 2018E and 1.13x for 2019E

Page 9
SACOMBANK
STB’s fair value estimate using our “Base Case” assumptions.
As shown below, STB’s share price is lower than the implied fair value range generated from
the residual income approach, listed comparables method, and regression analysis. STB has a
relatively low P/TBV multiple, which might suggest undervaluation. However, the Bank is in
a restructuring process and its reported equity value masks the underlying asset quality
problems.
Source: Yuanta Vietnam Research estimates
Residual Income (Excess Return) Model We believe that the Residual Income Model is a more suitable approach than the Dividend
Discount Model given that the Bank currently pays no dividend.
We split the model into 3 phases, with Phase 1 corresponding to high dividend issuance growth
in the first five years, Phase 2 corresponding to slowing dividend growth in the five years after
that, and Phase 3 corresponding to a stabilized payout ratio in the fives after phase 2.
Residual Income = ROCE * Average Equity – Cost of Equity * Average Equity.
We make the following assumptions:
Cost of equity starts at 12.15% and falls to 10.15% in the final year to reflect reduced
risk (and reduced potential returns) as STB grows.
ROTCE in the second stage (Years 6-12) starts at 14% and then falls gradually to reach
11% in the third stage (Years 13-15).
Assets growth in the second stage (Years 6-12) starts at 10% and declines gradually to
reach 7% in the third stage (Years 13-15).
Dividend payout ratio increases from 5.0% on FY19E earnings to 20% in FY22E. It
then rises to 50% in FY27E, and remains stable thereafter.
Implied Value of Equity:
Terminal Net Income Growth Rate: 6.0%
Projected Net Income 1 Year After Period: 7,190.9
Residual Income Terminal Value: 13,428.7
(+) Current Common Shareholders' Equity: 23,780.9
(+) PV of Residual Income Terminal Value: 3,644.0
(+) Sum of PV of Residual Income: (2,084.8)
Implied Equity Value: 25,340.2
% of Implied Value from PV of TV: 14.4%
Implied Share Price: 14,049
Current Share Price: 11,350
Premium / (Discount) to Current: 23.8%
0.0 10,000.0 20,000.0 30,000.0 40,000.0 50,000.0
Correlation Between 2019E ROTCE and 2019E P / TBV:
11.7% - 12.6% Discount Rate,10.0% - 12.0% ROTCE:
2019E P / TBV:
2018E P / TBV:
P / TBV:
2019E Normalized P / E:
2018E Normalized P / E:
LTM Normalized P / E:
Implied Price per Share
STB's Implied Fair Price
Min to 25th
25th to Median
Median to 75th
75th to Max
Public Company Comparables
Residual Income Model
Regression Analysis
Current price (Jan 08):
VND 11,350
Page 10
SACOMBANK
Sensitivity Table
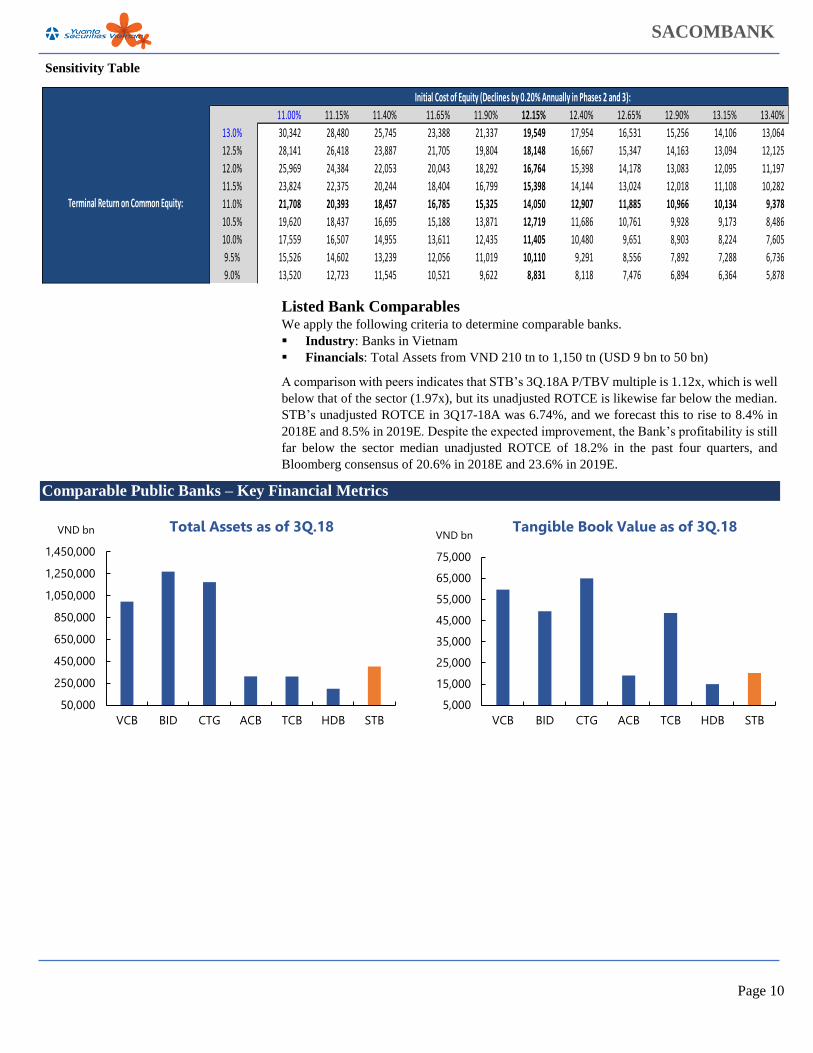
Listed Bank Comparables We apply the following criteria to determine comparable banks.
Industry: Banks in Vietnam
Financials: Total Assets from VND 210 tn to 1,150 tn (USD 9 bn to 50 bn)
A comparison with peers indicates that STB’s 3Q.18A P/TBV multiple is 1.12x, which is well
below that of the sector (1.97x), but its unadjusted ROTCE is likewise far below the median.
STB’s unadjusted ROTCE in 3Q17-18A was 6.74%, and we forecast this to rise to 8.4% in
2018E and 8.5% in 2019E. Despite the expected improvement, the Bank’s profitability is still
far below the sector median unadjusted ROTCE of 18.2% in the past four quarters, and
Bloomberg consensus of 20.6% in 2018E and 23.6% in 2019E.
Comparable Public Banks – Key Financial Metrics
Initial Cost of Equity (Declines by 0.20% Annually in Phases 2 and 3):
14,049.35$ 11.00% 11.15% 11.40% 11.65% 11.90% 12.15% 12.40% 12.65% 12.90% 13.15% 13.40%
13.0% 30,342 28,480 25,745 23,388 21,337 19,549 17,954 16,531 15,256 14,106 13,064
12.5% 28,141 26,418 23,887 21,705 19,804 18,148 16,667 15,347 14,163 13,094 12,125
12.0% 25,969 24,384 22,053 20,043 18,292 16,764 15,398 14,178 13,083 12,095 11,197
11.5% 23,824 22,375 20,244 18,404 16,799 15,398 14,144 13,024 12,018 11,108 10,282
11.0% 21,708 20,393 18,457 16,785 15,325 14,050 12,907 11,885 10,966 10,134 9,378
10.5% 19,620 18,437 16,695 15,188 13,871 12,719 11,686 10,761 9,928 9,173 8,486
10.0% 17,559 16,507 14,955 13,611 12,435 11,405 10,480 9,651 8,903 8,224 7,605
9.5% 15,526 14,602 13,239 12,056 11,019 10,110 9,291 8,556 7,892 7,288 6,736
9.0% 13,520 12,723 11,545 10,521 9,622 8,831 8,118 7,476 6,894 6,364 5,878
Terminal Return on Common Equity:
50,000
250,000
450,000
650,000
850,000
1,050,000
1,250,000
1,450,000
VCB BID CTG ACB TCB HDB STB
Total Assets as of 3Q.18VND bn
5,000
15,000
25,000
35,000
45,000
55,000
65,000
75,000
VCB BID CTG ACB TCB HDB STB
Tangible Book Value as of 3Q.18VND bn

Page 11
SACOMBANK
Source: Yuanta Vietnam Research estimates, Bloomberg, Fiinpro
Regression Analysis We also ran a regression analysis to determine the relationship between FY19E ROTCE and
P/TBV for a broad set of public commercial banks in Vietnam. We then use this relationship
to estimate the implied FY19E P/TBV multiple and implied Equity value.
Here is the result of the regression:
The Regression analysis gives an implied share price of about VND 12,816.
Source: Yuanta Vietnam Research estimates, Bloomberg
20.0%
24.2%
30.5%
18.1% 20.6%
31.6%
8.2%
0.0%
5.0%
10.0%
15.0%
20.0%
25.0%
30.0%
35.0%
VCB BID CTG ACB TCB HDB STB
Net Income Growth, 2018E - 2019E
23.5%
18.1% 16.6%
24.8% 25.1% 23.6%
8.5%
0.0%
5.0%
10.0%
15.0%
20.0%
25.0%
30.0%
VCB BID CTG ACB TCB HDB STB
Return on Tangible Common Equity, 2019E
11.9x 12.0x
7.8x 6.4x
9.4x 8.9x
12.2x
0.0x
2.0x
4.0x
6.0x
8.0x
10.0x
12.0x
14.0x
VCB BID CTG ACB TCB HDB STB
2019E P / E Multiples
2.9x
2.1x
1.2x 1.4x
2.1x 2.1x
1.0x
0.0x
0.5x
1.0x
1.5x
2.0x
2.5x
3.0x
3.5x
VCB BID CTG ACB TCB HDB STB
2019E P / TBV Multiples
VCB
BID
CTGACB
TCBHDB
STB
EIB
VPBVIBMBB
TPB
KLB
y = 5.6855x + 0.548R² = 0.4807
0.5x
1.0x
1.5x
2.0x
2.5x
3.0x
3.5x
5.0% 10.0% 15.0% 20.0% 25.0% 30.0% 35.0%
Pro
ject
ed
P/T
BV
, FY
19
Projected ROTCE, FY19

Page 12
SACOMBANK
Valuation Conclusions As noted above, we see the Residual Income Model as most appropriate for estimating STB’s
fair value. On this basis, the stock is currently undervalued by about 23.8% under our Base
case, and about 62.8% in the Bullish case (final year ROE of 11.5%). In the Bearish case (final
year ROE of 9%), the stock price is overvalued by about 52.8%.
We view our Base case as reasonably conservative, which is appropriate given uncertainties
over STB’s restructuring. We also view the Bullish case as more likely to occur than the Bear
case, given the favorable macro environment and Government support for the restructuring.
In our view, banks are seeing a turning point after years of concerted clean-up efforts – and
investors have been waiting for this turning point for years. We see this as an attractive
opportunity to benefit from an undervalued turnaround story, and we thus initiate with an
Overweight.
We believe every valuation has a story behind it. A solid company’s story might be rosy –
but often its market valuation more than reflects this. Sacombank’s story is admittedly not
rosy, but management understands the problems and is taking actions to fix them. Thus, we
believe that STB is a good, albeit speculative, investment. Investors should approach the
idea with open eyes and should be cognizant of the risks.
INVESTMENT RISKS Risk 1) The biggest risk for the Company and stock price is the progress of its legacy
NPL resolution. Delays in handling NPLs that have been transferred to the VAMC could
continue to impact earnings and the share price performance. Whereas Resolution
42/2017/QH14 should help banks to resolve their bad debts, certain real-world frictions remain
and need to be addressed. This includes issues related to the mechanism for asset sales, the
bidding process, and – of course – the selling price. Analysts and investors should closely
monitor the progress of NPL resolution to gauge the potential for STB’s stock price. Also, as
noted above, STB’s asset quality woes are a legacy of the Southern Bank merger. We are
positive on the bank’s ongoing operations and do not anticipate a substantial increase in new
NPL formation; but if this were to occur, it would obviously be a negative for sentiment and
the share price.
Capital and liquidity pressures. STB could face pressure related to its capital levels as it
must ensure that it complies with the Basel II requirements by 2019. An average loan growth
is about 14-15% per annual, short-term funding used for medium-to-long term loans will
reduce from 45% in 2018 to 40% in 2019, and risk weighted assets for real estate loans will
increase from 200% in 2018 to 250% in 2019. Thus, with this capital pressure and NPLs, STB
is not likely to pay dividend on 2018E earnings (and it may not do so on 2019E earnings
either).
Below is the sensitivity analysis of newly issued shares with the following assumptions:
2018E’s tangible common equity tier 1 (CET1): VND 21.3 tn
CET1 ratio: We assume that STB will maintain CET1 ratio at 8%
Total amount of legacy bad debts is about VND 65 tn as of 3Q.18 (including net net
internal NPLs VND 6.3 tn, net VAMC bonds VND 38.9 tn, and accrued interests VND
19.8 tn)
Newly issued shares range from 566 mn to 1,768 mn shares, corresponding with
assumptions of 20% to 30% loss on legacy bad debts and VND 12,000 (P/TBV: 1.02x) to
VND 26,000 (P/TBV: 2.20x) on prices of newly issued shares.
Base case: +23.8%
Bull case: + 62.8%
Bear case: -52.8%
Biggest risks are the legacy
bad debt handling progress &
capital pressures

Page 13
SACOMBANK
Sensitivity analysis of newly issued shares (unit: million shares)
Source: Yuanta Vietnam Research estimates
Below is the total capital that needs to be raised corresponding to different assumptions on
legacy bad debts loss - ranging from 0% to 100%, to maintain CET1 ratio at 8%.
Sensitivity analysis of total capital raising (unit: VND bn)
We expect the percentage loss on legacy bad debts in the base case is 20% to 30% and 100%
in the worst case. We believe that 20-30% loss on the base case is more likely to happen than
the worst case because most NPLs have collaterals. Correspondingly, the total capital that
might need to be raised ranges from VND15 tn to VND21 tn.
Below is the sensitivity analysis of share ownership dilution risk (%):
Current share outstanding: 1,804 mn
Share ownership dilution risk ranges from 24% to 50%, corresponding with assumptions
of 20% to 30% loss on legacy bad debts and VND 12,000 to VND 26,000 on prices of
newly issued shares.
Sensitivity analysis of share ownership dilution risk (unit: %)
Source: Yuanta Vietnam Research estimates
Below are the newly estimated fair prices corresponding with newly issued shares:
Original estimated fair value: VND 14,049
Estimated equity value: VND 25.3 tn
New fair prices range from VND 7,106 to VND 10,711, with the assumptions of 20% to
30% loss on legacy bad debts and VND 12,000 to VND 26,000 on prices of newly issued
shares.
Price of newly issued shares 12,000 14,000 16,000 18,000 20,000 22,000 24,000 26,000
P/TBV of newly issued shares 1.02x 1.18x 1.35x 1.52x 1.69x 1.86x 2.03x 2.20x
0% 143 122 107 95 86 78 71 66
10% 685 587 513 456 411 373 342 316
20% 1,226 1,051 920 818 736 669 613 566
30% 1,768 1,516 1,326 1,179 1,061 964 884 816
40% 2,310 1,980 1,733 1,540 1,386 1,260 1,155 1,066
50% 2,852 2,444 2,139 1,901 1,711 1,556 1,426 1,316
60% 3,394 2,909 2,545 2,262 2,036 1,851 1,697 1,566
70% 3,936 3,373 2,952 2,624 2,361 2,147 1,968 1,816
80% 4,477 3,838 3,358 2,985 2,686 2,442 2,239 2,066
90% 5,019 4,302 3,764 3,346 3,012 2,738 2,510 2,317
100% 5,561 4,767 4,171 3,707 3,337 3,033 2,781 2,567
Loss
on
Leg
acy
Bad
% Total NPLs loss 0% 10.0% 20.0% 30.0% 40.0% 50.0% 60.0% 70.0% 80.0% 90.0% 100.0%
Capital Raising 1,712 8,214 14,716 21,218 27,720 34,222 40,724 47,226 53,728 60,230 66,732
Price of newly issued shares 12,000 14,000 16,000 18,000 20,000 22,000 24,000 26,000
P/TBV of newly issued shares 1.02x 1.18x 1.35x 1.52x 1.69x 1.86x 2.03x 2.20x
0% 7% 6% 6% 5% 5% 4% 4% 4%
10% 28% 25% 22% 20% 19% 17% 16% 15%
20% 40% 37% 34% 31% 29% 27% 25% 24%
30% 50% 46% 42% 40% 37% 35% 33% 31%
40% 56% 52% 49% 46% 43% 41% 39% 37%
50% 61% 58% 54% 51% 49% 46% 44% 42%
60% 65% 62% 59% 56% 53% 51% 48% 46%
70% 69% 65% 62% 59% 57% 54% 52% 50%
80% 71% 68% 65% 62% 60% 58% 55% 53%
90% 74% 70% 68% 65% 63% 60% 58% 56%
100% 76% 73% 70% 67% 65% 63% 61% 59%
Loss
on
Leg
acy
Bad
Deb
ts

Page 14
SACOMBANK
Sensitivity analysis of newly estimated fair prices (unit: VND)
Source: Yuanta Vietnam Research estimates
Risk 2) Barriers to bad debt recoveries.
Despite supportive government policies such as Resolution No. 42 to help banks accelerate
the resolution of legacy NPLs, numerous barriers to implementation still stand in the way.
These include issues related to the asset sale mechanism, the bidding process, and – of course
– the selling price. Moreover, most of STB’s real estate collateral assets are very large in value.
Finding investors to purchase these assets might be difficult, and the bank might have to accept
installment payments over many years. Such arrangements also pose credit and counterparty
risks.
However, we remain confident about STB’s ability to overcome these hurdles given favorable
government policy and support, as well as management’s strong real estate acumen.
Risk 3) Funding franchise is not strong for a retail bank, and improving this may be
tough. Demand deposits represent 14.5% of total deposits, which is just slightly below the
15% median of listed banks. This is relatively weak for a retail- and business-banking focused
bank like STB. Increasing this may be difficult given the strong competition and probable
higher interest rate environment (which could further bolster the attractiveness of time
deposits). However, we see increasing the CASA ratio as a potential upside driver for STB,
especially if it is able to leverage its payments and overall SME business.
Risk 4) 4Q18 earnings could be hit by lumpy provisioning. Under its restructuring plan
STB has committed to amortize its VAMC exposure over ten years. Moreover, management
has stated its intention to handle the problem within 3-5 years. We expect the need to provision
more heavily in 4Q18E, which would be a repeat of 2017 (4Q17 represented 72% of full-year
provisioning in 2017) unless there is a substantial recovery of NPLs in the year.
BUSINESS OPERATIONS
Key focus: Progress of NPL workout 3Q.18 Results: Sacombank [STB] reported mixed Q318A results. Net interest income of
VND 2,070 bn grew 22.1% YoY growth, while pre-provisioning operating profit (PPOP) of
VND 982 bn was up 66.7% YoY. However, profit before tax was hit by lumpy provisioning
in the 3Q.18 to reach only VND 318 bn, down 29.3% YoY. STB appears to have accelerated
provisioning for NPLs as its PPOP increased – which is in line with its mandate to provision
legacy assets based on its profitability.
FY18 Guidance: STB has guided 2018 PBT to increase by 47% YoY to reach VND 2,200
bn, which is higher than its initial target of 23% YoY growth. The Bank would have to book
low provisions in 4Q18 to record such high PBT, in our view. This would imply substantial
recoveries on legacy assets, in our view.
The bank targets loan growth of about 14% YoY (vs. its initial target of 13%), deposit growth
of about 12% YoY (below its initial target of 18% YoY), and total operating income of about
+21% YoY.
Price of newly issued shares 12,000 14,000 16,000 18,000 20,000 22,000 24,000 26,000
P/TBV of newly issued shares 1.02x 1.18x 1.35x 1.52x 1.69x 1.86x 2.03x 2.20x
0% 13,040 13,178 13,284 13,367 13,434 13,490 13,537 13,576
10% 10,201 10,618 10,954 11,231 11,462 11,659 11,828 11,974
20% 8,377 8,891 9,320 9,683 9,995 10,265 10,502 10,711
30% 7,106 7,647 8,109 8,510 8,860 9,169 9,443 9,688
40% 6,170 6,708 7,178 7,591 7,957 8,284 8,578 8,844
50% 5,452 5,975 6,438 6,851 7,221 7,556 7,859 8,135
60% 4,883 5,386 5,836 6,242 6,610 6,945 7,251 7,531
70% 4,422 4,903 5,337 5,733 6,094 6,425 6,730 7,011
80% 4,041 4,499 4,917 5,300 5,653 5,978 6,279 6,558
90% 3,720 4,157 4,558 4,929 5,271 5,589 5,884 6,160
100% 3,446 3,863 4,248 4,605 4,938 5,247 5,537 5,808
Loss
on
Leg
acy
Bad
Deb
ts
STB is guiding for PBT
VND2,2tn in PBT in 2018E. This
suggests low provisioning in
4Q18, which implies recoveries
on legacy assets.

Page 15
SACOMBANK
We forecast net interest income of VND 6,787 bn (+28.6% YoY), fee income of VND 2,822
bn (+7.6% YoY). Net interest margin (NIM) of 2.10% (vs 1.84% in 2017), and operating costs
of VND 7,069 bn (+11.6% YoY).
According to the restructuring plan approved by the SBV, STB has flexibility in provisioning
VAMC bonds and accrued interests based on its financial ability during the period 2015-2025.
However, we expect STB to continue increasing provisions for loans losses and VAMC bonds
to about VND 1,238 bn (+51.6% YoY) given the increased PPOP.
We forecast reported net income at VND 1,704 bn (+44.3% YoY). However, we also assume
a 20% management bonus of VND 59.1 bn and another VND 292 bn in bonus & welfare fund
payments in 2018. These “below the line” items are really operating costs, in our view. Thus,
we forecast net income attributable to common shareholders of VND 1,354 bn (+69.6% YoY)
in 2018, equivalent to adjusted EPS of VND 751.
In addition, STB has about 81.56 million treasury shares with total value at VND 750.9 bn,
which is equivalent to an initial investment cost at VND 9,200/share. At the current share price
at VND 11,950, STB could recognize about VND 196 bn in additional share premium if this
occurs, which would also improve its regulatory capital ratios.
Ongoing NPL workout is a key trend to watch. In 2017, STB resolved VND 19,665 bn
(USD 840 mn) of NPLs (including VND 15,365 bn under the restructuring plan). Specifically,
the Bank liquidated VND 2,786 bn of collateral, selling VND 2,608 bn of debt at market price
and collecting VND 14,271 bn of bad debts sold to VAMC and other receivables. Provisioning
and the allocation of accrued interest in 2017 exceeded 35.1% of the restructuring plan’s
objectives for that year.
STB sold three industrial parks in Long An province to Him Lam in 2017 at VND 9,200 bn.
However, under the terms of the deal, STB received only VND 920 bn as a deposit and another
VND 8,280 bn will be paid over the next 7 years as an installment payment, with annual
interest of 7.5% to be paid on the principal. We view such an outcome positively overall,
although such an installment payment methodology also poses a risk for STB (i.e., in terms of
its ability to collect).
STB has indicated that it will take drastic measures to shorten the bad debt workout process
with the goal of recovering VND 15 tn (USD 640 mn) of bad debt in 2018E. However, the
road ahead is a long one, and we think that STB’s ability to pay a dividend is highly at risk
until the restructuring progress is complete, which ceteris paribus is likely to last at least
another three years.
Loan growth
Following the painful Southern Bank merger, loan growth decelerated in 2016 (7% YoY vs.
industry average of 18.7% YoY) and 2017 (12.1% YoY vs. 18.2% YoY) as the Bank has
focused on resolving bad debts that resulted from the merger. However, the growth rate has
improved to reach 13.6% YTD in 3Q18A, higher than the 11.0% YTD average growth rate of
STB’s listed peers, according to FiinPro. Sacombank’s credit growth target from the SBV is
about 14% in 2018E. Given STB’s low LDR and government policy allowing higher-than-
average loan growth for banks that have acquired weak peers, we expect the loan growth to
average 14.6% in 2018-20E.
Loan growth: 14.6% on
average in the 2018-20E

Page 16
SACOMBANK
Source: Company Data, Yuanta Vietnam Research estimates
Source: Company Data, Yuanta Vietnam Research estimates
Deposit growth
In line with asset growth, STB’s deposit growth increased slightly from 2016A (11.7% YoY)
to 3Q18A (14.3% YoY). We estimate deposit growth to average 10.4% YoY in 2018-20E.
Time deposits account for 85.5% of the bank’s total deposits as of 3Q.18; while, demand
deposits represent 14.5%, which is just slightly below the median of listed banks (15%). Total
demand deposits of STB (VND 51.9 tn) ranked 5th place among listed banks in terms of
absolute value, just behind VCB (VND 216.7 tn), BID (VND 157.6 tn), CTG (VND 113.7 tn),
and MBB (VND 76.4 tn).
Loan/deposit ratio (LDR) is below the average of its peers
Loan to deposit ratio has been flat at around 70% since 2016, which is lower than that listed
bank average of 88.4%. In large part, this is a reflection of the large balance sheet items that
are not earning interest (i.e., the VAMC exposure and interest receivables, which represent
non-performing assets). In other words, the Bank is earning less than it would if its asset
quality were normalized. Additionally, STB has been in a restructuring period which has also
impacted the acceleration of loan growth. However, in the longer term, it also means that STB
has a longer runway to increase LDR and boost NIM compared to other banks, the LDRs of
which have typically already reached or exceeded the regulatory limit (80% for non-state
commercial banks and 90% for state-owned commercial banks).
Source: Company Data, Yuanta Vietnam Research estimates
Source: Bloomberg
Net interest margin (NIM) has improved
NIM is approximately 1.82%, lower than the NIMs of listed peers which average 3.18% as of
3Q.18. However, STB’s NIM has improved meaningfully from 1.44% in 2016 to nearly 1.82%
as of 3Q18, and we expect it to reach 2.23% on average in 2018-20E as LDR ramps up and
more of the bank’s capital is appropriated to interest-earning assets.
13.7%
11.0%10.0% 9.2%
9.1%
0%
5%
10%
15%
100,000
200,000
300,000
400,000
500,000
600,000
FY16 FY17 FY18E FY19E FY20E
Asset growth
Assets (LHS) Asset growth (RHS)
VND bn
7.0%
12.1%
14.5%15.2% 14.0%
0%
5%
10%
15%
20%
100,000
150,000
200,000
250,000
300,000
350,000
400,000
FY16 FY17 FY18E FY19E FY20E
Loan GrowthGross Loans (LHS)Gross Loan growth (RHS)
VND bn
11.7%
9.7%
12.7%
9.0% 9.5%
4.0%
6.0%
8.0%
10.0%
12.0%
14.0%
16.0%
100,000
150,000
200,000
250,000
300,000
350,000
400,000
450,000
FY16 FY17 FY18E FY19E FY20E
Deposit Growth
Deposits (LHS)
Deposits Growth (RHS)
VND bn
77%
94%
105%
82%88%
83% 84%
99%103%
77%
90%84%
94%102%
63%70%
0%
20%
40%
60%
80%
100%
120%
VC
B
BID
CTG
AC
B
TCB
HD
B
MBB
VPB VIB
LPB
TPB
EIB
KLB
SHB
NV
B
STB
Loan/Deposit Ratio
Deposit growth: 10.4% on
average in the 2018-20E
We expect LDR to approach
regulatory limit of 80%

Page 17
SACOMBANK
Fee income to play a more significant role
Net non-interest income has increasingly become a revenue growth driver for the Bank. Non-
interest income accounted for 38.9% of total revenues in 2017A, with client services revenue
alone accounting for about 30.3% of total revenues. We expect net non-interest income and
especially fee income to continue increasing its contribution to the total net revenue, growing
by 19.5% CAGR in 2018-20E and accounting for 27.5% of total revenues on average in the
same period. This should help the Bank to smooth earnings amidst the potential interest rate
volatility; moreover, it is a key ROE driver given the limited additional capital commitment
to this type of business.
Cost to Income ratio (CIR): High, but falling
STB’s cost to income ratio (CIR) is relatively high at 67.5% vs the peer average of 42% as of
3Q18A. However, we attribute this performance largely to the effects of Southern Bank
merger. STB’s CIR averaged 53% in 2010-14, prior to the merger. Moreover, the bank’s
efficiency has improved substantially since 2016, with adjusted CIR falling from 87.5%
(2016) to 77.7% (2017). We expect this to decline to 67.6% on average in 2018-20E.
Source: Company Data, Yuanta Vietnam Research estimates
Source: Company Data, Yuanta Vietnam Research estimates
Source: Company Data, Yuanta Vietnam Research estimates
Source: Company Data, Yuanta Vietnam Research estimates
Credit quality: Weak, but improving
The restructuring is under way, but admittedly there is still a long road ahead. Non-performing
loans (NPLs) ratio declined considerably from 2016 (6.9%) to only 3.2% as of 3Q18.
However, this does not include bad debts that sold to the VAMC, which were a net VND 38.9
tn (USD 1.67 bn) as of 3Q18A. Including the VAMC assets would raise the NPL ratio to
13.3% as of 3Q18A (extremely high, obviously, but down from 15.8% in 2016A). In addition,
if including accrued interests of about VND19.8 tn (USD 888 mn), the total NPL ratio could
increase to 20.9% as of 3Q18A, decreasing from 26.4% in 2016A. For this exercise, we
consider the legacy bad debt to be loans (NPLs) both for the numerator and the denominator,
1.62%1.84%
2.10% 2.18%2.42%
0.00%
0.50%
1.00%
1.50%
2.00%
2.50%
3.00%
FY16 FY17 FY18E FY19E FY20E
Net Interest Margin (NIM) %
87.5%77.7%
71.3%67.7%
64.1%
0.0%
20.0%
40.0%
60.0%
80.0%
100.0%
FY16 FY17 FY18E FY19E FY20E
Adjusted Cost to Income Ratio (CIR)
38.4% 38.9%35.0% 35.4% 34.4%
0.0%
10.0%
20.0%
30.0%
40.0%
50.0%
60.0%
70.0%
FY16 FY17 FY18E FY19E FY20E
Revenue Breakdown% Net Interest Income % Net Non-interest income
0.0%
20.0%
40.0%
60.0%
80.0%
100.0%
FY13 FY14 FY15 FY16 FY17 FY18E FY19E FY20E
Revenue Trend
% Net Interest Income % Net Services Income

Page 18
SACOMBANK
resulting in NPL percentages that are slightly below the numbers we have seen reported in the
media. Presumably the media are only adding the NPLs to the numerator. Under the
restructuring plan, the State Bank of Vietnam allows STB to resolve its NPLs over 10 years;
however, STB aims to handle in 3 to 5 years.
STB’s asset/equity ratio has increased from 14.9x in 2016A to 16.9x in 3Q18A, which is quite
high. This is partly due to high accounts receivable, especially accrued interest, which mostly
consists of bad debt. Accrued interest/asset ratio of Sacombank stands at 5.94%, which is far
higher than the average of its peers (1.29%); however, this line too has improved since 2016
(7.63%).
Category 2-5 NPLs have fallen substantially from VND 16.34 tn (USD 701 mn) in 2016A to
VND 9.21 tn (USD 395 mn) in 3Q18A, a decrease of 43.6% in that timeframe.
Real estate properties that STB is offering for bid
Properties
Location
Area (m2)
Bidding value (VND bn)
Phong Phu Industrial Zone Binh Chanh, HCMC 1,340,000 7,600
Binh Tri Dong Residential Area Binh Tan, HCMC 534,124 6,698
Residential Area Long Binh, District 9, HCMC 164,950 1,815
Residential Area Binh Thuy, Can Tho Province 602,225 4,565
61-63A Nam Ky Khoi Nghia District 1, HCMC 800 811
Manufacturing land Tan Phu District, HCMC 6,327 413
36/70 D2 street Binh Thanh District, HCMC 6,382 447
Source: Company Data, Yuanta Vietnam Research estimates
Source: Company Data, Yuanta Vietnam Research estimates
Source: Company Data, Yuanta Vietnam Research estimates
Source: Company Data, Yuanta Vietnam Research estimates
0.0%
2.0%
4.0%
6.0%
8.0%
5,000
7,000
9,000
11,000
13,000
15,000
FY16 FY17 FY18E FY19E FY20E
Internal NPLs
Internal NPLs (VND bn) (LHS)
Internal NPLs Ratio (RHS)
10.0%
15.0%
20.0%
25.0%
30.0%
20,000
30,000
40,000
50,000
60,000
70,000
80,000
90,000
FY16 FY17 FY18E FY19E FY20E
Total NPL Ratio including VAMC bonds + Acrrued Interests
Total NPLs Total NPL ratio
6,800 7,000 7,200 7,400 7,600 7,800 8,000 8,200 8,400 8,600
2016 2017 3Q.18
NPL category 5VND bn
5,000
8,000
11,000
14,000
17,000
2016 2017 3Q.18
NPL category 2-5VND bn
Page 19
SACOMBANK
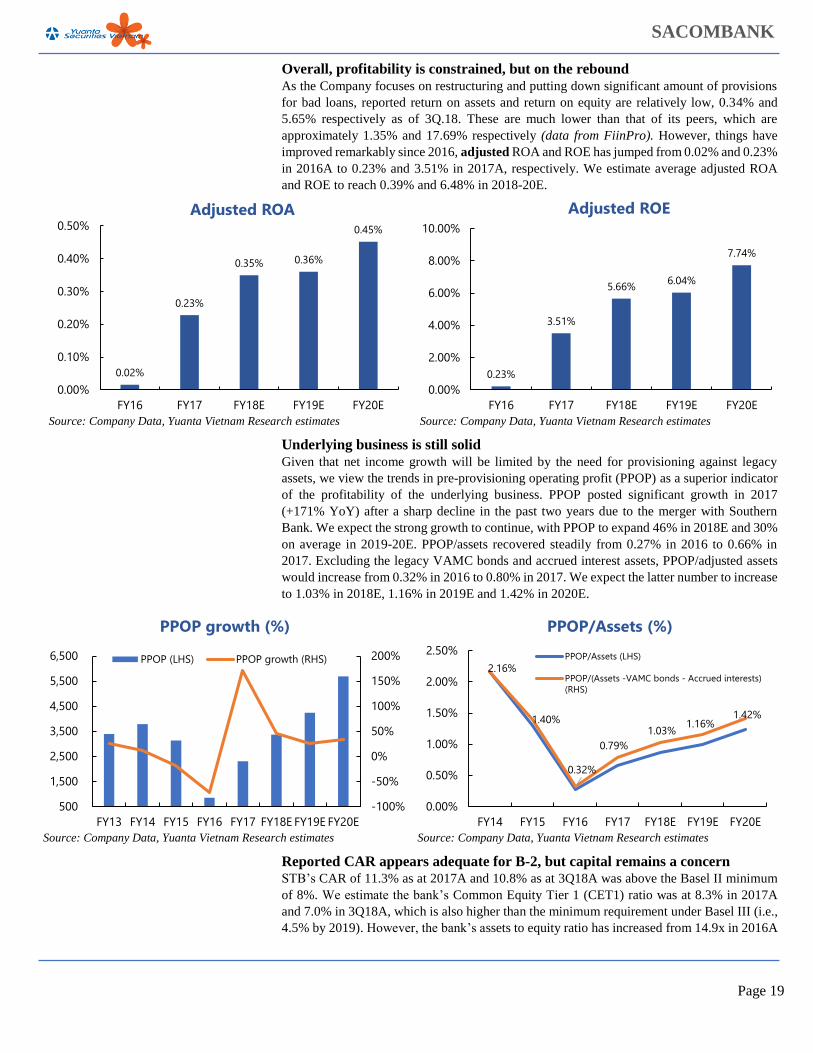
Overall, profitability is constrained, but on the rebound
As the Company focuses on restructuring and putting down significant amount of provisions
for bad loans, reported return on assets and return on equity are relatively low, 0.34% and
5.65% respectively as of 3Q.18. These are much lower than that of its peers, which are
approximately 1.35% and 17.69% respectively (data from FiinPro). However, things have
improved remarkably since 2016, adjusted ROA and ROE has jumped from 0.02% and 0.23%
in 2016A to 0.23% and 3.51% in 2017A, respectively. We estimate average adjusted ROA
and ROE to reach 0.39% and 6.48% in 2018-20E.
Source: Company Data, Yuanta Vietnam Research estimates
Source: Company Data, Yuanta Vietnam Research estimates
Underlying business is still solid
Given that net income growth will be limited by the need for provisioning against legacy
assets, we view the trends in pre-provisioning operating profit (PPOP) as a superior indicator
of the profitability of the underlying business. PPOP posted significant growth in 2017
(+171% YoY) after a sharp decline in the past two years due to the merger with Southern
Bank. We expect the strong growth to continue, with PPOP to expand 46% in 2018E and 30%
on average in 2019-20E. PPOP/assets recovered steadily from 0.27% in 2016 to 0.66% in
2017. Excluding the legacy VAMC bonds and accrued interest assets, PPOP/adjusted assets
would increase from 0.32% in 2016 to 0.80% in 2017. We expect the latter number to increase
to 1.03% in 2018E, 1.16% in 2019E and 1.42% in 2020E.
Source: Company Data, Yuanta Vietnam Research estimates Source: Company Data, Yuanta Vietnam Research estimates
Reported CAR appears adequate for B-2, but capital remains a concern
STB’s CAR of 11.3% as at 2017A and 10.8% as at 3Q18A was above the Basel II minimum
of 8%. We estimate the bank’s Common Equity Tier 1 (CET1) ratio was at 8.3% in 2017A
and 7.0% in 3Q18A, which is also higher than the minimum requirement under Basel III (i.e.,
4.5% by 2019). However, the bank’s assets to equity ratio has increased from 14.9x in 2016A
0.02%
0.23%
0.35% 0.36%
0.45%
0.00%
0.10%
0.20%
0.30%
0.40%
0.50%
FY16 FY17 FY18E FY19E FY20E
Adjusted ROA
0.23%
3.51%
5.66% 6.04%
7.74%
0.00%
2.00%
4.00%
6.00%
8.00%
10.00%
FY16 FY17 FY18E FY19E FY20E
Adjusted ROE
-100%
-50%
0%
50%
100%
150%
200%
500
1,500
2,500
3,500
4,500
5,500
6,500
FY13 FY14 FY15 FY16 FY17 FY18E FY19E FY20E
PPOP growth (%)
PPOP (LHS) PPOP growth (RHS)2.16%
1.40%
0.32%
0.79%1.03%
1.16%1.42%
0.00%
0.50%
1.00%
1.50%
2.00%
2.50%
FY14 FY15 FY16 FY17 FY18E FY19E FY20E
PPOP/Assets (%)
PPOP/Assets (LHS)
PPOP/(Assets -VAMC bonds - Accrued interests)(RHS)

Page 20
SACOMBANK
to 16.9x in 3Q18A, which is quite high. This is partly due to its high level of accounts
receivable, especially accrued interest (i.e., mostly bad debt).
Thus, we believe that capital requirements could be a risk for investors, especially under a
strict CAR calculation of Basel II to be adopted by 2019. Thus, the Bank might need to
decrease its leverage by increasing its capital (preferably Common Equity Tier 1 capital, in
our view) to ensure adequate safety. In any case, given the low CAR level and the bank’s
ongoing restructuring, we do not expect the Bank to pay a dividend on 2018E earnings and
the issue may impair its ability to pay a dividend in subsequent years as well (although we
have penciled in a modest 5% payout on 2019E earnings).
Source: Company Data, Bloomberg
Source: Company Data, Yuanta Vietnam Research estimates
COMPANY BACKGROUND
SaiGon Thuong Tin Commercial Joint Stock Bank (STB) is a private commercial bank that
specialized in SME lending. In 2015, the Bank merged with Southern Bank, becoming the top
5 largest commercial banks in terms of total assets, shareholder equity, and networks. 2017
was the first year that Sacombank proceed with the Restructuring Program approved by the
State Bank after merging with Southern Bank. The Bank’s development strategy will continue
to base on retail business, focusing strongly on “quality” instead of “quantity”. The main goals
in the next few years concentrate on handling bad debts (or Non-performing loans- NPLs),
raising capital and improving business operations to adapt Basel II accords.
Sacombank was founded in 1991, which was one of the first commercial bank that was
established in Ho Chi Minh City (HCMC). It operates a primarily retail banking business with
a wide branch network across Vietnam and also has branches in Laos and Cambodia. A merger
with the former Southern Bank in 2015 resulted in substantial asset quality woes, a challenge
that management is now addressing with strong support from government policy.
Loans are the heart of the Bank. Sacombank’s business model, just like many other banks
in Vietnam, is a prototypical bank. Loans are the heart of the Bank. As of 3Q.18, 61.8% of
Sacombank’s assets are loans, followed by securities investments at 19.5% (this includes VND
40.99 tn or 10.2% of assets in zero-interest VAMC bonds). Deposits are the main component
of the Bank’s liabilities, with deposit/liabilities ratio is 94%.
Sacombank went public in 2006, and the stock price is currently traded at VND 11,950 per
share. Its market cap is about VND 21.5 tn (USD 920 mn). Its TTM P/TBV multiple is about
1.12x against medians of 1.97x for our set of comparable banks (Vietcombank (VCB), BIDV
Bank (BID), Vietinbank (CTG), Asia Commercial Bank (ACB), Techcombank (TCB), and
HDBank (HDB)). These multiples are based on our estimates and consensus data from
Bloomberg for the companies and do not reflect adjustments for excess or deficit capital.
9.51% 9.61%
11.30%
10.80%
8.5%
9.0%
9.5%
10.0%
10.5%
11.0%
11.5%
2015 2016 2017 3Q.2018
Capital Adequacy Ratio (CAR)
8.3%
7.0%
5.0%
6.0%
7.0%
8.0%
9.0%
2017 3Q.2018
Common Equity Tier 1 (CET1) ratio

Page 21
SACOMBANK
Sacombank was in the top 3 with highest card transaction volume presented by Visa, a leading
bank in deploying touchtech payment, and top 3 with highest volume of card transactions in
Vietnam in 2017.
In 2018, Sacombank was awarded by International Card Organization JCB (Japan) as the
leading bank in card spending, in card revenue growth, in the number of issued cards, and in
the new issued cards. It was also awarded as the Outstanding E-banking by Vietnam Banking
Association (VNBA) and IDG group. As of now, STB has more than 1.3 million people using
internet banking services, and more than 1.1 million people using mobile banking services,
with total transaction value of VND 110 tn monthly. Total customer is about 4.3 million
customers in all branches and it currently has the largest networks with 566 branches and
offices in Vietnam and Lao.
In 2018-2020, Sacombank aims to improve infrastructure to promote retail business and
revenue from services to contribute to the overall profitability of the Bank. We expect services
income to contribute 27.5% on average to the total operating income in 2018-20E, reducing
exposure to loan growth.
Cashless payment will dominate the payment system in the future, and effective e-banking
service like STB will gain significant market share. Bancassurance business also contribute a
big portion to the total fee and commission incomes as demand to buy insurances to hedge
against any unpredictable events. Sacombank and Dai-ichi Life Insurance Vietnam Company
signed an exclusive insurance agency contract in 2017 with a 20-year term, which is
considered the longest deal in the Bancassurance field in Vietnam.
Source: Bloomberg
Source: Bloomberg
4.9%
3.5%
1.9%
1.0%
0.8%
0.7%
0.6%
0.5%0.2%
0.2%
85.8%
Major ShareholdersVietnam Export Import Commercial JS Bank
Duong Cong Minh (Chairman)
Tram Khai Hoa
PYN Rahastoyhtio Oy
Korea Investment Management Co.
VietFund Management Ltd
Van Eck Associates Corp.
Duong Hoang Quynh Nhu
BlackRock Inc
Eaton Vance Corp.
Others
(100)
(50)
0
50
100
150
200
250
300
350
01/15 01/16 01/17 01/18 01/19
(2015/01/01=0) STB's Stock price performance vs Peers Since 2015
STB VN EQUITY VCB VN EQUITY CTG VN EQUITYMBB VN EQUITY ACB VN EQUITY BID VN EQUITY

Page 22
SACOMBANK
Balance Sheet (Quarterly) (VND bn) 3Q.17A 4Q.17A 1Q.18A 2Q.18A 3Q.18A 4Q.18E QoQ % YoY %
Cash and equivalents: 16,039 9,213 17,296 17,555 19,725 10,451 -47.0% 13.4%
Loans and Advances to Banks: 2,164 7,375 5,236 6,813 1,856 7,741 317.1% 5.0%
ST & Long-Term Investments: 74,766 73,438 76,811 79,094 78,823 78,398 -0.5% 6.8%
Gross Loans: 223,016 222,947 229,441 246,691 253,392 255,367 0.8% 14.5%
(-) Specific Provisions: 825 1,046 1,178 1,336 1,761 1,192 -32.3% 14.0%
(-) General Provisions: 1,704 1,732 1,669 1,790 2,083 1,915 -8.0% 10.6%
Total provisions: 2,529 2,778 2,847 3,126 3,844 3,108 -19.2% 11.9%
Net Loans: 220,487 220,169 226,594 243,565 249,548 252,260 1.1% 14.6%
Property, Plant and Equipment (PP&E): 4,470 4,475 4,515 4,518 4,500 4,698 4.4% 5.0%
Intangible Assets: 3,598 3,626 3,620 3,633 3,609 3,626 0.5% 0.0%
Other Assets: 41,964 50,385 47,180 45,507 45,541 48,131 5.7% -4.5%
Total Assets: 363,488 368,681 381,252 400,685 403,602 405,379 0.4% 10.0%
Deposits: 312,561 319,860 339,235 355,860 357,220 360,371 0.9% 12.7%
Due to Banks:
15,491
12,880
5,633
4,188
4,650
12,880 177% 0%
Subordinated Notes: 5,717 5,601 5,565 8,185 8,121 8,120 0.0% 45%
Investment Trust; Derivatives & others: 46 91 91 101 89 104 16.9% 14.5%
Other Liabilities: 6,890 7,020 7,059 8,702 9,743 (686) -107% -110%
Total Liabilities: 340,705 345,452 357,583 377,036 379,823 380,789 0.3% 10.2%
Share Capital & Share Premium: 18,167 18,167 18,167 18,167 18,167 18,167 0.0% 0.0%
Reserves: 2,519 2,550 2,550 2,719 2,719 2,784 2.4% 9.2%
Retained Earnings: 1,918 2,277 2,688 2,501 2,664 3,640 36.6% 59.9%
Others: 179 234 266 262 231 0 -100% -100%
Total Equity: 22,783 23,228 23,671 23,649 23,781 24,590 3.4% 5.9%
Total Liabilities & Equity: 363,488 368,680 381,254 400,685 403,604 405,379 0.4% 10.0%
Income Statement (Quarterly) (VND bn) 3Q.17A 4Q.17A 1Q.18A 2Q.18A 3Q.18A 4Q.18E QoQ % YoY %
Net Interest Income 1,696 1,519 1,672 1,781 2,070 1,264 -38.9% -16.8%
Interest Income 5,852 5,775 6,046 6,385 6,910 5,947 -13.9% 3.0%
Interest Expense 4,156 4,256 4,374 4,604 4,840 4,683 -3.2% 10.0%
Non-Interest Income 541 1,526 671 887 875 1,217 39.1% -20.3%
Net Fee and Commission income: 456 1,328 544 589 626 1,063 69.8% -19.9%
Other Income 85 198 127 298 249 154 -38.2% -22.4%
Total Operating Income 2,237 3,045 2,343 2,668 2,945 2,481 -15.8% -18.5%
Total Operating Costs 1,648 1,988 1,759 1,744 1,963 1,603 -18.3% -19.4%
Pre-Provision Profit 589 1,057 584 924 982 878 -10.6% -17.0%
Cummulated Pre-Provision Profit 1,251 2,308 584 1,508 2,490 3,368 35.3% 45.9%
Provisions 139 592 81 433 664 60 -91.0% -89.9%
Profit Before Tax 450 466 503 491 318 819 157.5% 75.8%
Income Tax 143 55 107 121 155 43 -72.3% -22.2%
Net Profit 307 411 396 370 163 775 375.5% 88.8%
Cummulated net profit 771 1,182 396 766 929 1,704 83.4% 44.2%

Page 23
SACOMBANK
Selected Calculated Ratios (Quarterly) 3Q.17A 4Q.17A 1Q.18A 2Q.18A 3Q.18A 4Q.18E
GROWTH PROJECTIONS
Quarterly (QoQ %)
Net interest income 67.8% -10.4% 10.1% 6.5% 16.2% -38.9%
Non-interest Income -18.6% 182.1% -56.0% 32.2% -1.4% 39.1%
Operating costs 24.6% 20.6% -11.5% -0.9% 12.6% -18.3%
Provision 59.8% 325.6% -86.3% 434.6% 53.3% -91.0%
Pre-provision profit 66.9% 79.5% -44.8% 58.2% 6.3% -10.6%
Net profit 21.3% 33.7% -3.5% -6.6% -55.9% 375.7%
Assets 2.1% 1.4% 3.4% 5.1% 0.7% 0.4%
Yearly (YoY %)
Net interest income 77.2% 16.0% 58.9% 76.2% 22.1% -16.8%
Non-interest Income -21.7% 109.9% 5.7% 33.4% 61.7% -20.3%
Other Income -75.3% -37.6% -49.6% 43.3% 192.9% -22.4%
Operating costs 8.8% 43.8% 27.6% 31.8% 19.1% -19.4%
Provision -357.4% -16.4% -8200.0% 397.7% 377.7% -89.9%
Pre-provision profit 342.9% 61.8% 89.0% 161.8% 66.7% -16.9%
Net profit 104.7% -735.8% 87.7% 46.2% -46.9% 88.9%
Assets 13.6% 10.6% 10.7% 12.6% 11.0% 10.0%
ASSET ANALYSIS
Net interest income / average IEAs (NIM) (Quarterly) 0.57% 0.50% 0.54% 0.55% 0.62% 0.37%
Net interest income / average IEAs (NIM) (TTM) 1.79% 1.81% 1.95% 2.11% 2.21% 2.08%
Earning assets to total assets 82.5% 82.4% 81.7% 83.0% 82.8% 84.2%
Average loans to average earning assets 74.5% 73.9% 73.5% 73.9% 75.0% 75.3%
LOAN ANALYSIS
Loan growth (QoQ %) 2.0% 0.0% 2.9% 7.5% 2.7% 0.8%
Loan growth (YoY %) 14.3% 12.1% 11.2% 12.9% 13.6% 14.5%
DEPOSIT ANALYSIS
Deposit growth (QoQ %) -1.4% 2.3% 6.1% 4.9% 0.4% 0.9%
Deposit growth (YoY %) 9.5% 9.8% 11.9% 12.2% 14.3% 12.7%
Deposits to Interest Bearing Liabilities 92.7% 93.2% 96.5% 96.9% 94.4% 94.8%
LIQUIDITY
LDR 71.4% 69.7% 67.6% 69.3% 70.9% 70.9%
ASSET QUALITY
NPL ratio 5.95% 4.16% 4.01% 3.70% 3.18% 3.16%
General Provisions to net loans 0.77% 0.79% 0.74% 0.74% 0.83% 0.76%
SPREAD ANALYSIS
Interest rate received on Average IEA 1.97% 1.91% 1.97% 1.98% 2.07% 1.76%
Interest rate paid on Average IBL 1.23% 1.24% 1.24% 1.25% 1.28% 1.23%
Interest rate spread 0.74% 0.67% 0.72% 0.73% 0.79% 0.53%
OTHER INCOME
Non-interest income to total income 24.2% 50.1% 28.6% 33.2% 29.7% 49.1%
Fees to non-interest income 84.3% 87.0% 81.1% 66.4% 71.5% 87.3%
Fees to total income 20.4% 43.6% 23.2% 22.1% 21.3% 42.8%
OPERATING EFFICIENCY
Cost to income ratio 74% 65% 75% 65% 67% 65%
PROFITABILITY
ROA 0.09% 0.11% 0.11% 0.09% 0.04% 0.19%
ROE 1.36% 1.78% 1.69% 1.56% 0.69% 3.21%
Pre-provision ROE 2.60% 4.60% 2.49% 3.91% 4.14% 3.63%
Pre-provision ROA 0.16% 0.29% 0.16% 0.24% 0.24% 0.22%
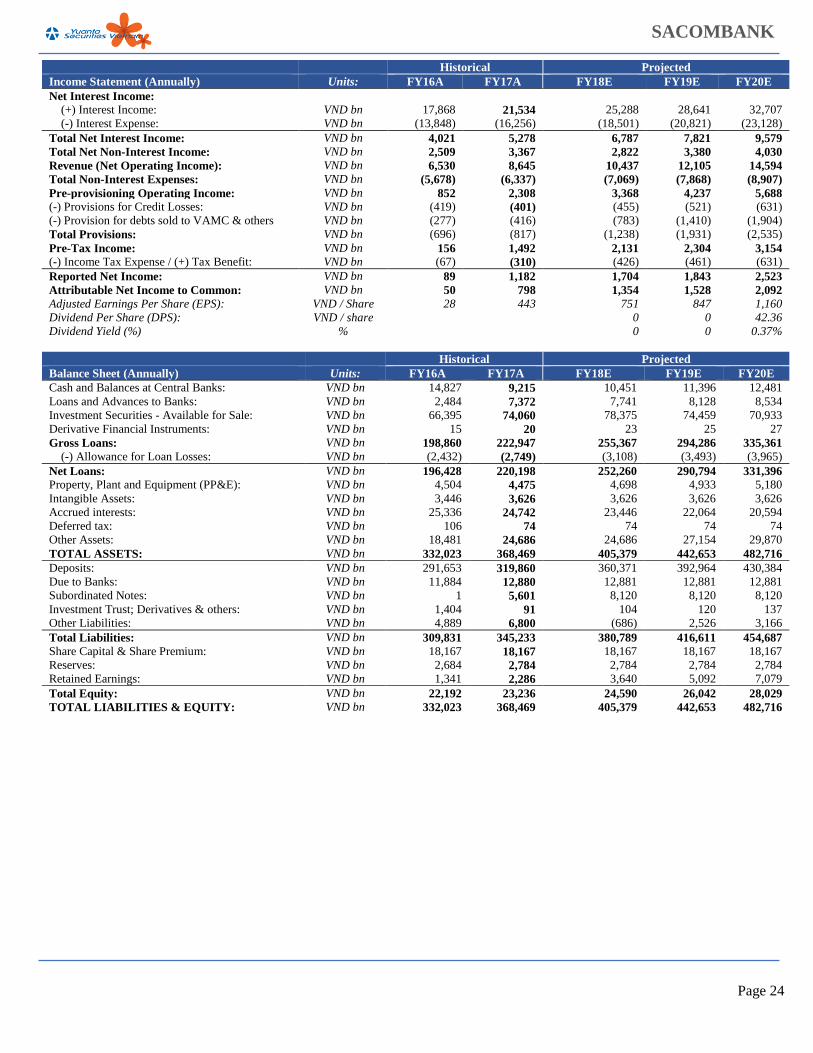
Page 24
SACOMBANK
Historical Projected
Income Statement (Annually) Units: FY16A FY17A FY18E FY19E FY20E
Net Interest Income:
(+) Interest Income: VND bn 17,868 21,534 25,288 28,641 32,707
(-) Interest Expense: VND bn (13,848) (16,256) (18,501) (20,821) (23,128)
Total Net Interest Income: VND bn 4,021 5,278 6,787 7,821 9,579
Total Net Non-Interest Income: VND bn 2,509 3,367 2,822 3,380 4,030
Revenue (Net Operating Income): VND bn 6,530 8,645 10,437 12,105 14,594
Total Non-Interest Expenses: VND bn (5,678) (6,337) (7,069) (7,868) (8,907)
Pre-provisioning Operating Income: VND bn 852 2,308 3,368 4,237 5,688
(-) Provisions for Credit Losses: VND bn (419) (401) (455) (521) (631)
(-) Provision for debts sold to VAMC & others VND bn (277) (416) (783) (1,410) (1,904)
Total Provisions: VND bn (696) (817) (1,238) (1,931) (2,535)
Pre-Tax Income: VND bn 156 1,492 2,131 2,304 3,154
(-) Income Tax Expense / (+) Tax Benefit: VND bn (67) (310) (426) (461) (631)
Reported Net Income: VND bn 89 1,182 1,704 1,843 2,523
Attributable Net Income to Common: VND bn 50 798 1,354 1,528 2,092
Adjusted Earnings Per Share (EPS): VND / Share 28 443 751 847 1,160
Dividend Per Share (DPS): VND / share 0 0 42.36
Dividend Yield (%) % 0 0 0.37%
Historical Projected
Balance Sheet (Annually) Units: FY16A FY17A FY18E FY19E FY20E
Cash and Balances at Central Banks: VND bn 14,827 9,215 10,451 11,396 12,481
Loans and Advances to Banks: VND bn 2,484 7,372 7,741 8,128 8,534
Investment Securities - Available for Sale: VND bn 66,395 74,060 78,375 74,459 70,933
Derivative Financial Instruments: VND bn 15 20 23 25 27
Gross Loans: VND bn 198,860 222,947 255,367 294,286 335,361
(-) Allowance for Loan Losses: VND bn (2,432) (2,749) (3,108) (3,493) (3,965)
Net Loans: VND bn 196,428 220,198 252,260 290,794 331,396
Property, Plant and Equipment (PP&E): VND bn 4,504 4,475 4,698 4,933 5,180
Intangible Assets: VND bn 3,446 3,626 3,626 3,626 3,626
Accrued interests: VND bn 25,336 24,742 23,446 22,064 20,594
Deferred tax: VND bn 106 74 74 74 74
Other Assets: VND bn 18,481 24,686 24,686 27,154 29,870
TOTAL ASSETS: VND bn 332,023 368,469 405,379 442,653 482,716
Deposits: VND bn 291,653 319,860 360,371 392,964 430,384
Due to Banks: VND bn 11,884 12,880 12,881 12,881 12,881
Subordinated Notes: VND bn 1 5,601 8,120 8,120 8,120
Investment Trust; Derivatives & others: VND bn 1,404 91 104 120 137
Other Liabilities: VND bn 4,889 6,800 (686) 2,526 3,166
Total Liabilities: VND bn 309,831 345,233 380,789 416,611 454,687
Share Capital & Share Premium: VND bn 18,167 18,167 18,167 18,167 18,167
Reserves: VND bn 2,684 2,784 2,784 2,784 2,784
Retained Earnings: VND bn 1,341 2,286 3,640 5,092 7,079
Total Equity: VND bn 22,192 23,236 24,590 26,042 28,029
TOTAL LIABILITIES & EQUITY: VND bn 332,023 368,469 405,379 442,653 482,716
Page 25
SACOMBANK
APPENDIX I: TERMS FOR PROVISION OF REPORT, DISCLAIMERS AND
DISCLOSURES
Analyst Certification Each research analyst primarily responsible for the content of this research report, in whole or in part, certifies that with respect to each security or issuer that the analyst covered in this report: (1) all of the views expressed accurately reflect his or her personal views about those securities or issuers; and (2) no part of his or her compensation was, is, or will be, directly or indirectly, related to the specific recommendations or views expressed by that research analyst in the research report.
Ratings Total expected return within the next 12 months
BUY Above 20% HOLD Between -20% to +20% SELL Below 20%
BUY: We have a positive outlook on the stock based on our expected absolute or relative return over the investment period. Our thesis is based on our analysis of the company’s outlook, financial performance, catalysts, valuation and risk profile. We recommend investors add to their position. HOLD-Outperform: In our view, the stock’s fundamentals are relatively more attractive than peers at the current price. Our thesis is based on our analysis of the company’s outlook, financial performance, catalysts, valuation and risk profile. HOLD-Underperform: In our view, the stock’s fundamentals are relatively less attractive than peers at the current price. Our thesis is based on our analysis of the company’s outlook, financial performance, catalysts, valuation and risk profile. SELL: We have a negative outlook on the stock based on our expected absolute or relative return over the investment period. Our thesis is based on our analysis of the company’s outlook, financial performance, catalysts, valuation and risk profile. We recommend investors reduce their position. Under Review: We actively follow the company, although our estimates, rating and target price are under review. Restricted: The rating and target price have been suspended temporarily to comply with applicable regulations and/or Yuanta policies. Note: Yuanta research coverage with a Target Price is based on an investment period of 12 months. Greater China Discovery Series coverage does not have a formal 12 month Target Price and the recommendation is based on an investment period specified by the analyst in the report.
Global Disclaimer © 2018 Yuanta. All rights reserved. The information in this report has been compiled from sources we believe to be reliable, but we do not hold ourselves responsible for its completeness or accuracy. It is not an offer to sell or solicitation of an offer to buy any securities. All opinions and estimates included in this report constitute our judgment as of this date and are subject to change without notice. This report provides general information only. Neither the information nor any opinion expressed herein constitutes an offer or invitation to make an offer to buy or sell securities or other investments. This material is prepared for general circulation to clients and is not intended to provide tailored investment advice and does not take into account the individual financial situation and objectives of any specific person who may receive this report. Investors should seek financial advice regarding the appropriateness of investing in any securities, investments or investment strategies discussed or recommended in this report. The information contained in this report has been compiled from sources believed to be reliable but no representation or warranty, express or implied, is made as to its accuracy, completeness or correctness. This report is not (and should not be construed as) a solicitation to act as securities broker or dealer in any jurisdiction by any person or company that is not legally permitted to carry on such business in that jurisdiction. Yuanta research is distributed in the United States only to Major U.S. Institutional Investors (as defined in Rule 15a-6 under the Securities Exchange Act of 1934, as amended and SEC staff interpretations thereof). All transactions by a US person in the securities mentioned in this report must be effected through a registered broker-dealer under Section 15 of the Securities Exchange Act of 1934, as amended. Yuanta research is distributed in Taiwan by Yuanta Securities Investment Consulting. Yuanta research is distributed in Hong Kong by Yuanta Securities (Hong Kong) Co. Limited, which is licensed in Hong Kong by the Securities and Futures Commission for regulated activities, including Type 4 regulated activity (advising on securities). In Hong Kong, this research report may not be redistributed, retransmitted or disclosed, in whole or in part or and any form or manner, without the express written consent of Yuanta Securities (Hong Kong) Co. Limited.

Page 26
SACOMBANK
YUANTA SECURITIES NETWORK
YUANTA SECURITIES VIETNAM OFFICE
Head office: 4th Floor, Saigon Centre, Tower 1, 65 Le Loi Boulevard, Ben Nghe Ward, District 1, HCMC, Vietnam
Institutional Research
Matthew Smith, CFA
Head of Research
Tel: +84 28 3622 6868 (ext. 3815)
Tanh Tran (Banks)
Analyst
Tel: +84 28 3622 6868 (3874)
Quang Vo
Analyst (Consumer)
Tel: +84 28 3622 6868 (ext. 3872)
Tam Nguyen
Analyst (Property)
Tel: +84 28 3622 6868 (ext. 3874)
Institutional Sales
Huy Nguyen Head of Institutional sales
Tel: +84 28 3622 6868 (3808)
Duyen Nguyen
Sales Trader
Tel: +84 28 3622 6868 (ext. 3890)