Sabotage vs Discouragement: Which Dominates Post …faculty.smu.edu/tsalmon/JS.pdf · Southern...
32
Sabotage vs Discouragement: Which Dominates Post Promotion Tournament Behavior? David Johnson y University of Calgary Timothy C. Salmon z Southern Methodist University April 2014 Abstract We explore the behavior of losers of promotion tournaments after the tournament is concluded. We do so through the use of an experiment in which we vary the design of the promotion tournament to determine how tournament design a/ects post tournament e/ort. We provide a theoretical model demonstrating two possible e/ects from the tournaments which are strategic sabotage and the possibility that a worker becomes discouraged by the tournament outcome. We examine behavior after the tournament and nd evidence suggesting that bad tournament design can lead to workers being discouraged. This discouragement e/ect is strong for low ability workers but not for high ability workers. On the other hand we do nd evidence that some high ability workers engage in strategic sabotage but the incidence does not vary with the design of the promotion tournament. JEL Codes: C90; C91; D03; J32; J33 Key Words: Sabotage, Experiment, Tournament Design 1 Introduction A central problem faced by employers is how to motivate employees to exert a desired level of e/ort. This problem is classically represented in the Principal-Agent problem. A variety of payment schemes have been developed as ways to incentivize e/ort. One common approach involves the use of promotion tournaments. This is also often known as promotion from within and many well known companies pride themselves on engaging in the practice (e.g. Walmart 1 , Fedex 2 , and UPS 3 ). Not only are promotion tournaments (theoretically) Thanks for helpful comments and suggestions provided by participatns at the International Meetings of the ESA in Zurich, the North American ESA meetings in Santa Cruz and the Southern Economic Association meetings in Tampa. Financial support for this project was provided by NSF. y University of Calgary, Department of Economics, 2500 University Dr NW, Suite 554 , Social Sciences, Calgary, Alberta, Canada T2N 1N4. [email protected], Phone: 403-220-5602. z Southern Methodist University, Department of Economics, 3300 Dyer Street, Suite 301 Umphrey Lee Center, Dallas, TX 75275-0496. [email protected], Phone: 214-768-3547, Fax: 214-768-1821. 1 Kavilanz, P. (2013). Wal-Mart: We promote 500 workers a day. cnnmoney. Retrieved 6/2013. From http://money.cnn.com/2013/06/07/news/companies/walmart-shareholder-meeting/index.html 2 FedEx Attributes Success to People-rst Philosophy. (2013). Retrieved 6/2013. From http://www.fedex.com/ma/about/overview/philosophy.html 3 Working at UPS (2013). Retrieved 6/2013. From https://ups.managehr.com/workingatupsfaq.htm 1
Transcript of Sabotage vs Discouragement: Which Dominates Post …faculty.smu.edu/tsalmon/JS.pdf · Southern...

Sabotage vs Discouragement: Which Dominates PostPromotion Tournament Behavior?∗
David Johnson†
University of CalgaryTimothy C. Salmon‡
Southern Methodist University
April 2014
AbstractWe explore the behavior of losers of promotion tournaments after the tournament is
concluded. We do so through the use of an experiment in which we vary the design ofthe promotion tournament to determine how tournament design affects post tournamenteffort. We provide a theoretical model demonstrating two possible effects from thetournaments which are strategic sabotage and the possibility that a worker becomesdiscouraged by the tournament outcome. We examine behavior after the tournamentand find evidence suggesting that bad tournament design can lead to workers beingdiscouraged. This discouragement effect is strong for low ability workers but not forhigh ability workers. On the other hand we do find evidence that some high abilityworkers engage in strategic sabotage but the incidence does not vary with the design ofthe promotion tournament.JEL Codes: C90; C91; D03; J32; J33Key Words: Sabotage, Experiment, Tournament Design
1 Introduction
A central problem faced by employers is how to motivate employees to exert a desired level ofeffort. This problem is classically represented in the Principal-Agent problem. A variety ofpayment schemes have been developed as ways to incentivize effort. One common approachinvolves the use of promotion tournaments. This is also often known as “promotion fromwithin” and many well known companies pride themselves on engaging in the practice(e.g. Walmart1, Fedex2, and UPS3). Not only are promotion tournaments (theoretically)∗Thanks for helpful comments and suggestions provided by participatns at the International Meetings of
the ESA in Zurich, the North American ESA meetings in Santa Cruz and the Southern Economic Associationmeetings in Tampa. Financial support for this project was provided by NSF.†University of Calgary, Department of Economics, 2500 University Dr NW, Suite 554 , Social Sciences,
Calgary, Alberta, Canada T2N 1N4. [email protected], Phone: 403-220-5602.‡Southern Methodist University, Department of Economics, 3300 Dyer Street, Suite 301 Umphrey Lee
Center, Dallas, TX 75275-0496. [email protected], Phone: 214-768-3547, Fax: 214-768-1821.1Kavilanz, P. (2013). Wal-Mart: We promote 500 workers a day. cnnmoney. Retrieved 6/2013. From
http://money.cnn.com/2013/06/07/news/companies/walmart-shareholder-meeting/index.html2FedEx Attributes Success to People-first Philosophy. (2013). Retrieved 6/2013. From
http://www.fedex.com/ma/about/overview/philosophy.html3Working at UPS (2013). Retrieved 6/2013. From https://ups.managehr.com/workingatupsfaq.htm
1

capable of inducing high effort among employees but some will also claim that there are alsoother advantages. Bidwell (2011), for example, notes that internal promotions are generallythought to be cheaper for the firm and are more likely to lead to higher quality employees.
While the theoretical properties of promotion mechanisms are clear (see Prendergast(1999)), in practice there can be a downside to these sorts of tournaments as they may createnegative emotional responses among the tournament losers. Negative emotional responsesfrom losing the tournament may lead to workers decreasing their work effort either becausethey are intentionally sabotaging their new bosses or because they have been demoralizedfrom exerting any more effort. While both effects might yield similar results, in terms oflower work effort, the steps a firm might take in response to prevent these two effects arequite different. Thus it is necessary to cleanly distinguish between these two responses (tolosing a tournament) to identify which, if either, drives post tournament behavior.
The existence of workplace sabotage is well documented and widespread. For the pur-poses of our discussion we will define sabotage as purposeful behavior intended to harmothers. Workplace sabotage manifests itself in many forms and stems from a variety ofmotives. Ambrose, Seabright, and Schminke (2002) and Giacalone and Rosenfeld (1987)provide background information on various sorts of workplace sabotage and discuss manyof the potential motives for such behavior. These include such things as: (1) powerlessness,(2) organization frustration, (3) facilitation of work, (4) boredom/fun, and (5) injustice.Chowdhury and Gürtler (2013) and Dechenaux, Kovenock, and Sheremeta (2012) provideextensive surveys of recent experimental and theoretical literature on contests and sabotage,providing numerous other examples of workplace sabotage. An important commonality inmuch of this literature is that the key issue examined is the extent of, or affect of, sabotagetaking place during the tournament (i.e. sabotage that is intended to effect the outcome ofthe tournament).4 Understanding this form of sabotage is certainly important and worthstudying but what seems to be much less studied in the literature is how the behavior afterthe tournament is effected by the outcome of the tournament. There is at least one excep-tion to this norm as McGee and McGee (2013) also examines post tournament behavior.There are important differences as well as similarities between that paper and ours but wewill defer a discussion of these issues until the conclusion.
There is clear evidence workplace sabotage is common during and after a tournament.This leads to two obvious questions: (1) why is it happening and (2) how can its incidence bereduced? It is claimed in some analyses (e.g. Hoad (1993) and Neuman and Baron (1998))that unfair treatment leads to anti-social workplace behavior. While this certainly seemslike a reasonable driver of the behavior, there are still important questions to be answeredregarding what is considered “unfair”treatment. What is judged as unfair may come fromunexpected sources, resulting in unfavorable outcomes for the employer. For example, Gill,Prowse, and Vlassopoulos (2012) finds workers perceive randomized bonuses to be unfairand end up cheating their employer more often if such a payment scheme is in place. On theother hand as demonstrated in Carpenter, Matthews, and Schirm (2010), employees engagein sabotage during a tournament competition and their level of sabotage may increase if they
4 In Carpenter, Matthews, and Schirm (2010) for example, the form of sabotage is under reporting a rivalsproductivity which occurs after the production stage. We would still classify the sabotage as during thetournament since it occurs prior to the winner being determined.
2

anticipate unfair treatment by fellow workers. These two examples illustrate the importancefor management to consider both the mechanism of the promotions and its effect on theextended game that is the workplace (i.e. the continued interaction between employees anda boss that was formally in similar position).
In addition to tournaments leading to workers intentionally engaging in acts that hurtothers and their firm, tournaments may lead to losers becoming demoralized which candiscourage them from further effort. This slackening of effort is certainly something thefirm would wish to avoid. This issue is discussed in Nalebuff and Stiglitz (1983) in whichthe authors note that “A problem with penalties is that they can become self-perpetuating.The loser becomes demoralized, fails to continue competing, and thus continues to lose.”5
They go on to point out that this problem may be so substantial that it might explain whycompetitive compensation schemes seem less widely used than they should be given theirattractive theoretical properties. This possible discouragement effect could manifest as aresult of any competition but it is also possible the nature of the competition could affectthe degree of discouragement.
There is a growing literature on how individuals judge and respond to the fairness ofmechanisms that determine outcomes. Bolton, Brandts, and Ockenfels (2005) demonstratesthat individuals take into account the fairness of the procedure generating an offer in anultimatum game and Trautmann (2009) develops a theoretical characterization of suchpreferences. Chlaß, Güth, and Miettinen (2013) provide a detailed set of contexts regardinghow different elements of bargaining procedures affect the preferences individuals have overthe outcomes. One key to much of this literature is the notion that random procedures inwhich all parties have equal likelihood of winning are often considered “fair”and can evenbe used to resolve potential conflicts, Kimbrough, Sheremeta, and Shields (2011).
An alternative point of view is that meritocratic mechanisms should be considered “fair”due to the fact that the winners in these mechanisms are the ones who have earned the rightto their advantaged position. Hoffman, McCabe, Shachat, and Smith (1994) show that pro-posers in ultimatum games make significantly lower offers to responders when the proposerhas “earned” their advantaged position rather than when their position was determinedrandomly. This finding has reinforced a commonly held view that procedures in which anadvantaged position is earned should be considered acceptable to all. One caveat to theHoffman et al. results though is that the study is not able to provide insight regarding howthe losers in their tournament viewed the outcome of the assignment mechanism. Ku andSalmon (2014) provide an investigation of the that issue. The study finds that, as expected,winners in a meritocratic assignment mechanism make decisions consistent with the hypoth-esis that the meritocratic mechanism is more acceptable than a random mechanism. Onthe other hand, losers in the meritocratic system find the outcome to be as objectionable asthose who receive their disadvantaged role through other mechanisms that were designedspecifically to appear as unfair and capricious.6 These results call into question the degree
5One extreme version of this is demonstrated in Fershtman and Gneezy (2011) in which the authorsdocument that competitions with larger rewards lead to higher rates of competitors quitting during a raceor competitors choosing not to participate. This behavior is in anticipation of the tournament outcomethough, not in reaction to actually losing.
6One of the other mechanisms assigned those who contributed the least in a one shot public goods gamethe advantaged role. The other elicited subjects preferences over several paintings and then assigned thosewho happened to like one particular artist the most the advantaged role.
3

to which losers in a meritocracy will see the outcome as “fair.”The setting for those findingsis very different from a workplace but the results suggest substantial concerns for the designof promotion tournaments and therefore the issue warrants further examination.
The question of how the design of a promotion tournament affects its acceptance bythose who fail to be promoted is the central question of the current study. Our aim isto investigate the degree to which the design of a promotion tournament affects the posttournament work effort. Our particular interest is in determining whether tournaments willdiscourage workers from future effort or induce them to engage in strategic sabotage oftheir new bosses. Specifically in our experiment we have subjects participate in promotiontournaments of various designs and then provide tournament losers an opportunity to workon behalf of their new boss. We have designed the work task the losers engage in to have avery naturalistic way for the workers to sabotage their bosses if they choose to. To sabotage,a worker need only modestly pull back work effort in a way that would be undetectable tosomeone in the boss role. The promotion mechanisms we use involve a tournament schemein which individuals are promoted based on their ability on a task that is relevant to theproduction task in the experiment, a scheme in which promotion is based on a criteriahaving nothing to do with ability in the production task, a mechanism allowing for workersto self-select into the different types of tournament schemes and a random assignmentmechanism.
Our treatments are designed to reflect the fact that there will usually be a variety offactors leading to one worker being promoted over another in a workplace. If two salesmenare vying for a promotion to a supervisor job then the meritocratic basis for promotionwould be their sales ability. Of course many other factors often come into considerationthat may have no direct bearing on how well the worker would do at the new job. This couldrange from physical traits and characteristics (Hamermesh and Biddle (1994); Black andStrahan (2001); Mobius and Rosenblat (2006); Case and Paxson (2006)) as well as socialfactors such as how well liked the worker is by the boss (Bandiera, Barankay, and Rasul(2009)). While it might be the case that most promotions are based on merit, employeesmay not always perceive that to be the case and responses to the tournament will be basedon perception regardless of the underlying reality.
To understand how perceptions of appropriate versus inappropriate tournament designsmight influence behavior we conduct promotion tournaments where promotions are basedon relevant job related activities that one might think losers would find acceptable andcompare this to cases in which promotion tournaments are based on activities irrelevantto job performance, expecting that losers will find these less acceptable.7 We are alsointerested in the effect of self-selection into a type of tournament on the acceptability of itsoutcome as workers can choose firms to work for in part based on how the firm is known toevaluate employees. While some may find a particular tournament design unacceptable if itis forced on them, it might be the case that the act of voluntarily choosing to be evaluatedon a certain criteria makes it more acceptable and so knowing if self-selecting into a schemechanges the reaction is important. This is similar to the issue discussed in Chlaß, Güth,
7Balafoutas and Sutter (2012) also investigate how the apparent unfairness of different promotion mecha-nisms may impact behavior in the context of affi rmative action programs. We note, though, that the authorsexamine the effect of the promotion mechanism on entry rates into the competitions and on effort duringthe competition, not on how effort is affected after the competition is concluded.
4

and Miettinen (2013) regarding how individuals feel a procedure is more fair if they havethe ability to voice disagreement over a proposal.
We present a simple theoretical model to provide predictions regarding the behavior inthe experiments which allows us to separate between strategic sabotage and discourage-ment. Our results demonstrate that both discouragement and strategic sabotage seem tooccur though in different segments of the worker population. Low ability workers becomediscouraged after losing in the first stage tournament and respond with greater discourage-ment in the treatment where the promotion is made on an inappropriate basis. Perhapssurprisingly we find that promotions based on random assignment are considered as accept-able to these workers as those based on a meritocratic tournament. While we find someevidence of strategic sabotage occurring among the higher ability workers, the frequencywith which they engage in such behavior does not vary with the design of the promotiontournament,
2 Experimental Design
2.1 Stages
The experiment consists of two stages. Prior to the start of the first phase, subjects aregiven instructions stating that in the second phase they will be paired with another subjectand one of them will be in a position to earn more money than the other. In all treatments,except random assignment, subjects are told their performance in the first phase determinestheir role in the second phase. Prior to completing the first phase, subjects are not toldexactly how performance in the first phase influences their position in the second phaseonly that it is relevant. In the first phase, subjects participate in two tasks. One is amathematics task (MT) which asks subjects to answer as many math problems as theycan in three separate sixty second periods. Subjects earn 8 cents for each correct answerand nothing for incorrect answers. There is no penalty for an incorrect answer. At theconclusion of each period, subjects see the number of problems they correctly solved and arunning average of the number of correct answers they provided over the periods completedup to that point. Subjects are not told how their performance compares to other subjects.
In the second task, subjects engage in a painting preference task (PT), based on the oneused in Chen and Li (2009) and Ku and Salmon (2014), in which the subjects are shown 5pairs of paintings. Each pair of paintings has one by Paul Klee and the other by WassilyKandinsky though the painters are not identified to the subjects. The paintings are pairedin such a way so that the average person is likely to see the two as being highly similar.Subjects are asked to indicate their preferred painting for each of the five pairs. There areno earnings for this task and this is explained to the subjects.
After the initial phase is complete, the subjects move to a second phase. In the secondphase all players participate in multiple rounds earning money at a task that is identical tothe MT seen in the first phase with one key difference; subjects are placed into pairs withone being assigned the role of boss and the other worker. The roles, worker versus boss, arepersistent across all of the rounds in this phase. In the experiment we used the labels Bluetype and Green type but for the ease of exposition we will use the contextualized languagehere. We defer the explanation of the promotion decision until later as the promotion
5
mechanism differs across treatments. Subjects assigned the boss role receive a raise relativeto the first phase and earn 15 cents for each MT problem they correctly answer. In addition,bosses have the possibility of earning a bonus of 150 cents per round if the worker in theirgroup correctly answers at least a certain lower bound of MT problems correctly. The lowerbound changes across subjects and rounds. Subjects in the worker role earn the same piecerate wage as in phase 1, 8 cents for each MT problem they correctly solve, and are toldthat if they solve enough of the problems correctly that they will earn the 150 cent bonusfor their boss. The workers are also informed about the wage rate of the boss though notthe boss’total earnings or productivity. The threshold which a worker faces in a round isequal to a fraction of his average individual performance on MT in the first phase of theexperiment where the fraction is from the set {.25, .5, .75, 1, 1.25, 1.5, 1.75}. The orderingof threshold fractions in the second phase is randomly drawn prior to the start of runningsessions and is held fixed for all sessions. The threshold is given to subjects at the start ofeach period. Subjects are not told the exact formula that calculates their thresholds norare they told that their threshold may differ from other subjects in the session. Making thethresholds a function of a subject’s own average productivity, allows us to ensure that forall workers that we have some thresholds that should be easily achievable, i.e. thresholdsfrom the set we will call Group 1 {.25, .5, .75} , some thresholds that are achievable but witha bit of effort that we will call Group 2, i.e. {1, 1.25}, and then some that are likely notachievable no matter how hard the worker tries, Group 3, i.e. {1.5, 1.75}.
The way a worker might sabotage their boss in this setting would be for a worker to haltproduction on the MT problems prior to hitting the threshold. Due to previous findings thatsubjects tend to work more than necessary out of boredom, Engel (2007), it is important toprovide workers with a credible outside option that provides them with an alternate activityshould the worker decide to sabotage his boss. It is also important that the activity shouldnot generate earnings which dominate those of the main task. To accomplish this we gaveworkers a second way of earning money. On the workers’ screens we display the MT aspreviously described on the left side while on the right side of the screen we present thema digit identification task (DT) similar to the one used in Mohnen, Pokorny, and Sliwka(2008). DT has subjects identify the number of times a specific numeric character appearsin a string of characters.
Workers earn 3 cents for each correct DT answer given but their DT performance hasno impact on the earnings of their boss. DT compensation is calibrated such that mostworkers would earn more money if they concentrated on the MT. We find for examplethat 32 subjects spent at least one period completing only DT questions and managedto complete 13-14 of them earning about 40 cents. The average performance of peoplecompleting MT questions is around 8, yielding earnings of about 64 cents. Since workerswould have no experience on the DT prior to the first period of stage 2, it is possible thatthey wouldn’t automatically realize which is the more lucrative task. Learning seems tooccur rather quickly and we will show in the data that subjects spend little time on DTquestions.
DT and MT questions are displayed on workers’screens at the same time and it is madeclear to workers they can switch between the two as often as they like and at any time.Moreover, the instructions explain the incentives of the two tasks and do not refer to theDT as sabotage nor do the instructions exhort the workers to work on behalf of their bosses.
6

Bosses do not observe the productivity of the worker on either task nor do they know thethreshold required of the worker in a given round; they only observe whether or not theyreceive the bonus.
2.2 Treatments
There are four experimental treatments conducted in which we vary the basis for the pro-motion. In our Task Appropriate treatment (or TA) performance on the MT section ofphase 1 is used to determine who is in the boss role in phase 2. Specifically those who scorein the top 50% in terms of average performance in the phase 1 rounds of MT earn the bossposition and those in the bottom 50% earn the worker position. We also have a treatmentwe refer to as Task Inappropriate or TI in which it is performance on the PT section ofphase 1 that determines the roles in phase 2. Subjects are promoted to the boss position ifthey are among the 50% of subjects exhibiting the strongest preferences for the paintingsof Paul Klee. The idea in which these are “appropriate”versus “inappropriate”is becausethe production task in the second phase is the MT again and so while one might find itappropriate to promote someone based on their previous MT performance, it might seemless appropriate to promote them based on their preferences regarding paintings. Assigningthe roles on the basis of the painting preferences is effectively random but random in a waythat is designed to appear to the subjects as arbitrary and capricious. One might objectto the TI mechanism due to the fact that we do not actually tell the subjects how theirperformance on this task might be judged making it impossible for them to even try to outcompete others. This is intentional as it must appear to be “inappropriate.”Also, manypromotion decisions are made on the basis of personal judgments by supervisors in whichworkers may not know exactly how their performance along different dimensions is valued.Such opaqueness could drive dissatisfaction with the process.8 This treatment mimics that.We note that we did not use the TA and TI labels in the experiment. We simply describedthe promotion criteria and left any determination of appropriateness to the subjects.
In our third treatment that we will call Self Selection (or SS), subjects choose to submiteither their MT or PT scores to a ranking tournament which would be used to assigntheir role in the second phase of the experiment.9 Out of the participants who selectthe tournament for MT, the top 50% of the performers from among that group earn anadvantaged position in the second phase. Out of the participants who select the tournamentfor PT, top 50% of them who prefer Klee paintings most strongly earn the boss position.Thus the manner in which the performance of a participant is judged is chosen by theparticipant rather than forced upon them. For the pairings in the second round, subjectswere only paired with those who chose the same task in which to compete. In SS, a little
8One example of this phenomenon (though it fails to fit the other properties of the experiment) would betenure decisions at universities. These often hinge on how senior faculty value different journals and theirpreferences may be quite heterogeneous and not clearly communicated to junior faculty. This is perhaps notall that different from knowing whether Klee or Kandinsky paintings are what the boss is looking for.
9There is a substantial prior literature examining the issue of selection into tournaments such as Eriksson,Teyssier, and Villeval (2009) or Niederle and Vesterlund (2007) though the focus of these papers is onexamining the choice of participating in tournament based compensation mechanisms versus piece ratecompensation mechanisms.
7

less than 83 percent of subjects selected to compete in the MT tournament.10
One might be concerned that most would want to choose the MT under the belief thatwere they a boss they might expect to earn more money due to the fact that they will bepaired with a worker who was of the sort who would self-select into the MT. This is not aconcern given the design of the experiment. At the time subjects were selecting into thetournaments, they only knew that the tournament winners would earn more in the secondphase. They knew nothing about the worker’s role in earning a bonus for the boss. Further,the thresholds for the bonus adapt to the ability of the worker meaning low and high abilityworkers should have approximately equal ability to hit the thresholds. Consequently notonly did subjects not have the information to select on this basis, such a bias in favor ofchoosing the MT would have been inappropriate if they had complete information.
In the fourth treatment, Random Assignment (RA), subjects are assigned roles by arandomly generated number. Subjects still go through the initial phase of the three roundsof the MT and the one round of the PT just as in the other treatments but in this treatmentphase 1 decisions have no impact on the second phase (and a connection between the twophases is never indicated to the subjects). Subjects are instead assigned a random numberat the end of the first phase between 1 and 16 with those being assigned a number in thehighest half, 9-16, being assigned the boss role. It is important to be clear that in thisand all the other treatments, subjects are explicitly told the method by which they arepromoted and instructions are modified across treatments to insure that subjects are notmisled about the promotion mechanism.
The motivation for the TA, TI, and RA treatments are relatively straightforward. Somefirms promote workers in an appropriate manner. That is, bosses earn their advantagedstatus due to their comparatively better record in an component to the job that is relevantto the firm’s success. The corollary to this type of promotion scheme is that other firms donot. In some cases, the firm may have ad hoc promotions (RA) and others may promotebased upon an irrelevant skill (TI). Finally, SS assumes workers have some idea about thepromotion culture of various firms and can choose which firm they accept employment atbased on their knowledge of the firm’s promotion culture. This is important due to the factthat the acceptability of a mechanism may change based on a person having voluntarilychosen to be judged on that basis.
The experiment is programmed in zTree, Fischbacher (2007). Participants are all stu-dents enrolled at a major state university in the southern United States. The experimenttakes place in a lab designated for economic experiments. Subject recruitment takes ad-vantage of the ORSEE recruitment system, Greiner (2004). Subjects are only allowed to
10The SS treatment does present us with a challenge in that we can not guarantee that an even numberof subjects will choose both tournaments. If there should be an even number of subjects choosing both thenonly those choosing the MT tournament are compared to others who have chosen that tournament and thenin phase 2, only those in the MT group are paired as boss/worker. The PT group would be consideredcompletely separate in terms of rankings and pairings. In case an odd number of subjects selected intothe tournaments, one subject from each tournament type is placed into a hybrid group. The tournamentused for the hybrid group is chosen randomly by the computer. Subjects are told prior to selecting theirtournament that there is possibility that they will be placed into a group with a subject who selected adifferent tournament competition. Subjects are told if they are matched with a partner who selected adifferent tournament to compete in and if they are in a group with a partner who selected an identicaltournament as themselves.While we will not address the issue in the main results section, in a separateappendix we will provide some basic analysis of the issue of tournament choice.
8
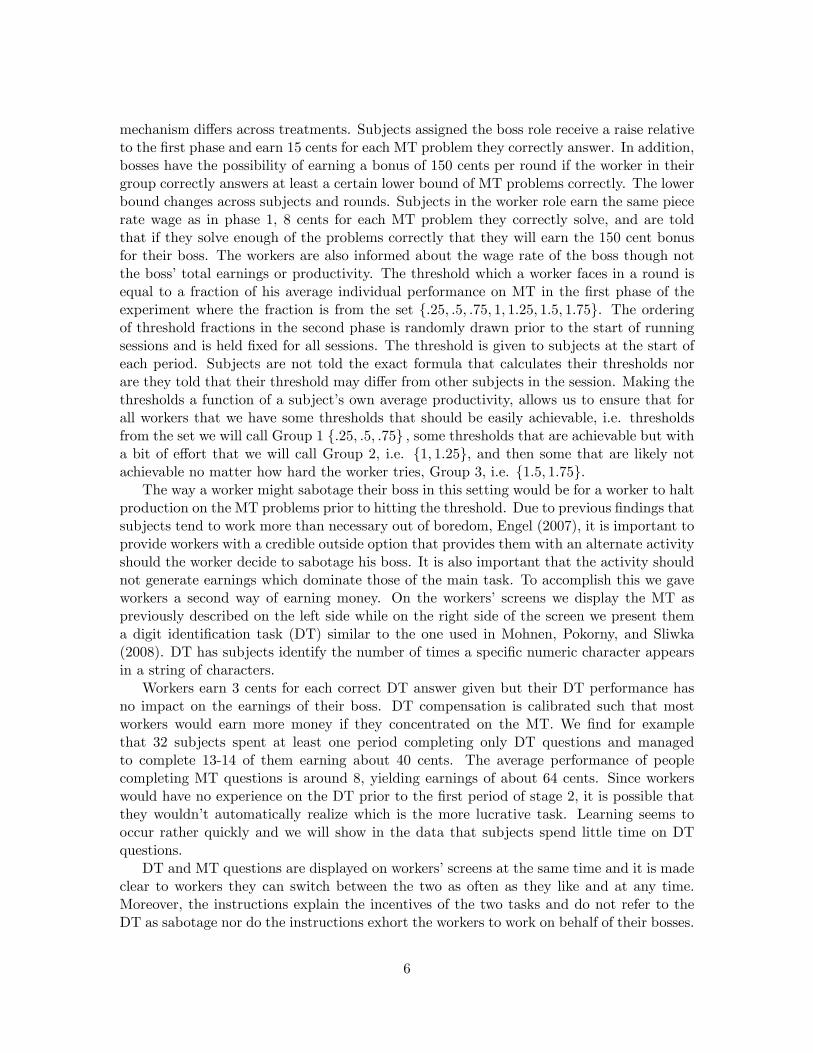
Treatment Sessions Subjects Boss Earnings Worker Earnings
TA 7 112 16.73 4.60TI 7 110 13.55 5.99SS 5 80 16.11 4.93RA 5 78 14.20 5.69
Table 1: Summary of treatments.
participate in a single session. Sessions tended to last slightly more than one hour. Uponbeing seated for the experiment, subjects are given instructions. All but two sessions have16 subjects; the other two have 14. In each session one boss was paired with one worker. Alllanguage is neutral; the word sabotage is never used. Subjects playing as the boss are toldthey have been given the “BLUE”role. Workers are given the “GREEN”role. A summaryof the total numbers of sessions and subjects by treatment along with average earnings isfound in Table 1.
After the instructions are completed the experiment begins. All sessions are run by thesame experimenter wearing grey slacks and a blue shirt. At the conclusion of the experimentsubjects go through a short demographic survey and are paid their earnings, in cash. Onaverage subjects lucky enough to be selected as the boss, made $15.15 while those playingas the worker made $5.29. All subjects were paid an additional $7 dollar show-up paymenton top of those earnings.
3 Theory
We present a simple model of decision making in this environment that can be used toexplain two different ways in which promotion mechanisms might affect behavior. Thefirst way will be through the inducement of what we will term strategic sabotage. We willcall this “strategic” sabotage to make it clear that this is a form of sabotage that is theresult of purposive and intentional choice aimed at reducing the welfare of another. Thesecond effect we will examine is the possibility of a worker being discouraged leading tothe ability/willingness of the worker to engage in effort diminishing. The latter effect couldalso result in what could be seen as sabotage behavior due to a boss becoming less likely toreceive their bonus, but that is not due to the discouraged worker intentionally choosing todeny the boss the bonus and should therefore be distinguished from the strategic notion ofsabotage. While both will be contained in a single model, they make distinct predictionsregarding behavior which will allow us to discriminate between which might better describebehavior.
To model the choice behavior in this environment we assume a worker receives a piecerate wage for the MT, w, and selects a level of effort, mi, to engage in. To make the modelsimple, we assume mi is the number of problems a worker solves correctly. Normally onewould model effort choice problems by presuming some cost of effort, ci(mi), with the costof effort being different across individuals as a way to model differences in ability. Given thenature of this task, that seems unnecessary. Our subjects work on these problems for a shortperiod of time and it seems unlikely that the psychic cost of solving another problem was
9

ever above the piece rate wage. Given that and the fact that we have no way of estimatinga true ci(mi), we will ignore this complication. We will instead model ability by assumingeach subject has some maximum number of problems that he or she could complete in thetime frame, Mi(P ) where P is a measure of how acceptable the worker finds the assignmentcriteria. This approach to modeling heterogenous ability will allow a more straightforwardpresentation of the model though one could of course redefine the model based on theci(mi) specification instead and reproduce all of the results we will show, just with morecumbersome notation. By allowing Mi to be a function of the treatment, P, we will be ableto model a discouragement effect allowing for a worker’s willingness to engage in effort tobe harmed due to their unhappiness with the tournament design. We will return to discussthe nature of such an effect later.
In addition to the MT, our workers have the option of completing elements of the othertask, DT, which also delivers a piece rate wage. Given the design, the incentives were suchthat in all cases working on another MT problem dominated a DT problem and so the onlytime a subject should choose to engage in the DT is if he or she is stopping the MT prior toachieving the threshold. To keep the model simple we will therefore assume that a workeronly engages in this task if he fails to meet the threshold but could have as the thresholdwas below his maximum capacity. This suggests that the earnings on this task will be adeclining function of how many of the MT problems were solved. We will specify theseearnings as D(x) such that D′ < 0 and D(x) = 0 if x ≥ Mi. Our assumption regardingthe relative earnings on the two tasks is equivalent to assuming that either wMi ≥ D(0) orw ≥ −D′(x) for x ≤Mi (i.e. the wage for completing one more MT problem is greater thanthe earnings that could be achieved on DT problems in the time freed up by doing one lessMT problem).
We will also allow for the possibility that a worker receives either utility or disutility fromtheir boss receiving the bonus and allow for the value of this utility adjustment to dependon the treatment, αi(P ). It is through these two parameters, αi and Mi, that we will beable to model the two different motivations for decreased effort due to the treatments. Ourhypotheses will regarding behavior are equivalent to hypothesizing that PSS > PTA > PTIor that the SS treatment will be the most acceptable and TI the least. More generallythough, this framework gives us a foundation for measuring the acceptability of differentmechanisms. We assume that α′i ≥ 0 and that M ′i ≥ 0. The placement of PR in that chainis more diffi cult to pin down and we will discuss this more later. We can allow αi(P ) tobe positive or negative to indicate that the worker receives a utility increase or decreasefrom the boss receiving the bonus though in the model we will develop, positive values ofαi(P ) will lead to behavior equivalent to αi(P ) = 0. Therefore we will only discuss valuesαi(P ) ≤ 0. The boss receives the bonus in the event that the worker’s effort choice, e,exceeds the threshold which we will denote as T. This gives us a basic choice problem of
maxmi
w ∗mi +D(mi) + I(mi|T ) ∗ αi(P )
I(mi|T ) ={1 if mi ≥ T0 if mi < T
(1)
subject to mi ≤Mi(P ).
10

Given the setup, there are really only two possible choices for mi which are m∗i =Mi(P )or m∗i = T−ε. Since we are only going to allow discrete choices of mi, ε = 1. If the thresholdis higher than the capability of the worker,Mi(P ) < T, then the worker will work on the MTto the maximum of his ability choosing m∗i =Mi(P ) and receive utility equal to w ∗Mi(P )with no chance of the boss receiving the bonus. This demonstrates the first way thattreatments might affect behavior. If the maximum effort a worker is willing/able to engagein depends on the treatment and, as assumed, this maximum effort is positively related tothe acceptability of the mechanism then the less acceptable is the mechanism the lower willbe the effort by the worker. As work effort decreases, the boss may be less likely to receivethe bonus. We will refer to this as the discouragement effect as it reflects the possibility ofthe promotion mechanism to demoralize a worker and decrease his motivation to engage ineffort.
If Mi(P ) ≥ T then the worker might choose m∗i = T − 1 to intentionally keep theboss from receiving the bonus if doing so is worthwhile to him. We will refer to suchbehavior as strategic sabotage. If the worker does not sabotage then he receives utility ofw ∗Mi(P ) + ai(P ). If the worker does sabotage then he receives w ∗ (T − 1) +D(T − 1). Aworker will therefore choose to sabotage if
w ∗ (T − 1) +D(T − 1) ≥ w ∗Mi(P ) + αi(P ) (2)
D(T − 1)− αi(P ) ≥ w ∗ (Mi(P )− (T − 1)) (3)
or if the benefit to sabotaging, D(T − 1) − αi(P ), is greater than the cost of sabotaging,w∗(Mi(P )−(T−1)).We assume D(T−1) to be relatively small in magnitude and it shouldnot affect the decision much. What this means is that for very low values of T relative toMi(P ), an individual must have a very strong disutility for the boss to receive the bonus inorder to engage in sabotage. If, however, T is close to Mi(P ) then an individual can stopshort of the threshold at little cost making doing so worthwhile for even lower values ofαi(P ). At such levels of T close to Mi(P ) the value of D(T − 1) will definitely be close to0 as little time will be left to devote to DT problems after the worker has stopped workingon MT problems to avoid triggering the bonus.
3.1 Hypotheses
The model above provides the support for several testable hypotheses. The first two describehow the two motivations for decreased work effort might be observed.
Hypothesis 1 If subjects engage in Strategic Sabotage then they will cease work on the MTjust below the threshold, otherwise they will work up to their full capability.
Hypothesis 2 If subjects suffer more from a discouragement effect in one treatment thananother, this will lead to lower effort under all thresholds in the first treatment as comparedto the second.
The support for these two hypotheses is explained above. For hypothesis 1 this explainshow strategic sabotage can be identified and as described above we should expect to findit most likely to occur for the intermediate thresholds. In the analysis we will check this
11

by examining how often workers work up to exactly T − 1 and then stop. The secondhypothesis concerns what we should observe if workers are discouraged from the tournamentand decrease work effort due to that rather than an attempt to explicitly sabotage theirnew boss. This hypothesis can only be tested in the context of the following hypothesesThe next two hypotheses suggest how the TI, TA and SS treatments should affect the workeffort by the workers which in turn affects the probability of the boss receiving the bonus.
Hypothesis 3 Subjects in the worker role will provide less work effort (and more sabotageeffort) in the Task Inappropriate treatment than Task Appropriate. This will result in theboss receiving the bonus less often in Task Inappropriate than Task Appropriate.
Hypothesis 4 Subjects in the worker role will provide more work effort (and less sabotageeffort) in the Self-Selection treatment than Task Appropriate. This will result in the bossreceiving the bonus more often in Self-Selection than Task Appropriate.
These two hypotheses are equivalent to the hypothesis that PSS > PTA > PTI . Givenhypothesis 1 we should only expect these two hypotheses to hold for intermediate thresholdvalues if subjects are engaging in strategic sabotage but they should hold for all thresholdsif subjects are discouraged due to the role assignment. What these hypotheses do notcover is how the RA treatment should be expected to affect behavior. There are conflictingsuggestions from prior literature. As discussed in the introduction, Ku and Salmon (2014)found that subjects receiving a disadvantaged role were more willing to accept their positionwhen the role was allocated randomly rather than earned through a meritocratic system.This result suggests that PRA > PTA. There are substantial contextual differences in theenvironments between the two studies that one might expect to reverse that relationship.The key difference is that in the current study, the meritocratic ranking in the TA treatmentis based on the same task as the production in the subsequent phase. In Ku and Salmon(2014), the task in the second phase was not related to the basis for the meritocraticranking as the meritocratic ranking was based on a pseudo-SAT exam while the secondphase involved a stylized investment decision. One of the questions motivating the currentstudy is whether aligning the meritocratic ranking methodology with the subsequent taskcan reverse the previous finding where the two are not so tightly linked. Conventionalwisdom certainly suggests that meritocratic ranking would be preferred to random and sothe issue here is to see what is required in order for that to be the case. In further support ofthe possibility of the random procedure being seen as fair, the procedural fairness literaturepreviously discussed explicitly refers to random allocation as a fair mechanism and multipleprior studies find evidence in favor of that. This suggests that it should be seen as moreacceptable than TI and could be seen as or more acceptable when compared with TA and SS.The procedural fairness literature largely deals with situations in which all individuals haveequal claim on the advantaged position though which is not necessarily the case here. Thusit is not clear that the random mechanism should be considered fair in the environmentof this experiment. All of this suggests that there is not a consensus hypothesis fromprior literature regarding how the RA treatment might compare to the others. We willconsequently specify a hypothesis to test consistent with the Ku and Salmon (2014) resultswhile acknowledging that it is certainly not the only way one might reasonably structure
12

Work % Stops at T − 1 Sabotage Boss Bonus Avg Math Obs
TA 10.28 NA NA 0.35 9.20 56TI 7.85 NA NA 0.34 6.82 55SS Math 10.86 NA NA 0.33 9.77 31
Paint 6.84 NA NA 0.32 5.89 9RA 8.36 NA NA 0.35 6.95 39
Table 2: Summary statistics for bosses.
Work % Stops at T − 1 Sabotage Boss Bonus Avg Math Obs
TA 4.09 0.102 4.34 0.35 5.50 56TI 5.62 0.070 4.63 0.34 6.82 55SS Math 4.32 0.098 5.16 0.33 6.14 35
Paint 3.29 0.057 4.49 0.34 5.00 5RA 5.55 0.103 3.91 0.35 6.97 39
Table 3: Summary statistics for workers.
this hypothesis. To stay consistent with the other hypotheses we will specify the hypothesisof behavior in the RA treatment relative to the TA treatment.
Hypothesis 5 Subjects in the worker role will provide more work effort (and less sabotageeffort) in the Random treatment than Task Appropriate. This will result in the boss receivingthe bonus more often in Random than Task Appropriate.
4 Results
We begin by examining summary statistics regarding performance across treatments. Table2 shows some basic statistics on the performance of bosses. We present the average numberof math problems solved correctly during the second phase of the experiment, the percentageof times they received the bonus, their average score on math problems from the first phaseand then the number of observations. There is a column for the number of times stoppedjust under the threshold and the number of the sabotage tasks the bosses performed to beconsistent with the subsequent worker table but neither column is relevant for the bosses.For the SS treatment we separate those who chose to compete in the Math tournamentversus those who preferred to be assigned their roles based on painting preference. While wewill not analyze the boss behavior in much detail it is worth noting the substantial variationin the Average Math variable which is the average of the assessment phase performance.
Table 3 presents the same summary statistics but this time to summarize the behaviorof the workers. Now the performance on the sabotage task and the percentage of times aworker stopped working on the MT at T − 1 are relevant and reported. There is an obviousproblem with making much of any comparison based on simple comparisons of summarystatistics and that is indicated by there being substantial heterogeneity in the Average Mathscores of the subjects. The TI treatment which we hypothesized would result in lower workeffort than TA actually appears in the summary statistics to deliver higher work effort.
13

2 3 4 5 6 7 8 9 10 11 12 13 14 15Average Math Score
0
5
10
15
20
0
5
10
15
20Cou
nt
Boss
Worker
TATISSRA
Figure 1: Histograms of average first stage math scores by type and treatment.
These values should not be compared so directly though. Due to the differences in howworkers were selected between the two treatments, the average mathematical abilities of thetwo groups are different leading to different capabilities of workers and different thresholdvalues between treatments. We present these summary statistics for completeness but wewill engage in no statistical tests based on simple comparisons of these summary statisticsas such analysis would be misleading.
A further look at the heterogeneity in subjects between treatments is shown in Figure1 which contains histograms of the average assessment phase math scores of subjects indifferent treatments and roles. In the TA treatment, the distribution of math scores for thebosses is shifted far to the right relative to the scores of the workers but due to the selectioncriteria; this is to be expected. The same is true for those who chose to compete in theMath tournament in the SS treatment. In the TI and RA treatments, the distributions ofbosses and workers appear quite similar due to the fact that both involve essentially randomassignment. In our future analysis we will correct for this heterogeneity in several differentways.
The first way we will attempt to examine the behavior with some correction for crosstreatment heterogeneity is shown in Table 4. This table segments subjects into those whoare above or below the median average math score from the first phase of 7 and then pro-vides some useful summary statistics for three different threshold groupings regarding thethreshold they had to hit in a round. As a reminder, Group 1 refers to the low thresholds,{.25, .5, .75}, Group 2 consists of the intermediate thresholds, {1, 1.25} and Group 3 con-tains the high thresholds, {1.5, 1.75}. The statistics include the percentage of times workersstopped at T − 1, how often the bonus was achieved as well as some information about theearnings the subjects could have achieved on the MT producing up to T − 1 versus howmuch they would earn from working at their average math level. This conveys some ofthe cost of choosing to sabotage. The main benefit in segmenting the subjects by averagemath scores is that those who are below the median are approximately the same across alltreatments. This can be seen in Table 5 which provides a simple OLS regression of the
14

AM
<7
AM≥7
Group1
Group2
Group3
Group1
Group2
Group3
TA
T2.99
6.07
8.71
4.03
8.10
12.15
WorkPerf
3.32
4.12
4.41
4.43
5.45
5.85
%StopatT−1
0.094
0.130
0.087
0.233
0.300
0.150
AvgMath
5.15
7.10
Bonus/Chances
76/138(0.55)
29/92(0.31)
10/92(0.11)
15/30(0.50)
6/20(0.30)
0/20(0)
$atT−1
$0.24
$0.49
$0.70
$0.32
$0.65
$0.97
$atAvgMath
$0.41
$0.57
TI
T3.00
6.14
8.83
4.84
10.06
14.79
WorkPerf
2.03
2.40
2.60
7.06
7.41
8.84
%StopatT−1
0.079
0.024
0.048
0.069
0.132
0.044
AvgMath
5.24
8.79
Bonus/Chances
24/63(0.38)
7/42(0.17)
5/42(0.12)
71/102(0.70)
23/68(0.34)
2/68(0.03)
$atT−1
$0.24
$0.49
$0.71
$0.39
$0.80
$1.18
$atAvgMath
$0.42
$0.70
SST
2.99
6.08
8.80
4.13
8.37
12.5
WorkPerf
2.92
2.70
3.76
5.16
6.67
6.67
%StopatT−1
0.133
0.100
0.080
0.067
0.100
0.033
AvgMath
5.20
7.33
Bonus/Chances
38/75(0.51)
9/50(0.18)
4/50(0.08)
27/45(0.60)
14/30(0.47)
0/30(0)
$atT−1
$0.24
$0.49
$0.70
$0.33
$0.67
$1.00
$atAvgMath
$0.42
$0.59
RA
T3.04
6.21
8.94
4.56
9.43
13.95
WorkPerf
3.59
4.06
4.00
5.98
7.05
8.00
%StopatT−1
0.118
0.059
0.176
0.061
0.182
0.045
AvgMath
5.29
8.27
Bonus/Chances
31/51(0.61)
13/34(0.38)
0/34(0)
40/66(0.61)
11/44(0.25)
0/44(0)
$atT−1
$0.24
$0.50
$0.72
$0.36
$0.75
$1.11
$atAvgMath
$0.42
$0.66
Table4:Summarystatisticsbytreatmentbrokenoutbyaboveversusbelow
medianaveragemathabilityandbythreshold
grouping.
15

All AM < 7 AM ≥ 7TI 1.936∗∗∗ 0.086 1.694∗∗∗
(0.350) (0.256) (0.594)
SS 0.500 0.048 0.233(0.382) (0.242) (0.674)
RA 1.474∗∗∗ 0.142 1.173∗
(0.385) (0.276) (0.630)
Constant 5.500∗∗∗ 5.152∗∗∗ 7.100∗∗∗
(0.246) (0.143) (0.522)
Observations 190 109 81Standard errors in parentheses. *** p<0.01, ** p<0.05, * p<0.1
Table 5: Average math scores regressed on treatment dummies.
average math scores of the subjects with the treatment dummies as the regressors. We haveprovided separate regressions including one specification for all subjects and then two moreseparating out those who have above and below average, average math scores. What we seeis that there are no differences in ability across treatments in the below average group butthere are for the above average group and consequently for the overall sample. This meansthat the below median individuals are all comparable in the different treatments makingcomparisons among them more reasonable.
By examining Table 4 we can note several patterns in the data which will be helpfulin interpreting the later regressions. First, for both groups in all threshold categories, theperformance of the workers is less on average than the average of their performance in thefirst stage. This is an indication that the assignment treatments might have depressed workeffort overall though inference on that is not clear. In the first stage subjects had two reasonsto exert high effort; the piece rate wage and the possibility of earning the advantaged rolefor stage 2. In stage 2, they only have the wage portion. So it is possible that the decline ineffort is due to the tournament element no longer being present. This is not a problem forour analysis because our interest is not in total performance levels or in comparison betweenfirst and second stage but rather in comparing second stage levels to each other. As thetournament is missing in the second stage in all treatments, any effect from the tournamentnot being present anymore should be the same for all treatments allowing us to identify anyremaining differences in behavior as due to a treatment effect.
The second thing to observe from the table is that the bonus is rarely achieved at thehigh threshold levels. This is of course not surprising as the required threshold, T, is quitea bit above the average performance capability the subjects have previously demonstrated.In looking at the summary statistics for those below the median ability, it is useful to notethat the average ability and the threshold requirements are approximately the same acrosstreatments. If we look at the fraction of the bonuses achieved for the boss we can see thatthe TI treatment generally has a lower success rate while the others are quite similar. Forthose subjects above the median ability, there is more heterogeneity and there are no clearpatterns regarding the likelihood of the bonus being achieved. The $ at T − 1 row showswhat the subjects would have earned from the main task had they earned as much as they
16

Stop at T − 1All AM < 7 AM ≥ 7
Group 1 -0.025 0.012 -0.076∗∗
(0.020) (0.026) (0.031)
Group 3 -0.0395∗ >-0.001 -0.093∗∗∗
(0.021) (0.025) (0.034)
TI -0.033∗ -0.044∗ -0.032(0.018) (0.023) (0.029)
SS -0.010 0.005 -0.035(0.026) (0.035) (0.031)
RA 0.0002 0.008 -0.020(0.023) (0.032) (0.030)
Average Math, AM 0.001 -0.012 0.007(0.006) (0.011) (0.011)
Male -0.019 -0.040∗ 0.0132(0.014) (0.021) (0.019)
Constant 0.125∗∗∗ 0.174∗∗∗ 0.102(0.036) (0.065) (0.081)
Observations 1,330 763 567Clusters 190 109 81Clustered robust standard errors in parentheses. *** p<0.01, ** p<0.05, * p<0.1
Table 6: Random effects regressions of whether workers stopped just short of thethreshold.
could have while keeping the boss from receiving the bonus but it does not indicate howmuch additional they could earn on the DT after choosing to stop at T − 1. The $ at AvgMath row indicates how much the subject could have earned working at their average level.Note that for the low threshold cases, the subjects have to give up close to 50% of theirexpected earnings to sabotage and at the high thresholds the sabotage earnings would bebetter than they could likely achieve. For the middle thresholds, the subjects don’t have tosacrifice much at all to sabotage.
Our first hypothesis indicated how subjects would choose if they were engaging in strate-gic sabotage. Essentially subjects should choose to work to the max of their abilities or towork up to T − 1 on the MT and then switch to the DT for the remainder of the time. Theoutcome from testing this hypothesis is contained in our first result.
Result 1 Workers who are below the median in terms of their first stage math performanceindicate little strategic sabotage behavior. Workers who are above the median exhibit behaviorconsistent with occasional strategic sabotage.
There are two ways we can examine the data to determine if the prediction regardingstrategic sabotage matches the behavior of the subjects. First, we can examine the rowfor % of Stops at T − 1 in Table 4. If subjects were engaging in strategic sabotage weshould see this hit a higher level for the intermediate thresholds than the others as this
17

is where strategic sabotage should be most likely. We might also expect a relatively highpercentage of choices of this sort. From examining the table, we do see that for subjectsabove the median in their math skills that the middle threshold category is the one in whichstopping at T − 1 in most likely but this does not hold true for those below the median.For both groups the frequency with which this option is chosen is relatively low indicatingthat even if the high ability subjects do occasionally choose to sabotage, it is not veryfrequent. Table 6 presents a set of linear random effects regressions with clustered standarderrors11 to determine if the likelihood of a worker stopping within 1 problem of the thresholddepends on the threshold group and the treatment. The test of the theoretical predictionis whether the dummy variables for the high and low threshold group are negative as thiswould indicate that this behavior occurs most often in the middle group. As indicated bythe summary statistics, this pattern does not emerge for the low ability subjects but we dofind a small effect for the high ability subjects. This provides an indication that high abilitysubjects may be engaging in strategic sabotage, albeit at a relatively low incidence.
Testing hypothesis 2 has to be done in the context of the other three hypotheses whichare concerned with the effect of the treatments on behavior. Table 7 provides the regressionsnecessary to test these hypotheses. It contains a set of regressions separated out into thethree different threshold groupings used in Table 4 and includes dummy variables to separatethose who are above and below the median ability level. This table provides the supportfor results based on testing hypotheses 3-5.
Result 2 Low ability workers robustly engage in less work effort (more sabotage effort) inTI than TA at all thresholds. High ability workers indicate no change in behavior betweenthe TI and TA treatments.
Result 3 Both Low and High ability workers exhibit little behavioral differences betweenthe SS and TA treatments though Low ability workers do exhibit less work effort and moresabotage in the middle threshold range.
Result 4 Both Low and High ability workers exhibit little behavioral differences betweenthe RA and TA treatments.
The coeffi cients on the base treatment dummies, TI, SS and RA, indicate how low abil-ity individuals respond to the treatments relative to the TA treatment and the interactionterms, H×TI, H×SS and H×RA indicate how those in the high ability category responddifferently to the treatments than the low group. In the case of TI, we see that low abilityindividuals respond with decreased work effort in all threshold ranges as well as increasedsabotage performance leading to a lower chance that the boss receives the bonus. Interest-ingly, while work effort decreases in the TI treatment, this happens while the frequency oftimes workers stop at T − 1 also drops at least for the intermediate threshold range. These11For these and subsequent regressions with the binary “Stop at T − 1”variable we use a simple linear
probaiblity model rather than a logit specification. This is mainly to keep a constant form across similarregressions and to allow for the clustering of observations in the standard error calculations. All regressionshave also been conducted with the logit specification and while the p−values change slightly, the substantitiveinterpretation is the same. We therefore present this standardized version but are happy to provide the logitspecifications upon request.
18

StopatT−1
WorkPerformance
SabotagePerformance
BossBonus
Group1
Group2
Group3
Group1
Group2
Group3
Group1
Group2
Group3
Group1
Group2
Group3
TI
-0.0355
-0.110∗∗
-0.0128
-1.401∗∗∗
-1.866∗∗∗
-1.940∗∗
2.830∗∗∗
3.557∗∗∗
4.455∗∗∗
-0.173∗∗
-0.156∗
0.0104
(0.044)
(0.044)
(0.040)
(0.487)
(0.625)
(0.821)
(1.006)
(1.328)
(1.563)
(0.087)
(0.081)
(0.076)
SS
-0.008
-0.030
0.039
-0.400
-1.440∗∗∗
-0.675
0.948
2.716∗∗
1.519
-0.042
-0.132
-0.027
(0.054)
(0.055)
(0.045)
(0.500)
(0.559)
(0.738)
(0.973)
(1.158)
(1.358)
(0.081)
(0.081)
(0.057)
RA
0.080
-0.068
0.019
0.362
-0.024
-0.408
0.057
0.674
0.432
0.069
0.091
-0.099∗∗∗
(0.064)
(0.057)
(0.067)
(0.532)
(0.529)
(0.751)
(0.968)
(1.147)
(1.443)
(0.081)
(0.083)
(0.031)
AM
0.0001
0.013
-0.003
0.541∗∗∗
0.966∗∗∗
0.848∗∗∗
0.157
-0.346∗
0.025
-0.014
-0.010
-0.028∗∗
(0.007)
(0.015)
(0.015)
(0.202)
(0.128)
(0.132)
(0.288)
(0.196)
(0.212)
(0.020)
(0.019)
(0.013)
AM≥7,H
0.018
-0.007
-0.020
-0.024
-0.640
-0.278
0.007
0.554
-0.225
-0.029
-0.006
-0.058∗
(0.071)
(0.083)
(0.057)
(0.994)
(0.952)
(1.136)
(1.750)
(2.176)
(2.213)
(0.112)
(0.100)
(0.033)
H×TI
-0.022
0.071
0.019
3.133∗∗∗
2.215∗
3.509∗∗
-5.054∗∗
-3.573
-6.724∗∗
0.393∗∗∗
0.215∗
0.067
(0.081)
(0.097)
(0.064)
(1.056)
(1.162)
(1.420)
(1.986)
(2.530)
(2.695)
(0.138)
(0.128)
(0.083)
H×SS
-0.057
-0.023
-0.037
0.970
2.405∗∗
1.275
-1.575
-3.516
-2.338
0.144
0.297∗∗
0.032
(0.088)
(0.105)
(0.072)
(1.114)
(1.222)
(1.447)
(2.032)
(2.521)
(2.677)
(0.134)
(0.133)
(0.058)
H×RA
-0.124
0.080
-0.017
0.376
0.303
1.431
-0.852
-0.898
-2.270
0.042
-0.152
0.125∗∗∗
(0.093)
(0.106)
(0.085)
(1.169)
(1.132)
(1.398)
(2.066)
(2.585)
(2.638)
(0.139)
(0.131)
(0.037)
Thresh%
-0.253∗∗
-0.021
0.179∗∗∗
-2.832∗∗∗
-3.663∗∗∗
1.621∗∗
-1.347
1.979
-1.874
-1.042∗∗∗
-1.642∗∗∗
-0.232∗∗∗
(0.107)
(0.134)
(0.062)
(0.503)
(0.975)
(0.716)
(0.882)
(1.553)
(1.151)
(0.089)
(0.151)
(0.075)
Male
-0.0460∗
0.023
-0.021
0.789∗∗
0.808∗∗
0.583
-0.609
-1.067
-0.601
0.047
0.102∗∗
0.028
(0.025)
(0.030)
(0.023)
(0.309)
(0.356)
(0.433)
(0.553)
(0.691)
(0.770)
(0.043)
(0.047)
(0.030)
Constant
0.514∗∗∗
0.080
0.027
1.641
2.945∗∗
-2.818∗∗
4.753∗∗∗
4.062∗
7.293∗∗∗
1.123∗∗∗
2.175∗∗∗
0.617∗∗∗
(0.180)
(0.166)
(0.077)
(1.104)
(1.338)
(1.405)
(1.635)
(2.182)
(2.281)
(0.113)
(0.209)
(0.162)
Obs
380
380
570
570
380
380
570
380
380
570
380
380
Clusters
190
190
190
190
190
190
190
190
190
190
190
190
Clusteredrobuststandarderrorsinparentheses.***p<
0.01,**p<
0.05,*p<
0.1
Table7:Randomeffectregressionsofworkerbehavior.
19

results combined with the previous ones are consistent with low ability subjects being moredemoralized in the TI treatment than in the TA treatment rather than the workers engagingin strategic sabotage more often in TI than TA. The hypothesis regarding the SS treatmentis that subjects might be even less likely to sabotage than in the TA treatment. We find thatgenerally there are no differences between TA and SS except for the fact that low abilityindividuals sabotage more often in the SS treatment in that key interior set of thresholdswhere sabotage is feasible but cheap. This could be consistent with those subjects engagingin strategic sabotage but the drop in output does not occur due to more people choosingto stop at T − 1. Consequently the drop in output in that case is not indicating an increasein strategic sabotage. Finally the fourth result is supported by the fact that we generallyfind the RA coeffi cients not to be significantly different from 0 for the low ability workers.
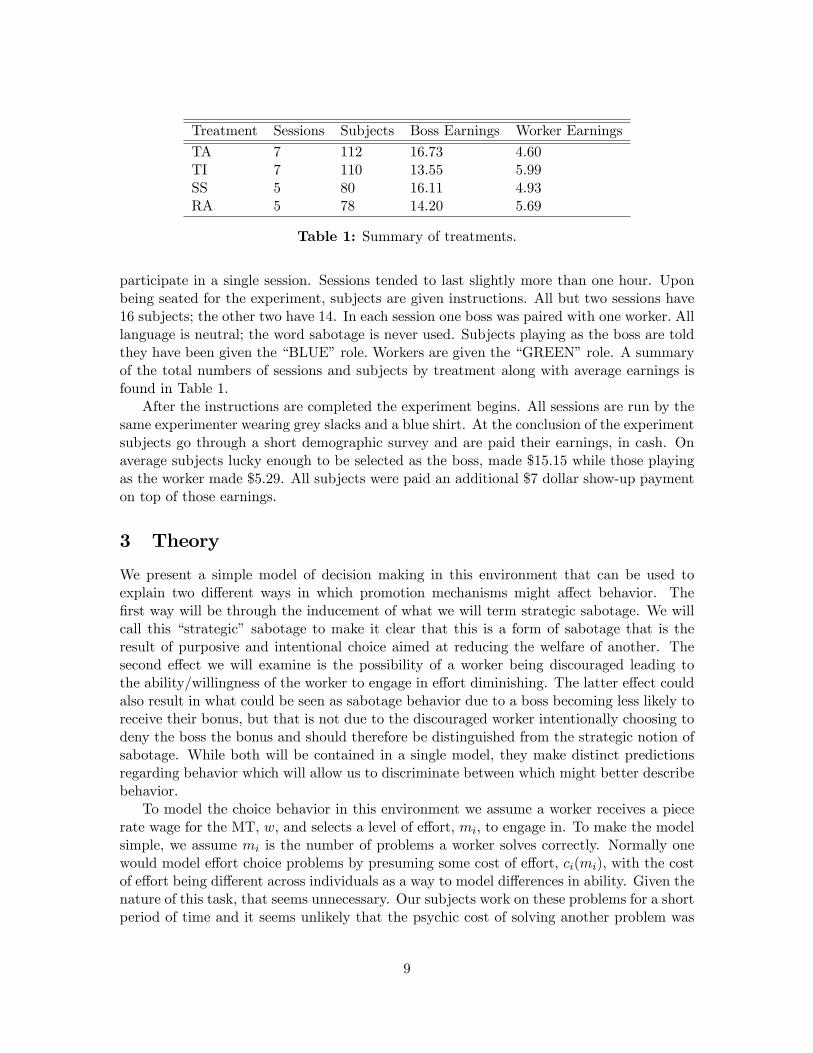
For the support on all three results regarding the high ability workers, we provideTable 8. Table 8 takes the coeffi cients regarding the high ability workers from Table 7 andconstructs the total treatment effect for them (e.g. for the TI effect we display TI+H×TI).Here we see no statistically significant shift in worker behavior due to treatments or based onthe threshold bins. The indication is that the high ability workers do not alter their behaviorbased on the assignment treatment. There may be some strategic sabotage engaged in bythese subjects as discussed in Result 1, but the incidence of it does not vary by treatment.Also while we appear to find a discouragement effect for the low ability workers in theTI treatment, we do not observe the same for the high ability workers. The fact that adiscouragement effect exists for low ability while not high ability workers is consistent withthe results found in Ku and Salmon (2012) which obtains a similar result.
5 Conclusion
Promotion tournaments are a common way to induce effort in firms, but they lead tothe possibility of bad feelings by the loser of the competition. Since losers often remainat the firm, the effect losing has on the behavior of workers is an issue of importanceto employers. A common belief is meritocratic promotion should be considered fair andlead to no bad feelings on the part of those who don’t earn the promotion. While thismay be the conventional wisdom, there is little prior evidence in favor of this claim andsome evidence directly counter to it. The intent of this paper was to evaluate the effectof different promotion tournaments on behavior to determine what effect tournaments ofdifferent design would have on behavior.
Our key finding is that when a promotion tournament is based on what might be rea-sonably considered as criteria irrelevant to the productive task of the group, low abilityworkers who do not earn the boss role will decrease their work effort by more than if thepromotion criteria is relevant or even than if the promotion is made at random. The resultthat random and meritocratic mechanisms are considered equally acceptable is consistentwith the procedural fairness literature which often suggests that random allocation is “fair.”In a context such as this with differentially demonstrated ability, one might expect that ran-dom allocation should be less likely to be considered as fair compared to the meritocratictournament but our results demonstrate otherwise. The nature of the decreased work effortwe find is more consistent with the speculation in Nalebuff and Stiglitz (1983) suggestingthat promotion tournaments will demoralize workers and lead to lower effort rather than
20
StopatT−1
WorkPerformance
SabotagePerformance
BossBonus
Group1
Group2
Group3
Group1
Group2
Group3
Group1
Group2
Group3
Group1
Group2
Group3
TI+H×TI
-0.058
-0.038
0.006
1.733∗
-0.348
1.569
-2.224
-0.015
-2.269
0.220∗∗
0.059
0.077∗∗
(0.069)
(0.084)
(0.050)
(0.945)
(0.988)
(1.160)
(1.707)
(2.158)
(2.189)
(0.108)
(0.101)
(0.033)
SS+H×SS
-0.065
-0.054
0.001
0.570
0.964
0.599
-0.628
-0.800
-0.819
0.102
0.166
0.006
(0.070)
(0.089)
(0.001)
(0.992)
(1.082)
(1.242)
(1.777)
(2.229)
(2.303)
(0.106)
(0.106)
(0.009)
RA+H×RA
-0.044
0.012
0.002
0.738
0.278
1.023
-0.795
-0.224
-1.838
0.111
-0.613
0.026∗
(0.070)
(0.090)
(0.054)
(1.036)
(0.997)
(1.176)
(1.802)
(2.279)
(2.213)
(0.114)
(0.101)
(0.016)
Table8:Totaltreatmenteffectsforhighabilitysubjectscaclulatedfrom
Table7.
21

workers lowering effort as a form of strategic sabotage. Separating between these two mo-tivations for decreased work effort is important as the way one might think about dealingwith discouraged workers is very different from how one might deal with workers who areactively sabotaging their bosses.
Another interesting aspect to our finding is that the tournament design doesn’t seemto affect high ability workers, only lower ability ones. While we do find that high abilityworkers do engage in a small amount of behavior consistent with the model of strategicsabotage, this behavior is uncommon and does not vary with the tournament design. Thereare many possible justifications for that. One is that high ability workers are high abilityin part due to a strong work ethic or some non-pecuniary preferences regarding work. Ifso then such individuals might choose to continue working despite being upset about thepromotion outcome. Also it might be due to low ability individuals being more stronglyaffected by emotions like jealousy and envy.
Previous work demonstrates targets of envy are often likely to be very similar to theenvious party (Festinger (1954); Goethals and Darley (1977)) due to the fact that absentthe similarity, comparisons are diffi cult to make (Mussweiler (2003)). Schaubroeck and Lam(2004) finds some evidence of this hypothesis. In the TI treatment since role assignmentis essentially random, low ability subjects in the worker role may reasonably see those inthe boss role as no different from themselves triggering feelings of envy and therefore thenegative response. However, if worker similarity (or envy) were the only factor determiningthe decrease in worker activity, then we would expect to observe work effort in the RAtreatment similar to the TI treatment because role assignment is effectively random (withrespect to ability in the main task) in both treatments. The fact that we do not indicatesthat more than just similarity is required to trigger this response. For a worker to bediscouraged by a tournament outcome they must judge the mechanism as being unfair insome way. In our experiment, promotion in RA may still be perceived as fair as all subjectshave an equal probability of being promoted. While ex-ante the skill level of the bossesin TI and RA should be approximately equivalent, the perception of the bosses ability, bythe workers, may be different. Those in TI were promoted based on a their performanceon task unrelated to production task. It is not unreasonable to assume that the seeminglyarbitrary promotion mechanism may have inadvertently been interpreted as promoting poorperformers rather than essentially randomly promoting workers.
Using a different experiment design to also examine post tournament behavior McGeeand McGee (2013) found results different from those we present here. That study consistsof two treatments which are similar to our Task Appropriate and Random Assignmenttreatments. They find that workers after a random assignment mechanism choose lowerstylized effort levels in what is essentially a public goods game compared to when therole assignment has occurred through a tournament. The difference in the results betweenthe two studies is certainly important to understand. There are multiple differences inthe designs of the experiments which could account for the difference in the results. Ourexperiments used a real effort production task (and the same one) for both the assignmentand the production phases whereas McGee and McGee (2013) used a stylized effort design fortheir tournament task in which subjects chose effort levels on a range between 0 and 6 withhigher levels being more costly. The curious thing is that one would expect the real effortnature of our design to make subjects feel even more entitled to a preferred role assignment
22

in the tournament mechanism as they may feel that they earned that position throughtheir own actual effort. This should make the random mechanism appear as substantiallyless fair. On the other hand perhaps subjects see scores on real effort tasks like ours asa function of innate ability which is itself the outcome of a (genetic) lottery. This mightexplain why the high ability subjects failed to respond to the treatments as perhaps they aremore likely to believe in the genetic lottery story. The difference in such perceptions wouldbe consistent with the findings of Ku and Salmon (2012) in which a similar split reaction isobserved between high and low ability subjects due to the presence of wage inequality. Infact the result we find here of the low ability subjects being discouraged in the presence ofwage inequality while high ability subjects fail to respond is has the same essential natureas the result found in Ku and Salmon (2012). While the cause for the difference between thecurrent findings and those from McGee and McGee (2013) is unclear, the difference betweenthe real effort design used here and the stylized effort design used there is an interesting onethat bears further analysis in future research as this is an important methodological point.
References
Ambrose, M. L., M. A. Seabright, and M. Schminke (2002). Sabotage in the work-place: The role of organizational injustice. Organizational Behavior and Human DecisionProcesses 89 (1), 947 —965.
Balafoutas, L. and M. Sutter (2012). Affi rmative action policies promote women and donot harm effi ciency in the laboratory. Science 335 (6068), 579—582.
Bandiera, O., I. Barankay, and I. Rasul (2009). Social connections and incentives in theworkplace: Evidence from personnel data. Econometrica 77 (4), 1047—1094.
Bidwell, M. (2011). Paying more to get less the effects of external hiring versus internalmobility. Administrative Science Quarterly 56 (3), 369—407.
Black, S. E. and P. E. Strahan (2001). The division of spoils: Rent-sharing and discrimi-nation in a regulated industry. American Economic Review 91 (4), 814—831.
Bolton, G. E., J. Brandts, and A. Ockenfels (2005). Fair procedures: Evidence from gamesinvolving lotteries. Economic Journal 115, 1054—1076.
Carpenter, J., P. H. Matthews, and J. Schirm (2010). Tournaments and offi ce politics:Evidence from a real effort experiment. American Economic Review 100 (1), 504—517.
Case, A. and C. Paxson (2006). Stature and status: Height, ability, and labor marketoutcomes. Technical report, National Bureau of Economic Research.
Chen, Y. and S. X. Li (2009). Group Identity and Social Preferences. The AmericanEconomic Review 99 (1), 431—457.
Chlaß, N., W. Güth, and T. Miettinen (2013). Purely procedural preferences - beyondprocedural equity and reciprocity. Working Paper.
23

Chowdhury, S. M. and O. Gürtler (2013). Sabotage in contests: A survey. Working PaperUniversity of East Anglia.
Dechenaux, E., D. Kovenock, and R. M. Sheremeta (2012). A survey of experimentalresearch on contests, all-pay auctions and tournaments.
Engel, R. (2007). Why Work When You Can Shirk? Worker Productivity in an Experi-mental Setting. Working Paper Florida State University.
Eriksson, T., S. Teyssier, and M.-C. Villeval (2009). Self-selection and the effi ciency oftournaments. Economic Inquiry 47 (3), 530—548.
Fershtman, C. and U. Gneezy (2011). The tradeoff between performance and quitting inhigh power tournaments. Journal of the European Economic Association 9 (2), 318—336.
Festinger, L. (1954). A theory of social comparison processes. Human relations 7 (2),117—140.
Fischbacher, U. (2007). z-Tree: Zurich Toolbox For Readymade Economic Experiments.Experimental Economics 10 (2), 171—178.
Giacalone, R. A. and P. Rosenfeld (1987). Reasons for employee sabotage in the workplace.Journal of Business and Psychology 1 (4), 367—378.
Gill, D., V. Prowse, and M. Vlassopoulos (2012). Cheating in the workplace: An experi-mental study of the impact of bonuses and productivity. Working Paper.
Goethals, G. R. and J. M. Darley (1977). Social comparison theory: An attributionalapproach. In J. M. Suls and R. L. Miller (Eds.), Social Comparison Processes: Theoreticaland Empirical Perspectives, pp. 259—278. John Wiley & Sons.
Greiner, B. (2004). An online recruitment system for experimental economics. In K. Kre-mer and V. Macho (Eds.), Forschung und wissenschaftliches Rechnen 2003, Volume 63,pp. 79—93. Göttingen: Ges. für Wiss. Datenverarbeitung.
Hamermesh, D. S. and J. E. Biddle (1994). Beauty and the labor market. AmericanEconomic Re 84 (5), 1174—1194.
Hoad, C. (1993). Violence at work: Perspectives from research among 20 british employers.Security Journal 4 (2), 64—86.
Hoffman, E., K. McCabe, K. Shachat, and V. Smith (1994). Preferences, Property Rightsand Anonymity in Bargaining Games. Games and Economic Behavior 7, 346—380.
Kimbrough, E. O., R. M. Sheremeta, and T. Shields (2011). Resolving conflicts by arandom device. Working Paper Chapman University.
Ku, H. and T. C. Salmon (2012). The incentive effects of inequality: An experimentalinvestigation. Southern Economic Journal 79 (1), 46—70.
24

Ku, H. and T. C. Salmon (2014). Procedural fairness and the tolerance for income in-equality. European Economic Review —(—), —.
McGee, A. and P. McGee (2013). After the tournament: Outcomes and effort provision.Working Paper.
Mobius, M. M. and T. S. Rosenblat (2006). Why beauty matters. The American EconomicReview 96 (1), 222—235.
Mohnen, A., K. Pokorny, and D. Sliwka (2008). Transparency, inequity aversion, andthe dynamics of peer pressure in teams: Theory and evidence. Journal of Labor Eco-nomics 26 (4), 693—720.
Mussweiler, T. (2003). Comparison processes in social judgment: Mechanisms and conse-quences. Psychological Review 110 (3), 472.
Nalebuff, B. J. and J. E. Stiglitz (1983). Prizes and incentives: Towards a general theoryof compensation and competition. The Bell Journal of Economics 14 (1), 21—43.
Neuman, J. H. and R. A. Baron (1998). Workplace violence and workplace aggression:Evidence concerning specific forms, potential causes, and preferred targets. Journal ofManagement 24 (3), 391—419.
Niederle, M. and L. Vesterlund (2007). Do Women Shy Away from Competition? Do MenCompete Too Much. Quarterly Journal of Economics 122 (3), 1067—1101.
Prendergast, C. (1999). The provision of incentives in firms. Journal of Economic Litera-ture 37 (1), 7—63.
Schaubroeck, J. and S. S. Lam (2004). Comparing lots before and after: Promotionrejectees’invidious reactions to promotees. Organizational Behavior and Human DecisionProcesses 94 (1), 33—47.
Trautmann, S. T. (2009). A tractable model of process fairness under risk. Journal ofEconomic Psychology 30 (5), 803—813.
25
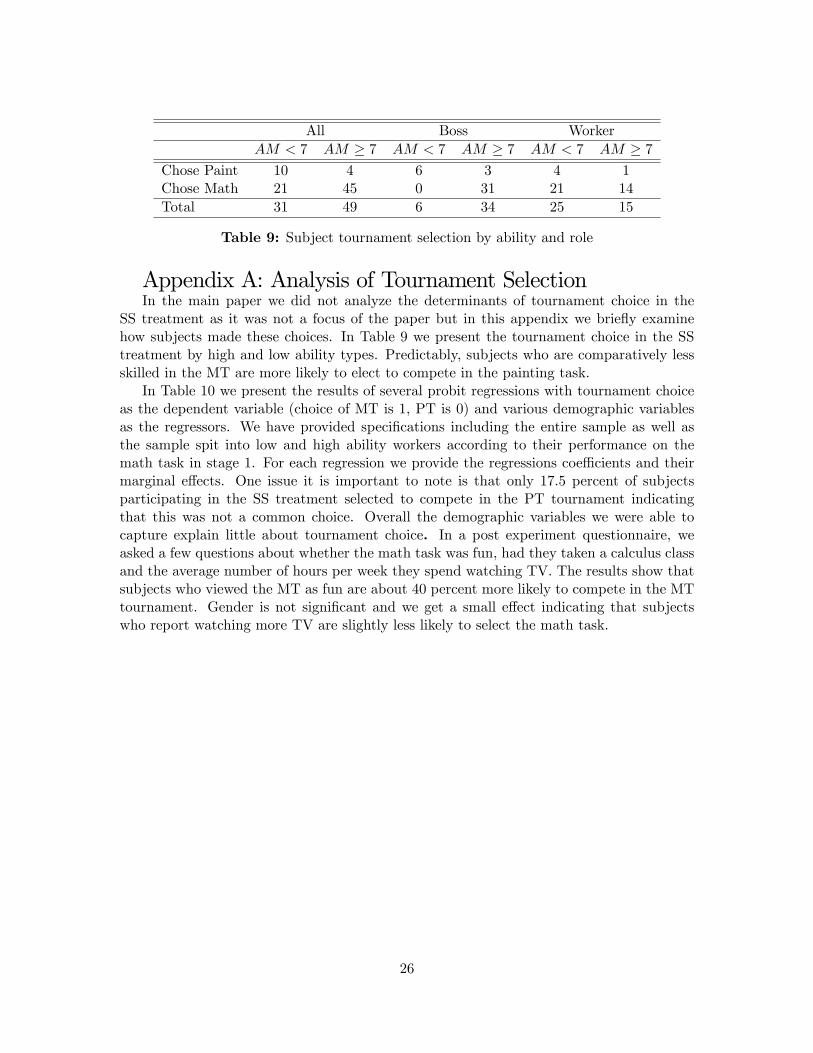
All Boss WorkerAM < 7 AM ≥ 7 AM < 7 AM ≥ 7 AM < 7 AM ≥ 7
Chose Paint 10 4 6 3 4 1Chose Math 21 45 0 31 21 14Total 31 49 6 34 25 15
Table 9: Subject tournament selection by ability and role
Appendix A: Analysis of Tournament SelectionIn the main paper we did not analyze the determinants of tournament choice in the
SS treatment as it was not a focus of the paper but in this appendix we briefly examinehow subjects made these choices. In Table 9 we present the tournament choice in the SStreatment by high and low ability types. Predictably, subjects who are comparatively lessskilled in the MT are more likely to elect to compete in the painting task.
In Table 10 we present the results of several probit regressions with tournament choiceas the dependent variable (choice of MT is 1, PT is 0) and various demographic variablesas the regressors. We have provided specifications including the entire sample as well asthe sample spit into low and high ability workers according to their performance on themath task in stage 1. For each regression we provide the regressions coeffi cients and theirmarginal effects. One issue it is important to note is that only 17.5 percent of subjectsparticipating in the SS treatment selected to compete in the PT tournament indicatingthat this was not a common choice. Overall the demographic variables we were able tocapture explain little about tournament choice. In a post experiment questionnaire, weasked a few questions about whether the math task was fun, had they taken a calculus classand the average number of hours per week they spend watching TV. The results show thatsubjects who viewed the MT as fun are about 40 percent more likely to compete in the MTtournament. Gender is not significant and we get a small effect indicating that subjectswho report watching more TV are slightly less likely to select the math task.
26

All Subjects AM ≥ 7 AM < 7Probit Marg Eff Probit Marg Eff Probit Marg Eff
Math Fun 1.487∗∗∗ 0.389∗∗∗ 1.159 0.155 1.967∗∗ 0.656∗∗∗
(0.481) (0.147) (0.838) (0.192) (0.902) (0.231)
Male 0.692 0.136 0.331 0.0227 0.879 0.306(0.430) (0.090) (0.793) (0.068) (0.704) (0.221)
Took Calc 0.348 0.063 0.664 0.044 0.138 0.051(0.456) (0.083) (0.748) (0.057) (0.755) (0.279)
Age -0.335∗ -0.060∗∗ -0.496 -0.029 -0.168 -0.062(0.176) (0.030) (0.354 ) (0.026) (0.273) (0.100)
TV -0.029∗ -0.005∗ 0.0747 0.004 -0.142∗∗ -0.053∗
(0.015) (0.003) (0.062) (0.004) (0.070) (0.029)
Constant 6.896∗ 9.957 3.925(3.558) (7.433) (5.359)
Observations 80 49 31R2 0.319 0.355 0.4477Standard errors in parentheses*** p<0.01, ** p<0.05, * p<0.1
Table 10: Probit regression of subject’s tournament selection in SS treatments.
Appendix B: InstructionsWelcome to the experiment. I will read the instructions using this script to make sure
that all sessions of the experiment receive the same information. Please feel free to askquestions as they arise. I ask that you do not talk to other participants or look at theirmonitors during the experiment. If you have a question or problem, please raise yourhand and I will come and assist you. Please turn off your cell phones and put away yourbelongings. I will need your complete attention. The instructions of this experiment are
simple, and if you follow them carefully, you can earn a considerable amount of money, inaddition to the 7.00 dollar show-up payment. All the money you earn is yours to keep, andwill be paid to you, by cash, and in private, after the experiment ends. All pay records willbe kept confidential and your earnings today will not be revealed to other participants orknown to anyone other than the experimenter. This experiment will consist of 2 phases. InPhase 1 you will engage in multiple periods of a task based on answering math questionsto earn money. After you have completed the mathematics task, we will next ask you toindicate your preference between 5 pairs of paintings. In phase 2, you will again engage inseveral periods of a task where you will be answering math questions but this time you willbe in a group with another person. One member of the group will be labeled the BLUEmember and the other will be the GREEN member. The BLUE member will be consideredthe group leader and will be in a position to earn more money than the GREEN memberin phase 2.
Your type will be assigned to you at the conclusion of Phase 1 of the experiment andbased on upon the decisions you make in Phase 1. There will also be multiple periods inphase 2 and in each period your type will remain constant as will the composition of yourgroup. You will not be told the identity of the other member of your group. What you
27

will know is that if you are designated the GREEN member then the other member of yourgroup is BLUE and if you are the BLUE member the other member is GREEN. Unlessthere are questions we will now begin the first phase of the experiment.
In this first phase, you will be asked to engage in two tasks which will allow you to earnmoney based on how well you perform in them. The first task is a mathematics based task.You will be asked to add 5 single digit numbers and you will earn 8 cents for each problemyou solve correctly. You will see the digits to add in the middle of the screen and next tothem a text box where you will enter your answer.
Once you have entered your answer, click the "SUBMIT" button. After you have clickedthe "SUBMIT" button, a new problem will appear. You will have 60 seconds to completeas many addition problems as you can.
You will participate in the Mathematics Task for 3 periods.After this first task is completed you will then engage in a second task. You will be
shown 5 pairs of paintings. All we ask you to do is tell us which of the two paintings youprefer. You will be able to click on a button that corresponds to either painting A or B.Once you do so, press the CONFIRM button to move to the next pair of paintings. Youwill have 60 seconds.
Unless there are questions, we will now being the Mathematics Task.You have completed both tasks, the total number of correct answers you submitted for
the Mathematics Task in Phase 1 will be compared to the totals achieved by others intoday’s session. If you scored in the top 50 % in the Mathematics Task you will be assignedthe BLUE role for Phase 2. If you did not score in the top 50 % in the Mathematics Taskyou will be assigned to the GREEN role for Phase 2.
Please click the OK button to view your role.Your role was assigned based on your choices in the Painting Preference Task. Each pair
of paintings consisted of one painting by Paul Klee and one by Wassily Kandinsky. If youhave been assigned to the BLUE role it is because you are among the top 50% of participantswho indicated the strongest preferences for the paintings of Paul Klee in today’s session. Ifyou have been assigned to the GREEN role it is because you did not score in that range onthe task. Please click the OK button to view your role.
You can now choose which task you wish to use to assign your role for Phase 2. Youcan choose between two selection methods, with one based on the Mathematics task andthe other on the Painting Preference task. If you choose the Mathematics Task you willbe assigned the more advantageous BLUE role if the total number of math questions youcorrectly answered is among the top 50 % of the people who have also chosen the Mathe-matics Task. You will be assigned the GREEN role if you are not among the top 50 % ofthat group.
In the Painting Preference Task, each pair of paintings you were shown consisted of onepainting by Paul Klee and one by Wassily Kandinsky. If you choose the Painting PreferenceTask for role assignment, you will be assigned the more advantageous BLUE role if you areamong the top 50 % of people who indicated the strongest preference for the paintings byPaul Klee otherwise you will be assigned the GREEN role.
In order to make groups even, it may be the case that 1 participant could be placedinto a group where roles are set other than how they chose. When this occurs the affectedparticipants will be ranked in that group according to their score in a randomly selected
28

task. You will be informed if you are, or are not, put into a group according to the taskyou selected.
Please click the OK button to select the task that will determine your role.You can now choose which task you wish to use to assign your role for Phase 2. If you
choose the Mathematics Task you will be assigned the more advantageous BLUE role if youare among the top 50 % of the people who have also chosen the Mathematics Task whileyou will be assigned the GREEN role if you are not among the top 50 % of that group.
If you choose the Painting Selection Task you will be assigned the more advantageousBLUE role if you are among the top 50 % of people who indicated a preference for paintingsby Paul Klee otherwise you will be assigned the GREEN role. Please make your choice now.
Your role was assigned based on your performance in the Mathematics Task. If youhave been assigned to the BLUE role it is because the total number of math questions youcorrectly solved was in the top 50% among those participating in today’s session. If youhave been assigned to the GREEN role it is because you did not score in that range on thetask.
Your role was assigned based on your performance in the Painting Preference Task.If you have been assigned to the BLUE role it is because you are among the top 50% ofparticipants who indicated the strongest preferences for the paintings of Paul Klee in today’ssession. If you have been assigned to the GREEN role it is because you did not score inthat range on the task.
You chose to use the Mathematics Task/Painting Preference Task to determine yourrole assignment. Among those who also chose that task, your score on that task was/wasnot in the top 50 % and so you have been assigned the BLUE/GREEN role.
You chose to use the Mathematics Task/Painting Preference Task to determine yourrole assignment. It was not possible to match you in a group where all members sub-mitted the same task as you. The computer has randomly selected to use the Mathe-matics Task/Painting Preference Task scores so grouping will be done by MathematicsTask/Painting Preference Task scores. Your score on that task was/was not the highest inyour group so you have been assigned the BLUE/GREEN role.
You chose to use the Mathematics Task/Painting Preference Task to determine your roleassignment. It was not possible to match you in a group where all members submitted thesame task as you. The computer randomly selected to use the Mathematics Task/PaintingPreference Task scores so grouping will be done by Mathematics Task/Painting PreferenceTask scores. Your score on that task was/was not the highest so you have been assignedthe BLUE/GREEN role.
In this phase of the experiment, you will participate in a math based task where in eachperiod you will be asked to complete as many addition problems as you can in 60 seconds.As before, once you have entered your answer, click the "SUBMIT" button. After you haveclicked the "SUBMIT" button, a new problem will appear.
BLUE players will earn 15 cents for each problem solved correctly. GREEN players willearn 8 cents for each problem solved correctly. BLUE players will also be able to earn abonus based on the productivity level of their group member. If the number of problemssolved by the GREEN type sums to a given threshold during the production period, thenthe BLUE player will earn a bonus of 150 cents on top of his or her earnings from solvingproblems. Note, this threshold will change each period.
29

For those assigned to the GREEN role you also have a second way of making money.You will also be able to engage in a digit identification task. In the digit identification task,you will be shown a string of numeric characters (0 through 9). You will be asked to countthe number of times a specific number occurs in that string and you will earn 4 cents bycorrectly identifying the total number of that number appearing in the string.
On the left hand side of the screen, GREEN players will see the Mathematics Task thatis identical to the one seen in Phase 1 of the experiment. The digit identification task willappear on the right hand side of the screen. In the applicable input box you can enter youranswers. Once you have entered your answer, click the "SUBMIT" button directly underthe applicable input box. After you have clicked the "SUBMIT" button, a new numberstring or addition problem will appear. GREEN players can choose to divide their time ina production period between these two tasks in any manner they choose.
At the end of all periods, all players will be shown their earnings.If you are a GREEN member, you will also see your cumulative earnings as well as
whether or not the BLUE member of your group earned a bonus. If you are a BLUEmember you will be shown your earnings as well as whether or not you earned a bonus.
At the conclusion of period 7 you will be shown your cumulative earnings for the exper-iment. Unless there are questions, we will now begin phase 2 of the experiment.
30

Game Screens
Figure 2: Phase 2 decision screen of worker.
31

Figure 3: Phase 2 decision screen of boss.
32