SaaS revenues, stable customer base and cost
21
ZetaDisplay AB (publ) Interim Report April – June 2020 ZETADISPLAY AB (publ) I HÖJDRODERGATAN 21 212 39 MALMÖ I IR.ZETADISPLAY.COM Page 1 of 21 SaaS revenues, stable customer base and cost
Transcript of SaaS revenues, stable customer base and cost

ZetaDisplay AB (publ) Interim Report
April – June 2020
ZETADISPLAY AB (publ) I HÖJDRODERGATAN 21 212 39 MALMÖ I IR.ZETADISPLAY.COM Page 1 of 21
SaaS revenues, stable customer base and cost

ZetaDisplay AB (publ) Interim Report
April – June 2020
ZETADISPLAY AB (publ) I HÖJDRODERGATAN 21 212 39 MALMÖ I IR.ZETADISPLAY.COM Page 2 of 21
Increased SaaS-revenues, a stable customer base and cost control drive improved profitability
April – June 2020 • Net sales decreased by 19.8% to SEK 78.1 (97.4)
million -
• SaaS revenue increased by 17.8% % to SEK 38.3
(32.5) million
• ARR (Annual Recurring Revenue) increased by
17.8% to SEK 152.3 (129.3) million
• EBITDA amounted to SEK 11.1 (9.6) million
• Operating profit amounted to SEK 2.6 (3.3) million
• Earnings per share before and after dilution amounted
to SEK -0.06 (-0.04) and SEK -0.06
(-0.04) respectively
January - June 2020 • Net sales decreased by SEK -3.8% to SEK 183.6
(190.8) million
• SaaS revenue increased by 21.4% to SEK 77.8 (64.1)
million
• ARR (Annual Recurring Revenue) increased by
17.8% to SEK 152.3 (129.3) million.
• EBITDA amounted to SEK 4.5 (17.8) million.
Adjusted for one-off items, EBITDA amounted to
SEK 21.4 (17.8) million*
• Operating profit amounted to SEK -12.9 (5.2) million*
• Earnings per share before and after dilution amounted
to SEK -0.61 (-0.14) and SEK-0.61
(-0.14) respectively-
Significant events during the quarter • ZetaDisplay signed an additional contract within the existing framework agreement with Swedish Match
• ZetaDisplay entered a partnership with the Irish company Kastus® to provide its patented antimicrobial coating
technology.
• On May 4, 2020, the Annual General Meeting was held in Malmö. The Meeting resolved in all proposed matters in
accordance with the previously published proposals of the Board of Directors or shareholders.
• ZetaDisplay follows its COVID-19 activity plan with a focus on liquidity, cost control and to prioritize long-term
investments
• Jacob Stjernfält appointed as new CFO who will take office on September 1, 2020
Significant events after the quarter • Dutch Gauddi, acquired in October 2019, has been renamed ZetaDisplay.
• ZetaDisplay announces that its software is installed at franchisees of more than 750 quick service restaurants in
Russia.
FINANCIAL INDICATORSAPR-JUNE
APR-JUNE
JAN-JUNE
JAN-JUNE
ROLLING 12
MONTHS JAN-DEC
(TSEK) 2020 2019 2020 2019Q3 2019-Q2 2020
2019
Net sales 78 091 97 443 183 645 190 750 429 026 436 131
SaaS-revenues (recurring) 38 320 32 545 77 813 64 098 150 804 137 089
Annual recurring revenue (ARR) 152 324 129 304 152 324 129 304 165 465
Gross margin (%) 65,7 53,8 59,0 53,1 54,8 52,3
EBITDA 11 063 9 640 4 877 17 762 39 317 52 202
EBITDA-margin (%) 14,2 9,9 2,7 9,3 9,2 12,0
Operating profit* 2 664 3 316 -12 826 5 173 -14 571 3 428
Operating margin (%) 3,4 3,4 -7,0 2,7 -3,4 0,8
Profit/loss for the period -1 605 138 -17 756 -993 -1 722 15 041
Equity ratio (%) 35,5 50,2 35,5 50,2 34,8
Equity per share 9,08 12,22 9,08 12,22 10,03
Earnings per share before dilution (SEK) -0,06 -0,04 -0,61 -0,14 0,22
Earnings per share after dilution (SEK) -0,06 -0,04 -0,61 -0,14 0,22
* Adjusted for items affecting comparability, EBITDA amounted to SEK 21.4 (17.8) million and operating profit to SEK 4.2 (5.2) million. See further page 7.

ZetaDisplay AB (publ) Interim Report
April – June 2020
ZETADISPLAY AB (publ) I HÖJDRODERGATAN 21 212 39 MALMÖ I IR.ZETADISPLAY.COM Page 3 of 21
CEO comment
Increased SaaS revenues, stable customer base and cost control drive improved profitability The second quarter was characterized by
stability in the underlying SaaS business, longer
lead times for new projects and focus on costs
and liquidity. Started projects are running
according to plan, but as a result of COVID-19,
the decision-making process for new invest-
ments has become longer. EBITDA improved by
14% compared to the previous year and
amounted to SEK 11 million. SaaS revenues
increased by 18% and Annual Recurring
Revenue amounted to SEK 152.3 million.
Net sales for the quarter amounted to SEK 78.1
(97.4) million, a decrease of 19.9% compared to
the same quarter previous year. Project sales were
affected by COVID-19 and decreased by almost
40% compared to previous year. Gross profit
decreased by SEK -1.1 million to SEK 51.3 (52.4)
million. Gross margin increased by 22% to 65.7
(53.8) % as result of higher share of SaaS revenue.
The Group's focus on liquidity and the savings
program has contributed to that the Group's
EBITDA amounting to SEK 11.0 (9.6) million, a
margin of 14.2 (9.9) %. Customer losses, churn and
delays in payments have been limited even if
individual customers temporarily closed their
businesses.
Group management has analyzed and acted early
on to meet the consequences of COVID-19. We
have divided our action plan into a short-term focus
on liquidity and costs and long-term priority
investments. The savings program launched last
quarter follows the target of a 20MSEK saving up
to the first quarter of 2021.
The stable and profitable SaaS-revenues with our
secured long-term financing through the SEK 300
million bond loan provides us with headroom for
investing into our offering of products and services.
Investments into offer and organization
The investments in our product and service offering
result in broader functionality in both software and
services. We are close to our customers and pro-
vide value creation. For example, during the quart-
er we launched AccessControl and our technical
cooperation with the Irish company Kastus.
Depending on national regulations, our employees
have either worked from home or based from our
offices during the quarter. Our internal IT structure
and our internal processes are fully designed for
full-scale deliveries to customers regardless of
working methods. No illness related to COVID-19
among our team members were reported which is
very satisfying.
During the quarter, Jacob Stjernfält was recruited
as new CFO. Jacob succeeds Ola Burmark and will
take office on September 1.
Demand on the way back
Our customers remain with our customers, but the
decision-making process has become longer. The
latest development in society is triggering an even
stronger digitalization trend. An independent
industry analysis published in July cemented our
position as a leading Digital Signage company in
the Nordic region and second largest player in
Europe. Our market position, our targeted
investments in the offering and the underlying
growth provide a good platform when demand
picks up again.
With our services and products, we are an im-
portant part of our customers' digitalization journey
and we are well equipped to broaden our offering,
our geographic coverage and thus meet increased
customer requirements.
As countries reopen, we see that demand is re-
turning and planned projects are being restarted.
Our stable and diversified customer base makes us
less sensitive to individual industries and specific
customers.
Outlook
We maintain our strategy of scalability, harmoni-
zation and customer centric action with a focus on
complex, international assignments. We are geared
to grow further, both organically and through
acquisitions.
Malmö, 21 July 2020
Per Mandorf
President and CEO
Financial Reporting dates
Interim Report Jan.-Sept. 2020 4 November 2020
Year End Report 2020 5 February 2021

ZetaDisplay AB (publ) Interim Report
April – June 2020
ZETADISPLAY AB (publ) I HÖJDRODERGATAN 21 212 39 MALMÖ I IR.ZETADISPLAY.COM Page 4 of 21
The Market
Digital signage is a software steered interface for
communication with consumers within a retail
environment or with employees in larger
organizations as well as communication in public
spaces. Digital communication is now an integral
part of the new communications concept that
retailers and other companies are developing for
the future. This creates an interesting, expanding
market for ZetaDisplay, supplying a 360-degree
concept covering strategy, planning, software,
hardware, installation and content production,
analysis as well as technical support and services.
Today, the Group has operations in six European
countries. ZetaDisplay continuously evaluates new
form of alliances with companies and organizations
within Digital Signage to be able to grow the
market together.
Sales of service solutions are increasing as an
important part of the business after the initial
installation and produce steady SaaS-revenues. The
maturity level among our customers is rising, and
ZetaDisplay is receiving enquiries from existing
customers who intend to take the next step and
develop and broaden their investment in this
channel.
To meet current and future customer demands,
ZetaDisplay needs to continuously enhance its
processes, systems, and product solutions. A large
portion of the investments goes into increased
technical functionality and harmonized platforms,
to enable us to exploit economies of scale within
the organization. This is also a way of creating a
secure and future-proof solution for our customers
Significant events in the second quarter ZetaDisplay AB announced on May 18 that an
additional contract had been signed within the
existing framework agreement with Swedish
Match. The company has been a customer since
2015 and additional contracts include screen
installations at leading retail chains around Sweden
in 2020. The total contract value is estimated at
SEK 5 million.
ZetaDisplay AB announced 20 May that Jacob
Stjernfält has been appointed as new CFO and he
will take office no later than September 1, 2020. He
replaces Ola Burmark, who leaves the group during
the summer as previously communicated.
ZetaDisplay AB announced on 26 May a new
partnership with the Irish company Kastus® to
provide its patented antimicrobial coating
technology. The new technology that will soon be
integrated into ZetaDisplay's product portfolio has
proven to be effective against bacteria on surfaces
and can be applied to touch screens and displays
where several users will share these. Independent
studies have shown up to 99.99 percent of bacteria
and fungi including antibiotic-resistant super-
bacteria like MRSA and E. coli were blocked on
screen.
Significant events after the second quarter ZetaDisplay AB announced on July 8th that its
software will be part of the Digital Signage
installation for more than 750 Burger RUS quick
service restaurants in the Russian Federation and
CIS countries. ZetaDisplay's Norwegian subsidiary
Webpro has signed an agreement with the domestic
integrator company Unitex LLC. The contract
initially lasts for one year and can then be extended
for a further four years. The total contract value for
ZetaDisplay is estimated at SEK 3.3 million, which
consists entirely of SaaS revenue.

ZetaDisplay AB (publ) Interim Report
April – June 2020
ZETADISPLAY AB (publ) I HÖJDRODERGATAN 21 212 39 MALMÖ I IR.ZETADISPLAY.COM Page 5 of 21
Financial overview Profit/loss items are compared with the corresponding period last year. Balance sheet items and cash flows represent the position at the end of the period and are compared with the same date last year
Second quarter April – June 2020 Net sales
Net sales for the quarter decreased by -19,8% to
SEK 78.1 (97.4) million compared with the
corresponding quarter last year. Implementation
projects, consisting of hardware and installation
decreased by 39%. While the more significant SaaS
revenues increased by 17.8% and amounted to SEK
38.3 (32.5) million. Annual Recurring Revenue
(ARR) increased by 17.8% to SEK 152.3 (129.3)
million. ARR has decreased by SEK 6.5 million
compared to the previous quarter, which is
explained by the stronger exchange rate for SEK.
The organic change at fixed exchange rates
amounted for net sales to -25.6%, and for SaaS
revenues 4.5%.
Of total net sales, SaaS-revenues accounted for
49,0 (33,4) %.
Gross profit
Gross profit amounted to SEK 51.3 (52.4) million,
corresponding to a gross margin of 65.7 (53.8) %.
The higher gross margin is mainly explained by the
relatively larger share of SaaS-revenues.
Operating expenses
The cost of goods sold amounted to SEK -26.8
(-45.1) million and consists mainly of hardware and
installations. The difference is attributable to a
lower volume of implementation projects caused by
the ongoing COVID-19 pandemic.
Other external costs amounted to SEK -13.9 (-15.2)
million and restraint of mainly use of external
resources.
Personnel costs amounted to SEK -29.6 (-29.7)
million. As part of the Group's savings program,
the cost is on a par with the previous year. This is
even though the number of employees has in-
creased through acquisitions and skills have been
added centrally.
Depreciation amounted to SEK -8.4 (-6.3) million.
The increase is explained by acquisitions and an
increasing proportion of capitalized work for own
account.
EBITDA
EBITDA amounted to SEK 11,1 (9.6) million,
corresponding to an EBITDA margin of 14.2 (9.9) %.
Operating profit
Operating profit amounted to SEK 2.7 (3.3)
million, corresponding to an operating margin of -
3.4 (3.4) %.
Financial items
The financial items amounted to SEK -3.6 (- 1.4)
million. Financial income has been affected by a
non-recurring effect of SEK 5.1 million regarding
revaluation of debt attributable to additional
purchase payments. The underlying financial costs
have increased because of interest expenses
payable to the bond loan.
Tax
The tax expense for the quarter amounted to SEK -
0.7 (- 1.8) million. The tax expense is high in
relation to the profit mainly due to a deficit in the
parent company. A judgement is made that the
deficit is not expected to be utilized in the near
future, and therefore no deferred tax asset has been
reported regarding this deficit.
Profit and loss for the quarter
Profit for the quarter amounted to SEK -1.6 (-0.1)
million. Earnings per share amounted to SEK -0.06
(-0.04) before and after dilution.
Cash flow
During the quarter, the Group generated cash flow
from operating activities of SEK 19.0 (8.0) million.
Cash flow from investment operations amounted
to SEK -5.0 (-5.4) million, of which investments in
intangible fixed assets amounted to SEK -4.5 (-4.1)
million and acquisitions of property, plant and
equipment amounted to SEK -0.5 (-1.3) million.
Cash flow from financing activities amounted to
SEK -9.4 (20.0) million. Total cash flow during the
period amounted to SEK 4.6 (22.6) million.

ZetaDisplay AB (publ) Interim Report
April – June 2020
ZETADISPLAY AB (publ) I HÖJDRODERGATAN 21 212 39 MALMÖ I IR.ZETADISPLAY.COM Page 6 of 21
First six months January – June 2020 Net sales
Net sales for the period decreased by -3.8% to SEK
183.6 (190.8) million, compared with the corres-
ponding period last year. The decrease is explained
by a lower volume of new implementation projects
because of the COVID-19 pandemic. SaaS-
revenues increased by 21.4% to SEK 77.8 (64.1)
million. Annual Recurring Revenue (ARR) in-
creased by 17.8% to SEK 152.3 (129.3) million.
ARR has decreased by SEK 6.5 million compared
to the previous quarter, which is explained by the
stronger exchange rate for SEK. Organic growth at
fixed exchange rates amounted to -12.5% and orga-
nic growth in SaaS revenue was 6.5%. Of total net
sales, SaaS revenue accounted for 42.4 (33.6) %.
Gross profit
Gross profit amounted to SEK 108.4 (101.3)
million, corresponding to a gross margin of 59.0
(53.1) %. The higher gross margin is mainly
explained by a larger share of SaaS-revenues.
Operating expenses
The cost of goods sold amounted to SEK -75.2 (-
89.4) million and consists mainly of hardware and
installations. The lower cost is explained by the
reduced volume of implementation projects.
Other external costs amounted to SEK -35.9 (-28.2)
million, the increase is explained by non-recurring
costs of SEK 6.5 million relates to the first quarter
of the year.
Personnel costs amounted to SEK -73.7 (-60.0)
million and the increase is mainly explained by
non-recurring costs of SEK 8.7 million relating to
the first quarter of the year and by the increasing
number of employees added in connection with the
reinforcements made by increased central
competencies and acquisitions.
Depreciation amounted to SEK -17.7 (-12.6)
million. The increase is explained by acquisitions
and an increasing proportion of capitalized work
for own account.
EBITDA
EBITDA amounted to SEK 4,9 (17,8) million,
corresponding to an EBITDA margin of -2,7 (9,3) %.
EBITDA is affected by items affecting
comparability attributable to non-recurring costs
amounting to SEK 16.5 million. In the
corresponding quarter of the previous year, there
were no items affecting comparability. Adjusted for
this effect, EBITDA amounted to SEK 21,4 (17,8)
million, corresponding to a margin of 11.7 (9.3) %.
Operating profit
Operating profit amounted to SEK -12.8 (5.2) million,
corresponding to an operating margin of -7.0 (2.7) %.
Operating profit is affected by items affecting
comparability attributable to non-recurring costs
amounting to SEK 17.1 million relating to the first
quarter of the year. In the corresponding quarter last
year, there were no items affecting comparability.
Adjusted for this effect, operating profit amounted to
SEK 4.3 (5.2) million, corresponding to an operating
margin of 2.3 (2.7) %.
Financial items
The financial items amounted to SEK -4.6 (-3.5)
million. SEK 5.1 (-) million has a positive effect on
the financial items due to the revaluation of debt
relating to additional purchase consideration. The
underlying financial costs have increased as a result
of interest expenses relating to the bond loan.
Tax
The tax expense for the period amounted to SEK –
0.3 (-2.7) million. The tax expense is high in
relation to the profit mainly due to a deficit in the
parent company. The deficit is not expected to be
utilized in the near future, and therefore no deferred
tax asset has been reported regarding this deficit.
Profit and loss for the quarter
Profit for the first half year amounted to SEK -17.8
(-1.0) million. Earnings per share amounted to SEK
-0.61 (-0.14) before and after dilution.
Cash flow
During the quarter, the Group generated cash flow
from operating activities of SEK 44.2 (6.7) million.
Cash flow from investment activities amounted to
SEK -16.5 (-30.4) million, of which investments in
intangible fixed assets amounted to SEK -8.0 (-7.4)
million and acquisitions of property, plant and
equipment amounted to SEK -1.0 (-2.2) million.
Cash flow from financing activities amounted to
SEK -15.8 (12.7) million. Total cash flow during
the period amounted to SEK 11.9 (-11.0) million.
Financial position
The equity/asset ratio at the end of the first half
year was 35,5 (50,2) %. The Group had a total of
SEK 179,8 (116,5) million in cash and cash
equivalents as of June 30, of which SEK 137,8
(74,8) millions relates to cash and cash equivalents.
Net debt at the end of the first half year amounted
to SEK -181,1 (-81,5) million.

ZetaDisplay AB (publ) Interim Report
April – June 2020
ZETADISPLAY AB (publ) I HÖJDRODERGATAN 21 212 39 MALMÖ I IR.ZETADISPLAY.COM Page 7 of 21
SegmentsZetaDisplay reports per segment. The segments
consist of Sweden (including Denmark and other
markets), Norway and Finland (including the
Baltics), the Netherlands as well as segment
Groupwide. A comparison for the first quarter is
presented below. For financial information by
segment and the period, see note 3.
Second quarter April – June 2020
Segment Sweden reports revenues from external
customers of SEK 21.1 (23.4) million for the
second quarter, corresponding to a decrease of -
10.0%. The reason for the reduction is a lower
proportion of hardware, installation and other
services driven by the longer decision-making
processes for new projects because of the ongoing
COVID-19 pandemic. Profitability-strengthening
measures have contributed to EBITDA amounting
to SEK 1.3 (-1.8) million for the quarter and the
EBITDA margin to 5.7 (-7.6) %.
Segment Norway reports revenues from external
customers of SEK 17.7 (32.3) million for the
second quarter, corresponding to a decrease of
45.2%. The reason for the decrease is a lower
proportion of hardware, installation and other
services driven by the longer decision-making
processes for new projects because of the ongoing
COVID-19 pandemic and the shutdown by the
country during the quarter. EBITDA amounted to
SEK 7.5 (8.4) million for the quarter and the
EBITDA margin to 42.7 (25.9) %. The margin
improvement is explained by the relatively higher
share of SaaS revenues.
Segment Finland reports revenues from external
customers of SEK 14.5 (27.2) million for the second
quarter, corresponding to a decrease of 46.7%.
Finland is the segment where the reduced volume of
implementation projects as a result of COVID-19
has hit the company hardest. This is due to the
relatively lower share of SaaS revenues compared to
the other segments. EBITDA amounted to SEK 2.7
(5.1) million for the quarter and the EBITDA margin
to 18.5 (18.6) %.
Segments Netherlands reports revenues from
external customers of SEK 23.6 (15.9) million for
the second quarter, corresponding to an increase of
48.4%. This segment also had a weaker
development of the new implementation project
because of COVID-19, but the acquisition of
Gauddi during the fourth quarter of 2019 explains
the increase in revenue and EBITDA. EBITDA
amounted to SEK 6.6 (3.3) million for the quarter
and the EBITDA margin to 28.1 (21.0) %.
Group-wide costs have increased by 14.9% from
SEK 9.4 million to SEK 10.8 million. The cost
increase is related to increased harmonization,
professionalization and internationalization of the
entire group
First six months January – June 2020 Segment Sweden reports revenues from external
customers of SEK 52.3 (46.6) million, corres-
ponding to an increase of 12.2%. The reason for the
increase is the rollout of implementation projects
with international customers. EBITDA amounted to
SEK -2.3 (-2.1) million for the period and the
EBITDA margin to -4.3 (-4.5) %.
Segment Norway reports revenues from external
customers of SEK 43.4 (59.6) million,
corresponding to a decrease of 27.2%. The reason
for the decrease is a lower proportion of hardware,
installation and other services driven by the longer
decision-making processes for new projects because
of the ongoing COVID-19 pandemic and the closure
of the country during the second quarter. EBITDA
amounted to SEK 12.8 (14.4) million for the period
and the EBITDA margin to 29.5 (24.2) %.
Segment Finland reports revenues from external
customers of SEK 33.5 (57.0) million, corres-
ponding to a decrease of 41.2%. Finland is the seg-
ment where the reduced volume of implementation
projects as a result of COVID-19 has hit the
company hardest. This is due to the relatively lower
share of SaaS revenues compared to the other
segments. EBITDA amounted to SEK
-0.4 (10.4) million for the period and the EBITDA
margin to -1.1 (18.3) %.
Segments Netherlands reports revenues from
external customers of SEK 50.8 (27.0) million,
corresponding to an increase of 88.1%. This
segment has also had a weaker development of the
new implementation project as a result of COVID-
19, but the acquisition of Gauddi during the fourth
quarter of 2019 explains the increase in revenue
and EBITDA. EBITDA amounted to SEK 10.9
(5.8) million for the period and the EBITDA
margin to 21.4 (20.2) %.
Group-wide costs have increased by 59.5% from
SEK 15.8 million to SEK 25.2 million. The cost
increase is related to increased harmonization,
professionalization and internationalization of the
entire Group.

ZetaDisplay AB (publ) Interim Report
April – June 2020
ZETADISPLAY AB (publ) I HÖJDRODERGATAN 21 212 39 MALMÖ I IR.ZETADISPLAY.COM Page 8 of 21
Parent company The activities of the parent company ZetaDisplay
AB comprises of operations within the segment
Sweden. They include also several Group-wide
support functions for other segments. These include
software development, sales coordination,
purchasing, communications, marketing, delivery,
service and support, and finance.
The parent company's net sales amounted to SEK
23.2 (23.5) million, for the second quarter.
Operating profit amounted to SEK -15.0 (-5.4)
million and profit after tax to SEK -22.3 (-6.5)
million.
The Parent Company had a total of SEK 143,0
(76.2) million in cash and cash equivalents and
unutilized bank credit facilities as of June 30, of
which SEK 113.0 (62.5) million related to cash and
cash equivalents.
Investments in fixed assets during the period
amounted to SEK 2.0 (6.3) million, of which
investment in subsidiaries amounted to SEK 0.0
(0.0) million and investments in intangible assets
amounted to SEK 1.9 (4.4) million.
Other informationNumber of employees The average number of full-time employees was
162 during the past 6-month period,
compared with 136 for the equivalent period last
year.
Transactions with related parties
During the period, in accordance with the decision
of the Annual General Meeting, 484,297 shares
were issued by offsetting the additional purchase
price that the sellers of Gauddi B.V was entitled to.
All transactions are deemed to be on market terms.
In addition, there are no significant transactions
except ordinary salaries and remuneration to senior
executives and their companies, board fees and
issued options.
.
Share-based incentive programs
According to a decision at the AGM, employee
incentive plan TO 2020/2023 have been launched
to the group's employees. In total, 201 500 options
were signed to the price of 1.87 SEK per option. Of
which 159 000 options were subscribed by senior
executives and the newly assigned CFO another
25 000 options.
The options run until March 2023 and each warrant
entitles the holder to 1 ordinary share at a
subscription price of SEK 17.90.
In total, this corresponds to a potential dilution
effect of approximately 0.7% if all warrants were to
be exercised.
The share and shareholdersSince 4 December 2017, ZetaDisplay’s shares on
Small Cap at Nasdaq, the main stock exchange in
Stockholm, Sweden. The share is traded under the
short code ZETA.
Erik Penser Bank is liquidity guarantor for
ZetaDisplay’s ordinary shares. The bank has
undertaken to set purchase and sale prices for these
securities on an ongoing basis.
The number of shareholders of ordinary shares in
ZetaDisplay amounted to 2 000 (2 314) as of June
30, 2020. The shareholder structure per balance
sheet date is shown in the table on the next page.
The company has two outstanding incentive
programs of total 1 206 250 warrants with the right
to subscribe for 1 233 750 shares in the Company.
The programs refer to long-term incentive
programs for staff and senior executives.
All outstanding warrants have a subscription price
that exceeds the current share price and therefore
no dilution in the period

ZetaDisplay AB (publ) Interim Report
April – June 2020
ZETADISPLAY AB (publ) I HÖJDRODERGATAN 21 212 39 MALMÖ I IR.ZETADISPLAY.COM Page 9 of 21
Shareholder
ShareholderTOTAL SHARES
SHARE OF
CAPITAL %
SHARE OF
VOTES %
Nidoco AB (Virala Oy Ab) 3 748 651 13,7% 13,7%
Anders Pettersson 3 306 641 12,1% 12,1%
Mats Johansson 2 562 468 9,4% 9,4%
Anders Moberg 1 221 000 4,5% 4,5%
AMF Fonder 1 176 227 4,3% 4,3%
Magari Venture AS 1 100 000 4,0% 4,0%
LMD Beheer B.V (previous owner Qyn B.V) 1 081 059 4,0% 4,0%
Mats Leander 1 015 000 3,7% 3,7%
Six Sis AG 790 029 2,9% 2,9%
Martin Gullberg 760 500 2,8% 2,8%
Leif Liljebrunn 732 958 2,7% 2,7%
Avanza Pension 680 065 2,5% 2,5%
Mikael Hägg 600 000 2,2% 2,2%
Prioritet Capital AB 512 500 1,9% 1,9%
Andreas Morfiadakis 430 815 1,6% 1,6%
SEB Life International 429 503 1,6% 1,6%
Manu Mesimäki 337 430 1,2% 1,2%
Fredrik Hagen 305 556 1,1% 1,1%
Other shareholders 6 493 906 23,8% 23,8%
TOTAL 27 284 308 100% 100%
Annual General Meeting
On May 4, 2020, the Annual General Meeting was
held in Malmö. The AGM resolved in all proposed
matters in accordance with the Board's or
shareholders' previously published proposals. For
more information, refer to ir.zetadisplay.com.
Significant risks and uncertainties Through its operations, the group is exposed to various
financial risks such as market risk (consisting of cur-
rency risk, interest rate risk and price risk), credit risk
and liquidity risk. The group's overall risk management
means striving for minimal adverse effects on earnings
and position. The group's business risks and risk
management as well as financial risks are described in
detail in the annual report for 2019, pages 32-33. In
addition to the additional risk description on COVID-19
below, no significant events have occurred during the
interim period that affect or change these descriptions of
the Group's risks and management of these.
COVID-19
We have not yet experienced a shortage of the
technical equipment required to fulfill our
deliveries, which we initially feared. There has also
been no shortage of personnel because of illness or
quarantine. However, both new and existing
customers have postponed their investments in
digital communication. This has contributed to
reduced project revenues, which consist of
hardware, installations, and project management.
Several of our customers' operations have been
negatively affected or even closed. This has
exceptionally led to temporary changes in terms
and conditions in subscription services. The group
has not yet suffered any customer losses directly
linked to the COVID-19 pandemic. In the event of
a prolonged pandemic or a second wave, in which
communities are shut down again, this would
increase the risk of a negative impact on the group's
financial position.
Financial objectives
The most important lever in our business model is
the proportion of SaaS-revenues of total sales and
our ability to increase revenue over the lifetime of a
project. The company's success is based on an
efficient and scalable delivery and service platform
that does not increase in complexity and drives
costs when the share of services is increasing.
The financial objectives are:
• SaaS-revenues exceeding MSEK 200 at
the end of 2022.
• Operating income amounting to MSEK
100 at the end of 2022.
• To achieve an equity ratio in the period up
to 2022 between 30 and 50%.
• Use dividends to ensure that the equity
ratio does not exceed 50%.

ZetaDisplay AB (publ) Interim Report
April – June 2020
ZETADISPLAY AB (publ) I HÖJDRODERGATAN 21 212 39 MALMÖ I IR.ZETADISPLAY.COM Page 10 of 21
Malmö 21 July 2020
Per Mandorf
President & CEO
This interim report has not been reviewed by the company’s auditor and is a translation of the original Swedish
year-end report that has been formally approved by the Board of Directors.
This interim report is such information that ZetaDisplay AB (publ) is required to disclose under the EU market
abuse regulation and the Securities Market Act.
The information was submitted, on the authority of Per Mandorf for publication on 21 July 2020 at 08:00
For further information, please contact:
Per Mandorf, President & CEO
Phone 0704- 25 82 34
E-mail [email protected]
Ola Burmark, CFO
Phone 0708-21 57 86
E-mail [email protected]
Daniel Oelker, CCO
Phone 0708-45 80 54
E-mail [email protected]
About ZetaDisplay
ZetaDisplay acts at the heart of digital transformations in physical environments. We contribute to nudging
peoples’ behaviour at the point-of-decision in retail environments, public spaces, and workplace environments.
Our solutions are known as Digital Signage that we develop and offer as SaaS-solutions. We are a European
leader and intend to drive the further consolidation of the market organically and through acquisitions.
ZetaDisplay has its head office in Malmö. The company generated revenues of SEK 436 million in 2019 and
employs 160 staff at nine offices in six European countries. In total, the company handles 50,000 installations
on 50 markets. The share is listed on Nasdaq Stockholm [ZETA].
More information at www.ir.zetadisplay.com

ZetaDisplay AB (publ) Interim Report
April – June 2020
ZETADISPLAY AB (publ) I HÖJDRODERGATAN 21 212 39 MALMÖ I IR.ZETADISPLAY.COM Page 11 of 21
CONSOLIDATED STATEMENT OF COMPREHENSIVE INCOME - SUMMARY
(TSEK)
3 MONTHS 3 MONTHS 6 MONTHS 6 MONTHS 12 MONTHS
APR-JUNE APR-JUNE JAN-JUNE JAN-JUNE JAN-DEC
2020 2019 2020 2019 2019
Net turnover 78 091 97 443 183 645 190 750 436 131
Capitalized work on own account 3 144 2 228 6 048 4 704 9 756
Total Revenue 81 235 99 671 189 693 195 454 445 887
Operating expenses
Goods for resale -26 760 -45 052 -75 208 -89 446 -207 992
Other external expenses -13 854 -15 238 -35 864 -28 225 -63 077
Personnel expenses -29 558 -29 741 -73 744 -60 021 -122 616
Depreciations and write-downs -8 399 -6 324 -17 703 -12 589 -48 774
Operating profit 2 664 3 316 -12 826 5 173 3 428
Financial income 5 703 607 12 338 1 701 29 042
Financial expenses -9 318 -1 960 -16 926 -5 206 -15 809
Profit/loss after financial items -951 1 963 -17 414 1 668 16 661
Tax -654 -1 825 -342 -2 661 -1 620
Net proft/loss -1 605 138 -17 756 -993 15 041
Profit/loss per share before dilution, SEK -0,06 -0,04 -0,61 -0,14 0,22
Profit/loss per share after dilution, SEK -0,06 -0,04 -0,61 -0,14 0,22
Average number of ordinary shares before dillution, SEK 29 056 27 972 28 926 26 942 27 828
Average number of ordinary shares after dillution, SEK 29 056 28 216 28 926 27 172 27 828
CONSOLIDATED STATEMENTS OF COMPREHENSIVE INCOME
(TSEK)
3 MÅN 3 MÅN 6 MÅN 6 MÅN 12 MÅN
APR-JUNI APR-JUNI JAN-JUNI JAN-JUNI JAN-DEC
2020 2019 2020 2019 2019
Profit/loss for the period -1 605 138 -17 756 -993 15 041
Items that may later be transferred to profit/loss for the period
Translations differences -13 480 5 615 -14 488 17 277 9 604
Comprehensive income for the period -15 085 5 753 -32 244 16 284 24 645
Attributable to shareholders in the Parent Company -15 085 5 753 -32 244 16 284 24 645

ZetaDisplay AB (publ) Interim Report
April – June 2020
ZETADISPLAY AB (publ) I HÖJDRODERGATAN 21 212 39 MALMÖ I IR.ZETADISPLAY.COM Page 12 of 21
CONSOLIDATED BALANCE SHEET - SUMMARY
(TSEK)
2020-06-30 2019-06-30 2019-12-31
ASSETS
Intangible assets 456 665 428 573 474 335
Tangible assets 8 192 8 306 9 493
Right of use assets 17 429 15 504 19 357
Deferred tax assets 3 160 3 109 3 183
Financial non-current assets 130 130 130
Total non-current assets 485 576 455 622 506 498
Inventories 8 750 14 961 9 779
Current receivables 66 004 94 290 128 773
Cash and cash equivalents 137 804 74 783 128 289
Total current assets 212 558 184 034 266 841
TOTAL ASSETS 698 134 639 656 773 339
EQUITY AND LIABILITIES
Equity attributable to shareholders in the Parent Company 247 760 321 020 268 759
Total equity 247 760 321 020 268 759
Provisions 7 468 339 352
Non-current liabilities 323 700 167 517 327 436
Current liabilities 119 206 150 780 176 792
Total liabilities 442 906 318 297 504 228
TOTAL EQUITY AND LIABILITIES 698 134 639 656 773 339
ZetaDisplay AB (publ) Interim Report
April – June 2020
ZETADISPLAY AB (publ) I HÖJDRODERGATAN 21 212 39 MALMÖ I IR.ZETADISPLAY.COM Page 13 of 21
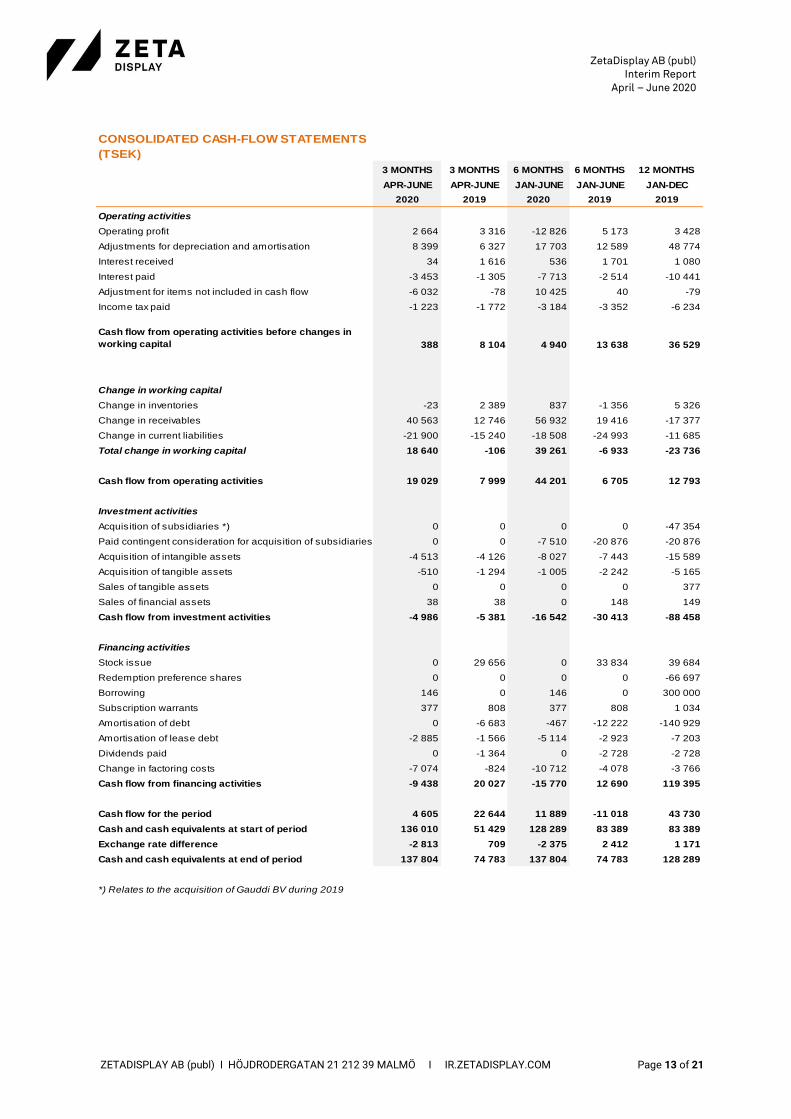
CONSOLIDATED CASH-FLOW STATEMENTS
(TSEK)
3 MONTHS 3 MONTHS 6 MONTHS 6 MONTHS 12 MONTHS
APR-JUNE APR-JUNE JAN-JUNE JAN-JUNE JAN-DEC
2020 2019 2020 2019 2019
Operating activities
Operating profit 2 664 3 316 -12 826 5 173 3 428
Adjustments for depreciation and amortisation 8 399 6 327 17 703 12 589 48 774
Interest received 34 1 616 536 1 701 1 080
Interest paid -3 453 -1 305 -7 713 -2 514 -10 441
Adjustment for items not included in cash flow -6 032 -78 10 425 40 -79
Income tax paid -1 223 -1 772 -3 184 -3 352 -6 234
Cash flow from operating activities before changes in
working capital 388 8 104 4 940 13 638 36 529
Change in working capital
Change in inventories -23 2 389 837 -1 356 5 326
Change in receivables 40 563 12 746 56 932 19 416 -17 377
Change in current liabilities -21 900 -15 240 -18 508 -24 993 -11 685
Total change in working capital 18 640 -106 39 261 -6 933 -23 736
Cash flow from operating activities 19 029 7 999 44 201 6 705 12 793
Investment activities
Acquisition of subsidiaries *) 0 0 0 0 -47 354
Paid contingent consideration for acquisition of subsidiaries 0 0 -7 510 -20 876 -20 876
Acquisition of intangible assets -4 513 -4 126 -8 027 -7 443 -15 589
Acquisition of tangible assets -510 -1 294 -1 005 -2 242 -5 165
Sales of tangible assets 0 0 0 0 377
Sales of financial assets 38 38 0 148 149
Cash flow from investment activities -4 986 -5 381 -16 542 -30 413 -88 458
Financing activities
Stock issue 0 29 656 0 33 834 39 684
Redemption preference shares 0 0 0 0 -66 697
Borrowing 146 0 146 0 300 000
Subscription warrants 377 808 377 808 1 034
Amortisation of debt 0 -6 683 -467 -12 222 -140 929
Amortisation of lease debt -2 885 -1 566 -5 114 -2 923 -7 203
Dividends paid 0 -1 364 0 -2 728 -2 728
Change in factoring costs -7 074 -824 -10 712 -4 078 -3 766
Cash flow from financing activities -9 438 20 027 -15 770 12 690 119 395
Cash flow for the period 4 605 22 644 11 889 -11 018 43 730
Cash and cash equivalents at start of period 136 010 51 429 128 289 83 389 83 389
Exchange rate difference -2 813 709 -2 375 2 412 1 171
Cash and cash equivalents at end of period 137 804 74 783 137 804 74 783 128 289
*) Relates to the acquisition of Gauddi BV during 2019

ZetaDisplay AB (publ) Interim Report
April – June 2020
ZETADISPLAY AB (publ) I HÖJDRODERGATAN 21 212 39 MALMÖ I IR.ZETADISPLAY.COM Page 14 of 21
STATEMENT OF CHANGES IN EQUITY – SUMMARY
(TSEK)
GROUPCAPITAL
STOCK
ADDITIONAL
PAID-IN
CAPITAL
TRANSLATION
RESERVES
ACCUMULATED
RESULTSTOTAL EQUITY
Attributable to
shareholders in the
parent company
Opening balance 2019-01-01 24 750 286 342 5 488 -45 122 271 458
Changes in equity
2019-01-01 - 2019-12-31
Comprehensive income for the period 9 603 15 041 24 644
Transactions with shareholders:
Approved distribution of preference shares -1 364 -1 364
Option premiums received 1 034 1 034
Redemption preference shares -606 -66 091 -66 697
Stock issue 2 656 38 101 40 757
Issue expenses -1 073 -1 073
Closing balance 2019-12-31 26 800 256 949 15 091 -30 081 268 759
Changes in equity
2020-01-01 - 2020-06-30
Comprehensive income for the period -14 488 -17 756 -32 244
Transactions with shareholders:
Option premiums received 378 378
Stock issue 484 10 383 10 867
Closing balance 2020-06-30 27 284 267 710 603 -47 837 247 760

ZetaDisplay AB (publ) Interim Report
April – June 2020
ZETADISPLAY AB (publ) I HÖJDRODERGATAN 21 212 39 MALMÖ I IR.ZETADISPLAY.COM Page 15 of 21
PARENT COMPANY INCOME STATEMENT - SUMMARY
(TSEK)
3 MONTHS 3 MONTHS 6 MONTHS 6 MONTHS 12 MONTHS
APR-JUNE APR-JUNE JAN-JUNE JAN-JUNE JAN-DEC
2020 2019 2020 2019 2019
Net sales 23 222 23 488 57 503 45 815 108 916
Capitalized work on own account 1 167 1 350 2 546 2 746 5 791
Total income 24 389 24 838 60 049 48 561 114 707
Operating expenses
Goods for resale -10 244 -11 960 -27 829 -22 153 -48 482
Other external expenses -12 449 -8 911 -21 486 -16 627 -36 867
Personnel expenses -14 836 -8 508 -24 162 -17 189 -36 258
Depreciation and amortisation -1 854 -864 -3 346 -1 778 -3 722
Operating profit -14 994 -5 405 -16 774 -9 186 -10 622
Result from participations in group companies 0 0 0 9 962 43 501
Interest income 1 512 528 8 584 1 578 3 246
Interest expenses -8 860 -1 661 -16 046 -4 533 -14 262
Profit/loss after financial items -22 342 -6 538 -24 236 -2 179 21 863
Tax 0 0 0 0 0
Profit/loss for the period* -22 342 -6 538 -24 236 -2 179 21 863
*) The profit/loss for the period for the parent company matches the comprehensive income

ZetaDisplay AB (publ) Interim Report
April – June 2020
ZETADISPLAY AB (publ) I HÖJDRODERGATAN 21 212 39 MALMÖ I IR.ZETADISPLAY.COM Page 16 of 21
PARENT COMPANY BALANCE SHEET – SUMMARY
(TSEK)
2020-06-30 2019-06-30 2019-12-31
ASSETS
Intangible assets 15 823 11 541 15 240
Tangible assets 2 940 2 933 3 360
Participations in group companies 366 013 395 754 373 127
Deferred tax assets 1 217 1 217 1 217
Financial non-current assets 130 130 130
Total non-current assets 386 123 411 575 393 074
Inventories 2 397 3 272 3 305
Current receivables 88 770 47 922 99 567
Cash and cash equivalents 113 015 62 506 110 401
Total current assets 204 182 113 700 213 273
TOTAL ASSETS 590 305 525 275 606 347
EQUITY AND LIABILITIES
Equity 224 054 274 228 237 423
Total equity 224 054 274 228 237 423
Provisions 3 079 339 352
Non-current liabilities 300 833 133 911 300 652
Current liabilities 62 339 116 797 67 920
Total liabilities 363 172 250 708 368 572
TOTAL EQUITY AND LIABILITIES 590 305 525 275 606 347

ZetaDisplay AB (publ) Interim Report
April – June 2020
ZETADISPLAY AB (publ) I HÖJDRODERGATAN 21 212 39 MALMÖ I IR.ZETADISPLAY.COM Page 17 of 21
Noter
Note 1 ZetaDisplay Group
ZetaDisplay AB (publ), 556603-4434, is a Swedish public limited company registered in Malmö municipality, Skåne county.
The company’s head office is located in Malmö, at this address: Höjdrodergatan 21, 212 39 Malmö
COMPANY REG. NUMBER SEAT SHARES
ZetaDisplay AB (Publ) 556603-4434 Malmö
ZetaDisplay Sverige AB 556642-5871 Malmö 100
ZetaDisplay Finland OY 1914200-9 Vantaa 100
ZetaDisplay Danmark A/S 29226342 Köpenhamn 100
ZetaDisplay Baltics OU 12435080 Tallinn 100
ZetaDisplay BV 27285283 Rosmalen 100
Gauddi BV 29049518 Moordrecht 100
Gauddi International BV 71336435 Moordrecht 100
Gauddi Inc D18921700 Baltimore 100
ProntoTV AS 981106431 Oslo 100
LiveQube AS 995543478 Oslo 100
Webpro AS 882172732 Trondheim 100
Webpro International AS 912298795 Trondheim 100
Note 2 Accounting principles
The consolidated financial statements for ZetaDisplay
AB (publ) have been drawn up in accordance with
International Financial Reporting Standards (IFRS) as
adopted by the EU, the Swedish Annual Accounts Act,
and RFR 1 “Supplementary Accounting Rules for
Groups” from the Swedish Financial Reporting Board.
The parent company’s financial reports have been drawn
up in accordance with the Swedish Annual Accounts Act
and RFR 2 “Accounting for Legal Entities.
The Group applies the same accounting principles and
calculation methods as in the most recent annual report
with additions to what is described below regarding
government grants.
During the first quarter the Group made the Group
increased the credit risk reserve in accordance with IFRS
9 as a result of the current COVID-19 pandemic.
New standards and interpretations that are effective from
January 1, 2020 have not had any effect on the Group's
or parent company's financial statements for the interim
period. The interim report has been drawn up in
compliance with IAS 34 Interim Reporting. Details
required under IAS 34 are provided both in notes and
elsewhere in the interim report.
The ESMA guidelines on Alternative Performance
Measures have been applied, which means that the report
covers disclosure requirements for financial measures
which are not defined under IFRS. For definitions see
page 22–23.
Government grants
Government grants are reported in accordance with IAS
20 when there is reasonable assurance that the company
will meet the requirements that follow from the grants
and that the company will receive the grant. Government
grants applied for, which the company deems to fall
within the framework of IAS 20, are reported as other
income during the periods that the grant is to
compensate.
During the quarter, subsidiaries in four countries applied
for government grants because of COVID-19. The period
to which the grants relate amounts to three months and is
reported under other income in the Group and as other
services in the segments corresponding to SEK 2.5
million. The grants relate to support for personnel costs
of SEK 2.2 million and other external costs of SEK 0.3
million.

ZetaDisplay AB (publ) Interim Report
April – June 2020
ZETADISPLAY AB (publ) I HÖJDRODERGATAN 21 212 39 MALMÖ I IR.ZETADISPLAY.COM Page 18 of 21
Note 3 Segment reporting
2020 2019 2020 2019 2020 2019 2020 2019 2020 2019 2020 2019 2020 2019
SaaS-revenues (recurring) 7 723 7 192 10 487 11 630 6 138 6 230 13 972 7 493 0 0 0 0 38 320 32 545
Hardware, installation and other services 13 361 16 216 7 170 20 667 8 343 20 923 9 720 6 617 1 177 475 0 0 39 771 64 898
Internal income 983 0 0 0 0 3 -50 1 829 2 552 3 592 -3 485 -5 424 0 0
Total income 22 067 23 408 17 657 32 297 14 481 27 156 23 642 15 939 3 729 4 067 -3 485 -5 424 78 091 97 443
EBITDA *) 1 253 -1 768 7 536 8 380 2 684 5 050 6 638 3 340 -7 048 -5 358 0 0 11 062 9 644
EBITDA margin 5,7% -7,6% 42,7% 25,9% 18,5% 18,6% 28,1% 21,0% 14,2% 9,9%
Depreciation and amortisation -544 -509 -1 819 -1 784 -979 -513 -1 738 -791 -3 701 -3 114 384 384 -8 398 -6 327
Operating profit 709 -2 277 5 717 6 596 1 705 4 537 4 899 2 549 -10 749 -8 472 384 384 2 664 3 317
Financial income 5 703 607
Financial expenses -9 319 -1 960
Profit before tax 709 -2 277 5 717 6 596 1 705 4 537 4 899 2 549 -10 749 -8 472 384 384 -952 1 964
GROUP-WIDEGROUP
ELIMINATIONSTOTAL FOR THE GROUPTSEK
APR-JUNE
SWEDEN NORWAY FINLAND NETHERLANDS
2020 2019 2020 2019 2020 2019 2020 2019 2020 2019 2020 2019 2020 2019
Intangible assets 0 0 13 377 12 270 7 626 9 434 4 850 2 679 423 597 398 442 7 215 5 748 456 665 428 573
Tangible assets 2 702 3 556 4 816 8 403 5 863 1 900 6 883 3 650 5 358 6 301 0 0 25 622 23 810
Total intangible and tangible assets 2 702 3 556 18 193 20 673 13 489 11 334 11 733 6 329 428 955 404 743 7 215 5 748 482 287 452 383
INTANGIBLE AND TANGIBLE ASSETS
TSEK
JUNE
SWEDEN NORWAY FINLAND NETHERLANDS GROUP-WIDEGROUP
ELIMINATIONSTOTAL FOR THE GROUP
2020 2019 2020 2019 2020 2019 2020 2019 2020 2019 2020 2019 2020 2019
SaaS-revenues (recurring) 15 523 14 122 22 105 22 936 12 254 12 170 27 932 14 870 0 0 0 0 77 813 64 098
Hardware, installation and other services 36 763 32 465 21 282 36 614 21 239 44 778 22 768 12 131 3 780 664 0 0 105 832 126 652
Internal income 1 568 25 0 0 0 9 59 1 901 5 280 4 336 -6 908 -6 271 0 0
Total income 53 854 46 612 43 387 59 550 33 493 56 957 50 759 28 902 9 060 5 000 -6 908 -6 271 183 645 190 750
EBITDA *) -2 299 -2 093 12 813 14 413 -361 10 422 10 873 5 835 -16 148 -10 815 0 0 4 877 17 762
EBITDA margin -4,3% -4,5% 29,5% 24,2% -1,1% 18,3% 21,4% 20,2% 2,7% 9,3%
Depreciation and amortisation -1 141 -974 -3 742 -3 521 -1 927 -1 328 -3 413 -1 531 -8 247 -6 203 768 968 -17 702 -12 589
Operating profit -3 440 -3 067 9 071 10 892 -2 288 9 094 7 460 4 304 -24 395 -17 018 768 968 -12 825 5 173
Financial income 12 338 1 701
Financial expenses -16 926 -5 206
Profit before tax -3 440 -3 067 9 071 10 892 -2 288 9 094 7 460 4 304 -24 395 -17 018 768 968 -17 413 1 668
GROUP-WIDE GROUP TOTAL FOR THE GROUPTSEK
JAN - JUNE
SWEDEN NORWAY FINLAND NETHERLANDS
2020 2019 2020 2019 2020 2019 2020 2019 2020 2019 2020 2019 2020 2019
Intangible assets 0 0 13 377 12 270 7 626 9 434 4 850 2 679 423 597 398 442 7 215 5 748 456 665 428 573
Tangible assets 2 702 3 556 4 816 8 403 5 863 1 900 6 883 3 650 5 358 6 301 0 0 25 622 23 810
Total intangible and tangible assets 2 702 3 556 18 193 20 673 13 489 11 334 11 733 6 329 428 955 404 743 7 215 5 748 482 287 452 383
INTANGIBLE AND TANGIBLE ASSETS
TSEK
JUNE
SWEDEN NORWAY FINLAND NETHERLANDS GROUP-WIDE GROUP TOTAL FOR THE GROUP
SaaS-revenue consists in the period and quarter of revenue reported over time and hardware, installation and other services,
and internal revenue consists of revenues that are recognized at point in time.
FIXED ASSETS PER GEOGRAPHICAL AREA*
TSEK 2020-06-30 2019-06-30
Sweden 24 551 22 098
Denmark 700 674
Norway 83 073 81 514
Finland 162 749 189 441
Netherlands 211 217 158 657
Total fixed assets 482 290 452 383
*Does not reconcile with the breakdown of fixed assets in the segment reporting.
Goodwill and other surplus values are presented in a group-wide segment to the
Chief Executive Officer but is included in different geograpgical areas. A segment
can also contain several geographical areas.

ZetaDisplay AB (publ) Interim Report
April – June 2020
ZETADISPLAY AB (publ) I HÖJDRODERGATAN 21 212 39 MALMÖ I IR.ZETADISPLAY.COM Page 19 of 21
Note 4 Financial assets and liabilities
(TSEK) 2020-06-30 2019-06-30 2019-12-31
Financial ssets measured
at amortized cost (Hold to Collect)
Trade accounts receivable 42 586 54 149 97 943
Contract assets 7 158 19 301 8 958
Other financial receivables 130 130 130
Cash and cash equivalents 137 804 74 783 128 289
Financial assets 187 679 148 363 235 320
Financial liabilities
Other financial liab ilities valued at amortised cost
Liabilities to credit institutions 6 463 141 291 15 075
Debenture loan 295 380 0 294 530
Leasing liability 16 468 14 699 18 861
Liabilities to related parties 600 301 121
Trade accounts payable 19 941 29 978 40 202
Financial liab ilities measured at fair value
Contingent considerations relating to acquisitions 11 321 47 009 38 049
Financial liabiltities 350 172 257 054 406 838
Contingent considerations Webpro Gauddi Totalt
Opening balance 2020-01-01 20 312 17 737 38 049
Exchange rate changes -3 891 156 -3 735
Payment of contingent considerations 0 -17 893 -17 893
Reassessment of additional purchase price -5 100 0 -5 100
Closing balance 2020-06-30 11 321 0 11 321
Webpro Gauddi Totalt
Expected payment 2020 11 321 0 11 321
Total expected payment 11 321 0 11 321
The liabilities are contingent considerations relating to acquisitions.
During 2020 a change has been made regarding the expected payment in 2020 of additional consideration for the acquisition
of Webpro AS.
There has been a change in the size of the expected payment of the additional consideration attributable to the acquisition of
Webpro AS. The reason for this is because the agreed target for license revenue for the period 2019-07-01 - 2020-06-30 has
not been fully met. According to the new assessment, 37% of the agreed additional consideration is expected to be paid and
thus SEK 5.100 thousand has been recognized in the Group's result under financial income.

ZetaDisplay AB (publ) Interim Report
April – June 2020
ZETADISPLAY AB (publ) I HÖJDRODERGATAN 21 212 39 MALMÖ I IR.ZETADISPLAY.COM Page 20 of 21
Alternative performance measurements ZetaDisplay presents some financial measures in its financial reports which are not defined under IFRS. The
company considers that these measures provide valuable additional information to investors, as they allow the
company’s performance to be assessed. As not all businesses calculate financial measures in the same way,
these are not always comparable with measures used by other companies. These financial measures should
therefore not be regarded as a substitute for measures defined under IFRS
Non-IFRS measures Definition Reason
ARR (Annual recurring
revenue)
Last month for the quarter/period SaaS-revenues
(recurring) calculated to 12 months.
The performance measure indicates recurring
revenues over the next 12 months based on revenues from existing customers at the end of the
period. The key ratio is also essential to facilitate
industry comparison
Gross margin Net sales minus cost of goods for resale in relation to net sales.
Measure to show the margin before the effect of costs such as other external expenses, staff costs
and depreciation.
Equity per share Equity divided by the number of shares outstanding at end of period.
Measure of the company’s net value per share.
EBITDA Operating profit excl. depreciation and
amortization of tangible and intangible noncurrent
assets.
EBITDA is adjusted for items that affect
comparability, so the company believes this is a
useful indicator of results from operating activities.
EBITDA-margin EBITDA in relation to net sales. The EBITDA margin is adjusted for items that
affect comparability, so the company believes this is a useful indicator of the margin from operating
activities.
SaaS-revenues
(recurring)
Income of a recurring nature such as licenses, support and other agreed income.
This measure is useful in showing how much of the revenue is of a recurring nature and how it
nominally changes between quarters and over
time.
Operating profit Profit/loss for the period before financial items and tax.
Operating profit is a useful indicator of income from operating activities.
Operating margin Operating profit in relation to net sales. The operating margin is a useful indicator to
compare the change in operating profit between two periods.
Equity ration Equity in relation to total assets. The company considers that this indicator is
useful, and a supplement to other performance
measures, for assessing the possibility of making dividend payments and strategic investments and
to judge the company’s ability to meet its financial
commitments.

ZetaDisplay AB (publ) Interim Report
April – June 2020
ZETADISPLAY AB (publ) I HÖJDRODERGATAN 21 212 39 MALMÖ I IR.ZETADISPLAY.COM Page 21 of 21
ALTERNATIVE PERFORMANCE MEASURES
SAAS-REVENUES (RECURRING) APR-JUNE APR-JUNE JAN-JUNE JAN-JUNEROLLING 12
MONTHS JAN-DEC
(T SEK) 2020 2019 2020 2019 Q3 2019-Q2 2020 2019
License income 34 550 27 001 67 826 50 387 126 967 109 528
Support and other contractual services 3 770 5 544 9 987 13 711 23 837 27 561
Total SaaS-revenues 38 320 32 545 77 813 64 098 150 804 137 089
ARR (ANNUAL RECURRING REVENUE) APR-JUNE APR-JUNE JAN-JUNE JAN-JUNEROLLING 12
MONTHS JAN-DEC
(T SEK) 2020 2019 2020 2019 Q3 2019-Q2 2020 2019
SaaS-revenues last month in the quarter 12 694 10 775 12 694 10 775 13 789
Multiplied with 12 months 12 12 12 12 12
ARR (Annual recurring revenue) 152 324 129 304 152 324 129 304 165 465
Annual recurring revenue is not calculated on rolling 12 months as ARR is a forward-looking financial indicator, while
rolling 12 months is reverse-going financial indicator.
GROSS MARGIN APR-JUNE APR-JUNE JAN-JUNE JAN-JUNEROLLING 12
MONTHS JAN-DEC
(T SEK) 2020 2019 2020 2019 Q3 2019-Q2 2020 2019
Net sales 78 091 97 443 183 645 190 750 429 026 436 131
Total income 78 091 97 443 183 645 190 750 429 026 436 131
Operating expenses
Goods for resale -26 760 -45 052 -75 208 -89 446 -193 754 -207 992
Gross profit 51 331 52 391 108 437 101 304 235 272 228 139
Gross margin (%) 65,7 53,8 59,0 53,1 54,8 52,3
EBITDA APR-JUNE APR-JUNE JAN-JUNE JAN-JUNEROLLING 12
MONTHS JAN-DEC
(T SEK) 2020 2019 2020 2019 Q3 2019-Q2 2020 2019
Operating profit 2 664 3 316 -12 826 5 173 -14 571 3 428
Depreciation and amortisation -8 399 -6 324 -17 703 -12 589 -53 888 -48 774
EBITDA 11 063 9 640 4 877 17 762 39 317 52 202
EBITDA-margin (%) 14,2 9,9 2,7 9,3 9,2 12,0
OPERATING MARGIN APR-JUNE APR-JUNE JAN-JUNE JAN-JUNEROLLING 12
MONTHS JAN-DEC
(T SEK) 2020 2019 2020 2019 Q3 2019-Q2 2020 2019
Net sales 78 091 97 443 183 645 190 750 429 026 436 131
Operating profit 2 664 3 316 -12 826 5 173 -14 571 3 428
Operating margin (%) 3,4 3,4 -7,0 2,7 -3,4 0,8
EQUITY PER SHARE
(T SEK) 2020-06-30 2019-06-30 2019-12-31
Equity (TSEK) 247 760 321 020 268 759
Total ordinary shares at end of period 27 284 308 26 275 044 26 800 011
Equity per share (SEK) 9,08 12,22 10,03
EQUITY RATIO
(T SEK) 2020-06-30 2019-06-30 2019-12-31
Equity 247 760 321 020 268 759
Totalt assets 698 134 639 656 773 339
Equity ratio (%) 35,5 50,2 34,8