Biosecurity and emergency animal disease preparedness for ...
SA PEST ANIMAL RISK MANAGEMENT GUIDE
NRM Biosecurity Unit, Biosecurity SA
INTRODUCTION
The SA Pest Animal Risk Management Guide was developed by Biosecurity SA in conjunction with Rural Solutions SA and Natural Resources Management (NRM) boards to help prioritise risk posed by established pest animals for ranking control programs. Please note that this risk assessment guide was developed to assess terrestrial exotic mammals and birds only. It is not suitable to assess the risk of exotic amphibians or reptiles. There are currently no exotic reptiles or amphibians with established populations in SA.
Separate guides may be developed to assess reptiles and amphibians if required. A series of questions are answered to compare the relative risk and feasibility of control of different pest animals. Pest animals are assessed separately for various land uses to identify the most important pests for each land use. This guide is based on and consistent with the SA Weed Risk Assessment System developed by
Dr John Virtue for South Australian NRM boards. This pest animal risk assessment system can be broadly applied to different geographic scales and for any land use. Other existing risk assessment systems have been used in the development of this guide (see references).
Use this guide when filling out the accompanying Excel scoresheet. The questions can apply to any type of pest animal in any land use. If you don’t know the answer for a certain question
(eg. because the animal is not present in your area) choose the „don't know‟ option, and seek others opinions (eg. Vertebrate Pest Committee Risk Assessments, Pre-border Import Risk Assessments completed for the Australian Government, technical advisers, other Boards, researchers and landholders,). „Don't know‟ is treated as „0‟ for the Comparative Pest Animal Risk scoring and gets a maximum score for the Feasibility of Containment scoring. This avoids bias against pest animals that have a score for all questions. However, pest animals that have one or more questions, answered as „don't know‟ are indicated as such at their final score. Sharing information and scores is the key to building up knowledge and getting the most out of the SA Pest Animal Risk Management System. Answering questions as a group is better than making an individual assessment. It is particularly important to get consensus on assumptions about typical pest animal control in the land use. This scoring system is a tool to help make objective, informed decisions on pest animal control priorities. Comments on the system are welcome for future improvements in its accuracy and ease of use. Mark Williams NRM Biosecurity Unit Biosecurity SA GPO Box 1671 ADELAIDE SA 5001 Phone: 08 8303 9520 Email: [email protected]
LAND USES
Different pest animals are important in different land uses. For example, competitive grazing
animals and seed-eaters cause problems in crop/pasture rotations whilst browsing animals and predators may cause problems in forestry and native vegetation. Some animals can impact multiple land uses. To compare the risk from pest animals on different land uses, you also need to compare the importance of the land uses themselves. This is generally too difficult to do (i.e. you need $/ha values for each land use). An easier approach is to compare pest animals within each land use. Natural Resources Management Boards can then decide the time and resources devoted to protecting each land use from pest animals. This is particularly so for those boards with a major proportion of their area devoted to one land use eg. the South Australian Arid Lands NRM Board is almost totally non arable grazing.
The following land uses with potential pest animal species are suggested: 1. Aquatic - Permanent water bodies. e.g. rivers, swamps, canals, lakes, estuaries – (e.g. mainly
reptiles and amphibians)
2. Crop/Pasture rotation - Dryland cereals, pulses, oilseeds, legume pastures, hay (e.g. grazing
animals or seed eaters such as rabbits, deer, goats, mice and pest birds)
3. Forestry - Pines, blue gums (grazing and browsing animals e.g. rabbits, goats, hares, deer,
and over-abundant macropods)
4. Irrigated crops and pastures - Vegetables, lucerne, (e.g. grazing animals and fruit eaters,
e.g. pest birds and mice)
5. Native vegetation - For nature conservation purposes. Public and private reserves. ( e.g.
competitors and predators)
6. Non-arable grazing - Includes permanent pastures and rangelands (e.g. competitive grazing
and browsing animals and predators such as foxes and dingoes)
7. Perennial horticulture - Vineyards, citrus, stone fruits (e.g. pest birds and rodents)
8. Urban - Parks, footpaths, airports, open space, urban wetlands, buildings (e.g. commensal
animals that cause direct damage, a threat to public safety or are a nuisance such as urban
foxes, pigeons and rodents)
Within each Board area, land uses will vary in terms of what is grown and how crops/pastures/vegetation are managed. However, to keep the scoring system relatively simple and to answer at a Regional level, it is necessary to think in averages. There are two main aspects to keep in mind: (i) Where a pest animal is only prevalent at certain phases or crop types in a land use.
For example, the typical crop/pasture rotation land use in a Board may have cereals, canola, pulses and pasture phases. In answering questions, average the invasiveness and impacts of a pest animal amongst these four vegetation types. Thus a pest animal, which is only a problem in cereals, will score less than a similar pest animal, which is a problem in all crops and pasture. In the potential distribution section these two pest animals will get the
same score, as they will occupy the same area.
(ii) Where a pest animal only occurs in certain parts of a land use. For example, the perennial horticulture land use in a Board may contain citrus, stone fruit, olives and vines. For a pest animal which only occurs in citrus and vines, average the invasiveness and impacts of a pest animal amongst these two vegetation types only. Then in the potential distribution section, the pest animal's score may be reduced because it is not a problem in
all perennial horticulture crops in the Board area. Decide which land uses apply to your Board. Then decide which pest animals cause problems in which land uses. There is no need (and it makes little sense) to assess every pest animal in every land use. The aim is simply to determine the important pest animals of each land use for your region.
Assumptions about a land use can be recorded on the scoresheets. The first question asks about the pest animal’s potential distribution (whether the pest animal is likely to persist in the land use). If potential distribution is >0, continue with the assessment. If 0, select another pest for assessment. References: Pest risk assessment systems: Bomford M. (2003) Risk assessment for import and keeping of exotic vertebrates in Australia. Bureau of Rural Sciences. http://www.affa.gov.au/corporate_docs/publications/pdf/rural_science/lms/ferals/risk_assess_book.pdf
Harrison D. and Congdon B. (2002) Wet Tropics Vertebrate Pest Risk Assessment Scheme. Cooperative Research Centre for Tropical Rainforest Ecology and Management. Cairns.
Walton, C. (2006) WaSA: A new process for prioritising species based on impacts and benefits. Department of Natural Resources and Mines, GPO Box 2454, Brisbane Queensland, 4001
Virtue J. (2005) South Australia Weed Risk Management, Animal and Plant Control Group, Biosecurity SA, Box 1671, Adelaide SA 5001

1) COMPARATIVE PEST ANIMAL RISK
The Comparative Pest Animal Risk questions are divided into three main sections: potential distribution, invasiveness and impacts. Potential distribution predicts the total area the pest animal could spread to. Invasiveness looks at the pest animal‟s biology including diet and reproductive and dispersal capacity (faster spreading pest animal‟s being a higher priority for control). Impacts are the economic, environmental and social impacts of the pest animal. Scores for each of these are multiplied (each ranging between 0 and 10), to give a pest animal risk score out of 1000.
POTENTIAL DISTRIBUTION
This section looks at what proportion of a land use is at risk from the pest animal in question. This will depend on the climate and habitat preferences of the pest animal. For example, some pest animals may only be suited to higher rainfall areas, or sandy well-drained soils. Differences within the land use also need to be considered. For example in the perennial horticulture land use, a pest animal may be a problem in citrus but not occur in vineyards (e.g. black rats in citrus). This score should also be based on aligning the distribution and abundance of the pest in the land use considered when scoring it for impact. That is, if you assumed a high density in scoring impacts then ignore areas where the pest animal would only persist at a low density when determining potential distribution. This question is best answered with reference to topographic, land use, vegetation and soil maps for the Board area. These can be analysed electronically using a GIS system such as ArcView, or done manually on paper. If using maps the following steps will help in estimating the percentage area of a land use that is suitable for the pest animal: 1. Map the land use in your Board. If you do not have a land use map, you could shade areas on
clear plastic overlays on topographic maps. 2. Consider the climatic and any other habitat preferences of each pest animal (N.B. for most
pest animals climate data will be all that can be used) and the vegetation/crop/pasture
types within the land use to which the pest animal is suited. Overlay climate data with the land use map, and shade the areas of the land use which are suitable for the pest animal.
3. Compare the pest animal‟s potential distribution to the land use map to estimate the
percentage of the land use, which is suitable for the pest animal. Answer as follows:
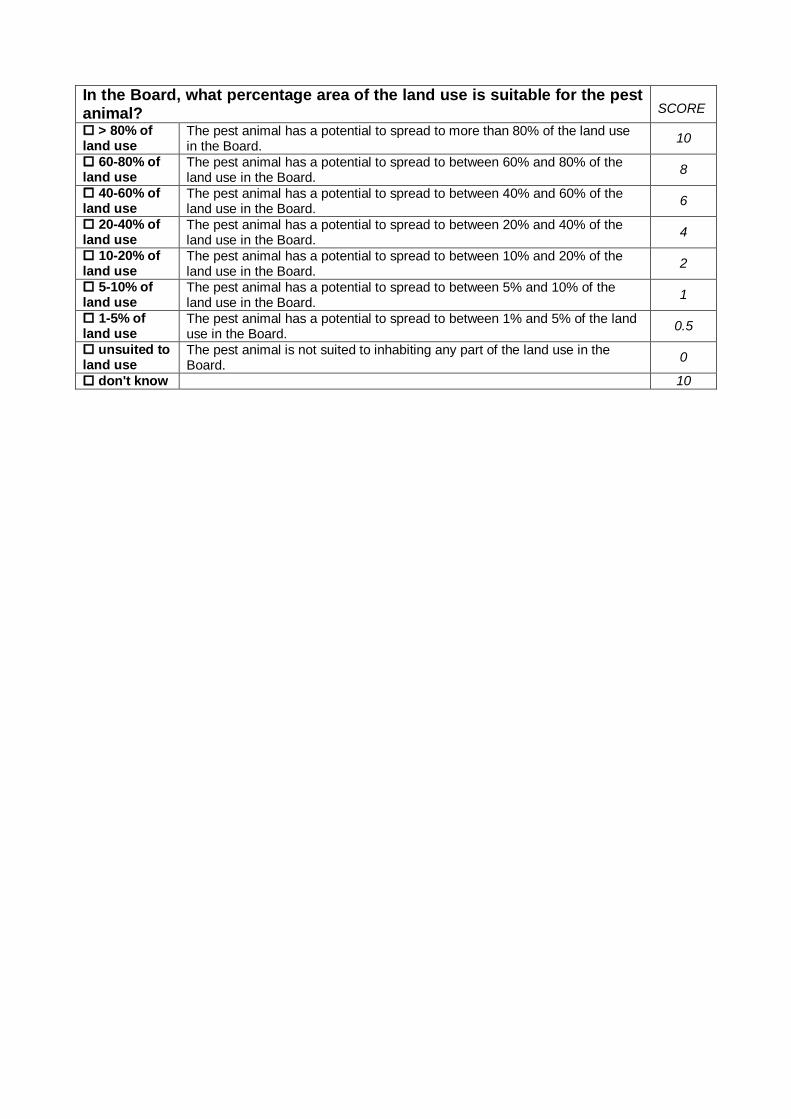
In the Board, what percentage area of the land use is suitable for the pest animal?
SCORE
> 80% of land use
The pest animal has a potential to spread to more than 80% of the land use in the Board.
10
60-80% of land use
The pest animal has a potential to spread to between 60% and 80% of the land use in the Board.
8
40-60% of land use
The pest animal has a potential to spread to between 40% and 60% of the land use in the Board.
6
20-40% of land use
The pest animal has a potential to spread to between 20% and 40% of the land use in the Board.
4
10-20% of land use
The pest animal has a potential to spread to between 10% and 20% of the land use in the Board.
2
5-10% of land use
The pest animal has a potential to spread to between 5% and 10% of the land use in the Board.
1
1-5% of land use
The pest animal has a potential to spread to between 1% and 5% of the land use in the Board.
0.5
unsuited to land use
The pest animal is not suited to inhabiting any part of the land use in the Board.
0
don't know 10
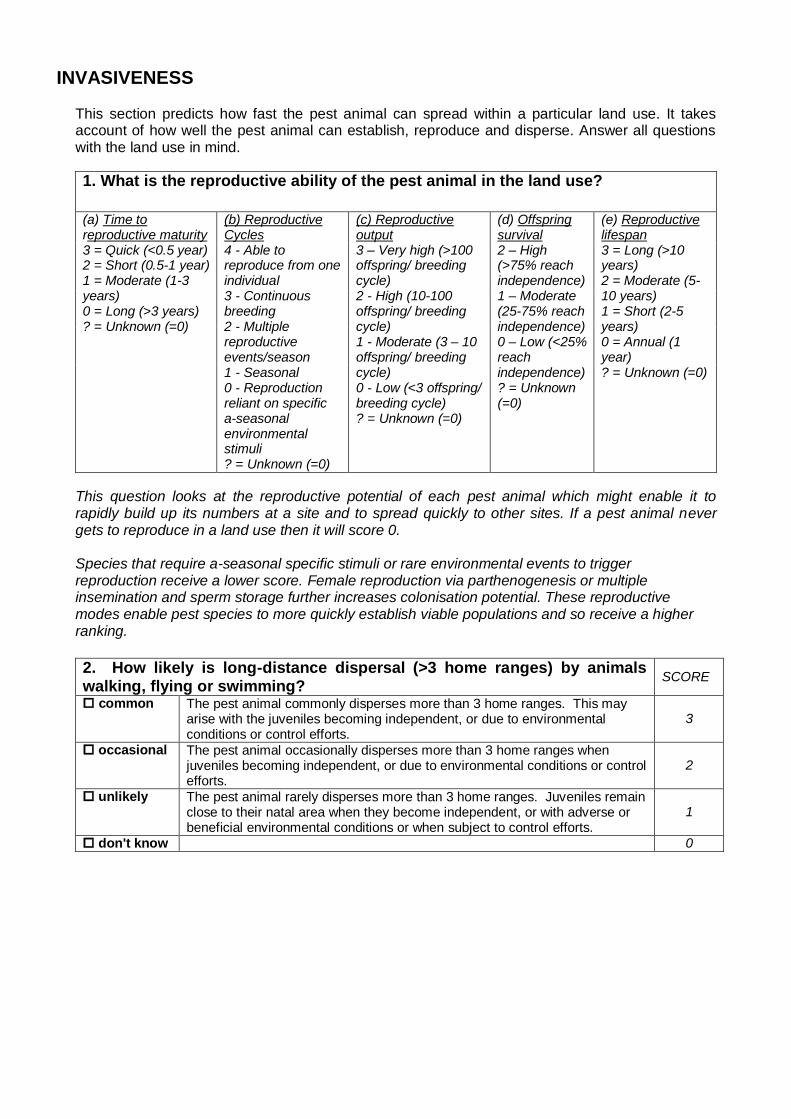
INVASIVENESS
This section predicts how fast the pest animal can spread within a particular land use. It takes account of how well the pest animal can establish, reproduce and disperse. Answer all questions with the land use in mind.
1. What is the reproductive ability of the pest animal in the land use?
(a) Time to reproductive maturity 3 = Quick (<0.5 year) 2 = Short (0.5-1 year) 1 = Moderate (1-3 years) 0 = Long (>3 years) ? = Unknown (=0)
(b) Reproductive Cycles 4 - Able to reproduce from one individual 3 - Continuous breeding 2 - Multiple reproductive events/season 1 - Seasonal 0 - Reproduction reliant on specific a-seasonal environmental stimuli ? = Unknown (=0)
(c) Reproductive output 3 – Very high (>100 offspring/ breeding cycle) 2 - High (10-100 offspring/ breeding cycle) 1 - Moderate (3 – 10 offspring/ breeding cycle) 0 - Low (<3 offspring/ breeding cycle) ? = Unknown (=0)
(d) Offspring survival 2 – High (>75% reach independence) 1 – Moderate (25-75% reach independence) 0 – Low (<25% reach independence) ? = Unknown (=0)
(e) Reproductive lifespan 3 = Long (>10 years) 2 = Moderate (5-10 years) 1 = Short (2-5 years) 0 = Annual (1 year) ? = Unknown (=0)
This question looks at the reproductive potential of each pest animal which might enable it to rapidly build up its numbers at a site and to spread quickly to other sites. If a pest animal never gets to reproduce in a land use then it will score 0. Species that require a-seasonal specific stimuli or rare environmental events to trigger reproduction receive a lower score. Female reproduction via parthenogenesis or multiple insemination and sperm storage further increases colonisation potential. These reproductive modes enable pest species to more quickly establish viable populations and so receive a higher ranking.
2. How likely is long-distance dispersal (>3 home ranges) by animals walking, flying or swimming?
SCORE
common The pest animal commonly disperses more than 3 home ranges. This may arise with the juveniles becoming independent, or due to environmental conditions or control efforts.
3
occasional The pest animal occasionally disperses more than 3 home ranges when juveniles becoming independent, or due to environmental conditions or control efforts.
2
unlikely The pest animal rarely disperses more than 3 home ranges. Juveniles remain close to their natal area when they become independent, or with adverse or beneficial environmental conditions or when subject to control efforts.
1
don't know 0
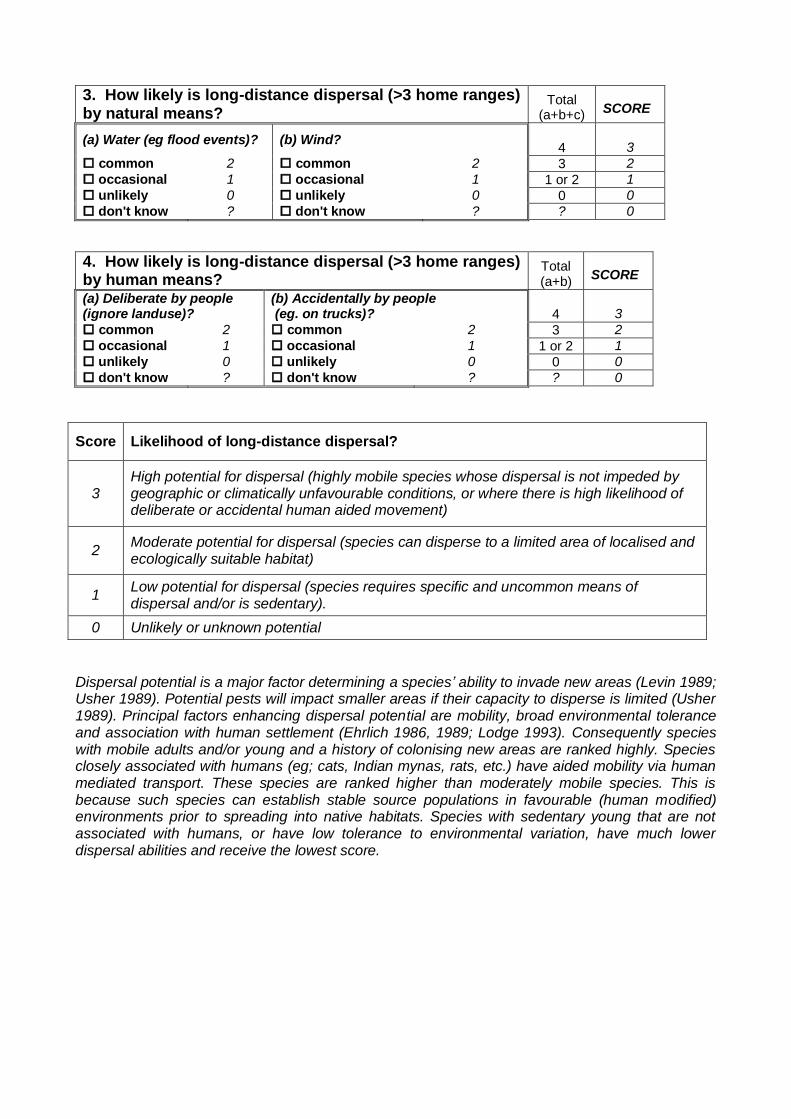
3. How likely is long-distance dispersal (>3 home ranges) by natural means?
Total (a+b+c)
SCORE
(a) Water (eg flood events)? (b) Wind? 4
3
common 2 common 2 3 2
occasional 1 occasional 1 1 or 2 1
unlikely 0 unlikely 0 0 0
don't know ? don't know ? ? 0
4. How likely is long-distance dispersal (>3 home ranges) by human means?
Total (a+b)
SCORE
(a) Deliberate by people (ignore landuse)?
(b) Accidentally by people (eg. on trucks)?
4
3
common 2 common 2 3 2
occasional 1 occasional 1 1 or 2 1
unlikely 0 unlikely 0 0 0
don't know ? don't know ? ? 0
Dispersal potential is a major factor determining a species’ ability to invade new areas (Levin 1989; Usher 1989). Potential pests will impact smaller areas if their capacity to disperse is limited (Usher 1989). Principal factors enhancing dispersal potential are mobility, broad environmental tolerance and association with human settlement (Ehrlich 1986, 1989; Lodge 1993). Consequently species with mobile adults and/or young and a history of colonising new areas are ranked highly. Species closely associated with humans (eg; cats, Indian mynas, rats, etc.) have aided mobility via human mediated transport. These species are ranked higher than moderately mobile species. This is because such species can establish stable source populations in favourable (human modified) environments prior to spreading into native habitats. Species with sedentary young that are not associated with humans, or have low tolerance to environmental variation, have much lower dispersal abilities and receive the lowest score.
Score Likelihood of long-distance dispersal?
3 High potential for dispersal (highly mobile species whose dispersal is not impeded by geographic or climatically unfavourable conditions, or where there is high likelihood of deliberate or accidental human aided movement)
2 Moderate potential for dispersal (species can disperse to a limited area of localised and ecologically suitable habitat)
1 Low potential for dispersal (species requires specific and uncommon means of dispersal and/or is sedentary).
0 Unlikely or unknown potential
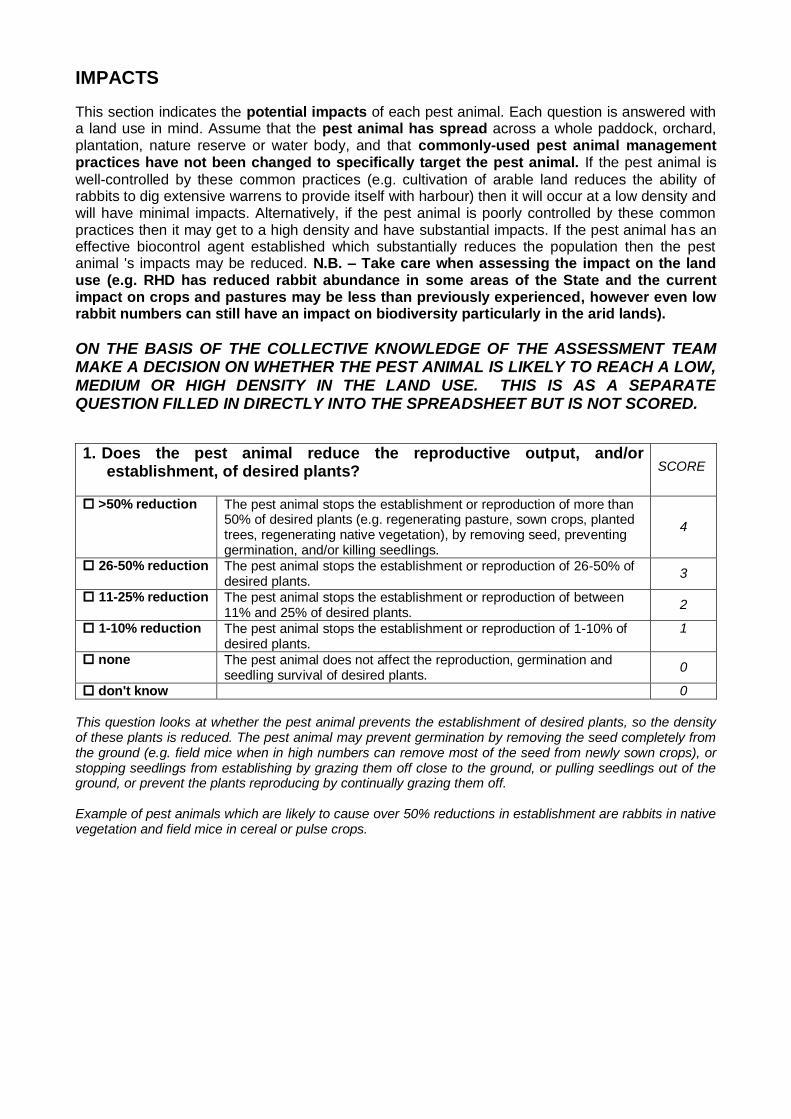
IMPACTS
This section indicates the potential impacts of each pest animal. Each question is answered with a land use in mind. Assume that the pest animal has spread across a whole paddock, orchard, plantation, nature reserve or water body, and that commonly-used pest animal management practices have not been changed to specifically target the pest animal. If the pest animal is
well-controlled by these common practices (e.g. cultivation of arable land reduces the ability of rabbits to dig extensive warrens to provide itself with harbour) then it will occur at a low density and will have minimal impacts. Alternatively, if the pest animal is poorly controlled by these common practices then it may get to a high density and have substantial impacts. If the pest animal has an effective biocontrol agent established which substantially reduces the population then the pest animal 's impacts may be reduced. N.B. – Take care when assessing the impact on the land use (e.g. RHD has reduced rabbit abundance in some areas of the State and the current impact on crops and pastures may be less than previously experienced, however even low rabbit numbers can still have an impact on biodiversity particularly in the arid lands).
ON THE BASIS OF THE COLLECTIVE KNOWLEDGE OF THE ASSESSMENT TEAM MAKE A DECISION ON WHETHER THE PEST ANIMAL IS LIKELY TO REACH A LOW, MEDIUM OR HIGH DENSITY IN THE LAND USE. THIS IS AS A SEPARATE QUESTION FILLED IN DIRECTLY INTO THE SPREADSHEET BUT IS NOT SCORED.
1. Does the pest animal reduce the reproductive output, and/or establishment, of desired plants?
SCORE
>50% reduction The pest animal stops the establishment or reproduction of more than 50% of desired plants (e.g. regenerating pasture, sown crops, planted trees, regenerating native vegetation), by removing seed, preventing germination, and/or killing seedlings.
4
26-50% reduction The pest animal stops the establishment or reproduction of 26-50% of desired plants.
3
11-25% reduction The pest animal stops the establishment or reproduction of between 11% and 25% of desired plants.
2
1-10% reduction The pest animal stops the establishment or reproduction of 1-10% of desired plants.
1
none The pest animal does not affect the reproduction, germination and seedling survival of desired plants.
0
don't know 0
This question looks at whether the pest animal prevents the establishment of desired plants, so the density of these plants is reduced. The pest animal may prevent germination by removing the seed completely from the ground (e.g. field mice when in high numbers can remove most of the seed from newly sown crops), or stopping seedlings from establishing by grazing them off close to the ground, or pulling seedlings out of the ground, or prevent the plants reproducing by continually grazing them off. Example of pest animals which are likely to cause over 50% reductions in establishment are rabbits in native vegetation and field mice in cereal or pulse crops.
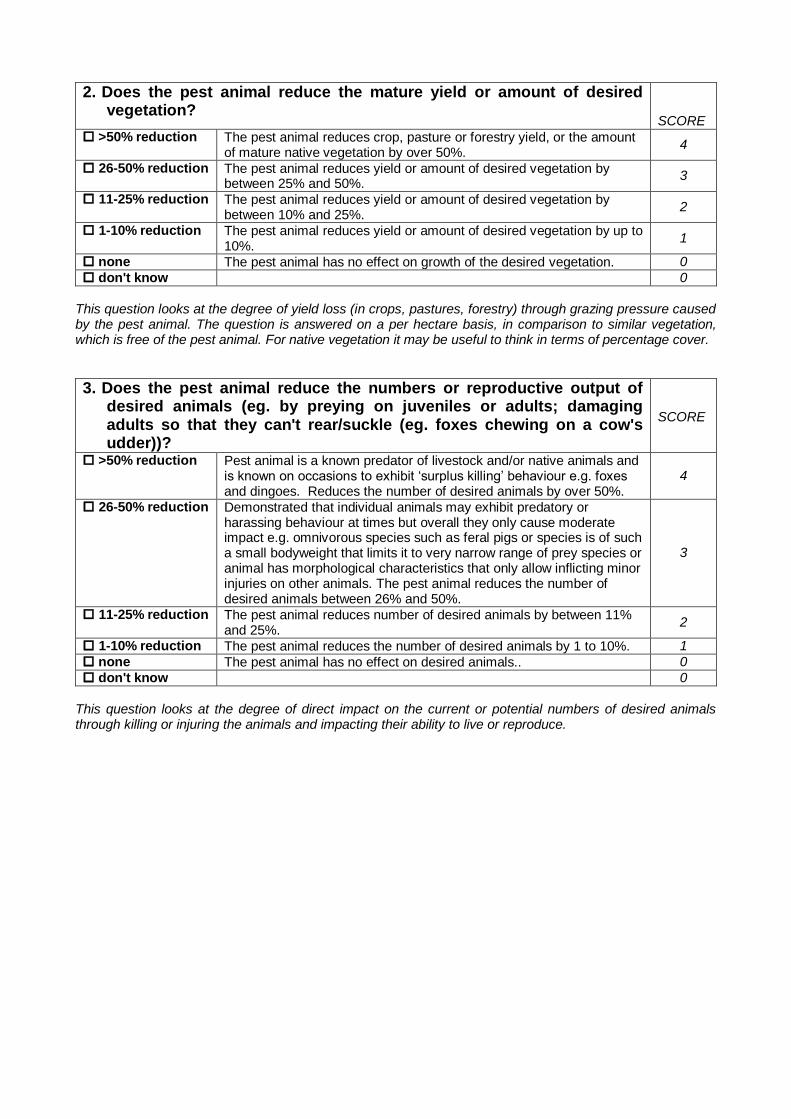
2. Does the pest animal reduce the mature yield or amount of desired vegetation?
SCORE
>50% reduction The pest animal reduces crop, pasture or forestry yield, or the amount of mature native vegetation by over 50%.
4
26-50% reduction The pest animal reduces yield or amount of desired vegetation by between 25% and 50%.
3
11-25% reduction The pest animal reduces yield or amount of desired vegetation by between 10% and 25%.
2
1-10% reduction The pest animal reduces yield or amount of desired vegetation by up to 10%.
1
none The pest animal has no effect on growth of the desired vegetation. 0
don't know 0
This question looks at the degree of yield loss (in crops, pastures, forestry) through grazing pressure caused by the pest animal. The question is answered on a per hectare basis, in comparison to similar vegetation, which is free of the pest animal. For native vegetation it may be useful to think in terms of percentage cover.
3. Does the pest animal reduce the numbers or reproductive output of desired animals (eg. by preying on juveniles or adults; damaging adults so that they can't rear/suckle (eg. foxes chewing on a cow's udder))?
SCORE
>50% reduction Pest animal is a known predator of livestock and/or native animals and is known on occasions to exhibit „surplus killing‟ behaviour e.g. foxes and dingoes. Reduces the number of desired animals by over 50%.
4
26-50% reduction Demonstrated that individual animals may exhibit predatory or harassing behaviour at times but overall they only cause moderate impact e.g. omnivorous species such as feral pigs or species is of such a small bodyweight that limits it to very narrow range of prey species or animal has morphological characteristics that only allow inflicting minor injuries on other animals. The pest animal reduces the number of desired animals between 26% and 50%.
3
11-25% reduction The pest animal reduces number of desired animals by between 11% and 25%.
2
1-10% reduction The pest animal reduces the number of desired animals by 1 to 10%. 1
none The pest animal has no effect on desired animals.. 0
don't know 0
This question looks at the degree of direct impact on the current or potential numbers of desired animals through killing or injuring the animals and impacting their ability to live or reproduce.
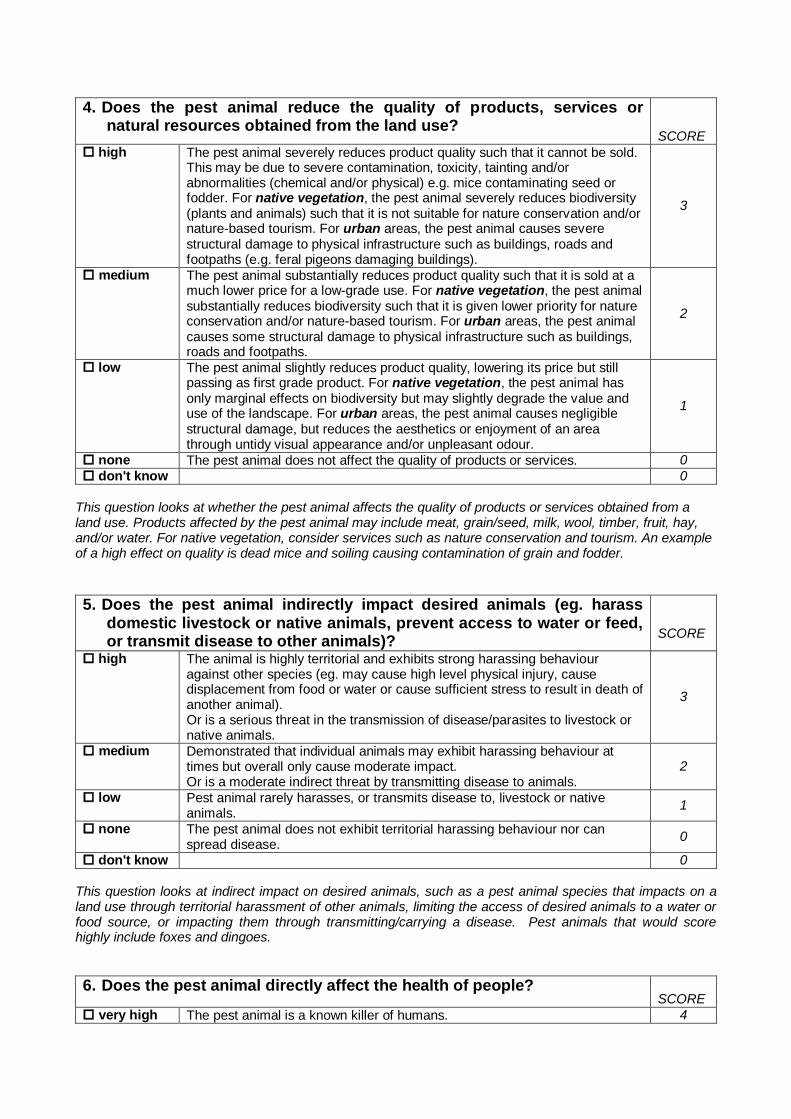
4. Does the pest animal reduce the quality of products, services or natural resources obtained from the land use?
SCORE
high The pest animal severely reduces product quality such that it cannot be sold. This may be due to severe contamination, toxicity, tainting and/or abnormalities (chemical and/or physical) e.g. mice contaminating seed or fodder. For native vegetation, the pest animal severely reduces biodiversity (plants and animals) such that it is not suitable for nature conservation and/or nature-based tourism. For urban areas, the pest animal causes severe structural damage to physical infrastructure such as buildings, roads and footpaths (e.g. feral pigeons damaging buildings).
3
medium The pest animal substantially reduces product quality such that it is sold at a much lower price for a low-grade use. For native vegetation, the pest animal substantially reduces biodiversity such that it is given lower priority for nature conservation and/or nature-based tourism. For urban areas, the pest animal causes some structural damage to physical infrastructure such as buildings, roads and footpaths.
2
low The pest animal slightly reduces product quality, lowering its price but still passing as first grade product. For native vegetation, the pest animal has only marginal effects on biodiversity but may slightly degrade the value and use of the landscape. For urban areas, the pest animal causes negligible structural damage, but reduces the aesthetics or enjoyment of an area through untidy visual appearance and/or unpleasant odour.
1
none The pest animal does not affect the quality of products or services. 0
don't know 0
This question looks at whether the pest animal affects the quality of products or services obtained from a land use. Products affected by the pest animal may include meat, grain/seed, milk, wool, timber, fruit, hay, and/or water. For native vegetation, consider services such as nature conservation and tourism. An example of a high effect on quality is dead mice and soiling causing contamination of grain and fodder.
5. Does the pest animal indirectly impact desired animals (eg. harass domestic livestock or native animals, prevent access to water or feed, or transmit disease to other animals)?
SCORE
high The animal is highly territorial and exhibits strong harassing behaviour against other species (eg. may cause high level physical injury, cause displacement from food or water or cause sufficient stress to result in death of another animal). Or is a serious threat in the transmission of disease/parasites to livestock or native animals.
3
medium Demonstrated that individual animals may exhibit harassing behaviour at times but overall only cause moderate impact. Or is a moderate indirect threat by transmitting disease to animals.
2
low Pest animal rarely harasses, or transmits disease to, livestock or native animals.
1
none The pest animal does not exhibit territorial harassing behaviour nor can spread disease.
0
don't know 0
This question looks at indirect impact on desired animals, such as a pest animal species that impacts on a land use through territorial harassment of other animals, limiting the access of desired animals to a water or food source, or impacting them through transmitting/carrying a disease. Pest animals that would score highly include foxes and dingoes.
6. Does the pest animal directly affect the health of people? SCORE
very high The pest animal is a known killer of humans. 4
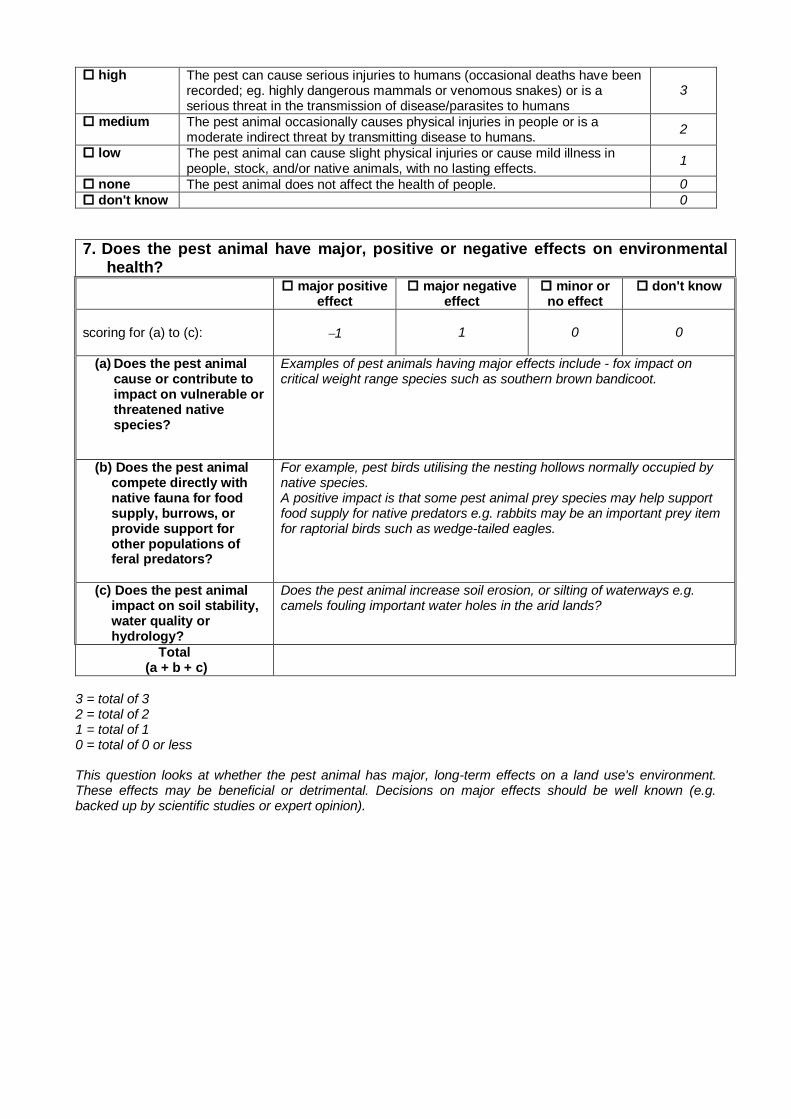
high The pest can cause serious injuries to humans (occasional deaths have been
recorded; eg. highly dangerous mammals or venomous snakes) or is a serious threat in the transmission of disease/parasites to humans
3
medium The pest animal occasionally causes physical injuries in people or is a moderate indirect threat by transmitting disease to humans.
2
low The pest animal can cause slight physical injuries or cause mild illness in people, stock, and/or native animals, with no lasting effects.
1
none The pest animal does not affect the health of people. 0
don't know 0
7. Does the pest animal have major, positive or negative effects on environmental health?
major positive effect
major negative effect
minor or no effect
don't know
scoring for (a) to (c):
1 1 0 0
(a) Does the pest animal cause or contribute to impact on vulnerable or threatened native species?
Examples of pest animals having major effects include - fox impact on critical weight range species such as southern brown bandicoot.
(b) Does the pest animal compete directly with native fauna for food supply, burrows, or provide support for other populations of feral predators?
For example, pest birds utilising the nesting hollows normally occupied by native species. A positive impact is that some pest animal prey species may help support food supply for native predators e.g. rabbits may be an important prey item for raptorial birds such as wedge-tailed eagles.
(c) Does the pest animal impact on soil stability, water quality or hydrology?
Does the pest animal increase soil erosion, or silting of waterways e.g. camels fouling important water holes in the arid lands?
Total (a + b + c)
3 = total of 3 2 = total of 2 1 = total of 1 0 = total of 0 or less This question looks at whether the pest animal has major, long-term effects on a land use's environment. These effects may be beneficial or detrimental. Decisions on major effects should be well known (e.g. backed up by scientific studies or expert opinion).
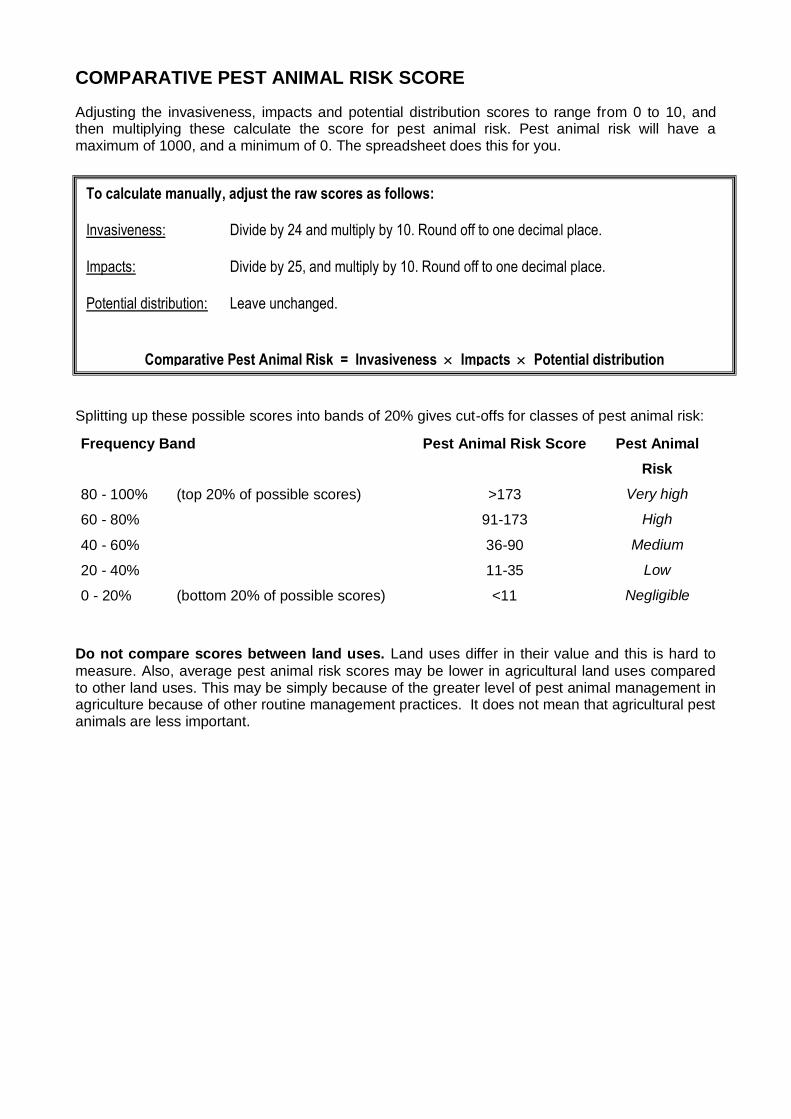
COMPARATIVE PEST ANIMAL RISK SCORE
Adjusting the invasiveness, impacts and potential distribution scores to range from 0 to 10, and then multiplying these calculate the score for pest animal risk. Pest animal risk will have a maximum of 1000, and a minimum of 0. The spreadsheet does this for you.
Splitting up these possible scores into bands of 20% gives cut-offs for classes of pest animal risk:
Do not compare scores between land uses. Land uses differ in their value and this is hard to
measure. Also, average pest animal risk scores may be lower in agricultural land uses compared to other land uses. This may be simply because of the greater level of pest animal management in agriculture because of other routine management practices. It does not mean that agricultural pest animals are less important.
Frequency Band Pest Animal Risk Score Pest Animal
Risk
80 - 100% (top 20% of possible scores) >173 Very high
60 - 80% 91-173 High
40 - 60% 36-90 Medium
20 - 40% 11-35 Low
0 - 20% (bottom 20% of possible scores) <11 Negligible
To calculate manually, adjust the raw scores as follows: Invasiveness: Divide by 24 and multiply by 10. Round off to one decimal place. Impacts: Divide by 25, and multiply by 10. Round off to one decimal place. Potential distribution: Leave unchanged.
Comparative Pest Animal Risk = Invasiveness Impacts Potential distribution
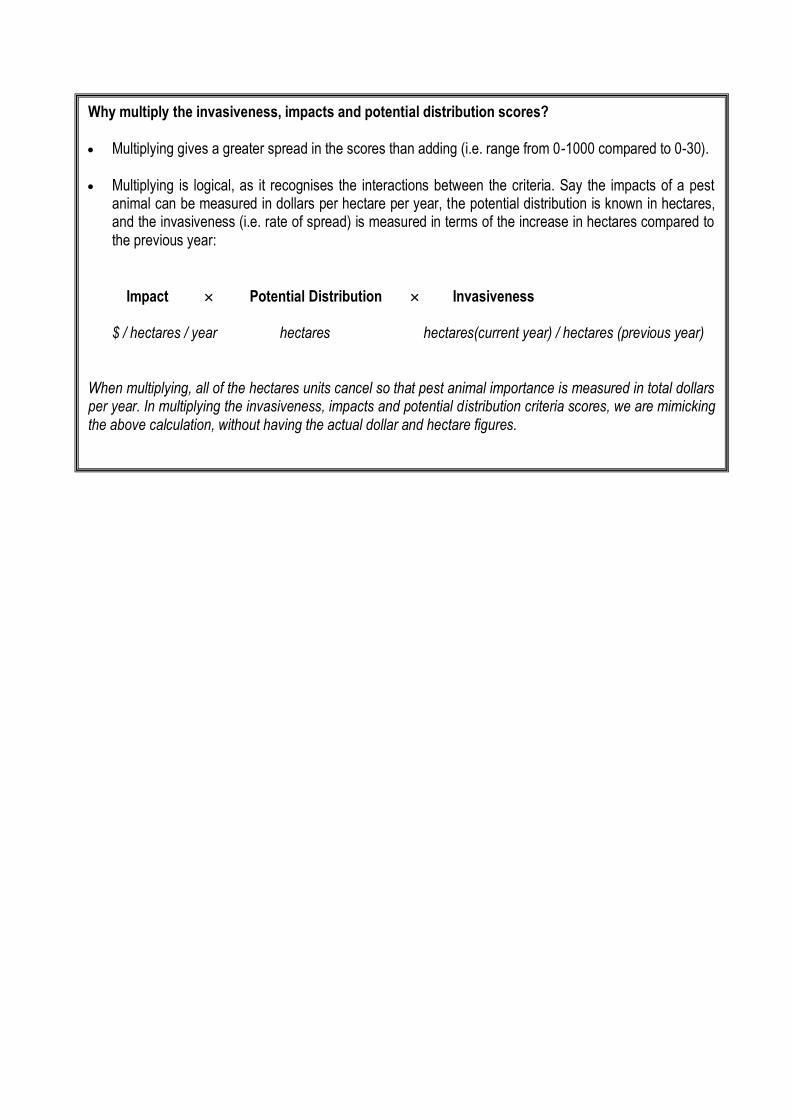
Why multiply the invasiveness, impacts and potential distribution scores? Multiplying gives a greater spread in the scores than adding (i.e. range from 0-1000 compared to 0-30). Multiplying is logical, as it recognises the interactions between the criteria. Say the impacts of a pest
animal can be measured in dollars per hectare per year, the potential distribution is known in hectares, and the invasiveness (i.e. rate of spread) is measured in terms of the increase in hectares compared to the previous year:
Impact Potential Distribution Invasiveness
$ / hectares / year hectares hectares(current year) / hectares (previous year) When multiplying, all of the hectares units cancel so that pest animal importance is measured in total dollars per year. In multiplying the invasiveness, impacts and potential distribution criteria scores, we are mimicking the above calculation, without having the actual dollar and hectare figures.
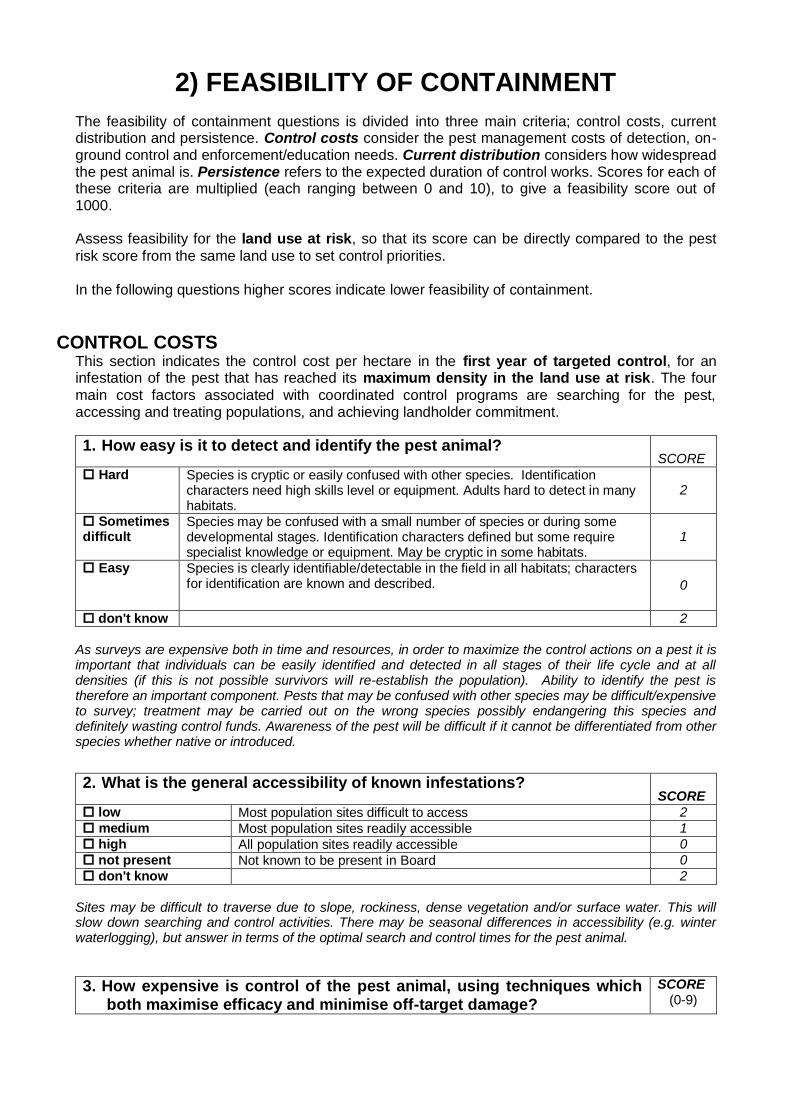
2) FEASIBILITY OF CONTAINMENT
The feasibility of containment questions is divided into three main criteria; control costs, current distribution and persistence. Control costs consider the pest management costs of detection, on-ground control and enforcement/education needs. Current distribution considers how widespread the pest animal is. Persistence refers to the expected duration of control works. Scores for each of these criteria are multiplied (each ranging between 0 and 10), to give a feasibility score out of 1000. Assess feasibility for the land use at risk, so that its score can be directly compared to the pest
risk score from the same land use to set control priorities. In the following questions higher scores indicate lower feasibility of containment.
CONTROL COSTS This section indicates the control cost per hectare in the first year of targeted control, for an infestation of the pest that has reached its maximum density in the land use at risk. The four
main cost factors associated with coordinated control programs are searching for the pest, accessing and treating populations, and achieving landholder commitment.
1. How easy is it to detect and identify the pest animal? SCORE
Hard Species is cryptic or easily confused with other species. Identification characters need high skills level or equipment. Adults hard to detect in many habitats.
2
Sometimes difficult
Species may be confused with a small number of species or during some developmental stages. Identification characters defined but some require specialist knowledge or equipment. May be cryptic in some habitats.
1
Easy
Species is clearly identifiable/detectable in the field in all habitats; characters for identification are known and described.
0
don't know 2
As surveys are expensive both in time and resources, in order to maximize the control actions on a pest it is important that individuals can be easily identified and detected in all stages of their life cycle and at all densities (if this is not possible survivors will re-establish the population). Ability to identify the pest is therefore an important component. Pests that may be confused with other species may be difficult/expensive to survey; treatment may be carried out on the wrong species possibly endangering this species and definitely wasting control funds. Awareness of the pest will be difficult if it cannot be differentiated from other species whether native or introduced.
2. What is the general accessibility of known infestations? SCORE
low Most population sites difficult to access 2
medium Most population sites readily accessible 1
high All population sites readily accessible 0
not present Not known to be present in Board 0
don't know 2
Sites may be difficult to traverse due to slope, rockiness, dense vegetation and/or surface water. This will slow down searching and control activities. There may be seasonal differences in accessibility (e.g. winter waterlogging), but answer in terms of the optimal search and control times for the pest animal.
3. How expensive is control of the pest animal, using techniques which both maximise efficacy and minimise off-target damage?
SCORE (0-9)

(a) Vertebrate pesticides, fuel and equipment, and any animal disposal operating costs
(b) Labour costs Total (a+b)
very high 4 extreme (manual capture only) 5 high 3 very high 4 medium 2 high 3 low 1 medium 2 not applicable 0 low 1 don't know 4 not applicable 0 don't know 4
Select a cost category (A, B or C) for the land use being considered. This allows for more realistic control cost estimates.
Cost Categories
A B C SCORE
Extreme >$1500/ha >$1000/ha >$250/ha 5
Very high $1000-1500/ha $500-1000/ha $100-250/ha 4
High $500-1000/ha $250-500/ha $50-100/ha 3
Medium $250-500/ha $100-250/ha $25-50/ha 2
Low <$250/ha <$100/ha <$25/ha 1
Do not consider capital costs for purchasing application equipment in this question.
4. What is the likely level of cooperation from landholders within the land use at risk?
SCORE
low Pest control is rarely undertaken in the land use. Cost of control is beyond the financial and technical capacity of landholders.
2
medium Control of the pest will require a significant change in existing pest management practices, but this will be within the financial and technical capacity of landholders.
1
high Control of the pest will require minimal change in existing pest animal management practices.
0
don't know 2
Aside from the ‘on-ground’ costs of searching and control, a coordinated control program will have overarching costs of extension/education, enforcement, project management and administration. The ease of motivating and coordinating landholders in an ongoing program will vary between land uses, particularly in relation to their financial capacity to support a control program.
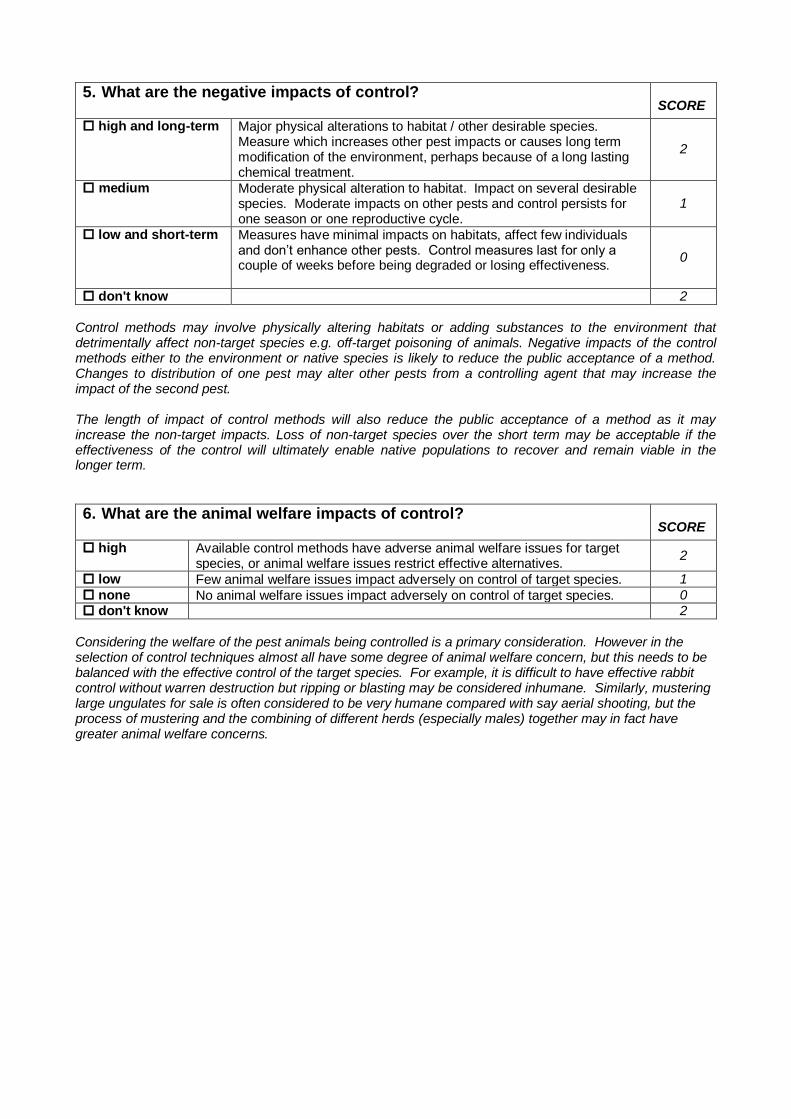
5. What are the negative impacts of control? SCORE
high and long-term Major physical alterations to habitat / other desirable species. Measure which increases other pest impacts or causes long term modification of the environment, perhaps because of a long lasting chemical treatment.
2
medium Moderate physical alteration to habitat. Impact on several desirable species. Moderate impacts on other pests and control persists for one season or one reproductive cycle.
1
low and short-term
Measures have minimal impacts on habitats, affect few individuals and don‟t enhance other pests. Control measures last for only a couple of weeks before being degraded or losing effectiveness.
0
don't know 2
Control methods may involve physically altering habitats or adding substances to the environment that detrimentally affect non-target species e.g. off-target poisoning of animals. Negative impacts of the control methods either to the environment or native species is likely to reduce the public acceptance of a method. Changes to distribution of one pest may alter other pests from a controlling agent that may increase the impact of the second pest. The length of impact of control methods will also reduce the public acceptance of a method as it may increase the non-target impacts. Loss of non-target species over the short term may be acceptable if the effectiveness of the control will ultimately enable native populations to recover and remain viable in the longer term.
6. What are the animal welfare impacts of control? SCORE
high Available control methods have adverse animal welfare issues for target species, or animal welfare issues restrict effective alternatives.
2
low Few animal welfare issues impact adversely on control of target species. 1
none No animal welfare issues impact adversely on control of target species. 0 don't know 2
Considering the welfare of the pest animals being controlled is a primary consideration. However in the selection of control techniques almost all have some degree of animal welfare concern, but this needs to be balanced with the effective control of the target species. For example, it is difficult to have effective rabbit control without warren destruction but ripping or blasting may be considered inhumane. Similarly, mustering large ungulates for sale is often considered to be very humane compared with say aerial shooting, but the process of mustering and the combining of different herds (especially males) together may in fact have greater animal welfare concerns.
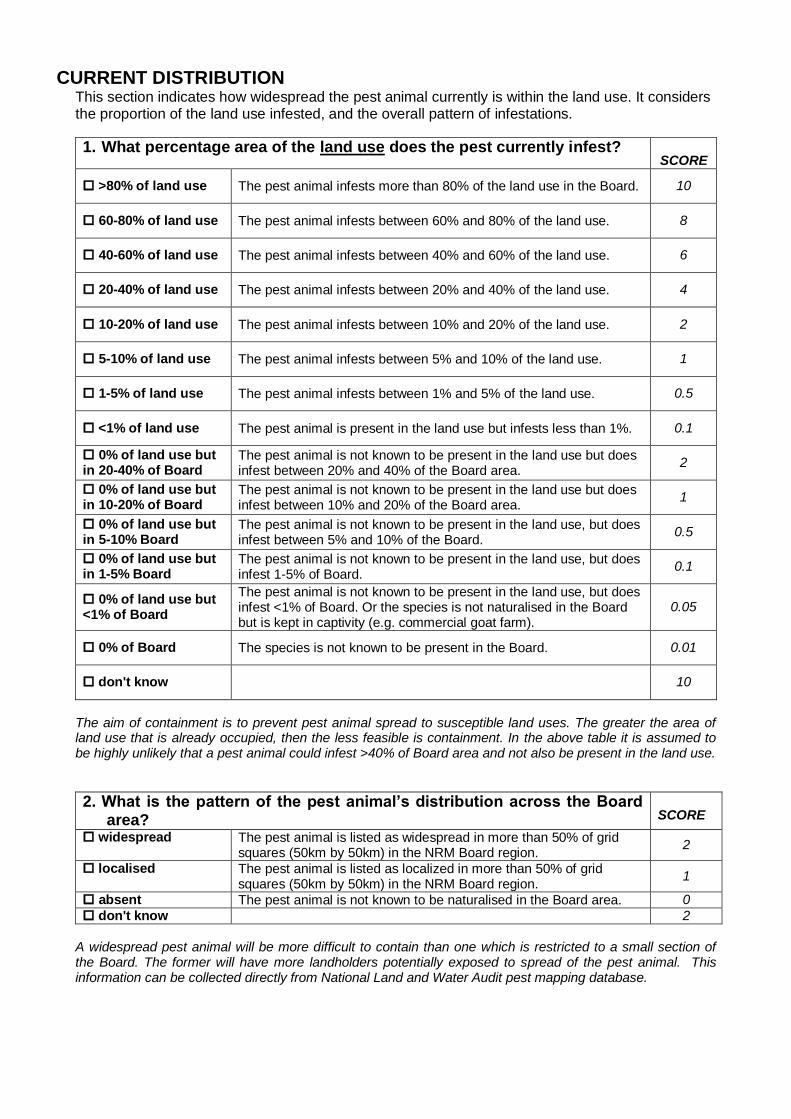
CURRENT DISTRIBUTION
This section indicates how widespread the pest animal currently is within the land use. It considers the proportion of the land use infested, and the overall pattern of infestations.
1. What percentage area of the land use does the pest currently infest? SCORE
>80% of land use The pest animal infests more than 80% of the land use in the Board. 10
60-80% of land use The pest animal infests between 60% and 80% of the land use. 8
40-60% of land use The pest animal infests between 40% and 60% of the land use. 6
20-40% of land use The pest animal infests between 20% and 40% of the land use. 4
10-20% of land use The pest animal infests between 10% and 20% of the land use. 2
5-10% of land use The pest animal infests between 5% and 10% of the land use. 1
1-5% of land use The pest animal infests between 1% and 5% of the land use. 0.5
<1% of land use The pest animal is present in the land use but infests less than 1%. 0.1
0% of land use but in 20-40% of Board
The pest animal is not known to be present in the land use but does infest between 20% and 40% of the Board area.
2
0% of land use but in 10-20% of Board
The pest animal is not known to be present in the land use but does infest between 10% and 20% of the Board area.
1
0% of land use but in 5-10% Board
The pest animal is not known to be present in the land use, but does infest between 5% and 10% of the Board.
0.5
0% of land use but in 1-5% Board
The pest animal is not known to be present in the land use, but does infest 1-5% of Board.
0.1
0% of land use but <1% of Board
The pest animal is not known to be present in the land use, but does infest <1% of Board. Or the species is not naturalised in the Board but is kept in captivity (e.g. commercial goat farm).
0.05
0% of Board The species is not known to be present in the Board. 0.01
don't know 10
The aim of containment is to prevent pest animal spread to susceptible land uses. The greater the area of land use that is already occupied, then the less feasible is containment. In the above table it is assumed to be highly unlikely that a pest animal could infest >40% of Board area and not also be present in the land use.
2. What is the pattern of the pest animal’s distribution across the Board area?
SCORE
widespread The pest animal is listed as widespread in more than 50% of grid squares (50km by 50km) in the NRM Board region.
2
localised The pest animal is listed as localized in more than 50% of grid squares (50km by 50km) in the NRM Board region.
1
absent The pest animal is not known to be naturalised in the Board area. 0
don't know 2
A widespread pest animal will be more difficult to contain than one which is restricted to a small section of the Board. The former will have more landholders potentially exposed to spread of the pest animal. This information can be collected directly from National Land and Water Audit pest mapping database.
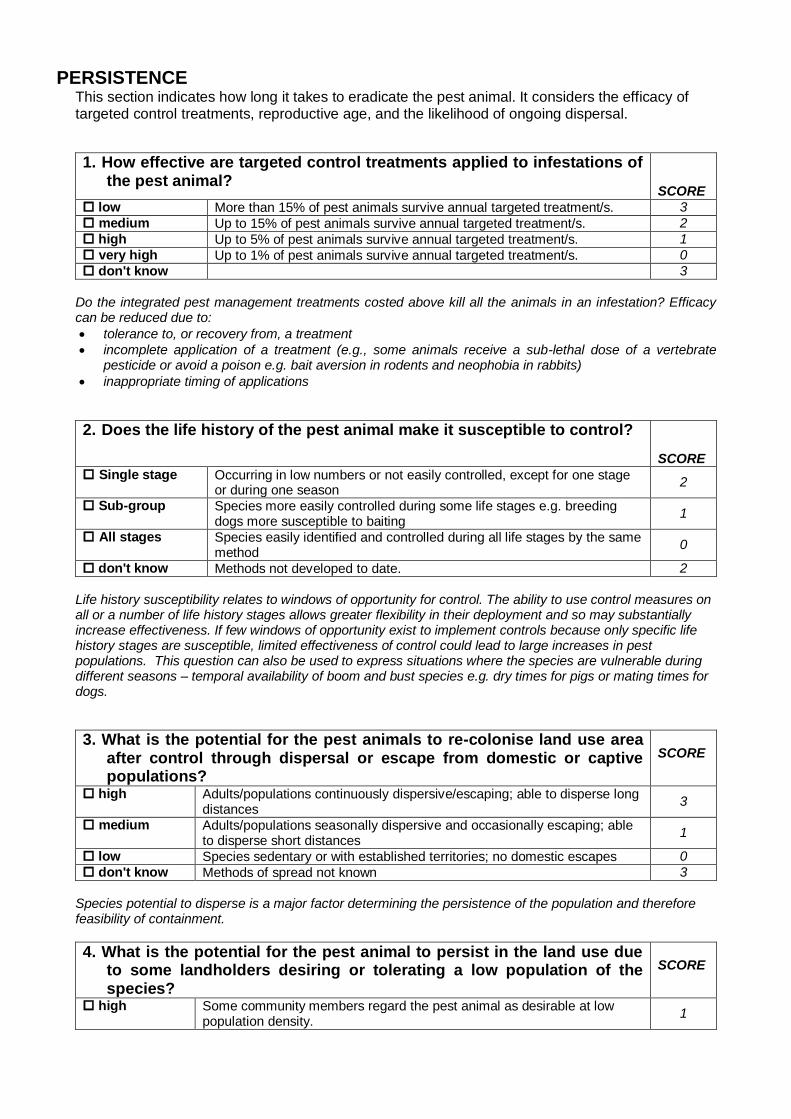
PERSISTENCE
This section indicates how long it takes to eradicate the pest animal. It considers the efficacy of targeted control treatments, reproductive age, and the likelihood of ongoing dispersal.
1. How effective are targeted control treatments applied to infestations of the pest animal?
SCORE
low More than 15% of pest animals survive annual targeted treatment/s. 3
medium Up to 15% of pest animals survive annual targeted treatment/s. 2
high Up to 5% of pest animals survive annual targeted treatment/s. 1
very high Up to 1% of pest animals survive annual targeted treatment/s. 0
don't know 3
Do the integrated pest management treatments costed above kill all the animals in an infestation? Efficacy can be reduced due to:
tolerance to, or recovery from, a treatment
incomplete application of a treatment (e.g., some animals receive a sub-lethal dose of a vertebrate pesticide or avoid a poison e.g. bait aversion in rodents and neophobia in rabbits)
inappropriate timing of applications
2. Does the life history of the pest animal make it susceptible to control? SCORE
Single stage Occurring in low numbers or not easily controlled, except for one stage or during one season
2
Sub-group Species more easily controlled during some life stages e.g. breeding dogs more susceptible to baiting
1
All stages Species easily identified and controlled during all life stages by the same method
0
don't know Methods not developed to date. 2
Life history susceptibility relates to windows of opportunity for control. The ability to use control measures on all or a number of life history stages allows greater flexibility in their deployment and so may substantially increase effectiveness. If few windows of opportunity exist to implement controls because only specific life history stages are susceptible, limited effectiveness of control could lead to large increases in pest populations. This question can also be used to express situations where the species are vulnerable during different seasons – temporal availability of boom and bust species e.g. dry times for pigs or mating times for dogs.
3. What is the potential for the pest animals to re-colonise land use area after control through dispersal or escape from domestic or captive populations?
SCORE
high Adults/populations continuously dispersive/escaping; able to disperse long distances
3
medium Adults/populations seasonally dispersive and occasionally escaping; able to disperse short distances
1
low Species sedentary or with established territories; no domestic escapes 0
don't know Methods of spread not known 3
Species potential to disperse is a major factor determining the persistence of the population and therefore feasibility of containment.
4. What is the potential for the pest animal to persist in the land use due to some landholders desiring or tolerating a low population of the species?
SCORE
high Some community members regard the pest animal as desirable at low population density.
1
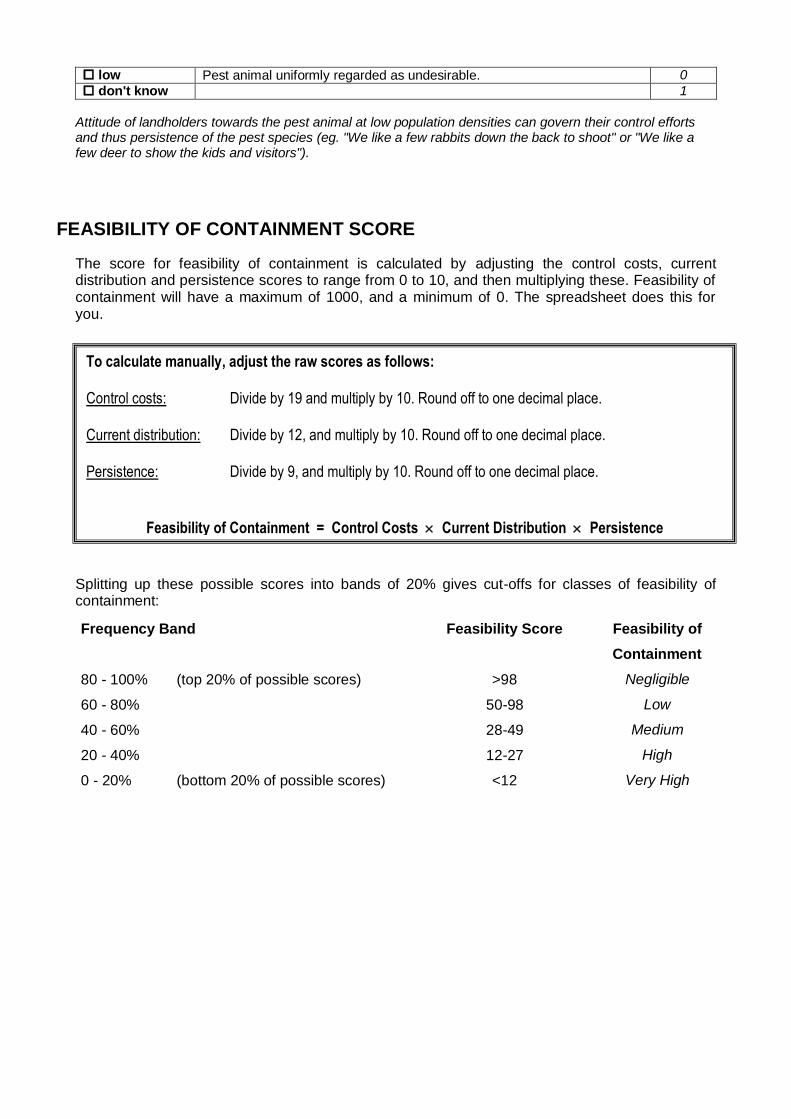
low Pest animal uniformly regarded as undesirable. 0
don't know 1
Attitude of landholders towards the pest animal at low population densities can govern their control efforts and thus persistence of the pest species (eg. "We like a few rabbits down the back to shoot" or "We like a few deer to show the kids and visitors").
FEASIBILITY OF CONTAINMENT SCORE
The score for feasibility of containment is calculated by adjusting the control costs, current distribution and persistence scores to range from 0 to 10, and then multiplying these. Feasibility of containment will have a maximum of 1000, and a minimum of 0. The spreadsheet does this for you.
Splitting up these possible scores into bands of 20% gives cut-offs for classes of feasibility of containment:
Frequency Band Feasibility Score Feasibility of
Containment
80 - 100% (top 20% of possible scores) >98 Negligible
60 - 80% 50-98 Low
40 - 60% 28-49 Medium
20 - 40% 12-27 High
0 - 20% (bottom 20% of possible scores) <12 Very High
To calculate manually, adjust the raw scores as follows: Control costs: Divide by 19 and multiply by 10. Round off to one decimal place. Current distribution: Divide by 12, and multiply by 10. Round off to one decimal place. Persistence: Divide by 9, and multiply by 10. Round off to one decimal place.
Feasibility of Containment = Control Costs Current Distribution Persistence
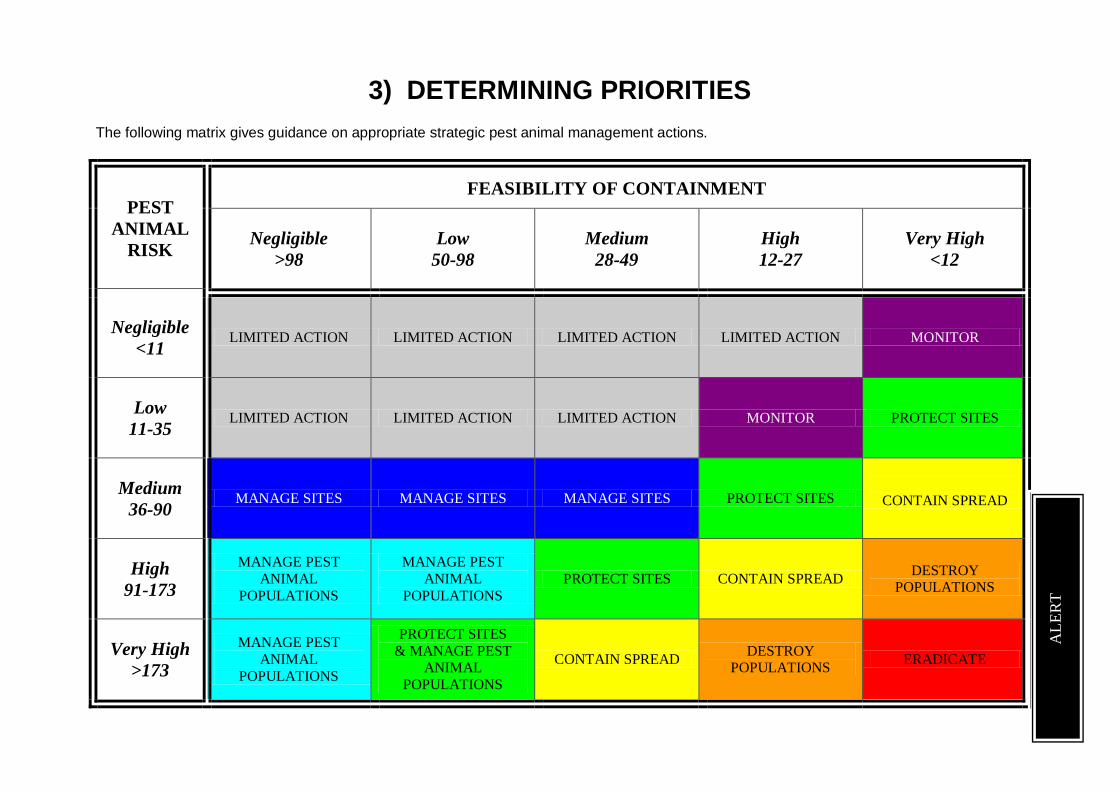
3) DETERMINING PRIORITIES The following matrix gives guidance on appropriate strategic pest animal management actions.
PEST
ANIMAL
RISK
FEASIBILITY OF CONTAINMENT
Negligible
>98
Low
50-98
Medium
28-49
High
12-27
Very High
<12
Negligible
<11 LIMITED ACTION LIMITED ACTION LIMITED ACTION LIMITED ACTION MONITOR
Low
11-35 LIMITED ACTION LIMITED ACTION LIMITED ACTION MONITOR PROTECT SITES
Medium
36-90 MANAGE SITES MANAGE SITES MANAGE SITES PROTECT SITES
CONTAIN SPREAD
High
91-173
MANAGE PEST
ANIMAL
POPULATIONS
MANAGE PEST
ANIMAL
POPULATIONS
PROTECT SITES CONTAIN SPREAD DESTROY
POPULATIONS
Very High
>173
MANAGE PEST
ANIMAL
POPULATIONS
PROTECT SITES
& MANAGE PEST ANIMAL
POPULATIONS
CONTAIN SPREAD DESTROY
POPULATIONS ERADICATE
AL
ER
T

Different pest animal species will appear in different positions on the matrix, based on their risk and feasibility of containment scoring. Each land use will have a separate matrix. Following are guiding principles for each of the management categories in the matrix. At a landscape scale these principles need to be interpreted in terms of different outcomes per land use for different pest animals. For example, a pest animal may rank as “destroy populations” in one land use and “limited action” in others. In this case coordinated control may still be required in the latter land uses to enable protection of the former land use. The term „management area‟ can be used below to apply to a range of spatial scales (e.g. NRM Board, sub-regional, land use).
ALERT Species that are not known to be present in the management area and which represent a significant threat. Such species would score „0‟ in Feasibility of Containment due to their absence. Aims to prevent the species arriving and establishing in the management area
Prevention of entry to management area
Ongoing surveillance for incursions of the species (e.g. nursery inspections for cane toads)
Training and awareness activities for the community to enable early detection
ERADICATE Aims to remove the pest animal species from the management area
Detailed surveillance and mapping to locate all populations
Destruction of all populations including juveniles
Prevention of entry to management area and keeping, movement and sale within
Monitor progress towards eradication
DESTROY POPULATIONS Aims to significantly reduce the extent of the pest animal species in the management area
Detailed surveillance and mapping to locate all populations
Destruction of all populations, aiming for local eradication at feasible sites
Prevention of entry to management area and keeping, movement and sale within
Consider quarantine provisions
Monitor progress towards reduction
CONTAIN SPREAD Aims to prevent the ongoing spread of the pest animal species in the management area
Surveillance and mapping to locate all infested properties
Enforce control of all populations, aiming for a significant reduction in pest animal density through high level initial control and sustained management
Entry, movement and keeping in management area may be controlled under permit conditions
Monitor change in current distribution
PROTECT SITES Aims to prevent spread of the pest animal species to key sites/assets of high economic, environmental and/or social value
Pest animal may be of limited current distribution but only threatens limited industries/habitats (lower pest animal risk). Or the pest animal may be more widespread but is yet to invade/impact upon many key industries/habitats (higher pest animal risk).
Surveillance and mapping to locate all infested areas
Identification of key sites/assets in the management area
Enforce control of populations in close proximity to key sites/assets, aiming for a significant reduction in pest animal density
Entry, movement and keeping in management area may be controlled under permit conditions
Monitor change in current distribution within and in close proximity to key sites/assets
MANAGE PEST ANIMAL POPULATION Aims to reduce the overall economic, environmental and/or social impacts of the pest animal species through targeted management
Research and develop integrated pest animal management (IPM) packages for the species, including cultural, chemical and biological control where feasible
Promote IPM packages to landholders
Monitor decrease in pest animal impacts with improved management
Identify key sites/assets in the management area and ensure adequate resourcing to manage the pest animal species
MANAGE SITES Aims to maintain the overall economic, environmental and/or social value of key sites/assets through improved general pest animal management
Promote general IPM principles to landholders, including the range of control techniques and farm management practices.
Identify key sites/assets in the management area and ensure adequate resourcing to manage these to maintain their values
Broaden focus beyond pest animal s to all threatening processes
MONITOR Aims to detect any significant changes in the species’ pest animal risk
Monitor the spread of the species and review any perceived changes in pest animal invasiveness.
LIMITED ACTION The pest animal species would only be targeted for coordinated control in the management area if its local presence makes it likely to spread to land uses where it ranks as a higher priority.
Undertake control measures if required for the benefit of other land uses at risk
Otherwise limited advice to land managers if required.
General References:
Ehr lich , P. R. (1989). At t r ibut es o f invaders and t he invad ing p rocesses: ver t eb r at es In : Drake
J.A.,
Mooney, H. A., d i Cast r i, F., Groves, R.H., Kruger , F. J., Rejm anek, M., & William son , M. (eds.)
Bio log ical Invasions: a g lobal perspect ive. SCOPE 37. John Wiley & Sons, New York.
Eh r lich , P.R. (1986). Which an im al w ill invade. In : Mooney H.A., & Drake, J.A. (ed s.) Eco logy o f
b io log ical invasions of No r t h Am er ica and Haw aii. Sp r inger -Ver lag, New York pp 79-95
Levin , S. A. (1989). Analysis o f r isk f o r invasions and con t ro l p rogram s In : Drake J.A., Mooney,
H. A.,d i Cast r i, F., Groves, R.H., Kruger , F. J., Rejm anek, M., & William son , M. (eds.) Bio log ical
Invasions: a g lobal perspect ive. SCOPE 37 John Wiley & Sons, New York.
Usher , M. B. (1989). Eco logical Ef f ect s of con t ro lling invasive t er rest r ial ver t eb rat es In : Drake
J.A.,
Mooney, H. A., d i Cast r i, F., Groves, R.H., Kruger , F. J., Rejm anek, M., & William son , M. (eds.)
Bio log ical Invasions: a g lobal perspect ive. SCOPE 37 John Wiley & Sons, New York.