
S3P10-Overview of Flood Mapping and Monitoring Tools
47
www.nasa.gov National Aeronautics and Space Administration ARSET Applied Remote Sensing Training http://arset.gsfc.nasa.gov @NASAARSET Overview of Flood Monitoring and Mapping Tools Amita Mehta
Transcript of S3P10-Overview of Flood Mapping and Monitoring Tools

www.nasa.gov
National Aeronautics andSpace Administration
ARSETApplied Remote Sensing Traininghttp://arset.gsfc.nasa.gov
@NASAARSET
Overview of Flood Monitoring and Mapping Tools
Amita Mehta

National Aeronautics and Space Administration 2Applied Remote Sensing Training Program
Learning Objectives
By the end of this presentation, you will be able to: • Understand flood monitoring schemes
– based on remote sensing of precipitation observations– based on remote sensing of land surface observations
• Use precipitation-based flood tools to monitor– flood potential based on accumulated precipitation– streamflow, runoff, flood intensity, and flood extent
• Use land surface-based flood tools to monitor – Inundation maps– media reports– a flood-related disaster alert system

National Aeronautics and Space Administration 3Applied Remote Sensing Training Program
Remote Sensing-Based Flood Detection
There are three approaches to using remote sensing observations for flood monitoring:1. Hydrology models that derive streamflow and runoff, using precipitation and
weather data from satellites and models2. Infer flooding conditions using satellite-derived precipitation3. Detect flood water on previously dry land surfaces using satellite-derived
land cover observations
Note: Each flooding tool also uses model and/or surface-based data in addition to satellite data
http://arset.gsfc.nasa.gov/disasters/webinars/advfloodwebinar

National Aeronautics and Space Administration 4Applied Remote Sensing Training Program
Outline
• Flooding Tools Based on Precipitation Observations– Global Food Monitoring System (GFMS)– Extreme Rainfall Detection System-2 (ERDS2)
• Flooding Tools Based on Land Cover Observations– MODIS Near Real-Time (NRT) Flood Mapping– Dartmouth Flood Observatory (DFO, DFO River Watch)– Global Flood Detection System 2 (GFDS2)
• Global Disasters Alert and Coordination System (GDACS)• Demonstration of GFMS, ERDS2 (before and during flooding events)• Demonstration of MODIS-NRT, DFO, GDACS (during and after flooding events)

Flooding Tools Based on Precipitation Observations
National Aeronautics and Space Administration 6Applied Remote Sensing Training Program
Precipitation-Based Flood Tools
• GFMS and ERDS2 use TRMM Multi-satellite Precipitation Analysis (TMPA) data
• GFMS is currently transitioning to using GPM-IMERG data
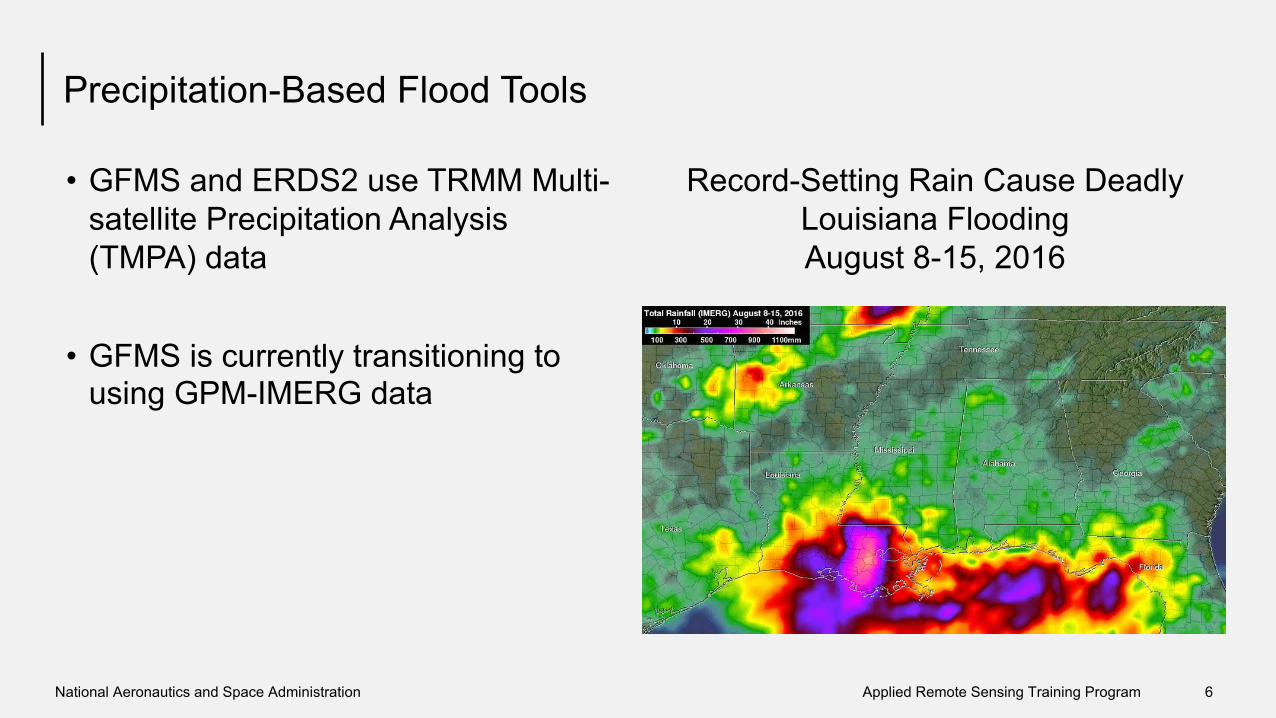
Record-Setting Rain Cause Deadly Louisiana FloodingAugust 8-15, 2016
National Aeronautics and Space Administration 7Applied Remote Sensing Training Program
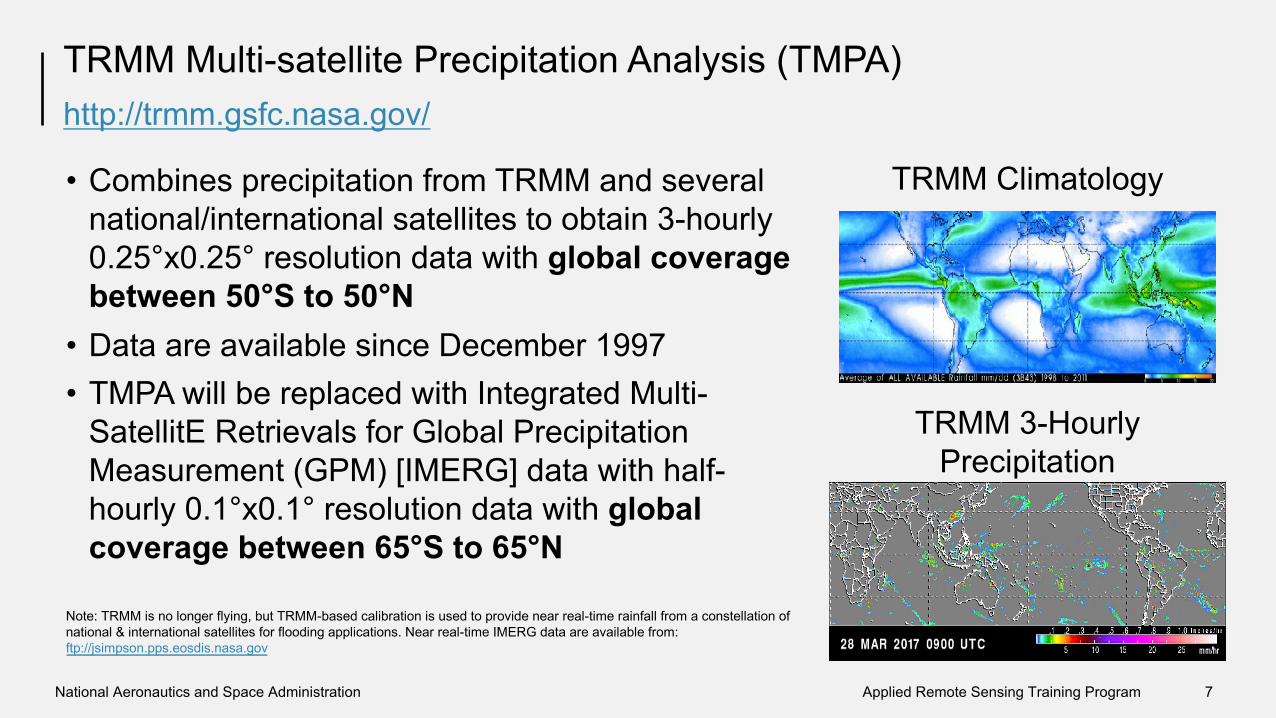
TRMM Multi-satellite Precipitation Analysis (TMPA)
• Combines precipitation from TRMM and several national/international satellites to obtain 3-hourly 0.25°x0.25° resolution data with global coverage between 50°S to 50°N
• Data are available since December 1997• TMPA will be replaced with Integrated Multi-
SatellitE Retrievals for Global Precipitation Measurement (GPM) [IMERG] data with half-hourly 0.1°x0.1° resolution data with global coverage between 65°S to 65°N
http://trmm.gsfc.nasa.gov/
Note: TRMM is no longer flying, but TRMM-based calibration is used to provide near real-time rainfall from a constellation of national & international satellites for flooding applications. Near real-time IMERG data are available from: ftp://jsimpson.pps.eosdis.nasa.gov
TRMM Climatology
TRMM 3-Hourly Precipitation
National Aeronautics and Space Administration 8Applied Remote Sensing Training Program
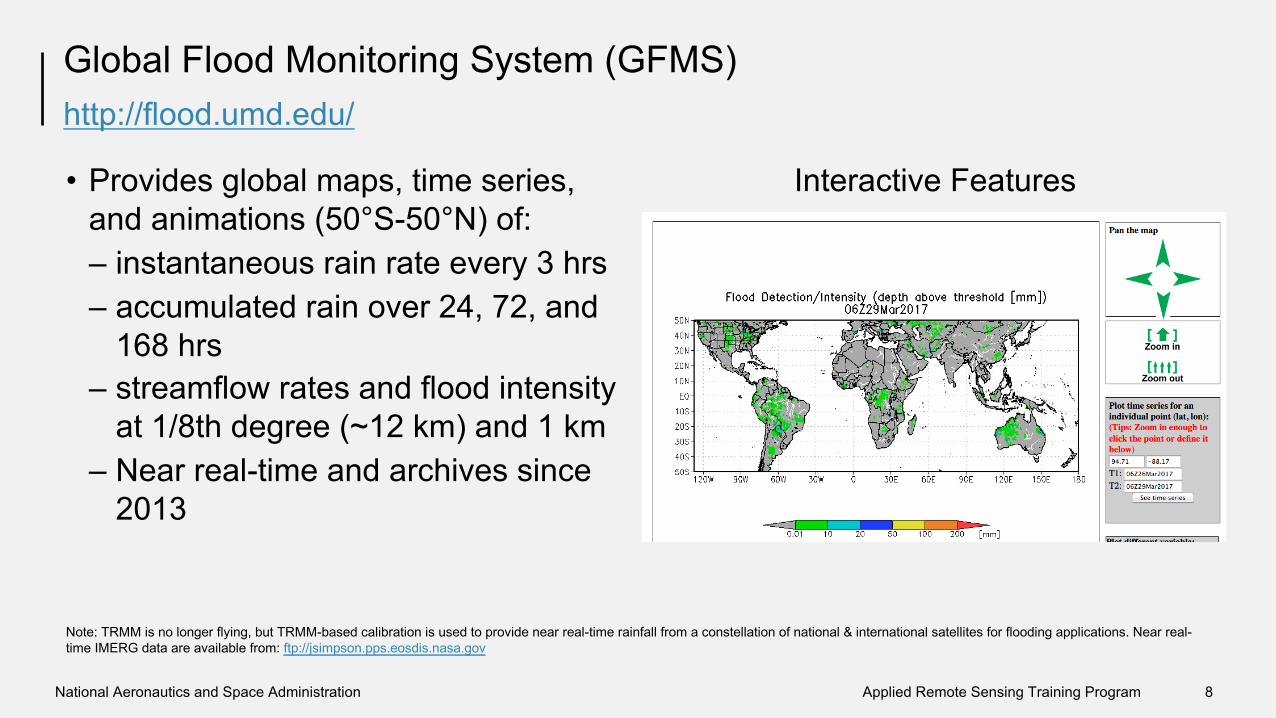
Global Flood Monitoring System (GFMS)
• Provides global maps, time series, and animations (50°S-50°N) of:– instantaneous rain rate every 3 hrs– accumulated rain over 24, 72, and
168 hrs– streamflow rates and flood intensity
at 1/8th degree (~12 km) and 1 km– Near real-time and archives since
2013
http://flood.umd.edu/
Interactive Features
Note: TRMM is no longer flying, but TRMM-based calibration is used to provide near real-time rainfall from a constellation of national & international satellites for flooding applications. Near real-time IMERG data are available from: ftp://jsimpson.pps.eosdis.nasa.gov

National Aeronautics and Space Administration 9Applied Remote Sensing Training Program
GFMS
• USES a hydrological model together with:– TMPA– surface temperature and winds from NASA
reanalysis model, Modern Era Retrospective Analysis for Research and Applications (MERRA)
– runoff generation from UW Variable Infiltration Capacity (VIC) model
– Runoff routing model from UMD
http://flood.umd.edu/
References:
Wu, H., R. F. Adler, Y. Tian, G. J. Huffman, H. Li, and J. Wang (2014), Real-time global flood estimation using satellite-based precipitation and a coupled land surface and routing model, Water Resour. Res., 50, 2693.2717, doi:10.1002/2013WR014710.
Wu H., R. F. Adler, Y. Hong, Y. Tian, and F. Policelli (2012), Evaluation of Global Flood Detection Using Satellite-Based Rainfall and a Hydrologic Model. J. Hydrometeor, 13, 1268.1284
Image Credit: University of Washington VIC Macroscale Hydrologic Model http://www.hydro.washington.edu/Lettenmaier/Models/VIC/Overview/ModelOverview.shtml
National Aeronautics and Space Administration 10Applied Remote Sensing Training Program
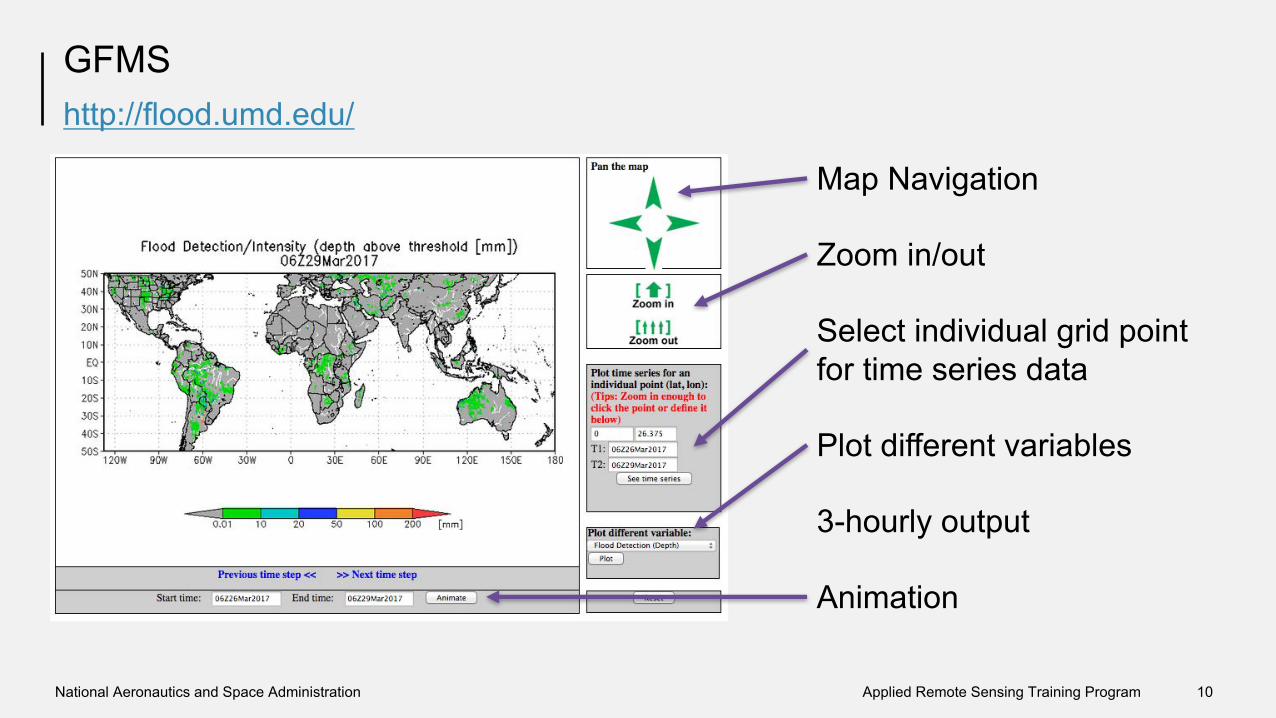
GFMShttp://flood.umd.edu/
Map Navigation
Zoom in/out
Select individual grid point for time series data
Plot different variables
3-hourly output
Animation

National Aeronautics and Space Administration 11Applied Remote Sensing Training Program
Extreme Rainfall Detection System-2 (ERDS2)
• Uses near real-time TRMM-TMPA and NOAA-Global Forecasting System (GFS) rainfall for monitoring and forecasting accumulated rainfall
• The TMPA historical archive is used as reference data to calculate extreme rainfall thresholds
• The combination of TMPA rainfall amount, GFS forecasted rainfall information, and the reference data, generates flooding information
http://erds.ithacaweb.org/
• ERDS is one of the tools used by the UN World Food Programme (WFP) Emergency Preparedness Unit

National Aeronautics and Space Administration 12Applied Remote Sensing Training Program
Extreme Rainfall Detection System-2 (ERDS2)
• Global maps and time series of near real-time (50°S-50°N) and forecasted accumulated rainfall – 24, 48, 72, 96, 120, and 144 hours
• Extreme rainfall alerts at 0.25°x0.25°levels and administrative district levels
• Event-specific information– list of affected countries – an estimation of affected population
http://erds.ithacaweb.org/
Value-Added Flood Information

Flooding Tools Based on Land Cover
National Aeronautics and Space Administration 14Applied Remote Sensing Training Program
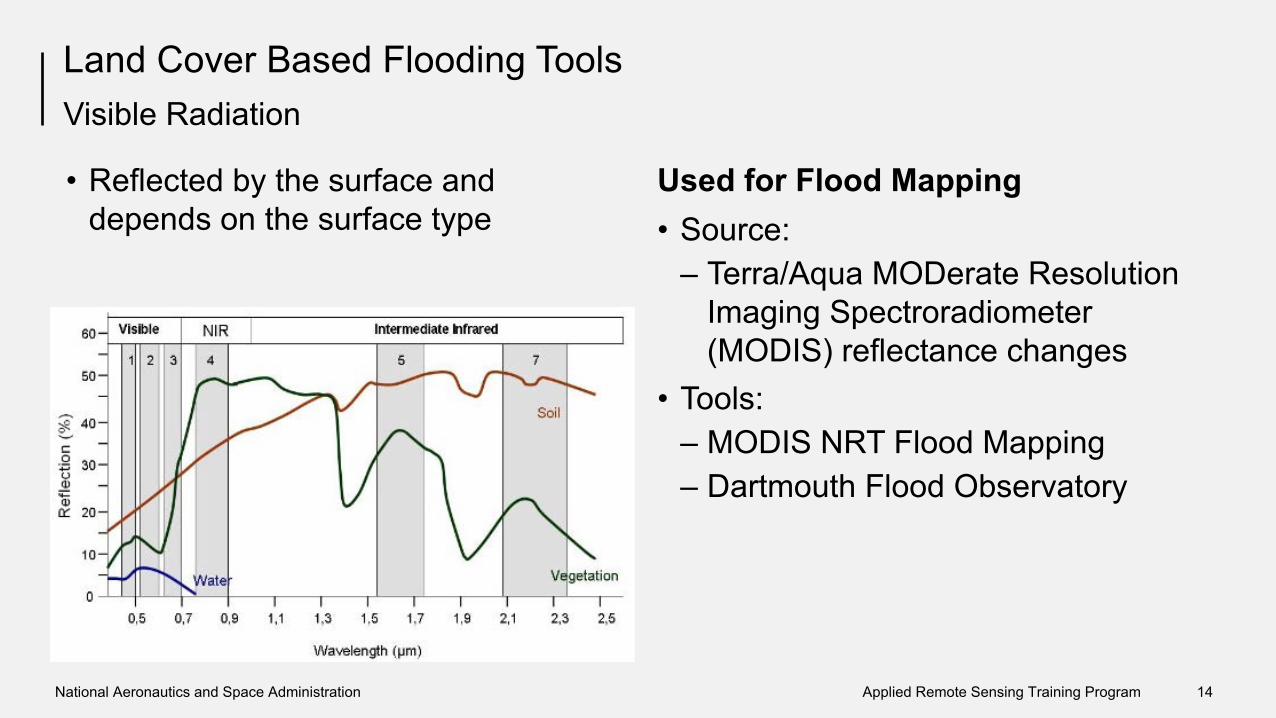
Land Cover Based Flooding Tools
• Reflected by the surface and depends on the surface type
Visible Radiation
Used for Flood Mapping• Source:
– Terra/Aqua MODerate Resolution Imaging Spectroradiometer(MODIS) reflectance changes
• Tools:– MODIS NRT Flood Mapping– Dartmouth Flood Observatory
National Aeronautics and Space Administration 15Applied Remote Sensing Training Program
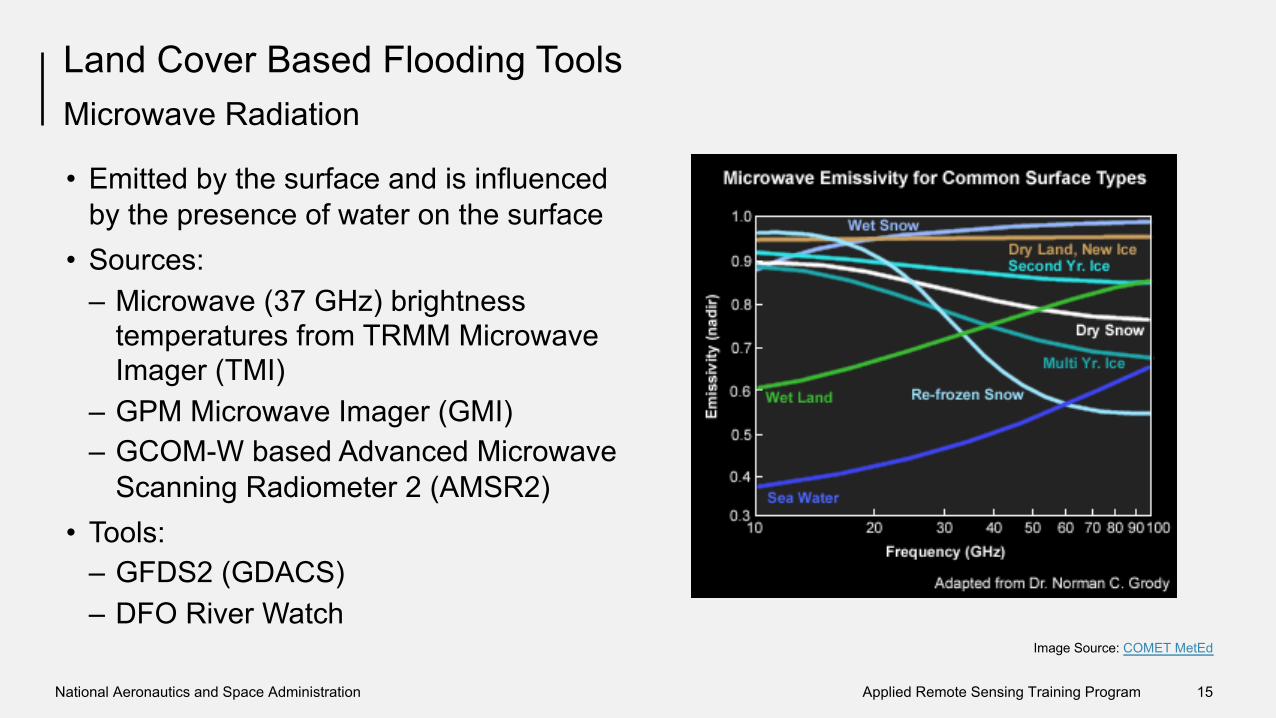
Land Cover Based Flooding Tools
• Emitted by the surface and is influenced by the presence of water on the surface
• Sources:– Microwave (37 GHz) brightness
temperatures from TRMM Microwave Imager (TMI)
– GPM Microwave Imager (GMI)– GCOM-W based Advanced Microwave
Scanning Radiometer 2 (AMSR2)• Tools:
– GFDS2 (GDACS)– DFO River Watch
Microwave Radiation
Image Source: COMET MetEd

National Aeronautics and Space Administration 16Applied Remote Sensing Training Program
MODIS-Based Inundation Mapping
• MODIS provides observations 1-2 times per day
• Certain bands indicate water on previously dry surfaces:– Band 1: 620-670 nm– Band 2: 841-876 nm– Band 7: 2105-2155 nm
• Mapped with respect to a global reference database of water bodies
• MODIS cannot see the surface in the presence of clouds MODIS (Terra)
May 13, 2016MODIS (Aqua)Mar 15, 2016
Mississippi River Flooding 2016
Mississippi River
White River
Flooding
Mississippi River

National Aeronautics and Space Administration 17Applied Remote Sensing Training Program
MODIS NRT Global Flood Mapping
• Based on MODIS reflectance at 250 m resolution composited on 2, 3, and 14 days
• Flood maps available on 10°x10° tile• Permanent and surface flood water data
available• Cloud or terrain shadows can be
misinterpreted as surface water• Provides near real-time flood mapping
since Jan 2013
http://oas.gsfc.nasa.gov/
National Aeronautics and Space Administration 18Applied Remote Sensing Training Program
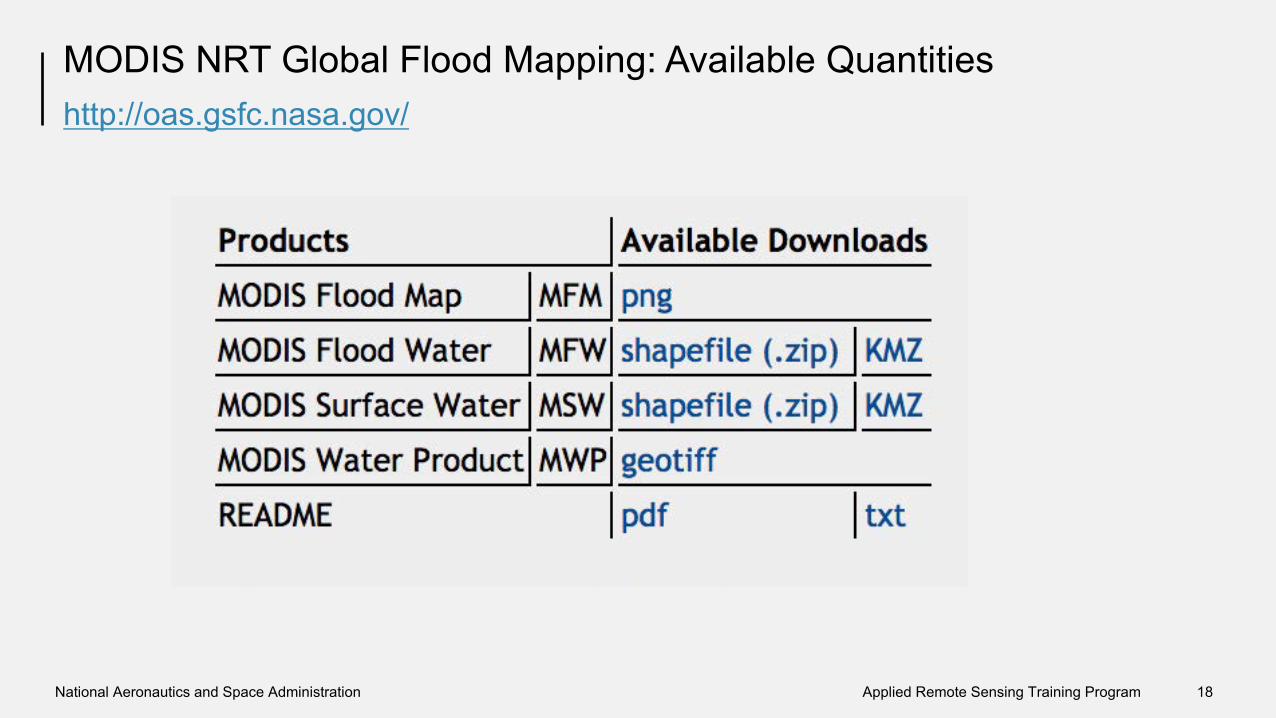
MODIS NRT Global Flood Mapping: Available Quantitieshttp://oas.gsfc.nasa.gov/

National Aeronautics and Space Administration 19Applied Remote Sensing Training Program
MODIS Flood Mapping: Southern Brazil, June 12-14, 2016http://oas.gsfc.nasa.gov/
product_date_tile_composite_xtra.extMSW_2012009_020E000S_3D3O_V.shpMFM_2012009_020E000S_2D2O.png
Filename Convention
yyyydoy(year, day of year)
lon-lat 2 or 3 day observations
3-Day Composites

National Aeronautics and Space Administration 20Applied Remote Sensing Training Program
MODIS Flood Mapping: Southern Brazil, June 12-14, 2016
• Similar filename convention with additional processing for composite field– N: no shadow masking– T: terrain shadow masking– S: both terrain & shadow masking
• e.g. 2D2OT– 2 days imagery, 2 observations required,
terrain shadow masking applied• Provides occurrence of water as percent
clear observation over the last 14 days’ products
• GeoTIFF are 0-1 images (1 if % water > 0)
14-Day Composites

National Aeronautics and Space Administration 21Applied Remote Sensing Training Program
Dartmouth Flood Observatory (DFO)
• Uses flood mapping based on MODIS reflectance– same as MODIS NRT
• Also uses Landsat 8, EO-1, and ASTER images– uses COSMO-SkyMed and
Sentinel-1 synthetic aperture radar (SAR) when available)
• Current flood events are analyzed with multiple data sources (next two slides), including media report
http://floodobservatory.colorado.edu/
• Provides near real-time, current, and past flood event mapping
• Red areas (above) indicate inundated surface

National Aeronautics and Space Administration 22Applied Remote Sensing Training Program
DFO Current Flood Event: Peru
Coastal flooding during local El Nino conditions (middle, Mar 27, 2017), compared to previous year (left image, Mar 27, 2016). Source: MODIS
http://floodobservatory.colorado.edu/
Flooding (red) from comparing Mar 20, 2017 and Jan 19, 2017.
Image Sources: DFO Image contains modified Copernicus Sentinel 1 data (2017), from Dartmouth Flood Observatory

National Aeronautics and Space Administration 23Applied Remote Sensing Training Program
DFO Current Flood Event: Peruhttp://floodobservatory.colorado.edu/
Light Blue: normal annual water extent from Feb 2000 (shuttle water boundary data)
Red: flood water mapped from ESA Sentinel-1 SAR
Dark Blue: previous flood extent

National Aeronautics and Space Administration 24Applied Remote Sensing Training Program
DFO Surface Water Record
• Surface water (SW) is based on twice-daily images– from Terra and Aqua MODIS– 250 m resolution– composited over 14 days
• Change in SW from SWDB (shuttle water boundary data) since 2000 also provided
• Available in 10°x 10° grids
http://floodobservatory.colorado.edu/Version3/120W050Nv3.html
SW Access Through the Map
National Aeronautics and Space Administration 25Applied Remote Sensing Training Program
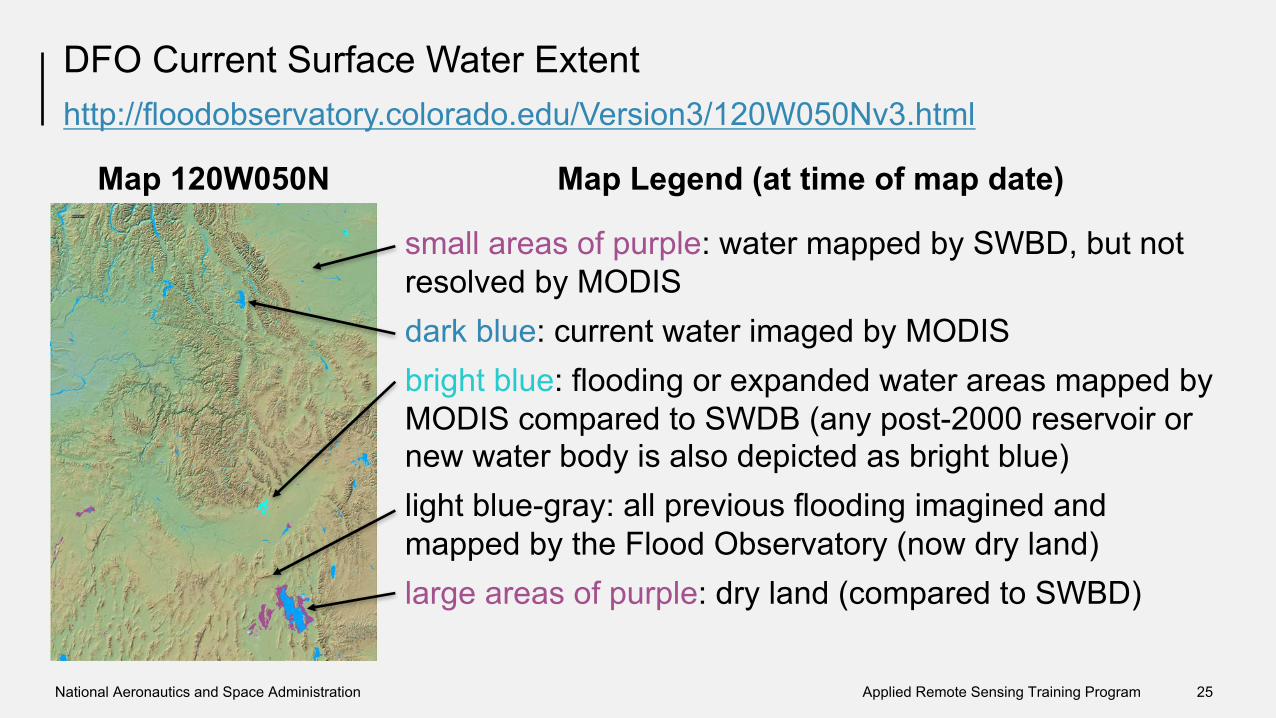
DFO Current Surface Water Extenthttp://floodobservatory.colorado.edu/Version3/120W050Nv3.html
Map 120W050N Map Legend (at time of map date)
small areas of purple: water mapped by SWBD, but not resolved by MODISdark blue: current water imaged by MODISbright blue: flooding or expanded water areas mapped by MODIS compared to SWDB (any post-2000 reservoir or new water body is also depicted as bright blue)light blue-gray: all previous flooding imagined and mapped by the Flood Observatory (now dry land)large areas of purple: dry land (compared to SWBD)

National Aeronautics and Space Administration 26Applied Remote Sensing Training Program
Error Notes from DFO
1. In mountainous regions, terrain shadows mimic surface water and are mis-classified as water in our current algorithm. We are working to reduce such noise.
2. Reservoirs and impoundments constructed since yr 2000 appear permanently in red.
3. The observational record illustrated may not include all floods: prior to 2011 the records were obtained manually and focus was on major flood events

National Aeronautics and Space Administration 27Applied Remote Sensing Training Program
Land Cover Based Flooding Tools
Visible Radiation• Used for flood mapping:
– Terra/Aqua MODerate Resolution Imaging Spectroradiometer(MODIS) reflectance changes
• Used by: – MODIS NRT Flood Mapping– Dartmouth Flood Observatory
• Used to observe land cover changes:– Reflectance from Landsat
• Used by: NOAA Coastal Flood Watch
Microwave Radiation• Used to detect inundated surface:
– Microwave (37 GHz) brightness temperatures from TRMM Microwave Imager (TMI)
– GPM Microwave Imager (GMI)– GCOM-W based Advanced
Microwave Scanning Radiometer 2 (AMSR2)
• Used by:– GFDS2 (GDACS)– DFO River Watch

National Aeronautics and Space Administration 28Applied Remote Sensing Training Program
About GFDS2 and DFO River Watch
• GFDS2 and DFO River Watch are collaborative programs
• Use microwave brightness temperatures (Tb) from TRMM, GPM, and GCOM-W satellites to detect surface inundation
http://floodobservatory.colorado.edu/technical.html
• S: satellite-based flood signal• M: Tb from a measurement pixel
centered over the river and its floodplain
• C: daily calibrating value that represents the 95th percentile of the day’s driest (brightest) Tb within a 9x9 pixel array surrounding the M pixel
• Departures from the mean value (anomalies) of the ratio is used to detect flooding conditions

National Aeronautics and Space Administration 29Applied Remote Sensing Training Program
GFDS2 Flood Magnitude
• Joint Research Center (JRC) from the European Commission produces daily, 10 km grids of satellite signal (S) to be used by GFDS2 and DFO River Watch
• GFDS2 derives flood magnitude based on the anomalies of the ratio (S) compared to its value averaged over 7 years (records start in Jun 2002)
• GFDS2 flood magnitudes are used by GDACS to provide near real-time alerts
http://bit.ly/GFDS_specs_15
National Aeronautics and Space Administration 30Applied Remote Sensing Training Program
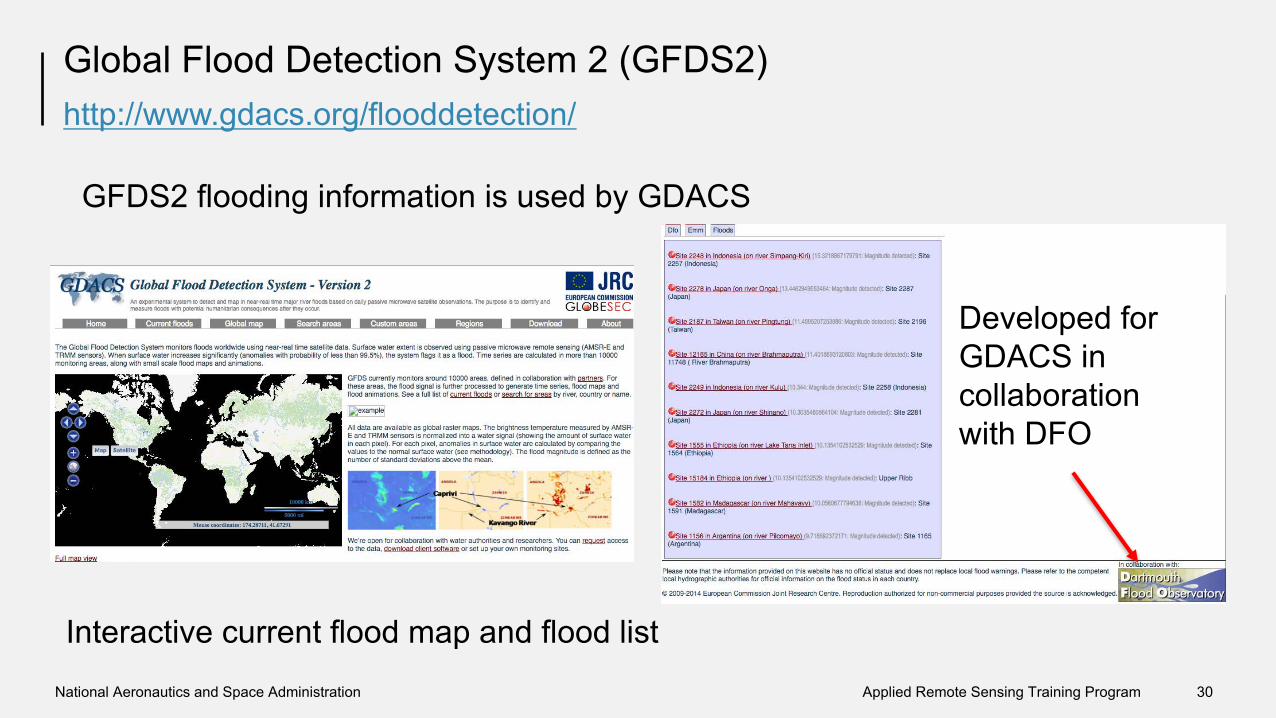
Interactive current flood map and flood list
Global Flood Detection System 2 (GFDS2)http://www.gdacs.org/flooddetection/
GFDS2 flooding information is used by GDACS
Developed for GDACS in collaboration with DFO

National Aeronautics and Space Administration 31Applied Remote Sensing Training Program
DFO River Watch
• DFO River Watch system uses the JRC-powered satellite signal (S –microwave brightness Tb ratio) at specific surface river gauging locations
• S values are converted to river discharge by combining them with surface discharge measurements and then converted to runoff by using a Water Balance Model (WBM)
http://floodobservatory.colorado.edu/GlobalRunoff.html

National Aeronautics and Space Administration 32Applied Remote Sensing Training Program
DFO River Watch
• Runoff calculations are available starting in 2003
• Satellite-derived runoff is compared to the 7 year (2003-2010) mean runoff record to decide low, normal, moderate, and major flooding
• Daily and monthly runoff time series are available at the river gauge sites
http://floodobservatory.colorado.edu/GlobalRunoff.html
• Flood magnitude is assigned when runoff volume exceeds a threshold decided based on the recurrence period from the runoff record
Reference: Merged AMSR-2 and GPM Passive Microwave Radiometry for Measuring River Discharge and Runoff. G. Robert Brakenridge, Son. V. Nghiem (http://floodobservatory.colorado.edu/Publications/2016IEEEPaper.pdf)
Missouri River Discharge
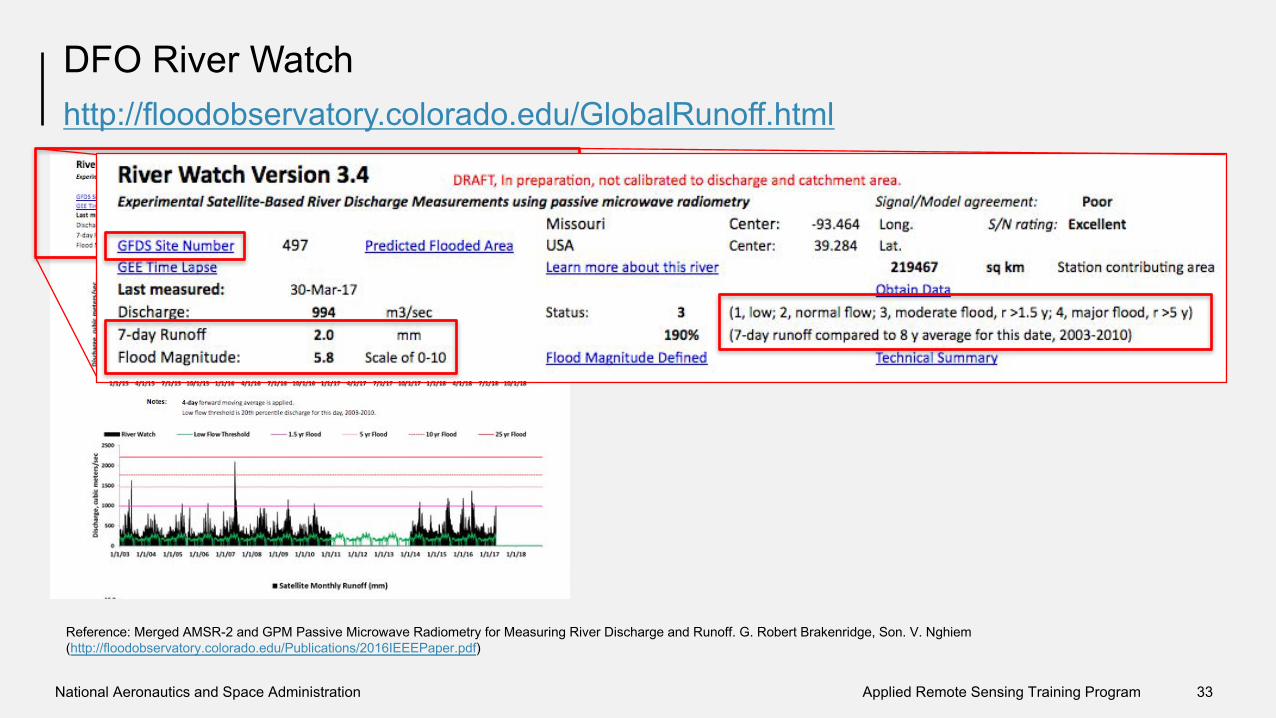
National Aeronautics and Space Administration 33Applied Remote Sensing Training Program
DFO River Watchhttp://floodobservatory.colorado.edu/GlobalRunoff.html
Reference: Merged AMSR-2 and GPM Passive Microwave Radiometry for Measuring River Discharge and Runoff. G. Robert Brakenridge, Son. V. Nghiem (http://floodobservatory.colorado.edu/Publications/2016IEEEPaper.pdf)
National Aeronautics and Space Administration 34Applied Remote Sensing Training Program
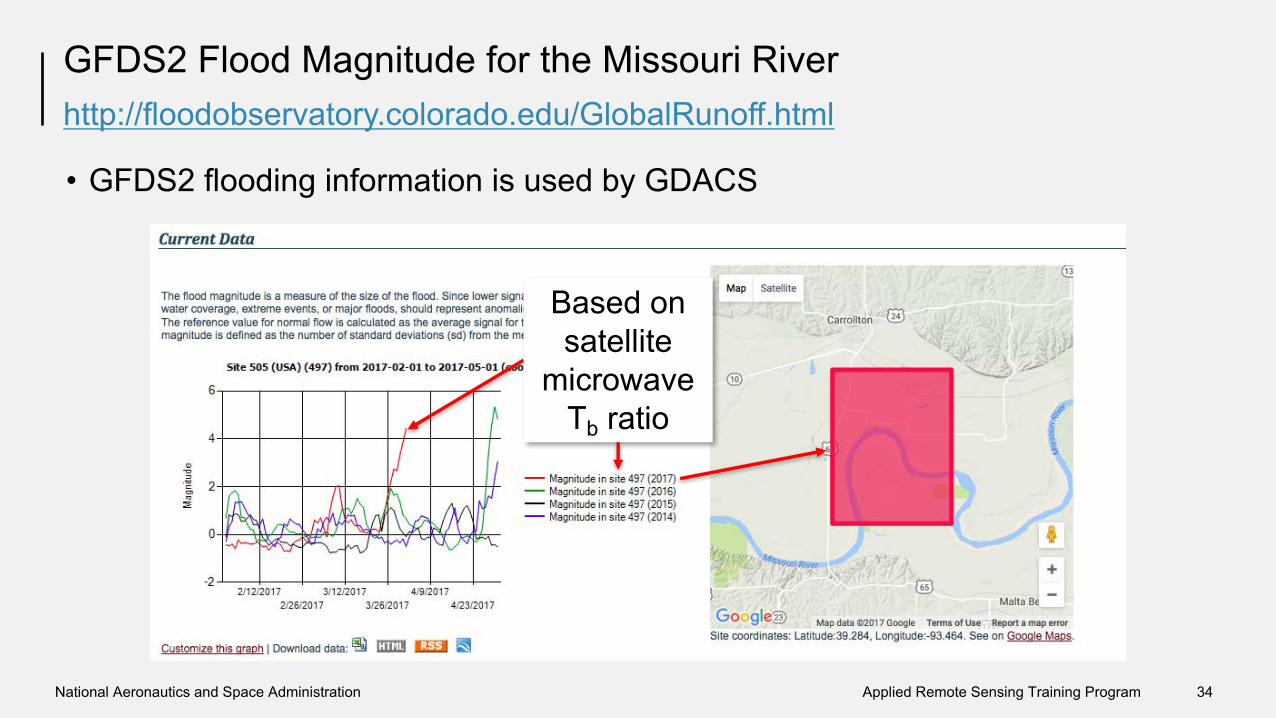
GFDS2 Flood Magnitude for the Missouri River
• GFDS2 flooding information is used by GDACS
http://floodobservatory.colorado.edu/GlobalRunoff.html
Based on satellite
microwave Tb ratio

Global Disasters Alert andCoordination System (GDACS)
http://arset.gsfc.nasa.gov/disasters/webinars/GDACS17

National Aeronautics and Space Administration 36Applied Remote Sensing Training Program
What is GDACS?
• A cooperation framework between the UN, the European Commission and disaster managers worldwide to improve alerts, information exchange and coordination in the first phase after major sudden-onset disasters
• Develops data tools and services that complement existing materials:
http://www.gdacs.org/
– Standard Operating Procedures from the European Community Mechanism for Civil Protection
– International Humanitarian Partnership (IHP)
– Euro Atlantic Disaster Response Coordination Centre (EADRCC)
– International Search and Rescue Advisory Group (INSARAG) Guidelines
– UN Disaster Assessment and Coordination (UNDAC) Field Handbook
– International Federation of Red Cross and Red Crescent Societies (IFRC) Publications
* Global Disaster Alert and Coordination System Guidelines [PDF]. (2014). GDACS.org

National Aeronautics and Space Administration 37Applied Remote Sensing Training Program
GDACS Tools and Services
• Interactive map with near real-time disasters alerts
• Color coded alerts– white: minor events– green: moderate events– orange: potential local disasters– red: potentially severe disasters
http://www.gdacs.org/
National Aeronautics and Space Administration 38Applied Remote Sensing Training Program
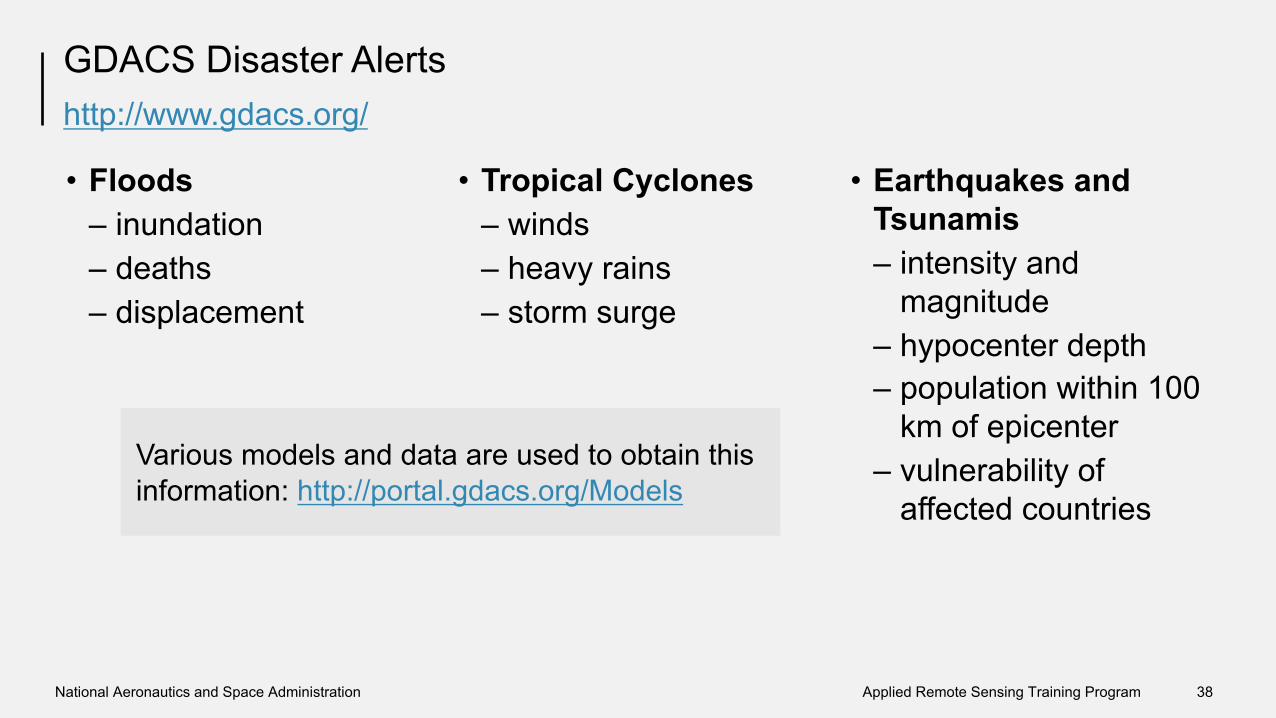
GDACS Disaster Alerts
• Floods– inundation– deaths– displacement
http://www.gdacs.org/
• Earthquakes and Tsunamis– intensity and
magnitude– hypocenter depth– population within 100
km of epicenter– vulnerability of
affected countries
• Tropical Cyclones– winds – heavy rains– storm surge
Various models and data are used to obtain this information: http://portal.gdacs.org/Models

National Aeronautics and Space Administration 39Applied Remote Sensing Training Program
GDACS Disaster Alerts
• Floods– inundation– deaths– displacement
http://www.gdacs.org/
• Earthquakes and Tsunamis– intensity and
magnitude– hypocenter depth– population within 100
km of epicenter– vulnerability of
affected countries
• Tropical Cyclones– winds – heavy rains– storm surge

National Aeronautics and Space Administration 40Applied Remote Sensing Training Program
GDACS Approach for Disaster Alerts: Floods
Issues flood alerts and maps using satellite-based information from the GFDS2 and population data
http://portal.gdacs.org/Models/
• Red Alert– more than 1,000 dead or 800,000
displaced• Orange Alert
– more than 100 dead or 80,000 displaced
• Green Alert– All other floods
Image Credit: GFDS Version 2 http://www.gdacs.org/flooddetection/global_map.aspx

National Aeronautics and Space Administration 41Applied Remote Sensing Training Program
GDACS Virtual On-Site Operations Coordination Center (OSOCC)
Recent Flood in the Philippines• Summary Report:
– deaths– displacement
• Latest news• Data, Images, and
Documents
http://vosocc.unocha.org/

National Aeronautics and Space Administration 42Applied Remote Sensing Training Program
GDACS Satellite Mapping Coordinate System (SMCS)
• Led by UNITAR-UNOSAT • Includes NASA and ESA satellite data • A GIS-based tool of satellite imagery
for specific disaster events– requires user registration
• Provides past and real-time imagery for an event
• Also offers: – baseline maps– situation specific maps– damage assessment maps– weather forecast maps
http://gdacs-smcs.unosat.org/

National Aeronautics and Space Administration 43Applied Remote Sensing Training Program
Summary of Flooding Web Tools Based on Precipitation
Flood Tool, Satellite,
Instrument, or Model
Quantities Used as Inputs
Hydrological Model Output
Spatial Coverage and Temporal
Resolution
GFMS• TRMM/
TMPA-RT• MERRA
• Rain rate• Surface
temperature• Winds
• VIC-UMD DRTR
• Flood intensity• Streamflow• Accumulated
rainfall
• 50°S-50°N• 12 km and 1 km• Jan 2001 – NRT
3 hr updates
ERDS• TRMM/
TMPA-RT• GFS
• Rain rate
• NRT & Forecast flood alerts
• Accumulated rainfall
• Population affected
• 50°S-50°N• 0.25°x0.25°• NRT and up to 72
hr forecast, 3 hrupdates

National Aeronautics and Space Administration 44Applied Remote Sensing Training Program
Summary of Flooding Web Tools Based on Land Surface Observations
Flood Tool, Satellite,Instrument, or Model
Quantities Used as Inputs Output Spatial Coverage and
Temporal Resolution
MODIS-NRT• Terra/Aqua MODIS
• Reflectance Bands 1, 2, 7
• Inundation map• Flood water• Surface water
• Global 250 m• NRT 2, 3, and 14 day
composites• 2013-present
DFO• Terra/Aqua MODIS
• Reflectance Bands 1, 2, 7
• MODIS Inundation map• Images when available:
SAREO-1Landsat
• Global 250 m• 14 day composite• Flood catalog (since
1985)
GFDS2 & DFO River Watch• Aqua/AMSR-
E,TRMM/TMI, GCOM-W/AMSR2, GPM/GMI
• Microwave Brightness Temperature (37 GHz)
• Water Balance Model• River Gauge
Discharge
• Flood Magnitude• River discharge time
series at selected locations
• Global, NRT• Past flood since 2003

Demonstration of GFMS, ERDS2 (before and during flooding events)

Demonstration of MODIS-NRT, DFO, GDACS (during and after flooding events)
Next: Overview of NASA Socioeconomic Data


