
S2P4 Rudra MIssingDataInAnalysis of FreightGeneration · GTHAMovementofCommercial%...
32
83% of sta*s*cs are made up… (including this one)
Transcript of S2P4 Rudra MIssingDataInAnalysis of FreightGeneration · GTHAMovementofCommercial%...
83% of sta*s*cs are made up… (including this one)
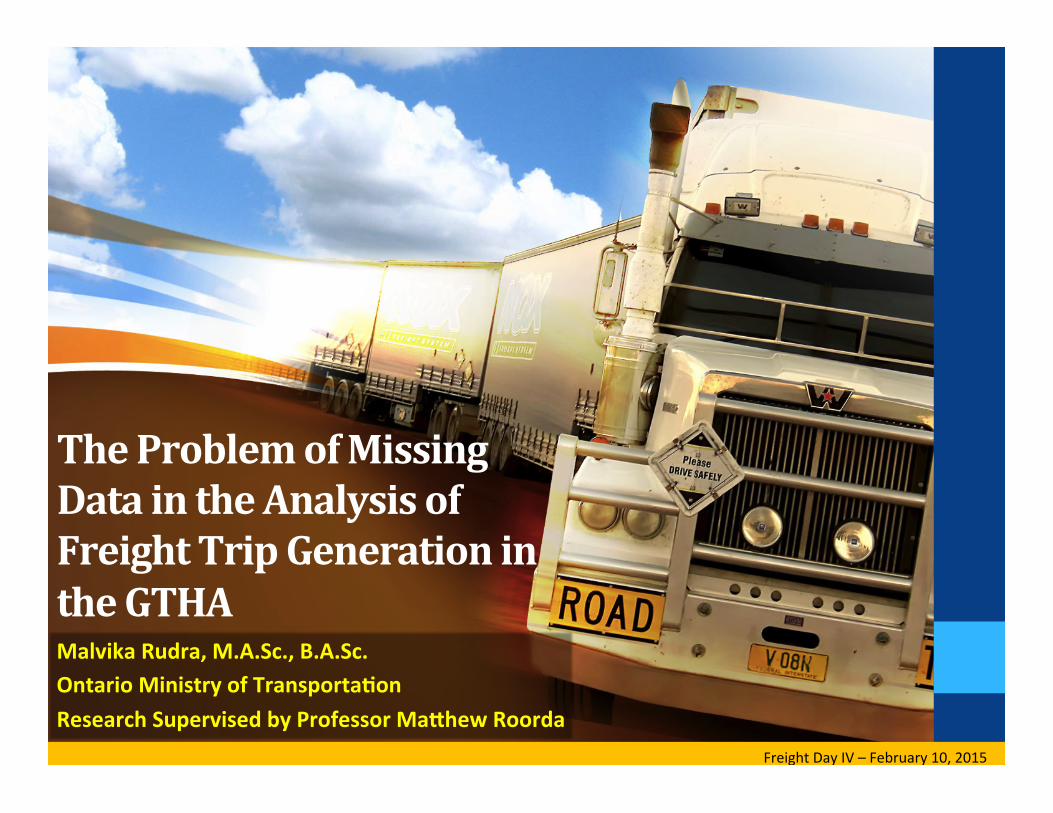
The Problem of Missing Data in the Analysis of Freight Trip Generation in the GTHA Malvika Rudra, M.A.Sc., B.A.Sc. Ontario Ministry of Transporta*on Research Supervised by Professor MaHhew Roorda
Freight Day IV – February 10, 2015

Forecasts of Freight Traffic
Knowledge of Freight GeneraBon
Rich, Detailed Data
3

GTHA Movement of Commercial Goods and Services Survey • 1006 small and medium-‐sized firms in the GTHA
• Establishment characterisBcs, inbound/outbound shipments, commercial vehicle trips and tours
• Fully complete records for exactly 112 firms (~11%)
4

The Problem of Missing Data • Missing data is common in empirical research. • Nonresponse in travel surveys is problemaBc for three main reasons: • Poor quality • Costs • Biased data
5

Traditional Approaches
Listwise Dele*on
6
Pairwise Dele*on

All staBsBcal models are wrong, but some are useful.
7

8
Missing Data Imputa*on
Single Imputa*on
Mul*ple Imputa*on
Imputation

Imputation
Single Imputa*on
9
Mul*ple Imputa*on
• Process of replacing missing data with subsBtuted values; “filling in the gaps”

Method • Much of the research surrounding data imputaBon has been in the fields of markeBng, staBsBcs, and economics.
10
Assessmen
t of various imputaBon techniques
ApplicaB
on
of imputaBon to GTHA Shipper Based Dataset
Developm
ent
of freight trip generaBon models for the GTHA

Imputation Methods
11

Single Imputation • Regression ImputaBon • Hot Deck ImputaBon • Random Hot Deck ImputaBon • Nearest Neighbour ImputaBon • SequenBal Hot Deck ImputaBon
12

Multiple Imputation • Involves impuBng m values for each missing item and creaBng m (m>1) complete datasets to reflect uncertainty levels
• Generally, only about 3-‐10 imputaBons are needed.
13

14

MI Methods • Mahalanobis Distance Matching Method • PredicBve Model Based Method • Propensity Score Method • PredicBve Mean Matching Method
15

Simulation Experiment • Quality of ImputaBon??? • One opBon to gain an impression of the quality of an imputaBon model -‐ SimulaBon Experiment
• Temporarily delete some of the true values in a complete dataset and then impute new values • If the imputed values ỹi are close to the original values yi, the quality of the imputaBon method is likely to be high.
16

Missingness • Complete GTHA Shipper-‐Based Survey dataset was filtered down to 21 key variables • Of the 1006 records, just 112 were fully complete
• Key Variables: # of employees, value of services in a year, value of goods shipped/received in a year, # of shipments shipped/received, square footage 17
Variable Non Response (#)
Non Response Rate (%)
lngNumofEmployees 9 1% fkIndustryClassification 3 0% intSquareFeetEst 138 14% Vehicles Arrived intPassengerArrived 436 43% intPickupArrived 378 38% intSUTruckArrived 490 49% intTractorOnlyArrived 665 66% intTractorOneTrailerArrived 600 60% intTractorTwoTrailersArrived 669 67% intOtherArrived 749 74% Vehicles Departed intPassengerDeparted 465 46% intPickupDeparted 435 43% intSUTruckDeparted 537 53% intTractorOnlyDeparted 683 68% intTractor1TrailorDeparted 633 63% intTractor2TrailersDeparted 686 68% intOtherDeparted 754 75% Vehicles Owned intPassengerCarOwn 408 41% intPickupOwn 490 49% intSUTruckOwn 606 60% intContainersOwn 640 64% intTractorsOwn 639 64% intTrailerOwn 637 63% intOtherOwn 674 67% fkValueServicesYr 43 4% fkValueGoodsRecievedYr 110 11% fkValueGoodsShippedYr 128 13% fkShipmentsReceivedYr 100 10% fkShipmentsShippedYr 151 15%

Simulation Experiment • 7 imputaBon techniques applied; 20 imputaBons in total • StaBsBcal tests performed to assess suitability of the techniques • Most suitable techniques applied to the large dataset
18
Mul*ple
Imputa*on
Techniques
1. Propensity Score
Method
2. Mahalanobis
Method
3. Predic*ve Mean
Matching Method
4. Combina*on
Method
Single
Imputa*on
Techniques
5. Group Means
6. Hot Deck
7. Predicted Mean

Freight Trip Generation Modelling
19
Class I: Class II: Class III:
Based on True Complete
Data (139 Records)
Based on Singly Imputed
Data (1006 Records)
• Technique: Predicted Mean ImputaBon
Based on Mul*ply
Imputed Data (1006
Records)
• Techniques: Mahalanobis Distance Matching and PredicBve Mean Matching
• 3 industry classes considered: 1. Manufacturing; 2. General Trade; 3. Service Industries

# of Employees Vehicles Owned
Value of Services
($)
Value of Goods Shipped
($)
# of Shipments Shipped
Complete Data Man. ü
GT ü
Ser. ü
SI Model
Man. ü
ü
ü
ü
GT ü
ü
ü
Ser. ü
ü
MI Model #1
Man. ü
ü
ü
GT ü
ü
ü
Ser. ü
ü
ü
MI Model #2
Man. ü ü
GT ü
ü
ü
ü
Ser. ü
ü
ü
20
# of Employees
Vehicles Owned
Value of Services
($)
Value of Goods Shipped
($)
# of Shipments Shipped
R2
Man. ü 0.75
GT ü 0.14
Ser. ü 0.22
Man. ü ü ü ü 0.68
GT ü ü ü 0.57
Ser. ü ü 0.98
Man. ü ü ü 0.15
GT ü ü ü 0.13
Ser. ü ü ü 0.15
Man. ü ü 0.11
GT ü ü ü ü 0.12
Ser. ü ü ü 0.09
Original Data
SI Model
MI Model #1
MI Model #2

Findings • ImputaBon: • Allows the usage of the full dataset • Allows for greater flexibility in modelling
• Although single imputaBon produces models that have higher R-‐squared values, it is generally preferred to use mulBple imputaBon.
21

Findings cont’d…
• With single imputaBon, all the imputed values are completely determined by the imputaBon model applied to the observed data. In essence, they contain no error.
22

Findings cont’d… • Nonresponse impacts the quality of our analysis in transportaBon. • EsBmates from surveys where there is a high degree of nonresponse are likely to be distorted by nonresponse.
23

“Studies have shown that accurate numbers aren’t any more useful than the ones you make up.”
24

• 83% of staBsBcs are made up (including this one). “There's lies, damn lies, and staBsBcs.”
• -‐ Mark Twain
26

Types of Missing Data • Missing Completely At Random (MCAR) • Probability that an observaBon (Xi) is missing is unrelated to the value of Xi or the value of other variables
• Missing At Random (MAR) • Probability that an observaBon (Xi) is missing is unrelated to the value of Xi but it is related to the value of other variables
• Missing Not At Random (MNAR) • Most problemaBc, because it requires a model to be created that accounts for the missingness before an unbiased esBmate of parameters can be obtained
27

Types of Non Response • Item Nonresponse • When a respondent does not answer one or more quesBons in a survey, while he/she answered the other quesBons
• Unit Nonresponse • When enBre records of potenBal respondents to a survey are missing
28
# V1 V2 V3
1
2
3
# V1 V2 V3
1
2
3

SI Model 29

MI Model: Mahalanobis
MI Model: Predicted Mean
30
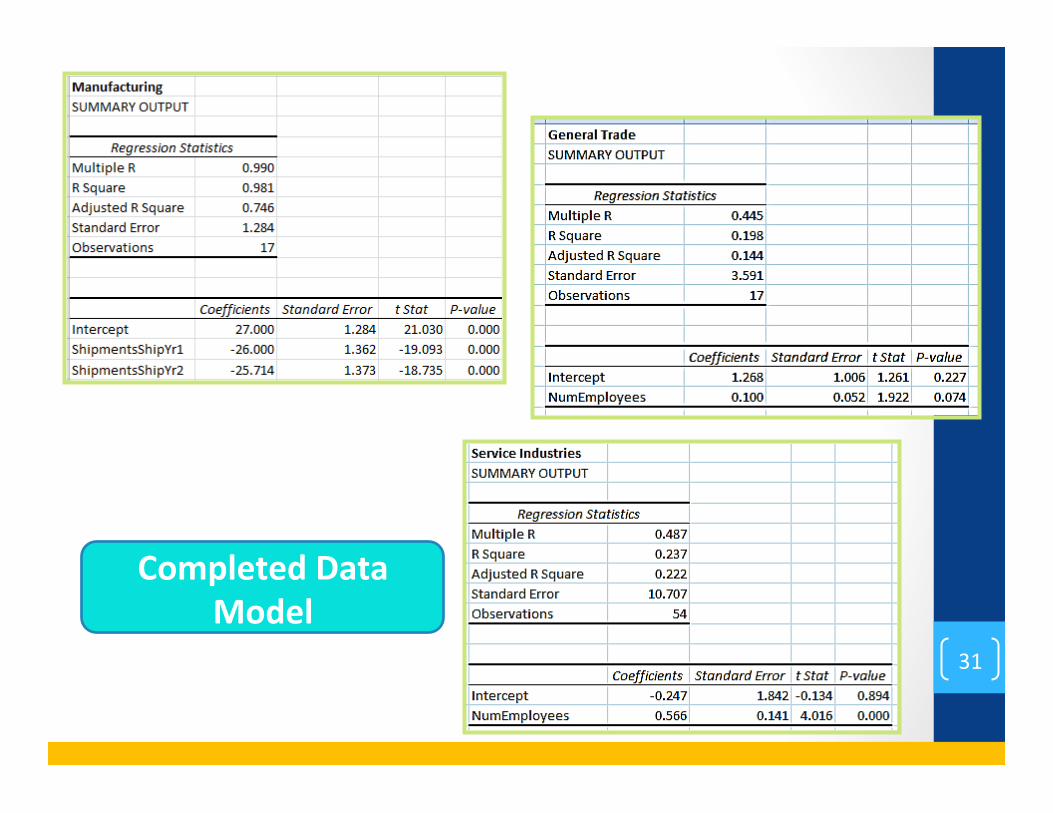
Completed Data Model
31

Limitations and Future Work • Consider a greater number of imputaBons when applying mulBple imputaBon. • Latest research suggests more imputaBons are needed than has been tradiBonally thought.
• Further examinaBon of missingness patern in dataset. • Consider more complex imputaBon methods.
32