![eBook Production: A Templated Workflow [2013]](https://static.fdocuments.net/doc/165x107/5596c5c01a28ab51408b46a5/ebook-production-a-templated-workflow-2013.jpg)
S1: NMR and MS spectra of the corresponding complexes · S1: NMR and MS spectra of the...
7
S1: NMR and MS spectra of the corresponding complexes Supporting Information for Templated versus non-templated synthesis of benzo-21-crown-7 and the influence of substituents on its complexing properties Wei Jiang and Christoph A. Schalley* Address: Institut für Chemie und Biochemie, Freie Universität Berlin, Takustraße 3, 14195 Berlin, Germany E-mail: Christoph A. Schalley - [email protected] * Corresponding author S1
Transcript of S1: NMR and MS spectra of the corresponding complexes · S1: NMR and MS spectra of the...

S1: NMR and MS spectra of the corresponding complexes
Supporting Information
for
Templated versus non-templated synthesis of benzo-21-crown-7 and the
influence of substituents on its complexing properties
Wei Jiang and Christoph A. Schalley*
Address: Institut für Chemie und Biochemie, Freie Universität Berlin, Takustraße 3, 14195
Berlin, Germany
E-mail: Christoph A. Schalley - [email protected]
* Corresponding author
S1

0
20
40
60
80
100
500 1000 1500 2000 2500 3000 3500 4000 4500 5000Mass/Charge
Varian MS Remove Noises & Harmonics @5.0hz 02-SEP-2009 13:43:48File: C:\ Program Files\ Omega8\ Data\ Wei\C14\ C14-from K template-4.transC14-from K template-4Base-Peak Amplitude: 9.3791 Total Intensity: 29.303 Scans: 1 Positive Ions
395
935379
1659
184310416631119619
1765550
Figure S1: ESI-FTICR Mass spectrum of (C7+KPF6) sprayed from DCM. The peaks at m/z
379, 395, and 935 are assigned to [C7+Na]+, [C7+K]+, and [2C7+K+KPF6]+, respectively.
Since we didn’t deliberately add KPF6 into this solution, KPF6 should be from the template
used in the reaction which could not be removed after extraction and column chromatography.
This result is in agreement with NMR results.
0
20
40
60
80
100
500 1000 1500 2000 2500 3000 3500 4000 4500 5000Mass/Charge
Varian MS Remove Noises & Harmonics @5.0hz 02-SEP-2009 14:52:42File: C:\ Program Files\ Omega8\ Data\ Wei\C14\ C14-from KPF6+G7-4.transC14-from KPF6+G7-4Base-Peak Amplitude: 25.6144 Total Intensity: 45.005 Scans: 1 Positive Ions
550
1246
22811101
Figure S2: ESI-FTICR Mass spectrum of (C7+KPF6) in the presence of 6-H·PF6. The peak at
m/z 550 is assigned to [6-H@C7]+. The only intense peak suggests that C7 is the dominant
organic compound in (C7+KPF6) and 6-H·PF6 fits better to C7 than KPF6.
S2

The association constants which were calculated by single-point method:
Figure S3: 1H NMR spectrum (500 MHz, 298 K, CDCl3:CD3CN = 2:1, 1.0 mM) of the
equimolar mixture of 6-H·PF6 and C7. From complexed and uncomplexed Ha of C7, Ka(Ha) =
[(4.00/5.11) × 1.0 × 10−3] / [(1.11/5.11) × 1.0 × 10−3]2 M−1 = 16590 M−1; From complexed and
uncomplexed Hl of 6-H·PF6, Ka(Hl) = [(2.16/2.74) × 1.0 × 10−3] / [(0.58/2.74) × 1.0 × 10−3]2
M-1 = 17590 M−1. Finally, Ka = (16590+17590)/2 = 17090 (±500) M−1.
Figure S4: 1H NMR spectrum (500 MHz, 298 K, CDCl3:CD3CN = 2:1, 1.0 mM) of the
equimolar mixture of 7-H·PF6 and C7. From complexed and uncomplexed H1 of 7-H·PF6,
Ka(H1) = [(1.06/1.60) × 1.0 × 10−3] / [(0.54/1.60) × 1.0 × 10−3]2 M−1 = 5820 M−1; From
complexed and uncomplexed Hj’ of 7-H·PF6, Ka(Hj’) = [(2.02/3.09) × 1.0 × 10−3] / [(1.07/3.09)
× 1.0 × 10−3]2 M−1 = 5450 M−1. Finally, Ka = (5820+5450)/2 = 5640 (±190) M−1.
S3
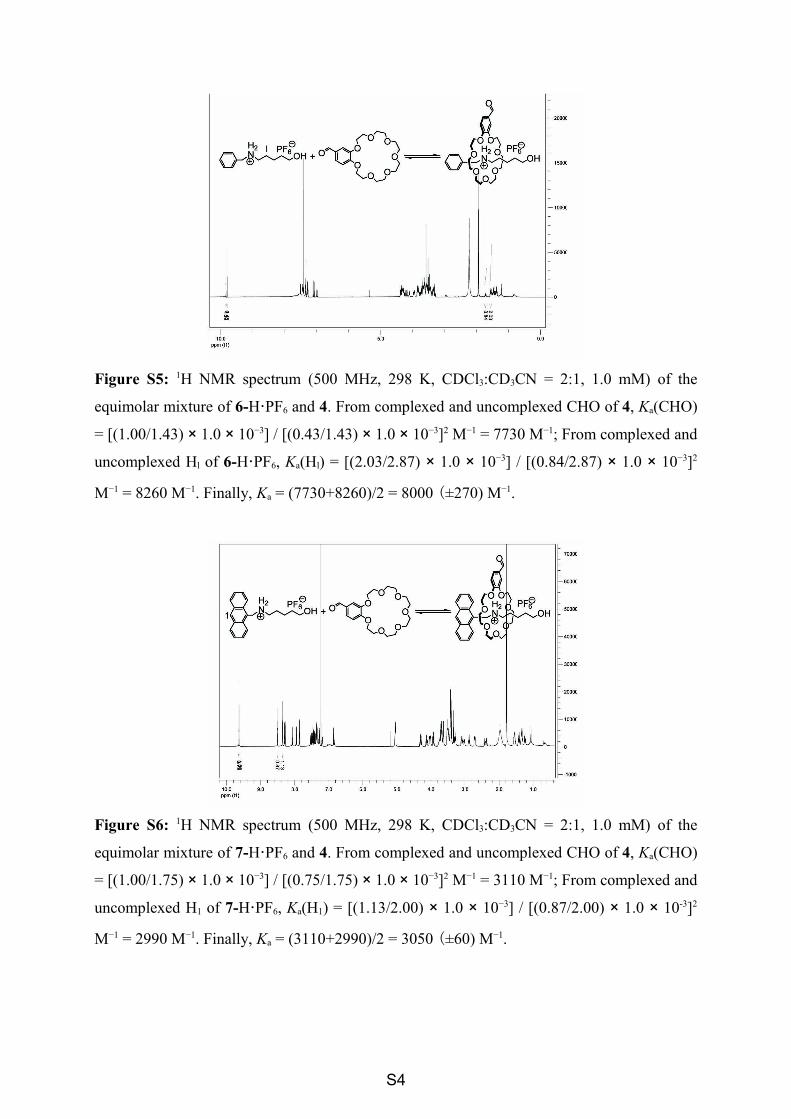
Figure S5: 1H NMR spectrum (500 MHz, 298 K, CDCl3:CD3CN = 2:1, 1.0 mM) of the
equimolar mixture of 6-H·PF6 and 4. From complexed and uncomplexed CHO of 4, Ka(CHO)
= [(1.00/1.43) × 1.0 × 10−3] / [(0.43/1.43) × 1.0 × 10−3]2 M−1 = 7730 M−1; From complexed and
uncomplexed Hl of 6-H·PF6, Ka(Hl) = [(2.03/2.87) × 1.0 × 10−3] / [(0.84/2.87) × 1.0 × 10−3]2
M−1 = 8260 M−1. Finally, Ka = (7730+8260)/2 = 8000 (±270) M−1.
Figure S6: 1H NMR spectrum (500 MHz, 298 K, CDCl3:CD3CN = 2:1, 1.0 mM) of the
equimolar mixture of 7-H·PF6 and 4. From complexed and uncomplexed CHO of 4, Ka(CHO)
= [(1.00/1.75) × 1.0 × 10−3] / [(0.75/1.75) × 1.0 × 10−3]2 M−1 = 3110 M−1; From complexed and
uncomplexed H1 of 7-H·PF6, Ka(H1) = [(1.13/2.00) × 1.0 × 10−3] / [(0.87/2.00) × 1.0 × 10-3]2
M−1 = 2990 M−1. Finally, Ka = (3110+2990)/2 = 3050 (±60) M−1.
S4

1H-1H COSY Spectra:
Figure S7: 1H-1H COSY spectrum (500 MHz, 298 K, CDCl3:CD3CN = 2:1, 10.0 mM) of the
equimolar mixture of 6-H·PF6 and C7. The COSY spectrum supports the assignments of the
peaks in Figure 5b.
Figure S8: 1H-1H COSY spectrum (500 MHz, 298 K, CDCl3:CD3CN = 2:1, 10.0 mM) of the
equimolar mixture of 7-H·PF6 and C7. The COSY spectrum supports the assignments of the
peaks in Figure 5e.
S5

Figure S9: 1H-1H COSY spectrum (500 MHz, 298 K, CDCl3:CD3CN = 2:1, 10.0 mM) of the
equimolar mixture of 6-H·PF6 and 4. The COSY spectrum supports the assignments of the
peaks in Figure 5c.
Figure S10: 1H-1H COSY spectrum (500 MHz, 298 K, CDCl3:CD3CN = 2:1, 10.0 mM) of the
equimolar mixture of 7-H·PF6 and 4. The COSY spectrum supports the assignments of the
peaks in Figure 5d.
S6
H2N
PF6 H2N
OO
OO O
O
OO PF6
OO O
O
OOO
O+
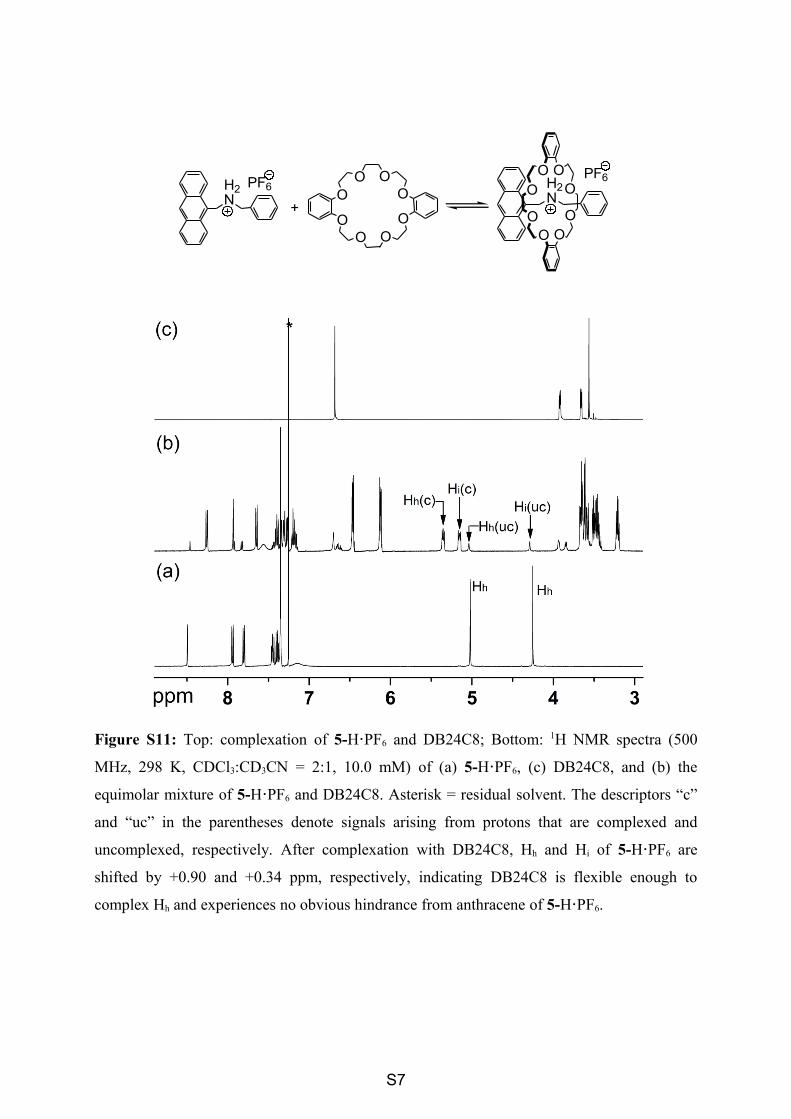
Figure S11: Top: complexation of 5-H·PF6 and DB24C8; Bottom: 1H NMR spectra (500
MHz, 298 K, CDCl3:CD3CN = 2:1, 10.0 mM) of (a) 5-H·PF6, (c) DB24C8, and (b) the
equimolar mixture of 5-H·PF6 and DB24C8. Asterisk = residual solvent. The descriptors “c”
and “uc” in the parentheses denote signals arising from protons that are complexed and
uncomplexed, respectively. After complexation with DB24C8, Hh and Hi of 5-H·PF6 are
shifted by +0.90 and +0.34 ppm, respectively, indicating DB24C8 is flexible enough to
complex Hh and experiences no obvious hindrance from anthracene of 5-H·PF6.
S7