S Wind Turbine Selection using Evaluation of ind Energy...
12
International Journal on Cybernetics & Informatics ( IJCI) Vol.2, No.6, December 2013 DOI: 10.5121/ijci.2013.2601 1 Suitable Wind Turbine Selection using Evaluation of Wind Energy Potential in IRAN Hadi Sefidgar 1 and S. Asghar Gholamian 2 1,2 Babol University of Technology, Faculty of Electrical and Computer Engineering, Babol, Iran ABSTRACT Nowadays, low environmental impact of wind energy is attractive. This paper aims to investigate the wind- power production potential of sites in North of Iran. Analysis of the wind speed of one city in the province of MAZANDARAN which is located in north of Iran is performed in this paper. The class of this site is a class one wind power site and the annual average wind speed is 3.58 m/s. The power density of this site is 99 W/m2 at 50 m height. Wind speed data measured over a five-year period at a typical site on the north coast of Iran are presented. The annual wind speeds at different heights have been studied to make optimum selection of wind turbine installation among three commercial turbines. Keywords Wind turbine, Wind energy potential, Wind power density, MAZANDARAN. 1. Introduction Wind energy is one of the most promising solutions, especially considering its technological advancements and its growth over the past years [2]. Iran is one of the countries which have recently paid a great attention to install and also build wind turbines. A power wind generator is one of the best and cleanest methods of producing electricity and can be a proper replacement for conventional fossil fuel [3]. Nowadays, the increasing demand for electrical energy and the restriction on pollution levels have led to an increasing interest in large scale utilization of renewable energies like wind and PV across many countries for example Iran. It is known that the supplies of fossil energy (such as oil, gas and ...) are limited and their utilization as energy sources causes' environmental degradation due to incomplete combustion when used as energy source. In addition to this as the increasing of population increases the demand for energy sources, therefore the issue of a seldom replacement of fossil fuels with renewable energy sources is major consideration for all of countries: Iran Bing (in Asian Middle East) has a great potential for producing about 7000MW of electricity with wind energy [4].
Transcript of S Wind Turbine Selection using Evaluation of ind Energy...
International Journal on Cybernetics & Informatics ( IJCI) Vol.2, No.6, December 2013
DOI: 10.5121/ijci.2013.2601 1
Suitable Wind Turbine Selection using Evaluation of
Wind Energy Potential in IRAN
Hadi Sefidgar 1 and S. Asghar Gholamian
2
1,2
Babol University of Technology, Faculty of Electrical and Computer Engineering,
Babol, Iran
ABSTRACT
Nowadays, low environmental impact of wind energy is attractive. This paper aims to investigate the wind-
power production potential of sites in North of Iran. Analysis of the wind speed of one city in the province
of MAZANDARAN which is located in north of Iran is performed in this paper. The class of this site is a
class one wind power site and the annual average wind speed is 3.58 m/s. The power density of this site is
99 W/m2 at 50 m height. Wind speed data measured over a five-year period at a typical site on the north
coast of Iran are presented. The annual wind speeds at different heights have been studied to make
optimum selection of wind turbine installation among three commercial turbines.
Keywords
Wind turbine, Wind energy potential, Wind power density, MAZANDARAN.
1. Introduction
Wind energy is one of the most promising solutions, especially considering its technological
advancements and its growth over the past years [2]. Iran is one of the countries which have
recently paid a great attention to install and also build wind turbines.
A power wind generator is one of the best and cleanest methods of producing electricity and can
be a proper replacement for conventional fossil fuel [3].
Nowadays, the increasing demand for electrical energy and the restriction on pollution levels
have led to an increasing interest in large scale utilization of renewable energies like wind and PV
across many countries for example Iran. It is known that the supplies of fossil energy (such as oil,
gas and ...) are limited and their utilization as energy sources causes' environmental degradation
due to incomplete combustion when used as energy source.
In addition to this as the increasing of population increases the demand for energy sources,
therefore the issue of a seldom replacement of fossil fuels with renewable energy sources is major
consideration for all of countries: Iran Bing (in Asian Middle East) has a great potential for
producing about 7000MW of electricity with wind energy [4].

International Journal on Cybernetics & Informatics ( IJCI) Vol.2, No.6, December 2013
2
Wind has been estimated that about 10 million MW of energy are available in the earth’s wind
continuously. Electrical energy from wind energy provides a variable and environmental option
and national energy security at a time when decreasing global reserves of fossil energies threatens
the Long-period sustainability of global economy [5].
Fig. 1 provides further details of the global growth of the wind energy sector [6].
Fig.1. World total installed capacity
Researchers believe the fossil fuel will be seldom at the turn of the 21st century, and the oil stores
would not last for few decades, they find it necessary to study and investigate into the use of ever-
lasting or renewable source of energy like wind, the sun and other sources by the time the energy
crisis arrives.
Since there is an infinite cycle of renewable sources such as the wind and the sun all over the
country there is an urgent need to use the mentioned sources of energies. The first step to study
the feasibility of using the wind energy is to analyze the data from past based upon the wind
speed at different elevations. We have studied the feasibility of using the wind in Amirabad
Seaport in Mazandaran province by analyzing the speed of the wind and its potential in past 5
years [6, 7].
2. Wind energy in Amirabad Seaport
Wind speed data are summarized in a number of ways in the literature, including averages and
variances, frequency histograms, and theoretical frequency distributions fitted to the data.
Weibull distribution is generally considered for representing wind speed variations. The potential
of wind energy of a site depends both on wind speeds and the proportion of time for which these
speed points are available.
In addition, the air density is the height of the turbine tower. All of these concepts are considered
in the following sections.
International Journal on Cybernetics & Informatics ( IJCI) Vol.2, No.6, December 2013
3
2.1. Wind speed characterization
The wind speed data used in this research were measured from the stations at a standard height of
10 m. The wind speed at any height can be calculated by equation (1) [1].
)ln(
)ln()(
0
0
hh
hh
V
hV
rr
(1)
V (h) = the wind speed at the required or extrapolated height h
Vr = the reference wind speed at reference height hr
h0 = the surface roughness length, which characterizes the roughness of the terrain.
In this research, h0 was calculated from Eq. (1) using the measured speeds at 10 m height.
Equation (1) was then used to estimate wind speeds at 50 m and 70 m height, since commercial
wind turbines generally have a hub height of 50 m or more.
The percentage frequency histogram of wind speed for the year is shown in Fig. 2. It can be noted
that, the cut-in speed is 3 m/s for in site because the wind speed for 70% of the time in the year is
rather 3 m/s. Therefore, the wind turbine selected would the cut-in speed is 3 m/s. The cut-out
wind speed is commonly 20–25 m/s and such speeds are rare at this site. The Weibull probability
density function, which is most commonly used to characterize wind speed distribution,
calculated by
)](exp[))(()( 1
c
V
c
V
c
kVf k (2)
Where V is wind speed, c is a scale factor and k is a shape factor. To estimate Weibull parameters
from speed data using the maximum likelihood method the following equations are used:
11
1
1)
)ln()ln(
(k
N
V
V
VVN
jj
N
j
kj
N
jj
kj
(3)
kN
j
kjV
1
1)
N
1(c
(4)
Where, Vj is the wind speed in time step j and N is the number of nonzero wind speed data points.

International Journal on Cybernetics & Informatics ( IJCI) Vol.2, No.6, December 2013
4
Fig.2. Frequency distribution of wind speed at Amirabad Seaport over the year
Eq. (3) must be solved using an iterative procedure (k=2 is a suitable initial guess), and then Eq.
(4) can be solved for c. Care must be taken to apply Equation (3) only to the nonzero data points
of speed
0 5 10 15 20 250
5
10
15
20
25
30
Fre
qu
en
cy (
%)
Probability Distribution Function
10m WindSpeed (m/s)
Actual data Best-f it Weibull distribution (k=1.23, c=3.21 m/s)
International Journal on Cybernetics & Informatics ( IJCI) Vol.2, No.6, December 2013
5
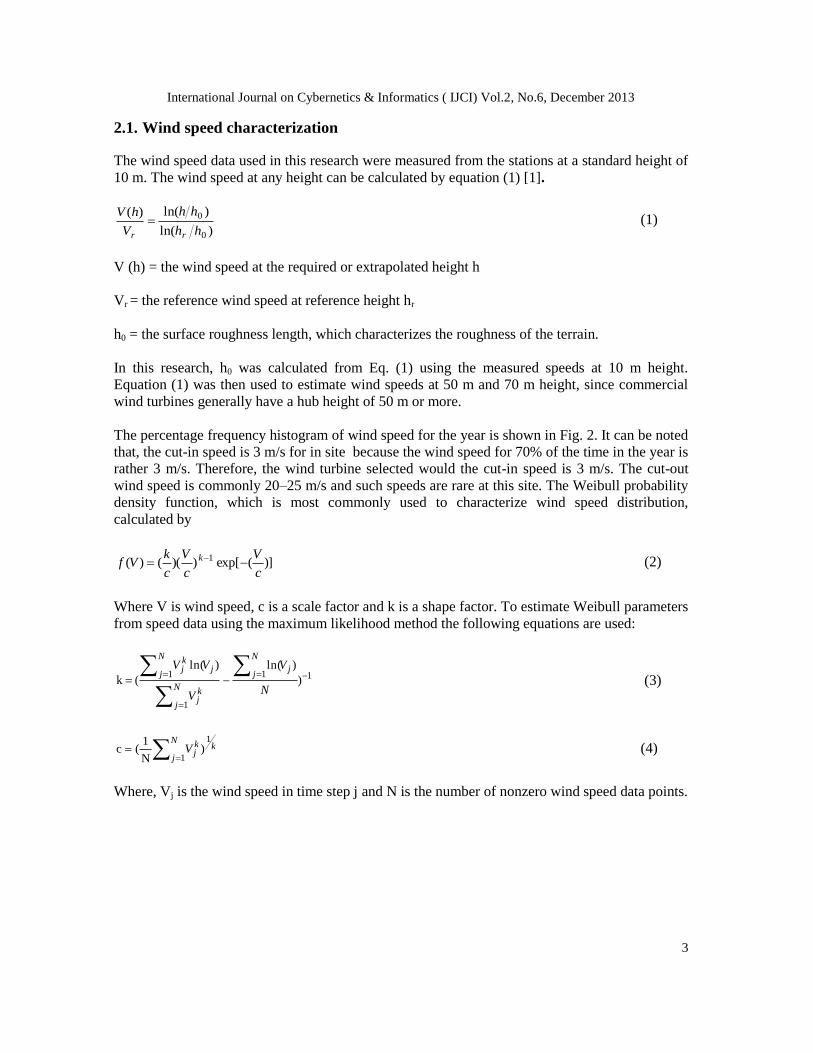
Fig.3. Weibull distributions of wind speeds for different heights at Amirabad Seaport over the year
The Weibull distributions of wind speeds at some heights superposed on the frequency
distributions is shown in Fig. 3. The annual average and standard deviation of wind speed, the
Weibull parameters, and the average available wind power density (defined below) at different
heights are given in Table1. Table 2 and Table3 shown separate characterization for each month
was also carried out.
0 5 10 15 20 250
5
10
15
20
25
30
Fre
qu
en
cy (
%)
Probability Distribution Function
50m Wind Speed (m/s)
Actual data Best-f it Weibull distribution (k=1.23, c=4.02 m/s)
0 5 10 15 20 250
5
10
15
20
25
30
Fre
qu
en
cy (
%)
Probability Distribution Function
70m Wind Speed (m/s)
Actual data Best-f it Weibull distribution (k=1.22, c=4.20 m/s)

International Journal on Cybernetics & Informatics ( IJCI) Vol.2, No.6, December 2013
6
Table1. Wind speed parameters at Amirabad Seaport for the year.
Wind
speed
(m/s)
Std. Dev
(m/s)
Weibull c
(m/s)
Weibull k Mean
(W/m²)
10m
Height
2.86 2.4169 3.2133 1.238 50.013
50m
Height
3.58 3.0275 4.0214 1.234 98.322
70m
Height
3.75 3.1737 4.1956 1.220 113.24
The monthly average of wind speeds and power densities are shown in Figs. 4 and 5,
respectively. The figures show a large seasonal variation. Wind speeds are higher in the summer
season (Jun– Jul) but generally aren't suitable for good power production because, fig. 6 shown
the average wind power densities at 50 m height for 6 years is minor 200 W/m2 put in class 1
(least energy).
Table2. Wind speed and wind power density at Amirabad Seaport by month

International Journal on Cybernetics & Informatics ( IJCI) Vol.2, No.6, December 2013
7
Table3. Wind speed characterization at Amirabad Seaport by month
Fig.4. Monthly average wind speeds at 10 m, 50 m and 70 m heights at AMIRABAD

International Journal on Cybernetics & Informatics ( IJCI) Vol.2, No.6, December 2013
8
Fig.5. Monthly average power density at 10 m, 50 m and 70 m at AMIRABAD
Fig.6. Annual average wind power density at AMIRABAD Seaport for six years
2.2. Estimation of wind power
The wind speed distribution is ultimately used to estimate the wind energy output. The power P in
the wind has the cubic relation with the wind speed V. The wind power density E can be
described with a wind speed probability density (or distribution) function f (V).
3
3
1)( AVVP (5)
International Journal on Cybernetics & Informatics ( IJCI) Vol.2, No.6, December 2013
9
0
33 )3
(2
1)(
2
1
k
kTcdVVfV
A
PE (6)
Where is air density and A is the wind turbine blade sweep area.
Hence, the wind power density distribution can be expressed as follows [7],
)(2
1)( 3 VfVVe (7)
The wind power density can thus be obtained by integrating the power density distribution in the
range from the minimum to the maximum wind speed.
The average power density available over the whole year is found to be 98.32 W/m2 at 50 m
height for AMIRABAD Seaport. Total available yearly energy density is 862 KWh/m2 of rotor
area in AMIRABAD Seaport. The actual power of commercial turbine is expected to produce at
this site depends on rotor area, hub height, and the efficiency or capacity factor of the turbine.
3. Results and discussion
The USA wind energy atlas defines seven wind power classes to categorize the wind energy
resource at a site. The 3.58 m/s annual average wind speed and 98.32 W/m2 average power
densities at 50 m height put Amirabad Seaport in class 1. Since, the wind speeds dispersal is
major, between 2 than 3 m/s in Amirabad site, impossible utilize high power wind turbines that
cut-in speed is further 5 m/s. therefore is suitable, the low power wind turbines use in site [1].
Commercial wind turbines are designed for high wind sites and do not perform as well in low
winds. Turbines designed to take advantage of local wind regimes will capture more energy, thus
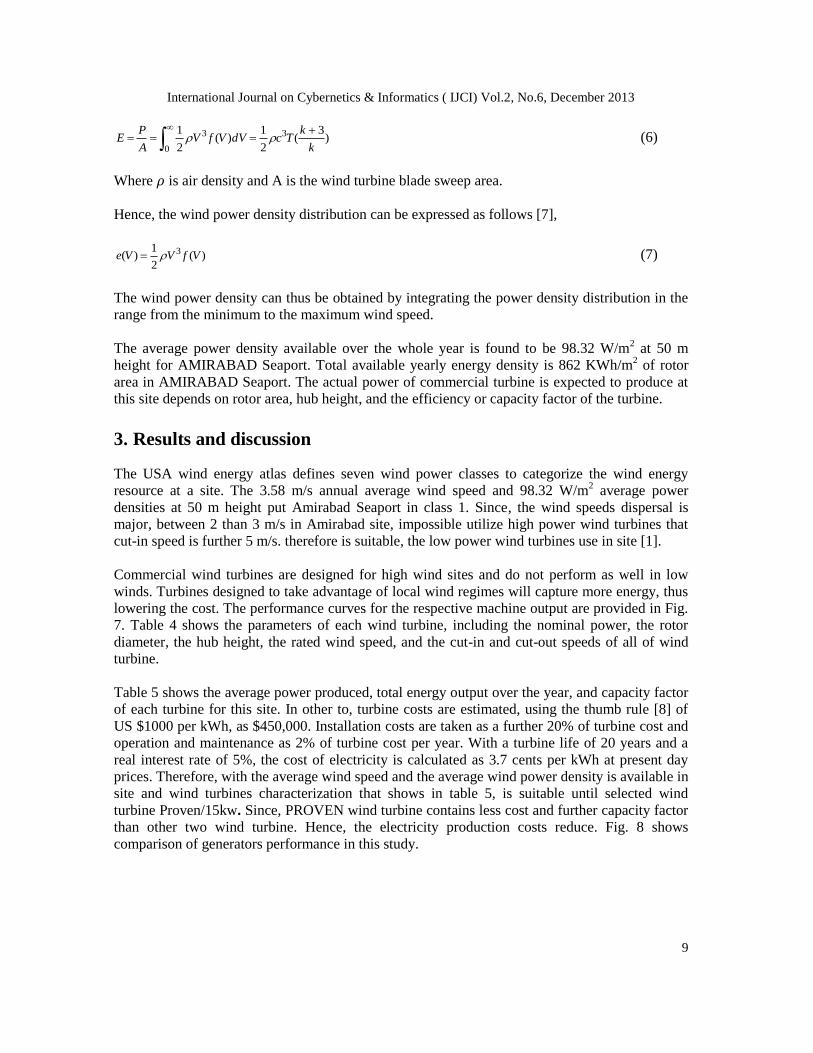
lowering the cost. The performance curves for the respective machine output are provided in Fig.
7. Table 4 shows the parameters of each wind turbine, including the nominal power, the rotor
diameter, the hub height, the rated wind speed, and the cut-in and cut-out speeds of all of wind
turbine.
Table 5 shows the average power produced, total energy output over the year, and capacity factor
of each turbine for this site. In other to, turbine costs are estimated, using the thumb rule [8] of
US $1000 per kWh, as $450,000. Installation costs are taken as a further 20% of turbine cost and
operation and maintenance as 2% of turbine cost per year. With a turbine life of 20 years and a
real interest rate of 5%, the cost of electricity is calculated as 3.7 cents per kWh at present day
prices. Therefore, with the average wind speed and the average wind power density is available in
site and wind turbines characterization that shows in table 5, is suitable until selected wind
turbine Proven/15kw. Since, PROVEN wind turbine contains less cost and further capacity factor
than other two wind turbine. Hence, the electricity production costs reduce. Fig. 8 shows
comparison of generators performance in this study.
International Journal on Cybernetics & Informatics ( IJCI) Vol.2, No.6, December 2013
10
Fig.7. Performance curves for the three wind turbines considered in this study.
0 5 10 15 20 250
5
10
15
20
Po
we
r O
utp
ut
(kW
)
Power Curve Comparison
Wind Speed (m/s)
Prov en15 kW
0 5 10 15 20 25 300
100
200
300
400
500
600
700
Po
we
r O
utp
ut
(kW
)
Wind Speed (m/s)
Suzlon S.52
0 5 10 15 20 250
200
400
600
800
1,000
1,200
1,400
Po
we
r O
utp
ut
(kW
)
Wind Speed (m/s)
Suzlon S.66

International Journal on Cybernetics & Informatics ( IJCI) Vol.2, No.6, December 2013
11
Fig.8. Inter-comparison of machine performance for AMIRABAD, March 2005–March 201
Table4. Parameters of selected wind turbines
Turbine model SUZLON s66 SUZLONs52 PROVEN
15kw
Rated power (kW) 1250 600 15
Rotor diameter (m) 66 52 9
Hub height (m) 74.5 75 15
Cut-in wind speed (m/s) 3 4 2.5
Rated wind speed (m/s) 14 13 9
Cut-out wind speed (m/s) 23 26 21
2005 2006 2007 2008 2009 2010M M J S N J M M J S N J M M J S N J M M J S N J M M J S N J M
50
100
150
200
250
300
350
Po
wer
Ou
tpu
t (k
W)
Suzlon S.66

International Journal on Cybernetics & Informatics ( IJCI) Vol.2, No.6, December 2013
12
Table5. Expected yearly power production by selected turbines
Turbine
SUZLON
s66
SUZLON
s52
PROVEN
15kw
Mean power Output
(kw)
115 61.3 4.3
Mean Energy Output
(Mwh/yr)
1007 537 38
Capacity factor 0.09 0.10 0.28
4. Conclusions
Wind energy is an attractive choice because of its low impact on environment, sustainability,
and reasonable costs. Statistical detail study of wind speed at 10 m, 50 m and 70 m heights for
AMIRABAD in Iran is presented. There are important justifications to be found for advancement
different sources of renewable energy in MAZANDARAN such as wind, and solar. This paper
used wind speed data over a Period 5 years, to assess the wind power potential at this site.
An evaluation of the wind resource available at AMIRABAD Seaport on the coast shows that
AMIRABAD Seaport have annual average wind speed of less than 4 m/s which is considered as
undesirable for installation of the wind turbines. The annual wind speeds at different heights have
been studied to make optimum selection of wind turbine installation among three commercial
turbines.
Using wind turbine technology can be a suitable choice compared to other sources, but it
should be noted that development of wind turbine in Iran is impressive and in the future many
suitable areas would become the site for the small or big wind turbine farms.
References
[1] Irfan U,Gamar –uz-Z, Andrew J; An evaluation of wind energy potential at Kati Seaport, Pakistan';
Elsevier 2010
[2] Pantaleo A. Feasibility study of off-shore wind farms: an application to Puglia region. Sol Energy
2005
[3] Mostafaeipour A, Sadeghian A. Development of wind turbine in Iran. Melbourne, Australia: WWEC;
2005.
[4] Dawud Fadai. The feasibility of manufacturing wind turbines in Iran. Renewable Sustainable Energy
Rev 2005.
[5] oselin Herbert GM, et al. A review of wind energy technologies. Renewable and Sustainable Energy
Rev 2006.
[6] World Wind Energy Association (WWEA), "World wind energy report 2010", (April 2011).
[7] www.suna.org.
[8] Emami L. Feasibility study of electricity production in Yazd. Iran: Yazd University; 2008.
[9] Ashraf Chaudhry M, Hayat SA, Raza R. Renewable energy technology in Pakistan: prospects and
challenges. Melbourne, Australia: WWEC; 2005.
[10] Danish Wind Energy Association.Wind Energy Guided Tour.