Metadata Driven Integrated S tatistical D ata M anagement S ystem CSB of Latvia

U.S. Department of Health and Human Services Food and Drug Administration Center for Drug Evaluation and Research Office of Translational Sciences Office of Biostatistics
S T A T I S T I C A L R E V I E W A N D E V A L U A T I O N
CLINICAL STUDIES
NDA/BLA #: NDA 203313/203314
Supplement #: S-2 /S-3
Drug Name: Tresiba;
Ryzodeg 70/30
Indication(s): Glycemic Control in Patients with Diabetes
Applicant: Nova Nordisk
Date(s): Stamp: February 16, 2016
Review due date: November 11, 2016
PDUFA: December 16, 2016
Review Priority: Standard
Biometrics Division: Division of Biostatistics II
Statistical Reviewer: Shuxian Sinks, PhD
Concurring Reviewers: Mark Rothmann, PhD, Team Leader
Thomas Permutt, PhD, Division Director
Medical Division: Division of Metabolism and Endocrinology Products
Clinical Team: Tania Condarco, MD, Clinical Reviewer
Lisa Yanoff, MD, Team Leader
Project Manager: Callie CappelLynch
Keywords: ITT estimand, Missing data, multiple imputation, sensitivity analysis
Reference ID: 4012242

Table of Contents 1 EXECUTIVE SUMMARY.....................................................................................................6
1.1 CONCLUSIONS AND RECOMMENDATIONS ............................................................................6 1.2 BRIEF OVERVIEW OF CLINICAL STUDIES .............................................................................6 1.3 STATISTICAL ISSUES AND FINDINGS ....................................................................................7
2 INTRODUCTION...................................................................................................................8
2.1 CLASS AND INDICATION ......................................................................................................8 2.2 HISTORY OF DRUG DEVELOPMENT......................................................................................8 2.3 DATA SOURCES ...................................................................................................................8
3 STATISTICAL EVALUATION............................................................................................9
3.1 DATA AND ANALYSIS QUALITY ..........................................................................................9 3.2 EVALUATION OF EFFICACY .................................................................................................9
3.2.1 Study Design and Endpoints ........................................................................................9 3.2.2 Statistical Methodologies...........................................................................................11 3.2.3 Patient Disposition, Demographic and Baseline Characteristics .............................13 3.2.4 Results and Conclusions ............................................................................................18
3.3 EVALUATION OF SAFETY...................................................................................................21 3.3.1 Hypoglycemia ............................................................................................................21
4 FINDINGS IN SPECIAL/SUBGROUP POPULATIONS ................................................22
4.1 GENDER, RACE, AGE, AND GEOGRAPHIC REGION .............................................................22
5 SUMMARY AND CONCLUSIONS ...................................................................................24
5.1 CONCLUSIONS AND RECOMMENDATIONS ..........................................................................24 5.2 LABELING RECOMMENDATIONS ........................................................................................25
Reference ID: 4012242
2

LIST OF TABLES
Table 1 List of All Studies included in Analysis .............................................................................6 Table 2 Endpoints of Studies .........................................................................................................10 Table 3 Summary of Patient Disposition –Trial 3816 ...................................................................13 Table 4 Missingness within Trial 3816 .........................................................................................13 Table 5 Summary of Patient Disposition-Trial 3561.....................................................................13 Table 6 Missingness within Trial 3561 .........................................................................................14 Table 7 Demographic for Trial 3816 .............................................................................................14 Table 8 Baseline Characteristics for Trial 3816 ............................................................................15 Table 9 Demographics for Trial 3561 ...........................................................................................15 Table 10 Baseline Characteristics for Trial 3561 ..........................................................................16 Table 11 Primary Analysis Results of HbA1c (%) for Trial 3816 ................................................17 Table 12 Primary Analysis Results of HbA1c (%) for Trial 3561 ................................................18 Table 13 Analysis Results of FPG for Trial 3816 .........................................................................19 Table 14 Analysis Results of FPG for Trial 3561 .........................................................................20 Table 15 Summary of Fisher’s Exact Test Results for Hypoglycemia Incidence .........................20 Table 16 List of Factors and Levels for Subgroup Analyses.........................................................21
Reference ID: 4012242
3

LIST OF FIGURES
Figure 1 Trial Design for Trial 3816 .............................................................................................10 Figure 2 Trial Design for Trial 3561 .............................................................................................10 Figure 3 Summary Results of Sensitivity Analysis for Trial 3816................................................19 Figure 4 Summary Results of Sensitivity Analyses for Trial 3561 ...............................................20 Figure 5 Summary of Analysis Results for Hypoglycemic Events ...............................................22 Figure 6 Subgroup Analysis Results for Trial 3816 ......................................................................23 Figure 7 Subgroup Analysis Results for Trial 3561 ......................................................................24
Reference ID: 4012242
4
1 EXECUTIVE SUMMARY
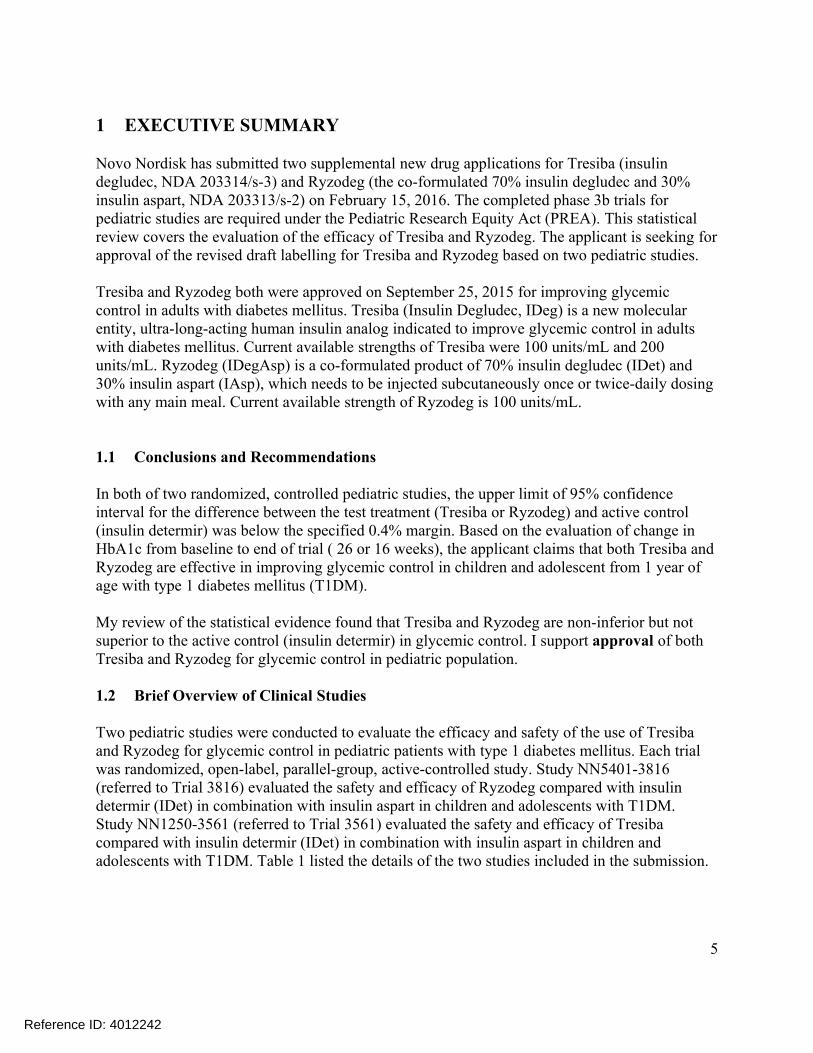
Novo Nordisk has submitted two supplemental new drug applications for Tresiba (insulin degludec, NDA 203314/s-3) and Ryzodeg (the co-formulated 70% insulin degludec and 30% insulin aspart, NDA 203313/s-2) on February 15, 2016. The completed phase 3b trials for pediatric studies are required under the Pediatric Research Equity Act (PREA). This statistical review covers the evaluation of the efficacy of Tresiba and Ryzodeg. The applicant is seeking for approval of the revised draft labelling for Tresiba and Ryzodeg based on two pediatric studies.
Tresiba and Ryzodeg both were approved on September 25, 2015 for improving glycemic control in adults with diabetes mellitus. Tresiba (Insulin Degludec, IDeg) is a new molecular entity, ultra-long-acting human insulin analog indicated to improve glycemic control in adults with diabetes mellitus. Current available strengths of Tresiba were 100 units/mL and 200 units/mL. Ryzodeg (IDegAsp) is a co-formulated product of 70% insulin degludec (IDet) and 30% insulin aspart (IAsp), which needs to be injected subcutaneously once or twice-daily dosing with any main meal. Current available strength of Ryzodeg is 100 units/mL.
1.1 Conclusions and Recommendations
In both of two randomized, controlled pediatric studies, the upper limit of 95% confidence interval for the difference between the test treatment (Tresiba or Ryzodeg) and active control (insulin determir) was below the specified 0.4% margin. Based on the evaluation of change in HbA1c from baseline to end of trial ( 26 or 16 weeks), the applicant claims that both Tresiba and Ryzodeg are effective in improving glycemic control in children and adolescent from 1 year of age with type 1 diabetes mellitus (T1DM).
My review of the statistical evidence found that Tresiba and Ryzodeg are non-inferior but not superior to the active control (insulin determir) in glycemic control. I support approval of both Tresiba and Ryzodeg for glycemic control in pediatric population.
1.2 Brief Overview of Clinical Studies
Two pediatric studies were conducted to evaluate the efficacy and safety of the use of Tresiba and Ryzodeg for glycemic control in pediatric patients with type 1 diabetes mellitus. Each trial was randomized, open-label, parallel-group, active-controlled study. Study NN5401-3816 (referred to Trial 3816) evaluated the safety and efficacy of Ryzodeg compared with insulin determir (IDet) in combination with insulin aspart in children and adolescents with T1DM. Study NN1250-3561 (referred to Trial 3561) evaluated the safety and efficacy of Tresiba compared with insulin determir (IDet) in combination with insulin aspart in children and adolescents with T1DM. Table 1 listed the details of the two studies included in the submission.
Reference ID: 4012242
5

Table 1 List of All Studies included in Analysis Study
Number Phase and
Design Treatment
Period Follow-up
Period # of Subjects per
Arm Study
Population
NN12503561
Multinational, multicenter,
open-labelled, randomized
(1:1), parallel, phase 3b study
26 weeks
A 26-weeks extension
investigating long-term safety
and immunogenicity
Insulin degludec (IDeg OD) +IAsp :
174 subjects
Insulin detemir (IDet)+Iasp: 176 subjects
Children and adolescents with T1DM
from 1 to less than 18 years
old
NN54013816
Multinational, multicenter, open-label,
parallel, randomized
16 weeks
7-12 days follow-up
period after the actual date of
the last treatment visit
Insulin detemir (IDet)+Insulin Aspart (IAsp): 180 sunjects
Degludec/insulin Aspart + IAsp:
182 subjets
Children and adolescents with T1DM
from 1 to less than 18 years
of age
1.3 Statistical Issues and Findings
The applicant did not provide justifications for the choice of the non-inferiority margins 0.4% in both studies. An IR was sent to the applicant on 27 September 2016 and requested that the applicant provide justification for the choice of 0.4% margin. Specifically, the justification should be based on the effect of Insulin Aspart on HbA1c from previous clinical trials in the same or similar clinical trial setting as the proposed clinical trial.
In both trials, Non-inferiority of study drug (IDegAsp or IDeg) versus IDet was declared for the primary endpoint, i.e. the upper limit of the 95% confidence interval was all below the specified non-inferiority margin of 0.4%. A non-inferiority margin of 0.4% has been used in other trials comparing insulin that have been part of NDA submissions. In this submission, for the sponsor’s primary analyses, non-inferiority would still be concluded for both studies even if smaller margins were used (0.2% for trial 3816 at week 16, 0.33% for trial 3561 at week 26). Superiority of study drug (IDegAsp or IDeg) over IDet was not confirmed. Similar results were obtained for 26 weeks of the extended period of Trial 3561.
The percentage of missing data ranged from 5% to 6.7% across the studies, and proportions of missingness were slightly different between the treatment arms. As both studies were not designed to continuing collect data from subject discontinued treatment early, “retrieved dropouts” approach for handling missing data was not applicable for this submission.
Reference ID: 4012242
6

2 INTRODUCTION
2.1 Class and Indication
Tresiba (IDeg: insulin degludec) is a long-acting basal insulin analog for subcutaneous injection. IDeg has been approved for the indication of improving glycemic control in adults with diabetes mellitus as a once daily, ultra-long-acting human insulin analog. The product is currently available in strength of 100 units/mL and 200 units/mL.
Ryzodeg (IDegAsp: 70% insulin degludec and 30% insulin aspart) is a soluble co-formulation of the long-acting insulin degludec (Ideg) and the rapid-acting insulin aspart (IAsp). Ryzodeg has been approved for the indication of improving glycemic control in adults with diabetes mellitus. The basal insulin component, Novolog (insulin aspart, IAsp), is approved for the treatment of diabetes mellitus in adults, and children and adolescents from the age of 2 years. Ryzodeg is currently available in strength of 100 units/mL.
2.2 History of Drug Development
The original NDA 203314 (Tresiba) and NDA 203313 (Ryzodeg) submissions were received on 09/29/11. There were 9 phase 3a confirmatory studies for NDA 203313 submission reviewed by Cynthia Liu and 5 phase 3a confirmatory studies for NDA 203314 submission reviewed by Dongmei Liu.
An advisory committee meeting was held on November 8, 2013, to discuss the safety and efficacy of both products, as an increased cardiovascular (CV) risk was observed in most of the clinical trials. The committee recommended that further data should be collected with studies of patients with more advanced cardiovascular disease. All twelve members voted that a cardiovascular outcomes trial should be conducted for insulin degludec. On 8 February 2013, a complete response letter was issued by FDA. In the complete response, the agency required the resubmission must rule out 1.8 risk ratio for MACE events to support the approval of both products. The applicant resubmitted the submission with one CV outcomes trial (DEVOTE) on March 26, 2015. DEVOTE demonstrated that the cardiovascular safety of insulin degludec was within acceptable bounds for marketing approval.
On September 25, 2015, FDA approved Tresiba and Ryzodeg 70/30 to improve glycemic control in adults with diabetes mellitus.
2.3 Data Sources
The data and final study reports were submitted electronically as an eCTD submission. The submission, organized as an .enx file, was archived at the following link: \\CDSESUB1\evsprod\NDA203313\203313.enx The information needed for this review was obtained from Module 1 FDA regional information, Module 2.5 Clinical Overview, Module 2.7 Clinical Summary, and Module 5 Clinical Study Reports.
Reference ID: 4012242
7

3 STATISTICAL EVALUATION
3.1 Data and Analysis Quality
An information request was sent to the sponsor in regards to the subgroup analysis and analysis dataset on April 27, 2016. The analysis dataset documentation was insufficient for the reviewer to conduct the primary and sensitivity analyses. Specifically, descriptions of factor variables (i.e. TOPIC_CD) were coded in abbreviated terms. SAS programs for key efficacy analyses were requested.
The applicant provided the information requested by FDA on May 25, 2016.The datasets were in good organization. Variables in study datasets were consistently named. I was able to reproduce the results on primary and secondary endpoints in the Clinical Study Reports.
3.2 Evaluation of Efficacy
3.2.1 Study Design and Endpoints
Both trials were multicenter, open-label, randomized in 1:1 ratio, 2-arm parallel group, active-controlled, and treat-to-targeted studies. Trial designs for both trials were presented in Figure 1 and Figure 2.
Trial 3816 investigated the efficacy and safety of IDegAsp administrated OD plus mealtime IAsp for the remaining meals in controlling glycaemia with respect to the change from baseline in HbA1c after 16 weeks of treatment among adolescent patients.
Trial 3561 investigated the efficacy and safety of Ideg administered once daily plus mealtime IAsp in controlling glycaemia with respect to the change from baseline in HbA1c after 26 weeks of treatment. A majority of patients (80%) who were randomized in the main trial participated in the 26 weeks extension period.
Reference ID: 4012242
8

Figure 1 Trial Design for Trial 3816
Source: Clinical study report (eCTD, NDA 203313, Section 5.3.5.1)
Figure 2 Trial Design for Trial 3561
Source: Clinical study report (eCTD, NDA 203314, Section 5.3.5.1)
The primary efficacy endpoint in both trials was change from baseline in HbA1c after 16 or 26 weeks of treatment. Table 2 summarized the primary and secondary endpoints included in the studies. As all secondary endpoints were considered supportive endpoints, the review will only focus on analyses of HbA1c (%) and Fasting Plasma Glucose for labelling purpose.
Reference ID: 4012242
9

Table 2 Endpoints of Studies Endpoints Trial 3561 Trial 3816
Primary endpoint Change from baseline in HbA1c (%) after 26 weeks of treatment
Change from baseline in HbA1c (%) after 16 weeks of treatment
Supportive Secondary Endpoints
(not confirmatory endpoints)
HbA1c change from baseline at week 52
FPG change from baseline at 26 weeks
SMPG measurement (8-point profiles)
SMPG measurement obtained throughout the trial for dose adjustment
Within-subject variability as measured by CV% after 26 weeks
Change from baseline in FPG after 16 weeks of treatment
SMPG measurements (4-pionts) SMPG measurement (8-points)
3.2.2 Statistical Methodologies
3.2.2.1 Analysis Populations
All analyses of efficacy endpoints were performed on the defined full analysis set. Full analysis set was defined to include all randomized subjects.
3.2.2.2 Estimand
In this review, treatment difference of treatment group and active comparator was estimated based on an ITT population, including all randomized subjects regardless of adherence to treatment or use rescue therapy.
3.2.2.3 Statistical Hypothesis
Trial 3816 and Trial 3561 were both non-inferiority studies. The non-inferiority margin was set at 0.4% for each study. The hypothesis of interest can be expressed as:
H0: µtreatment – µactive > 0.4% against HA: µtreatment – µactive ≤ 0.4%
The null hypothesis is that the treatment effect of active comparator (IDet) is superior to that of treatment group (IDegAsp or IDeg) in reducing HbA1c. The alternative hypothesis implies that the treatment effect of treatment group (IDegAsp or IDeg) is non-inferior to that of active comparator in reducing HbA1c.
10
Reference ID: 4012242

If non-inferiority achieved, the superiority test of the treatment group (IDegAsp or IDeg) over active comparator (IDet) will be conducted.
3.2.2.4 Approach to Multiplicity
All secondary efficacy endpoints were considered as supportive efficacy data to evaluate the efficacy of treatment group (IDegAsp or IDeg). No type I error adjustment for secondary efficacy endpoints was required.
3.2.2.5 Applicant’s Primary Statistical Analysis
Trial 3816 – Ryzodeg 70/30 (IDegAsp) The applicant used a mixed effect model for repeated measure (MMRM) to assess the efficacy of IDegAsp compared with IDet. The MMRM model included treatment, sex, region, age group and visits as factors and baseline as covariate, and interactions between visits and all factors and covariate. An unstructured covariance matrix was utilized for model fitting.
Trial 3561- Tresiba (IDeg) The applicant used an analysis of variance (ANCOVA) to assess the efficacy of IDeg compared with IDet. The ANCOVA model included treatment, sex, region and age group as fixed factors and baseline HbA1c as covariate. Missing data were imputed using last observation carried forward (LOCF) approach.
3.2.2.6 Method of Handling Missing Data
The applicant utilized multiple imputation approach to study the impact of missing data for both trials. Jump to reference and copy to reference methods were used as sensitivity analyses to study the impact of missing data. The applicant also included the tipping analysis is to study the sensitivity of the study conclusion effected by the missing data.
3.2.2.7 Sensitivity Analyses for the primary efficacy endpoint
Jump to Reference
Patients withdrew from the study drug (IDeg or IDegAsp) group were assumed to be switched to the IDet group. In other words, the post-deviation distribution of study drug is same as that of the IDet group. Patients withdrew from the IDet group were assumed to remain on the assigned treatment throughout the trial. Imputed value for study drug group is penalized by adding the non-inferiority margin whereas imputed value for the IDet group is not panelized.
Reference ID: 4012242
11

Copy to Reference
Subjects withdrew from the study drug (IDeg or IDegAsp) group were assumed to be the same as the subjects in IDet group during the entire trial. In other words, the pre and post deviation distribution of study drug group is the same as that of reference group. Patient withdrew from the IDet group were assumed to remain on their assigned treatment throughout the trial. Imputed value for study drug group is penalized by adding the non-inferiority margin whereas imputed value for the IDet group is not penalized.
Tipping Point Analysis
The applicant performed a tipping point analysis to explore the sensitivity of the conclusion supported by the efficacy data. Copy reference method was utilized to impute the missing data when conducting the tipping point analysis.
FDA analysis approach
A multiple imputation analysis was conducted to analyze the treatment effect of treatment group (IDegAsp or IDet) and active comparator (IDet), where the imputation is under the non-inferiority null and all observed cases of change from baseline at week 16 or 26 were treated as non-missing. Patients with missing data known or believed to have discontinued protocol therapy were assumed to have a washout (“return to baseline”) of any potential treatment effect. More specifically for each imputation of the multiple imputation, for those subject with missing week 16 or 26 measurements for HbA1c
on the control arm impute their week 16 or 26 HbA1c measurement equal to their baseline measurement plus an error and
on the experimental arms impute their week 16 or 26 HbA1c measurement equal to their baseline measurement plus 0.4% plus an error.
The error was normally distributed with a standard deviation set equal to the estimated pooled standard deviation.
The analysis for the treatment difference was based on an ANCOVA model with change from baseline to week 16 or 26 as the dependent variable and covariate/factors of treatment group, geographic region, sex, age group, and baseline HbA1c.
3.2.3 Patient Disposition, Demographic and Baseline Characteristics
Table 3 described the patient disposition for Trial 3816. 362 patients were randomized to the treatment and active control groups with 1:1 ratio. 20 patients were withdrawn from the study after the randomization. A majority of subjects withdrawn from the study were due to withdrew consent. 1 subject in the IDegAsp group withdrew due to adverse event. One subject in the IDegAsp group withdrew due to non-compliance with the protocol. Two subjects in the IDet
Reference ID: 4012242
12

group withdrew due to other reasons. Of 362 subjects, 342 (94.5%) subjects completed the trial and the completion rate was comparable between two treatment groups. The percentage of missing data was 6.7% at week 16. IDet group had larger proportion of missingness compared with IDegAsp group (see Table 4).
Table 3 Summary of Patient Disposition –Trial 3816 IDegAsp IDet Total
Randomized 182 180 362 Exposed 181 179 360 Withdrawn at/after randomization 8 12 20
Adverse Event 1 0 1 Non-compliance with Protocol 1 0 1 Withdrawal Criteria 6 10 16 Other 0 2 2
Completed 174 168 342
Table 4 Missingness within Trial 3816 Visit IDegAsp IDet Total
N % N % Baseline 182 0.0% 180 0.0% 362 8 Weeks 176 3.3% 170 5.6% 346 12 Weeks 174 4.4% 170 5.6% 344 16 Weeks 173 4.9% 165 8.3% 338
Table 5 summarized patient disposition for study 3561. 350 subjects were randomized with 1: 1 ratio to IDeg and IDet groups. 1 subject in IDet group was withdrawn before being exposed to the medication. Of 350 subjects, 335 subjects completed the trial. 4 subjects in IDeg group withdrew due to fulfillment of withdrawal criteria (i.e. subject consent). 2 subjects in IDet group withdrew due to adverse event, and 7 subjects withdrew due to fulfillment of withdrawal criteria, and 2 subjects withdrew due to other reasons. The percentage of missing data at week 26 was about 5%. IDet group had relatively larger proportion of missingness compared with IDeg group (see Table 6).
Table 5 Summary of Patient Disposition-Trial 3561 IDeg IDet Total
Randomized 174 176 350 Exposed 174 175 349 Withdrawn at/after randomization
Adverse Event 0 2 2 Withdrawal Criteria 4 7 11 Other 0 2 2
Completed 170 165 335
Reference ID: 4012242
13


IDegAsp IDet Total
Black 8 ( 4.4% ) 4 ( 2.22% ) 12 (3.3%)
Other 5 ( 2.7% ) 7 ( 3.89% ) 12 (3.3%)
Asian Indian - 1 ( 0.56% ) 1(0.3%)
Table 8 Baseline Characteristics for Trial 3816 IDegAsp IDet Total
BMI
Mean (SD) 19 ( 4.2 ) 20 ( 4.0 ) 19.4 (4.1)
Median (IQR) 18 ( 16, 22 ) 19 ( 16, 22 ) 18.5 (16.2, 21.9)
HbA1c (%)
Mean (SD) 8.1 (1.2) 8.1 (1.2) 8.1 (1.2)
Median (IQR) 8.0 (7.3, 9.0) 8.0 (7.3, 8.9) 8.0 (7.3, 9.0)
FPG (mg/dL)
Mean (SD) 155.6 (80.2) 146.5 (74.9) 151.1 (77.6)
Median (IQR) 139 (94,198) 130 (90, 193) 133 (92, 196)
Table 9 presented the demographics for trial 3561. Among subjects 55.4% were male, and more male patients were enrolled than female patients across both treatment arms. The majority of the subjects (97.1%) were non-Hispanic. The average age of the trial population was 10 years old. Over 50% of the subjects were enrolled from Europe, and 28.9% of the subjects were enrolled from North America. Among subjects 74.6 % were white. Baseline characteristics were summarized in Table 10. Across the treatment groups, differences in baseline FPG were observed.
Table 9 Demographics for Trial 3561 IDeg OD IDet Total
Sex
Female 78 ( 44.8% ) 78 ( 44.3% ) 156 (44.6%)
Male 96 ( 55.2% ) 98 ( 55.7% ) 194 (55.4%)
Ethnicity
Not Hispanic 167 ( 96.0% ) 173 ( 98.3% ) 340 (97.1%)
Hispanic 7 ( 4.02% ) 3 ( 1.70% ) 10 (2.9%)
15
Reference ID: 4012242
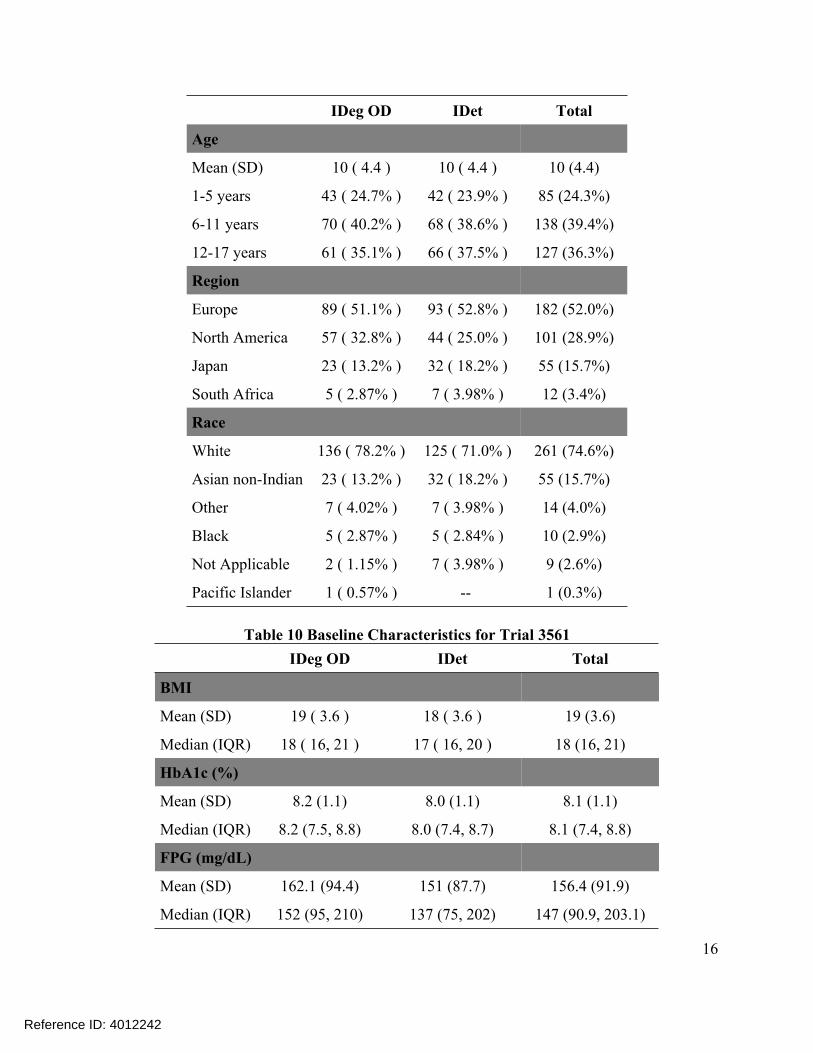
IDeg OD IDet Total
Age
Mean (SD) 10 ( 4.4 ) 10 ( 4.4 ) 10 (4.4)
1-5 years 43 ( 24.7% ) 42 ( 23.9% ) 85 (24.3%)
6-11 years 70 ( 40.2% ) 68 ( 38.6% ) 138 (39.4%)
12-17 years 61 ( 35.1% ) 66 ( 37.5% ) 127 (36.3%)
Region
Europe 89 ( 51.1% ) 93 ( 52.8% ) 182 (52.0%)
North America 57 ( 32.8% ) 44 ( 25.0% ) 101 (28.9%)
Japan 23 ( 13.2% ) 32 ( 18.2% ) 55 (15.7%)
South Africa 5 ( 2.87% ) 7 ( 3.98% ) 12 (3.4%)
Race
White 136 ( 78.2% ) 125 ( 71.0% ) 261 (74.6%)
Asian non-Indian 23 ( 13.2% ) 32 ( 18.2% ) 55 (15.7%)
Other 7 ( 4.02% ) 7 ( 3.98% ) 14 (4.0%)
Black 5 ( 2.87% ) 5 ( 2.84% ) 10 (2.9%)
Not Applicable 2 ( 1.15% ) 7 ( 3.98% ) 9 (2.6%)
Pacific Islander 1 ( 0.57% ) - 1 (0.3%)
Table 10 Baseline Characteristics for Trial 3561 IDeg OD IDet Total
BMI
Mean (SD) 19 ( 3.6 ) 18 ( 3.6 ) 19 (3.6)
Median (IQR) 18 ( 16, 21 ) 17 ( 16, 20 ) 18 (16, 21)
HbA1c (%)
Mean (SD) 8.2 (1.1) 8.0 (1.1) 8.1 (1.1)
Median (IQR) 8.2 (7.5, 8.8) 8.0 (7.4, 8.7) 8.1 (7.4, 8.8)
FPG (mg/dL)
Mean (SD) 162.1 (94.4) 151 (87.7) 156.4 (91.9)
Median (IQR) 152 (95, 210) 137 (75, 202) 147 (90.9, 203.1)
16
Reference ID: 4012242

3.2.4 Results and Conclusions
3.2.4.1 Primary Endpoint – HbA1c (%) Primary analysis results for trial 3816 were given in Table 11. The non-inferiority of IDegAsp versus comparator was established in either FDA’s analysis or applicant’s analysis, as the upper limit of the 95% CIs was below the prespecified non-inferiority margin 0.4%. The estimates of treatment difference were slightly different in both analyses. The estimated treatment difference in HbA1c (%) was -0.04 according to applicant’s analysis results, while FDA’s estimated treatment difference in HbA1c (%) was -0.02. The confidence interval using FDA’s approach was wider than the result using applicant’s approach, which resulted from the uncertainty of missing data under MNAR.
Primary analysis results for trial 3561 were summarized in Table 12. The non-inferiority of IDeg versus comparator was confirmed according to FDA and applicant’s approaches. The upper limit of the 95% CIs on treatment difference was below the prespecified non-inferiority margin 0.4%. However, the superiority of Ideg over comparator was not established, as 95% CIs covered zero. FDA’s approach yielded results that were similar to those obtained with applicant’s approach. The estimated treatment difference was 0.15 [95% CIs: (-0.03, 0.32)]. Similar efficacy results were maintained after 52 weeks of treatment.
Sensitivity analyses results for each trial are presented in Figure 3 and Figure 4. The conclusion of non-inferiority is supported by all sensitivity analyses in each trial.
Table 11 Primary Analysis Results of HbA1c (%) for Trial 3816 FDA's Analysis Applicant's Analysis
RYZODEG Insulin 70/30 +Insulin Detemir+
aspart Insulin aspart
RYZODEG Insulin 70/30 +Insulin Detemir+
aspart Insulin aspart HbA1c (%) Adjust mean change from baseline at week 16
Estimated treatment difference (95% CI) RYZODEG 70/30 vs Insulin Detemir at week 16
-0.24 -0.22
-0.02 (-0.22, 0.17)
-0.27 -0.23
-0.04 (-0.23, 0.15)
Reference ID: 4012242
17

Figure 3 Summary Results of Sensitivity Analysis for Trial 3816
Table 12 Primary Analysis Results of HbA1c (%) for Trial 3561 FDA's Analysis Applicant's Analysis
Tresiba Insulin +Insulin Detemir+ aspart Insulin aspart
Insulin Tresiba+Insuli Detemir+
n aspart Insulin aspart HbA1c (%)- 26 weeks Adjust mean change from baseline at Week 26
Estimated treatment difference (95% CI) Tresiba vs Insulin Detemir at week 26
-0.16 -0.31
0.15 (-0.03, 0.33)
-0.15 -0.30
0.15 (-0.03, 0.32)
Extension Period (supportive analysis)
HbA1c(%) -52 weeks Adjust mean change from baseline -0.20 -0.19 -0.28 -0.20at Week 52
Estimated treatment difference -0.01 (-0.20,0.19) -0.08 (-0.32, 0.15) (95% CI) Tresiba vs Insulin Detemir at week 52
Reference ID: 4012242
18

Figure 4 Summary Results of Sensitivity Analyses for Trial 3561
3.2.4.2 Secondary Endpoint – Fasting Plasma Glucose (FPG)
Table 13 presented the analysis results of FPG for trial 3816. The estimated mean change from baseline in FPG was -0.7 for IDegAsp group. The estimated mean reduction from baseline in FPG was -6.4 for the comparator group. The confidence interval of difference between IDegAsp and IDet in FPG ranged from -12.7 to 24.
Table 14 summarized the analysis results of FPG for trial 3561. The estimated mean change from baseline in FPG was -3.9 for IDeg group. The estimated mean change from baseline in FPG was 1.3 for IDet group. The confidence interval of difference between IDeg and IDet was from -28.6 to 18.2.
Table 13 Analysis Results of FPG for Trial 3816
RYZODEG 70/30 Insulin Detemir+ +Insulin aspart Insulin aspart
FPG (mg/DL)
Adjust mean change from baseline (SD) at week 16 -0.7 (6.41) -6.4 (6.70)
Estimated treatment difference (95% CI) RYZODEG 70/30 vs Insulin Detemir 5.6 (-12.7, 24.0)
The change from baseline in FPG at week 16 was analyzed using an MMRM model with treatment, sex, and region, age group, visit, interaction between visit and treatment as fixed effects and baseline response as a covariate.
Reference ID: 4012242
19

Table 14 Analysis Results of FPG for Trial 3561
Tresiba +Insulin Insulin Detemir+ aspart Insulin aspart
FPG (mg/DL)
Adjust mean change from baseline (SD) at week 26 -3.9 (8.28) 1.3 (8.46)
Estimated treatment difference (95% CI) -5.2 (-28.6, 18.2) RYZODEG 70/30 vs Insulin Detemir
APPEARS THIS WAY
ON ORIGINAL
The change from baseline in FPG at week 16 was analyzed using an MMRM model with treatment, sex, and region, age group, visit, interaction between visit and treatment as fixed effects and baseline response as a covariate.
3.3 Evaluation of Safety
This section reported the analysis results of hypoglycemic events for safety purposes. I acknowledge that reporting of hypoglycemia is observer-dependent and bias may be introduced in open-label trials. In addition, the two pediatric studies were not powered to test hypoglycemic events and also have multiplicity issues, the analyses results of hypoglycemic events would be considered as supportive.
3.3.1 Hypoglycemia Table 15 summarized results for testing the association of hypoglycemia incidence and treatment groups, where the incidence rate was defined as percent of patients with at least 1 hypoglycemic episode. Error! Reference source not found. presented the analysis results for hypoglycemic events. The analyses were post-hoc and were not adjusted for multiplicity. No consistent pattern was found within each trial difference to show a higher rate of hypoglycemia in experimental arm (IDegAsp or IDeg) compared to IDet group.
Table 15 Summary of Fisher’s Exact Test Results for Hypoglycemia Incidence Hypoglycemia
Trial 3816
IDegAsp or IDeg
N (%)
IDet N(%)
P-value
182 180 Confirmed Severe Documented Sympt.
168 (92%) 11(6%)
167 (92%)
164 (91%) 3 (2%)
160 (89%)
0.70 0.05 0.38
Trial 3561 174 176
Confirmed 169 (97%) 161 (91%) 0.04* Severe 24 (14%) 17 (10%) 0.25 Documented Sympt. 12 (7%) 9 (5%) 0.57
20
Reference ID: 4012242

Figure 5 Summary of Analysis Results for Hypoglycemic Events
Note: Negative binomial model was used for analyzing hypoglycemic events. The model included treatment, age group, region and sex.
4 FINDINGS IN SPECIAL/SUBGROUP POPULATIONS 4.1 Gender, Race, Age, and Geographic Region
This section included the analysis results of the primary endpoint performed within subgroup levels for the study. Due to the limitations associated with multiplicity and low power, we acknowledge that the subgroup analysis results were considered as supportive and exploratory. Table 16 summarized the subgroup factors and levels for subgroup analyses. All subgroup analyses on primary endpoints were performed using an ANCOVA model in the ITT population with treatment, baseline HbA1c, region, sex, age group and interaction of subgroup variable and treatment.
Table 16 List of Factors and Levels for Subgroup Analyses Factor Levels Region North America; Latin America; Europe; Asia; Other Age 1-5 years; 6-11 years; 12-17 years Race White; Black; Asian; Other Sex Female; Male
Figure 6 and Figure 7 presented the subgroup analysis results for trial 3816 and trial 3561. No significant interaction between defined subgroups and treatment were observed. In general, the subgroup analysis results were consistent with the results of overall population.
Reference ID: 4012242
21

Figure 6 Subgroup Analysis Results for Trial 3816
22
Reference ID: 4012242

Figure 7 Subgroup Analysis Results for Trial 3561
5 SUMMARY AND CONCLUSIONS
5.1 Conclusions and Recommendations
Data from two pediatric studies have demonstrated that once-daily injection of Tresiba or Ryzodeg 70/30 is effective for glycemic control among children and adolescent with T1DM. Non-inferiority of study drug (IDeg or IDegAsp) versus comparator (IDet) was confirmed for the primary endpoint in two trials, the upper limit of the 95% confidence intervals were all below the specified non-inferiority margin of 0.4%. The mean reduction in HbA1c at endpoint was generally smaller compared with adults with T1DM. There is no strong evidence to indicate a higher rate of hypoglycemia in experimental arm (IDeg or IDegAsp) compared to the comparator (IDet).
The review on efficacy supports the claim of using IDeg or IDegAsp for improving glycemic control in pediatric patients with T1DM.
23
Reference ID: 4012242

5.2 Labeling Recommendations
The applicant used MMRM model to estimate the effect on week 26 HbA1c change for IDeg trial. The MMRM analysis likely does not appropriately address missing data as it treats the behavior of missing data for patients who are off-treatment to be the same as that of observed data for patients who are on-treatment in the same treatment arm. The applicant used ANCOVA with LOCF to estimate the effect on week 16 HbA1c change for IDegAsp trial. The LOCF method for dealing with data missing is no longer recommended by the Division.
My recommendation for the labelling is that the most appropriate estimate of the treatment difference should be provided when addressing missing data. As there was a lack of retrieved dropouts, I would recommend conducting a multiple imputation analysis which “wash out” any potential treatment effect for those subjects who have missing data at week 26 or 16. Specifically, as this is an active-controlled trial, missing data at week 26 or 16 was imputed based on a distribution centered at baseline HbA1c value, and with a subject-level prediction standard deviation equal to that from an ANCOVA model performed on observed cases at week 26 or 16.
Reference ID: 4012242
24

---------------------------------------------------------------------------------------------------------
---------------------------------------------------------------------------------------------------------
----------------------------------------------------
This is a representation of an electronic record that was signed electronically and this page is the manifestation of the electronic signature.
/s/
SHUXIAN Z SINKS 11/10/2016
MARK D ROTHMANN 11/10/2016 I concur
Reference ID: 4012242