26 26 P I T T M E D P I T T M E D - Pitt Med | University ...
Upload
malcolm-haynesCategory
view
214download
0
S I M U L A T I O N
M A R K E T I N G M G T.
As soon as he said- “Money isn’t Everything” - I knew we were in trouble

S I M U L A T I O N
M A R K E T I N G M G T.
It is important to focus on the means used to achieve the ends … …..not just on the ends themselves…
To only focus on traditional financial accounting measures (such as ROI, ROE, EPS…) …..does not give mgt the whole picture….
S I M U L A T I O N
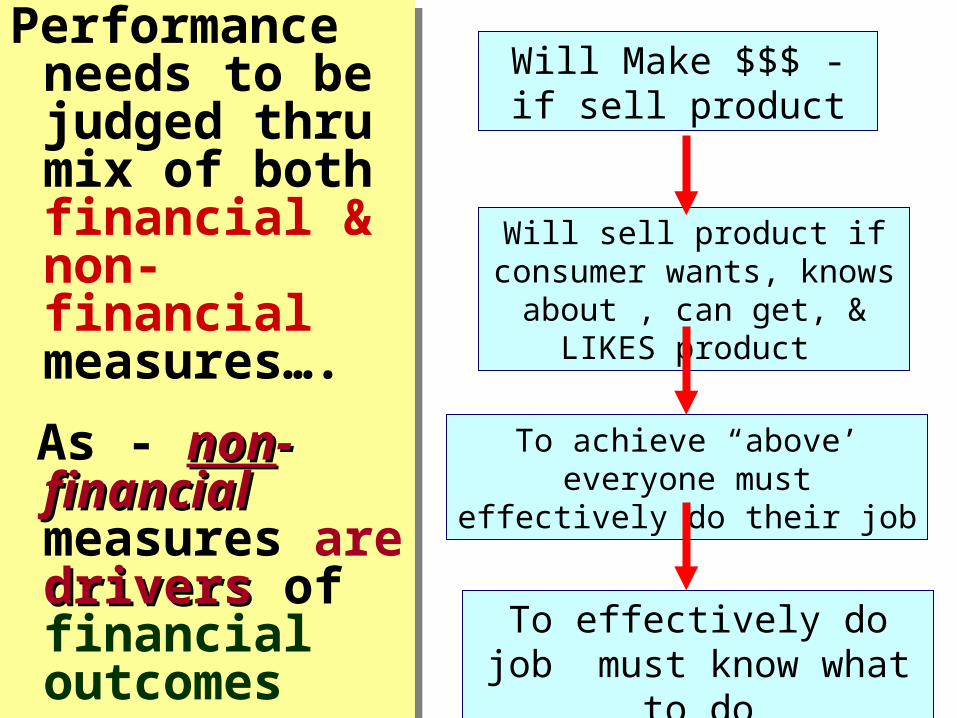
M A R K E T I N G M G T.Performance needs to be judged thru mix of both financial & non-financial measures….
As - nonnon--financialfinancial measures are driversdrivers of financial outcomes
Performance needs to be judged thru mix of both financial & non-financial measures….
As - nonnon--financialfinancial measures are driversdrivers of financial outcomes
Will Make $$$ - if sell product
Will sell product if consumer wants, knows about , can get, & LIKES
product
To achieve “above’ everyone must effectively do their job
To effectively do job must know what to do

Organizations Often Have A Gap Organizations Often Have A Gap Between Strategy and ActionBetween Strategy and Action
Strategy Is a Step In a Continuum
MISSIONWhy we exist
VALUESWhat’s important to us
VISIONWhat we want to be
STRATEGYOur game plan
STRATEGIC OUTCOMES
SatisfiedSHAREHOLDERS
Delighted CUSTOMERS
Efficient and EffectivePROCESSES
Motivated & PreparedWORKFORCE

The Balanced Scorecard Is A The Balanced Scorecard Is A Bridge To Close That GapBridge To Close That Gap
Strategy Is a Step In a Continuum
MISSIONWhy we exist
VALUESWhat’s important to us
VISIONWhat we want to be
STRATEGYOur game plan
BALANCED SCORECARDImplementation & Focus
STRATEGIC INITIATIVESWhat we need to do
STRATEGIC OUTCOMES
SatisfiedSHAREHOLDERS
Delighted CUSTOMERS
Efficient and EffectivePROCESSES
Motivated & PreparedWORKFORCE
PERSONAL OBJECTIVESWhat I need to do

S I M U L A T I O N
M A N A G E M E N T
S I M U L A T I O N
M A N A G E M E N T
Strategic Thinking- the ten big ideas Strategic Thinking- the ten big ideas Strategic Thinking- the ten big ideas Strategic Thinking- the ten big ideas
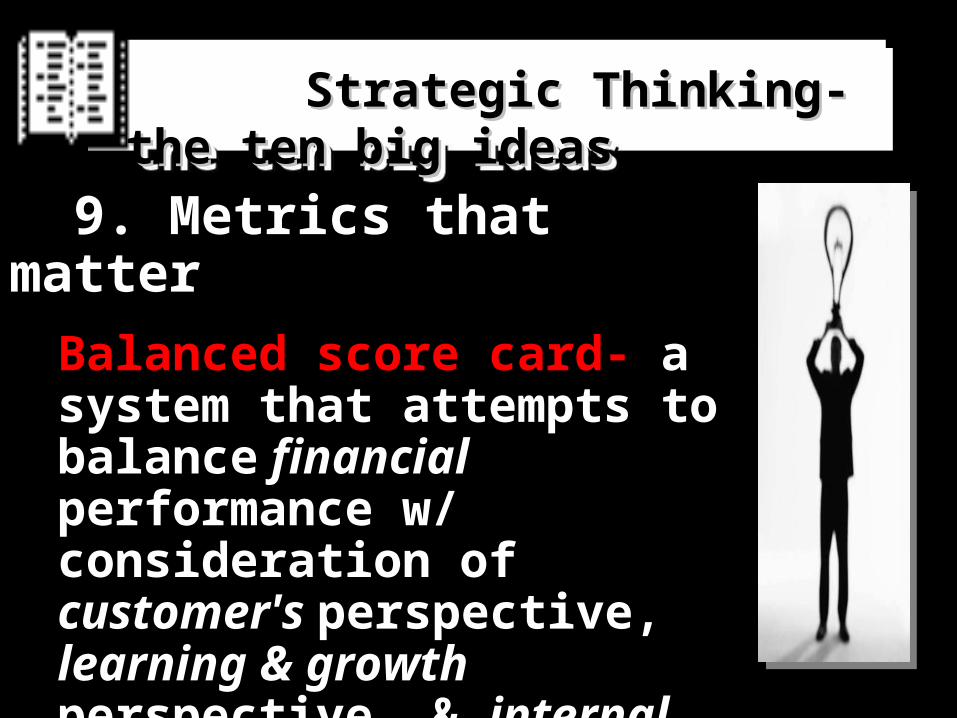
9 9. Metrics that matter
Balanced score card- a system that attempts to balance financial performance w/ consideration of customer's perspective, learning & growth perspective, & internal business process perspective

1992 1996 2000
Balanced Scorecard HistoryBalanced Scorecard History
Measurement and
Reporting
Alignment and Communication
Enterprise-wide Strategic
Management
Articles in Harvard Business Review:
“The Balanced Scorecard — Measures that Drive Performance” January - February 1992
“Putting the Balanced Scorecard to Work” September - October 1993
“Using the Balanced Scorecard asa Strategic Management System” January - February 1996
1996 2000
Acceptance and Acclaim:
“The Balanced Scorecard” is translated into 18 languages
Selected by Harvard Business Review as one of the “most important management practices of the past 75 years.“

9©2002 Balanced Scorecard Collaborative, Inc and Robert S. Kaplan. All rights reserved.
Balanced Scorecard Hall of Fame Implemented Strategies and Achieved Breakthrough Results… Fast
Saatchi & Saatchi
+ $2b
ATT Canada
+ $7b
Chemical Bank
• 99% Merged Target Asset Retention
UPS
Southern Garden Wells Fargo
Cigna
+ $3b
Brown & Root
• #1 in growth & profitability
City of Charlotte Duke Children’s
Mobil
• Last to first• Cash flow +$1.2b• ROI 6% --> 16%
Hilton Hotels
• Least Cost Producer
3 years
• Customer Satisfaction • Market Revenue Index
• Revenues 9%• Net Income
33%
• # Customers450%
• Best Online Bank
• Customer Satisfaction = 70% • Public Official Award
• Customer Satisfaction #1• Cost/Case 33%
3 years
2-5 years 3 years
3-5 years 3 years
3 years 2 years
3 years 3 years
2-5 years
2 years

S I M U L A T I O N
M A N A G E M E N T
What is measured gets noticed
What is noticed gets acted on
What is acted on
gets improved
Today …
~ 70% of Fortune 1,000 companies utilize a Balanced Balanced ScorecardScorecard to help manage performance—
because…..
Today …
~ 70% of Fortune 1,000 companies utilize a Balanced Balanced ScorecardScorecard to help manage performance—
because…..

S I M U L A T I O N
M A N A G E M E N T
Perspectives Encompass all Respective Functional Domains

S I M U L A T I O N
M A N A G E M E N T

S I M U L A T I O N
M A N A G E M E N T
For Each Perspective:
Financial…Objectives Measures Targets Initiatives Responsibility Budget1.2.3.
Customer… Business Processes…Learning & GrowthObjectives Measures Targets Initiatives Responsibility Budget1.2.3.
Financial…Objectives Measures Targets Initiatives Responsibility Budget1.2.3.
Customer… Business Processes…Learning & GrowthObjectives Measures Targets Initiatives Responsibility Budget1.2.3.

S I M U L A T I O N
M A N A G E M E N T
Basic Scorecard Terminology(Southwest Airlines Example)
Objectives
• Fast ground turnaround
Objectives:What the
strategy is trying to achieve
Targets
• 30 Minutes• 90%
TargetsThe level of
performance or rate of
improvement needed
• Cycle time optimization
InitiativesKey action programs
required to achieve targets
InitiativesMeasures
• On Ground Time
• On-Time Departure
MeasuresHow
performance is measured
against objectives
Strategic Theme: Operating Efficiency
Profits and RONAFinancial
Learning
Ground crew alignment
Lowest prices
Fewer planes
Customer
Internal
Fast ground turnaround
Strategy Map
On-time Service
Attract & Retain More Customers
Grow Revenues
S I M U L A T I O N
M A N A G E M E N T
• % Ground crew trained
• % Ground crew stockholders
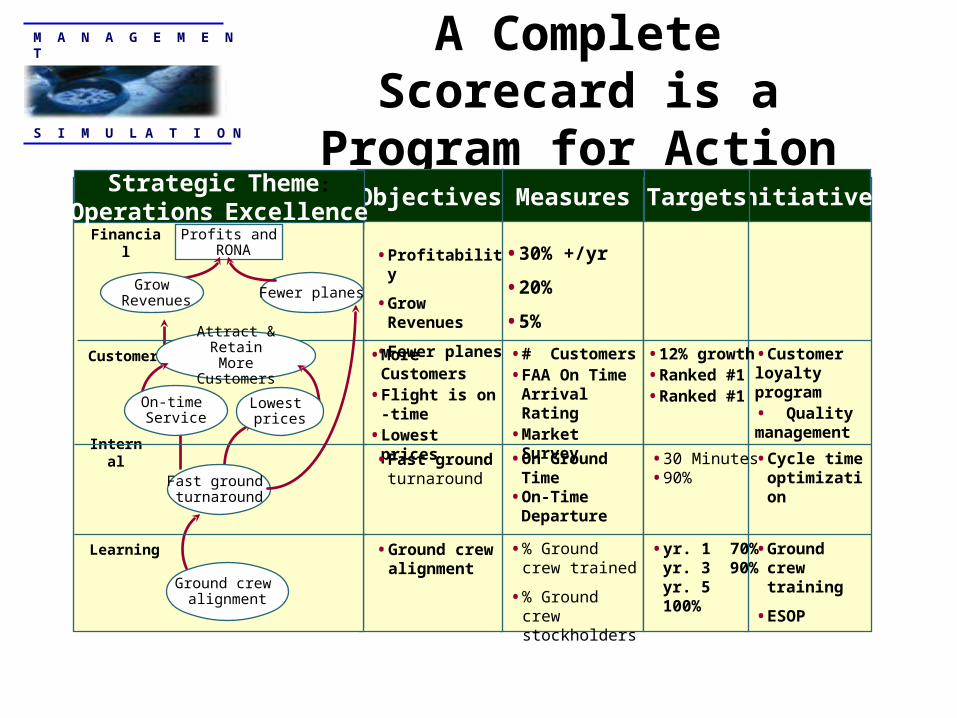
A Complete Scorecard is a Program for Action
Objectives Measures
• # Customers• FAA On Time
Arrival Rating• Market Survey
• On Ground Time
• On-Time Departure
Strategic Theme:Operating Efficiency
Initiatives
• Cycle time optimization
• Ground crew training
• ESOP
•Customer loyalty program• Quality management
Targets
•30% +/yr
•20%
•5% • 12% growth• Ranked #1• Ranked #1
• 30 Minutes• 90%
• yr. 1 70%yr. 3 90%yr. 5 100%
• Profitability
• Grow Revenues
• Fewer planes
• More Customers
• Flight is on -time
• Lowest prices
• Fast ground turnaround
• Ground crew alignment
Strategic Theme:
Operations ExcellenceProfits and
RONAFinancial
Learning
Ground crew alignment
Fewer planes
Customer
Internal
Fast ground turnaround
Attract & Retain More Customers
Grow Revenues
Lowest prices
On-time Service

16©2002 Balanced Scorecard Collaborative, Inc and Robert S. Kaplan. All rights reserved.
The Complete Balanced Scorecard Strategy Map
Improve Shareholder Value
Productivity Strategy Revenue Growth Strategy
Improve Cost Structure
Increase Asset Utilization
Enhance Customer Value
Create Value from New Products &
Services
Human, Information, and Organizational Capital
Shareholder ValueROCE
Cost per Unit Asset Turnover Customer Profitability
New Revenue Sources
Price
Financial Perspective: the drivers of shareholder value
Product/Service Attributes
Strategic Competencies
Strategic Technologies
Climate for Action
(Processes that Produce and Deliver Products
& Services)
(Processes that Enhance Customer
Value)
Operations Theme Customer Management
Theme
Innovation Theme Regulatory and Society Theme
Customer Value Proposition
Quality
Low Total Cost
Customer Solutions
Product Leader
Customer Satisfaction Customer Acquisition Customer Retention
Time Function Service Relations Brand
Relationship Image
� Market and Account Share
Customer Perspective: the differentiating value proposition
Internal Perspective: how value is created and sustained
Learning & Growth Perspective: role for intangible assets – people, systems,
climate and culture
(Processes that Create New
Products and Services)
(Processes that Improve the Environment
and Communities)

17©2002 Balanced Scorecard Collaborative, Inc and Robert S. Kaplan. All rights reserved.
Increase ROE to 12%
Revenue Growth Strategy Productivity Strategy
New Sources of Non-Gasoline Revenue
Increase Customer Profitability Through
Premium Brands
Become Industry Cost Leader
Maximize Use of Existing Assets
ROCENet Margin (vs. industry)
Non-Gasoline Revenue & Margin
Volume vs. Industry Premium Ratio
Cash Expense (cpg) vs. Industry
Cash Flow
Speedy Purchase
Clean Safe Quality Product Trusted Brand
Friendly Helpful Employees
Financial Perspective
Customer Perspective
Help Develop Business
Skills
More Consumer Products
Recognize Loyalty
Share of Targeted Segment
Mystery Shopper Score
Dealer Profit Growth
Dealer Satisfaction
Differentiators
“Delight the Consumer” “Win-Win Dealer Relations”
Basic
Create Non-Gasoline
Products & Services
“Build the Franchise” “Increase Customer Value” “Achieve Operational Excellence” “Be a Good Neighbor”
Improve Environmental,
Health and Safety
Understand Consumer
Segments
Best-In-Class Franchise
Teams
Improve Hardware
Performance
Improve Inventory
Management
On-SpecOn-Time
Industry Cost Leader
New Product Acceptance Rate Environment
Incidents Safety Incidents Dealer Quality
Rating
Yield Gap Unplanned
Downtime
Inventory Levels
Run-Out Rate
Activity Cost vs. Competition
Internal Perspective
A Motivated and Prepared Workforce
• Aligned• Personal Growth
Climate for Action
• Functional Excellence• Leadership Skills• Integrated View
Competencies
• Process Improvement
Technology
Personal BSC Employee Feedback
Strategic Skill Coverage Ratio
Systems Milestones
Learning & Growth Perspective
Mobil NAM&R Strategy Map

S I M U L A T I O N
M A N A G E M E N TCapstone's Balanced
Scorecard
Capstone's Balanced
Scorecard

S I M U L A T I O N
M A N A G E M E N T

S I M U L A T I O N
M A N A G E M E N T

S I M U L A T I O N
M A N A G E M E N T

Additional – AFTER-the-FACT Tools for Managing & Assessing Your
Performance:
1. Company Round Analysis
2. Analyst Report

S I M U L A T I O N
M A N A G E M E N T
Round Aanalysis-example

S I M U L A T I O N
M A N A G E M E N T
Simulation Scoring System