S. Banerjee and A. Ross, Impact of Photometric ...
8
Impact of Photometric Transformations on PRNU Estimation Schemes: A Case Study Using Near Infrared Ocular Images Sudipta Banerjee and Arun Ross Michigan State University, USA [email protected] and [email protected] Abstract—The principle of Photo Response Non Uniformity (PRNU) is often used to link a digital image with the sensor that produced it. In this regard, a number of schemes have been proposed in the literature to extract PRNU details from a given input image. In this work, we study the impact of photometric transformations applied to near-infrared ocular images, on PRNU-based iris sensor identification accuracy. The contributions of this work are as follows: (a) Firstly, we evaluate the impact of 7 different photometric transformations on 4 dif- ferent PRNU-based sensor identification schemes; (b) Secondly, we develop an explanatory model based on the Jensen-Shannon divergence measure to analyze the conditions under which these PRNU estimation schemes fail on photometrically transformed images. The analysis is conducted using 9,626 ocular images pertaining to 11 different iris sensors. Experiments suggest that (a) the Enhanced Sensor Pattern Noise and Maximum Likelihood Estimation based Sensor Pattern Noise techniques are more robust to photometric transformations than other PRNU-based schemes; (b) the application of photometric transformations actually improves the performance of the Phase Sensor Pattern Noise scheme; (c) the single-scale Self Quotient Image (SQI) and Difference of Gaussians (DoG) filtering transformations adversely impact all 4 PRNU-based schemes considered in this work; and (d) the Jensen-Shannon divergence measure is able to explain the degradation in performance of PRNU-based schemes as a function of the photometrically modified images. I. I NTRODUCTION The field of digital image forensics uses scientific principles to establish the origin and authenticity of digital images [1]. The proliferation of digital images in a number of applications, ranging from social media [2] to law enforcement [3, 4], has further accentuated the need to develop effective image forensic tools for a myriad of purposes. One such tool involves the extraction of sensor-specific details from digital images in order to determine the origin of the image, i.e., the sensor that produced the image. This process, referred to as sensor forensics or sensor identification or device validation, aids in creating a link between an image and its source [5, 6]. One of the most popular methods in the literature for sensor forensics is the so-called PRNU (Photo Response Non Uni- formity) method [7], which looks for sensor-specific artifacts in digital images (see Figure 1). More specifically, PRNU- based schemes assume that defects in the sensor manufacturing process result in non-uniform response of individual pixels to similar illumination levels, and that these non-uniformities (manifesting as sensor noise pattern) can be extracted from the image. While such sensor forensic schemes have been extensively studied in the context of color images produced by classical digital cameras based on CMOS or CCD technology [7]– [10], their applicability to near-infrared (NIR) sensors was only recently established particularly in the context of iris and ocular recognition systems [11]–[16]. In such recognition systems, often, the input ocular image is subjected to some illumination normalization schemes in order to address issues such as motion blur, out-of-focus imaging, low resolution and uneven illumination [17]. See Figure 2. The goal of such illumination normalization schemes is to improve the biometric recognition accuracy. In this work, we examine the following question: Do these commonly applied photometric transformation schemes im- pede the performance of iris sensor identification algorithms? Such a study has the following benefits: 1. It would help in better understanding the robustness of different PRNU-based schemes to commonly applied illumina- tion normalization routines in the iris recognition domain. This is particularly important in situations where the original raw image is not available for forensic purposes, but the processed image is available (e.g., when pre-processing is accomplished using hardware). 2. In recent literature, the possibility of combining ocular biometric recognition with device (sensor) identification has been proposed for enhanced security [18], by using the same ocular image for both device identification and ocular recogni- tion. Since the photometric normalization schemes considered in this work are known to positively impact biometric recog- nition, it behooves us to determine the nature of their impact on device identification. In this work, we evaluate the effect of photometric transformation on multiple PRNU-based sensor identifica- tion techniques, and use Jensen-Shannon based divergence measure to explain the rationale behind the variation in sensor identification performance. The rest of the paper is organized as follows: Section II provides a brief literature review on PRNU-based sensor identification schemes. Section III describes the illumination normalization schemes and the PRNU estimation schemes S. Banerjee and A. Ross, "Impact of Photometric Transformations on PRNU Estimation Schemes: A Case Study Using Near Infrared Ocular Images," Proc. of 6th IAPR/IEEE International Workshop on Biometrics and Forensics, (Sassari, Italy), June 2018
Transcript of S. Banerjee and A. Ross, Impact of Photometric ...

Impact of Photometric Transformations on PRNUEstimation Schemes: A Case Study Using Near
Infrared Ocular ImagesSudipta Banerjee and Arun RossMichigan State University, USA
[email protected] and [email protected]
Abstract—The principle of Photo Response Non Uniformity(PRNU) is often used to link a digital image with the sensorthat produced it. In this regard, a number of schemes havebeen proposed in the literature to extract PRNU details froma given input image. In this work, we study the impact ofphotometric transformations applied to near-infrared ocularimages, on PRNU-based iris sensor identification accuracy. Thecontributions of this work are as follows: (a) Firstly, we evaluatethe impact of 7 different photometric transformations on 4 dif-ferent PRNU-based sensor identification schemes; (b) Secondly,we develop an explanatory model based on the Jensen-Shannondivergence measure to analyze the conditions under which thesePRNU estimation schemes fail on photometrically transformedimages. The analysis is conducted using 9,626 ocular imagespertaining to 11 different iris sensors. Experiments suggest that(a) the Enhanced Sensor Pattern Noise and Maximum LikelihoodEstimation based Sensor Pattern Noise techniques are morerobust to photometric transformations than other PRNU-basedschemes; (b) the application of photometric transformationsactually improves the performance of the Phase Sensor PatternNoise scheme; (c) the single-scale Self Quotient Image (SQI) andDifference of Gaussians (DoG) filtering transformations adverselyimpact all 4 PRNU-based schemes considered in this work; and(d) the Jensen-Shannon divergence measure is able to explainthe degradation in performance of PRNU-based schemes as afunction of the photometrically modified images.
I. INTRODUCTION
The field of digital image forensics uses scientific principlesto establish the origin and authenticity of digital images [1].The proliferation of digital images in a number of applications,ranging from social media [2] to law enforcement [3, 4],has further accentuated the need to develop effective imageforensic tools for a myriad of purposes. One such tool involvesthe extraction of sensor-specific details from digital images inorder to determine the origin of the image, i.e., the sensorthat produced the image. This process, referred to as sensorforensics or sensor identification or device validation, aidsin creating a link between an image and its source [5, 6].One of the most popular methods in the literature for sensorforensics is the so-called PRNU (Photo Response Non Uni-formity) method [7], which looks for sensor-specific artifactsin digital images (see Figure 1). More specifically, PRNU-based schemes assume that defects in the sensor manufacturingprocess result in non-uniform response of individual pixelsto similar illumination levels, and that these non-uniformities
(manifesting as sensor noise pattern) can be extracted fromthe image.
While such sensor forensic schemes have been extensivelystudied in the context of color images produced by classicaldigital cameras based on CMOS or CCD technology [7]–[10], their applicability to near-infrared (NIR) sensors wasonly recently established particularly in the context of irisand ocular recognition systems [11]–[16]. In such recognitionsystems, often, the input ocular image is subjected to someillumination normalization schemes in order to address issuessuch as motion blur, out-of-focus imaging, low resolutionand uneven illumination [17]. See Figure 2. The goal ofsuch illumination normalization schemes is to improve thebiometric recognition accuracy.
In this work, we examine the following question: Do thesecommonly applied photometric transformation schemes im-pede the performance of iris sensor identification algorithms?Such a study has the following benefits:
1. It would help in better understanding the robustness ofdifferent PRNU-based schemes to commonly applied illumina-tion normalization routines in the iris recognition domain. Thisis particularly important in situations where the original rawimage is not available for forensic purposes, but the processedimage is available (e.g., when pre-processing is accomplishedusing hardware).
2. In recent literature, the possibility of combining ocularbiometric recognition with device (sensor) identification hasbeen proposed for enhanced security [18], by using the sameocular image for both device identification and ocular recogni-tion. Since the photometric normalization schemes consideredin this work are known to positively impact biometric recog-nition, it behooves us to determine the nature of their impacton device identification.
In this work, we evaluate the effect of photometrictransformation on multiple PRNU-based sensor identifica-tion techniques, and use Jensen-Shannon based divergencemeasure to explain the rationale behind the variation insensor identification performance.
The rest of the paper is organized as follows: SectionII provides a brief literature review on PRNU-based sensoridentification schemes. Section III describes the illuminationnormalization schemes and the PRNU estimation schemes
S. Banerjee and A. Ross, "Impact of Photometric Transformations on PRNU Estimation Schemes: A Case Study Using Near Infrared Ocular Images,"Proc. of 6th IAPR/IEEE International Workshop on Biometrics and Forensics, (Sassari, Italy), June 2018

Fig. 1: General framework of a PRNU-based sensor identification system.
(a) (b) (c)
Fig. 2: Examples of NIR ocular images exhibiting (a) defocusblur, (b) uneven illumination and (c) motion blur (due to eyelidmovement).1
used in this work. Section IV describes the datasets and ex-periments, and summarizes the results. Section V presents theexplanatory model that analyzes the results in a quantifiablemanner. Section VI concludes the paper.
II. RELATED WORK
Sensor identification [1] is an active field of research; earlywork extracted information related to dead pixels [5] and colorfilter array interpolation artifacts [6] to link an image to itssource of origin, i.e., the device that acquired the image.This link can also be established using the Sensor PatternNoise (SPN) [7]–[10], which arises due to manufacturingdefects in the silicon wafer used for sensor construction.The fundamental component of SPN is Photo Response Non-Uniformity (PRNU), which is a consequence of the non-uniform variation in the sensitivity of individual pixels tothe same light intensity. The PRNU pattern manifests in theimages acquired using the sensor, thereby serving as a uniquesensor identifier. PRNU has been extensively studied in thecontext of RGB sensors [8, 19]–[21].
However, iris sensors (see Figure 3) typically operate in thenear-infrared (NIR) spectrum and have different constructionaland operational details [22]. NIR images have been shown tobe statistically different from images captured in the visiblespectrum [23]. In spite of these differences, recent research hasdemonstrated that PRNU-based schemes developed for RGBimages can be applied to NIR iris images [12]–[15].
1Images are acquired using Panasonic BM-ET100US (b) and Cogentsensors (a & c).
A review of the literature suggests that there has beenlimited research on the impact of photometric transformationson sensor identification algorithms [7, 24]. In the currentwork, we advance our understanding of PRNU-based sensoridentification schemes by considering multiple photometrictransformations and analyzing the effect of such transforma-tions on sensor identification accuracy, in the context of NIRocular images. Further, we develop an explanatory model todetermine a causal relationship between photometric trans-formations and their impact on the performance of PRNUalgorithms.
The principal contributions of this work are as follows: a)investigating the effect of seven illumination normalizationschemes (the terms illumination normalization, photometrictransformation and image enhancement have been used inter-changeably in the paper) on sensor identification performance;b) conducting experiments using 11 sensors and 4 PRNU esti-mation schemes; and c) using the Jensen-Shannon divergencemeasure to explain the impact of photometric transformationson the wavelet denoised pixel intensity distribution (discussedlater) and, subsequently, on sensor identification.
III. ILLUMINATION NORMALIZATION SCHEMES ANDSENSOR IDENTIFICATION METHODS
In this section, we will discuss the seven ocular imageenhancement schemes considered in our work, followed bya brief overview of the four PRNU-based sensor identificationstrategies.
A. Photometric Transformation
Variations in ambient lighting conditions, coupled withunconstrained image acquisition, result in challenging ocularimages as depicted in Figure 2. Occlusions due to eyelid move-ment, motion blur, de-focus blur, poor resolution and varyingdegrees of illumination can significantly impact iris segmen-tation and iris recognition processes [17]. A large number ofillumination normalization schemes have been demonstrated toimprove iris and periocular recognition performance [17, 25]–[27]. The relevance of the seven ocular image enhancementschemes considered in our work is discussed next.
Homomorphic Filtering: Homomorphic filtering is mostcommonly used for removing non-uniform illumination in
2Original image was acquired using CASIA-IrisCam V2 sensor [28].
S. Banerjee and A. Ross, "Impact of Photometric Transformations on PRNU Estimation Schemes: A Case Study Using Near Infrared Ocular Images," Proc. of 6th IAPR/IEEE International Workshop on Biometrics and Forensics, (Sassari, Italy), June 2018

(a) (b) (c) (d)
(e) (f) (g) (h)
(i) (j) (k)
Fig. 3: Examples of iris sensors. (a) IrisKing IKEMB100,(b) LG 4000, (c) IrisGuard-IG-AD100, (d) Panansonic-BM-ET100US Authenticam, (e) JIRIS JPC1000, (f) CASIAIrisCam-V2, (g) Aoptix Insight, (h) OKI IrisPass-h, (i) LG2200, (j) Cogent and (k) Everfocus Monochrome CCD.
(a) (b) (c) (d)
(e) (f) (g) (h)
Fig. 4: An example of an NIR iris image subjected to sevenillumination normalization schemes. (a) Original, (b) CLAHE,(c) Gamma correction, (d) Homomorphic filtering, (e) MSR,(f) SQI, (g) DCT normalization and (h) DoG.2
images by applying a high-pass filter in the frequency domainof logarithmically transformed images [29]. Issues arisingdue to uneven illumination, as depicted in Figure 2(b), canbe addressed by applying a high pass Butterworth filterafter the logarithm-transformed image is converted to thefrequency domain using Fourier transform. Singh et al. [25]used homomorphic filtering to improve the performance ofiris recognition on the NHCI database.
Gamma correction: Gamma adjustment is typically usedto increase the contrast of images acquired in low illuminationconditions [30]. This photometric transformation produces theoutput image as a power, denoted by a parameter γ, of theinput image pixel values. Jillela et al. [17] employed gammacorrection for improving the contrast of images in the FOCS
database for periocular recognition. The range of γ used inour work is [0.1, 2.1].
Contrast Limited Adaptive Histogram Equalization(CLAHE): Histogram equalization has been shown to aidperiocular recognition [31]. CLAHE tessellates the imageinto patches and performs adaptive histogram equalization oneach of these patches by clipping the pixel intensity valuesexceeding the user defined contrast limit [32]. Finally, itaggregates the patches using bilinear interpolation. In ourexperiments, 8 × 8 patches are considered and the contrastlimit is set to 0.01.
Discrete Cosine Transform (DCT): Illuminationinvariance can be achieved by applying DCT transform to thelogarithm-transformed image, followed by removal of the lowfrequency DCT coefficients, which capture the illuminationcomponent of the image [33, 34]. This process operateslike a high pass filter. Juefei-Xu and Savvides applied thisillumination normalization for robust periocular recognitionon NIST’s FRGC version 2 database [27].
Difference of Gaussians (DoG): DoG filter closelyapproximates the Laplacian of Gaussian (LoG) filter in acomputationally efficient manner [35]. DoG uses Gaussianfilters having different scales or filter sizes. The differencebetween the two filtered outputs, corresponding to Gaussianfiltering of the image using two different scales, is computed.This difference is devoid of the illumination variationspresent in the original image. DoG filtering has been usedto compensate for illumination variations in the context ofperiocular recognition on the FRGC version 2 database [27].The two filter sizes used in our work are σ1 =1 and σ2 =2,where σi denotes the standard deviation.
Multi-Scale Retinex (MSR): Multi-Scale Retinex(MSR) [36] uses smoothing kernels of different sizes, andcombines the outputs of Single Scale Retinex (SSR) toremove the halo-like artifacts produced in images transformedusing a single-scale kernel. The retinex algorithm has beenapplied to UBIRIS v2, FRGC and CASIAv4-Distance datasetsto improve the quality of ocular images [37]. MSR proved tobe the best illumination normalization scheme in [27]. Threescales (standard deviations), viz., σ = [7, 15, 21], were usedin our work to retain the fine details present in the scene aswell as maintain the visual aesthetics of the image.
Single-Scale Self Quotient Image (SQI): SQI is closelyrelated to MSR. It is based on the Lambertian model and theconcept of quotient image [38]. The illumination invariantrepresentation can be obtained as the quotient of the originalimage and the smoothed version of the original image. Thehalo-like artifacts produced in MSR is typically due to theuse of an isotropic Gaussian smoothing kernel. This problemis resolved in SQI using a weighted anisotropic Gaussiansmoothing kernel [38]. SQI was used for illuminationnormalization on the UBIPosePr dataset for unconstrainedperiocular recognition [39].
Figure 4 illustrates the effect of the aforementioned photo-metric normalization schemes on a sample ocular NIR image.As evident from Figure 4(e), MSR is not able to remove
S. Banerjee and A. Ross, "Impact of Photometric Transformations on PRNU Estimation Schemes: A Case Study Using Near Infrared Ocular Images," Proc. of 6th IAPR/IEEE International Workshop on Biometrics and Forensics, (Sassari, Italy), June 2018
the halo artifacts completely, and these anomalies persist inFigure 4(g), where DCT based normalization scheme is used.
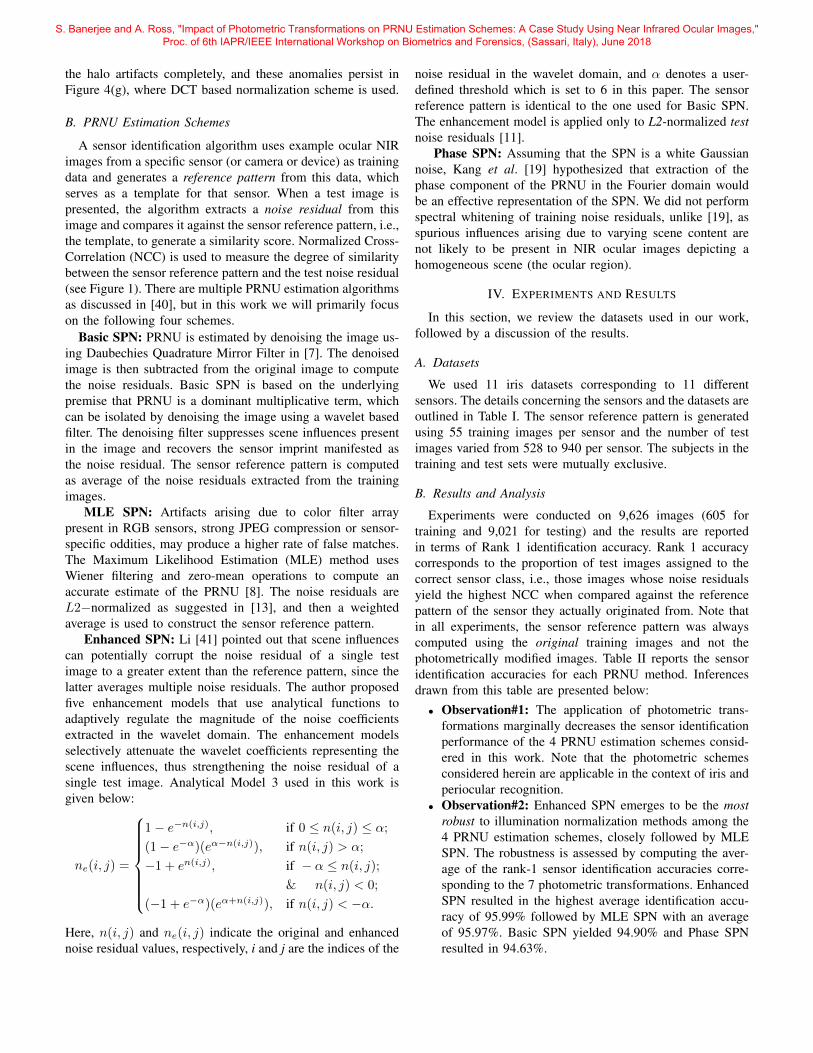
B. PRNU Estimation Schemes
A sensor identification algorithm uses example ocular NIRimages from a specific sensor (or camera or device) as trainingdata and generates a reference pattern from this data, whichserves as a template for that sensor. When a test image ispresented, the algorithm extracts a noise residual from thisimage and compares it against the sensor reference pattern, i.e.,the template, to generate a similarity score. Normalized Cross-Correlation (NCC) is used to measure the degree of similaritybetween the sensor reference pattern and the test noise residual(see Figure 1). There are multiple PRNU estimation algorithmsas discussed in [40], but in this work we will primarily focuson the following four schemes.
Basic SPN: PRNU is estimated by denoising the image us-ing Daubechies Quadrature Mirror Filter in [7]. The denoisedimage is then subtracted from the original image to computethe noise residuals. Basic SPN is based on the underlyingpremise that PRNU is a dominant multiplicative term, whichcan be isolated by denoising the image using a wavelet basedfilter. The denoising filter suppresses scene influences presentin the image and recovers the sensor imprint manifested asthe noise residual. The sensor reference pattern is computedas average of the noise residuals extracted from the trainingimages.
MLE SPN: Artifacts arising due to color filter arraypresent in RGB sensors, strong JPEG compression or sensor-specific oddities, may produce a higher rate of false matches.The Maximum Likelihood Estimation (MLE) method usesWiener filtering and zero-mean operations to compute anaccurate estimate of the PRNU [8]. The noise residuals areL2−normalized as suggested in [13], and then a weightedaverage is used to construct the sensor reference pattern.
Enhanced SPN: Li [41] pointed out that scene influencescan potentially corrupt the noise residual of a single testimage to a greater extent than the reference pattern, since thelatter averages multiple noise residuals. The author proposedfive enhancement models that use analytical functions toadaptively regulate the magnitude of the noise coefficientsextracted in the wavelet domain. The enhancement modelsselectively attenuate the wavelet coefficients representing thescene influences, thus strengthening the noise residual of asingle test image. Analytical Model 3 used in this work isgiven below:
ne(i, j) =
1− e−n(i,j), if 0 ≤ n(i, j) ≤ α;(1− e−α)(eα−n(i,j)), if n(i, j) > α;
−1 + en(i,j), if − α ≤ n(i, j);& n(i, j) < 0;
(−1 + e−α)(eα+n(i,j)), if n(i, j) < −α.
Here, n(i, j) and ne(i, j) indicate the original and enhancednoise residual values, respectively, i and j are the indices of the
noise residual in the wavelet domain, and α denotes a user-defined threshold which is set to 6 in this paper. The sensorreference pattern is identical to the one used for Basic SPN.The enhancement model is applied only to L2-normalized testnoise residuals [11].
Phase SPN: Assuming that the SPN is a white Gaussiannoise, Kang et al. [19] hypothesized that extraction of thephase component of the PRNU in the Fourier domain wouldbe an effective representation of the SPN. We did not performspectral whitening of training noise residuals, unlike [19], asspurious influences arising due to varying scene content arenot likely to be present in NIR ocular images depicting ahomogeneous scene (the ocular region).
IV. EXPERIMENTS AND RESULTS
In this section, we review the datasets used in our work,followed by a discussion of the results.
A. Datasets
We used 11 iris datasets corresponding to 11 differentsensors. The details concerning the sensors and the datasets areoutlined in Table I. The sensor reference pattern is generatedusing 55 training images per sensor and the number of testimages varied from 528 to 940 per sensor. The subjects in thetraining and test sets were mutually exclusive.
B. Results and Analysis
Experiments were conducted on 9,626 images (605 fortraining and 9,021 for testing) and the results are reportedin terms of Rank 1 identification accuracy. Rank 1 accuracycorresponds to the proportion of test images assigned to thecorrect sensor class, i.e., those images whose noise residualsyield the highest NCC when compared against the referencepattern of the sensor they actually originated from. Note thatin all experiments, the sensor reference pattern was alwayscomputed using the original training images and not thephotometrically modified images. Table II reports the sensoridentification accuracies for each PRNU method. Inferencesdrawn from this table are presented below:
• Observation#1: The application of photometric trans-formations marginally decreases the sensor identificationperformance of the 4 PRNU estimation schemes consid-ered in this work. Note that the photometric schemesconsidered herein are applicable in the context of iris andperiocular recognition.
• Observation#2: Enhanced SPN emerges to be the mostrobust to illumination normalization methods among the4 PRNU estimation schemes, closely followed by MLESPN. The robustness is assessed by computing the aver-age of the rank-1 sensor identification accuracies corre-sponding to the 7 photometric transformations. EnhancedSPN resulted in the highest average identification accu-racy of 95.99% followed by MLE SPN with an averageof 95.97%. Basic SPN yielded 94.90% and Phase SPNresulted in 94.63%.
S. Banerjee and A. Ross, "Impact of Photometric Transformations on PRNU Estimation Schemes: A Case Study Using Near Infrared Ocular Images," Proc. of 6th IAPR/IEEE International Workshop on Biometrics and Forensics, (Sassari, Italy), June 2018

TABLE I: The datasets and sensors used in this work.
Name of Dataset Name of Sensor Abbreviation Image ResolutionBioCOP2009 Set I Aoptix Insight Aop 640x480CASIAv2 Device1 [28] OKI IrisPass-h OKI 640x480CASIAv2 Device2 [28] CASIA-IrisCam V2 IC 640x480CASIAv4 (CASIA-Iris Thousand subset) [42] IrisKing IKEMB100 IK 640x480IITD [43] JIRIS JPC1000 JPC 320x240IIITD Multi-spectral Periocular Database (NIR subset) [44] Cogent Cog 640x480MMU2 [45] Panasonic BM-ET 100US Authenticam Pan 320x238ND Cosmetic Contact Lenses 2013 [46] IrisGuard-IG-AD100 AD 640x480ND-CrossSensor-Iris-2013 Set I [46] LG2200 LG22 640x480ND-CrossSensor-Iris-2013 Set II [46] LG4000 LG40 640x480WVU Off-Axis [47] EverFocus Monochrome CCD Mon 640x480
TABLE II: Rank-1 Sensor Identification Accuracies (%). The value enclosed in parentheses indicates the difference in accuracywhen compared to that obtained using the original images. Note that in all cases, the reference pattern for each sensor iscomputed using the unmodified original images.
PRNU Estimation SchemesPhotometric Transformation Basic SPN Enhanced SPN Phase SPN MLE SPNOriginal 96.43 98.87 94.89 97.10Homomorphic 92.38(-4.05) 93.38(-5.49) 93.37(-1.52) 97.79(+0.69)CLAHE 95.75(-0.68) 97.78(-1.09) 94.51(-0.38) 96.43(-0.67)Gamma 96.53(+0.10) 98.03(-0.84) 95.41(+0.52) 97.60(+0.50)DCT normalization 95.54(-0.89) 97.01(-1.86) 96.20(+1.31) 97.35(+0.25)DoG 92.81(-3.62) 92.77(-6.10) 90.28(-4.61) 90.42(-6.68)MSR 96.31(-0.12) 96.18(-2.69) 98.16(+3.27) 98.20(+1.10)SQI 95.04(-1.39) 96.82(-2.05) 94.47(-0.42) 94.00(-3.10)Average 94.90(-1.53) 95.99(-2.88) 94.63(-0.26) 95.97(-1.13)
TABLE III: Jensen-Shannon divergence between the wavelet denoised versions of the original and photometrically transformedimages.
Transformations Name of Sensor Mean and Standard DeviationAop OKI IC IK JPC Cog Pan AD LG22 LG40 MonOriginal-CLAHE 0.5543 0.1018 0.2092 0.1053 0.3165 0.0982 0.4027 0.4403 0.4465 0.6798 0.0912 0.3133 ± 0.2071Original-DCT 0.5325 0.0724 0.1330 0.0824 0.5179 0.1033 0.3522 0.3402 0.3314 0.3838 0.0571 0.2642 ± 0.1801Original-DoG 0.4791 0.0970 0.1370 0.0754 0.3074 0.0760 0.3134 0.2516 0.3263 0.3230 0.0397 0.2205 ± 0.1423Original-Gamma 0.4559 0.0836 0.0960 0.0499 0.2310 0.1143 0.2282 0.2399 0.3062 0.2561 0.1036 0.1968 ± 0.1211Original-Homomorphic 0.6184 0.0947 0.0769 0.1252 0.3584 0.3366 0.3979 0.3894 0.4949 0.5962 0.0612 0.3227 ± 0.2057Original-MSR 0.5602 0.1231 0.1657 0.2409 0.7459 0.0910 0.4060 0.3682 0.5440 0.4311 0.0678 0.3404 ± 0.2217Original-SQI 0.7320 0.1191 0.2915 0.1880 0.3522 0.1361 0.5478 0.6849 0.5867 0.8173 0.1304 0.4169 ± 0.2644
• Observation#3: Photometric transformations were ob-served to improve the sensor identification accuracy ofthe Phase SPN method. Multi-Scale Retinex improvedthe accuracy by 3.27%, DCT normalization boosted theaccuracy by 1.31% and Gamma correction marginallyimproved it by 0.52%.
• Observation#4: DoG filtering resulted in degradation ofsensor identification accuracy by 3.62% for Basic SPN,by 6.10% for Enhanced SPN, by 4.61% for Phase SPNand by 6.68% for MLE SPN. It was closely followed bySQI which degraded the sensor identification accuracyby 1.39% for Basic SPN, by 2.05% for Enhanced SPN,by 0.42% for Phase SPN and by 3.10% for MLE SPN.Based on the results of this work, it is evident that someillumination normalization schemes which help in im-proving iris and periocular recognition performance, cannegatively impact the performance of sensor identificationalgorithms.
• Observation#5: Gamma transformation and MSRmarginally improve the performance of PRNU estimationschemes, as observed when the difference-in-performancevalues enclosed in parentheses are averaged across the 4PRNU estimation schemes.
The results are further visualized from two perspectives. First,CMC curves are presented in Figure 5 which depict theeffect of each photometric normalization scheme on the PRNUestimation techniques. Secondly, ROC curves are presented inFigure 6 indicating the degree of robustness of each PRNUestimation algorithm when subjected to different illuminationnormalization methods. These two curves reinforce the obser-vations made above.
Next, we address the following question: Is there an ex-planatory model which can describe the performance of thePRNU estimation schemes in the presence of photometricallytransformed images? The next section utilizes a statisticalmeasure to explain the variations in the performance of thesensor identification algorithms when applied to photometri-
S. Banerjee and A. Ross, "Impact of Photometric Transformations on PRNU Estimation Schemes: A Case Study Using Near Infrared Ocular Images," Proc. of 6th IAPR/IEEE International Workshop on Biometrics and Forensics, (Sassari, Italy), June 2018

1 2 3Rank
94
95
96
97
98
99
100
Iden
tific
atio
n ac
cura
cy(%
)
Enhanced SPNBasic SPNMLE SPNPhase SPN
(a)
1 2 3Rank
94
95
96
97
98
99
100
Iden
tific
atio
n ac
cura
cy(%
)
Enhanced SPNBasic SPNMLE SPNPhase SPN
(b)
1 2 3Rank
95
96
97
98
99
100
Iden
tific
atio
n ac
cura
cy(%
)
Enhanced SPNBasic SPNMLE SPNPhase SPN
(c)
1 2 3Rank
92
93
94
95
96
97
98
99
100
Iden
tific
atio
n ac
cura
cy(%
)
Enhanced SPNBasic SPNMLE SPNPhase SPN
(d)
1 2 3Rank
96
97
98
99
100
Iden
tific
atio
n ac
cura
cy(%
)
Enhanced SPNBasic SPNMLE SPNPhase SPN
(e)
1 2 3Rank
94
95
96
97
98
99
100
Iden
tific
atio
n ac
cura
cy(%
)
Enhanced SPNBasic SPNMLE SPNPhase SPN
(f)
1 2 3Rank
95
96
97
98
99
100
Iden
tific
atio
n ac
cura
cy(%
)
Enhanced SPNBasic SPNMLE SPNPhase SPN
(g)
1 2 3Rank
90
91
92
93
94
95
96
97
98
Iden
tific
atio
n ac
cura
cy(%
) Enhanced SPNBasic SPNMLE SPNPhase SPN
(h)
Fig. 5: CMC curves depicting the effect of different illumination normalization processes on PRNU estimation techniques. (a)Original, (b) CLAHE, (c) Gamma correction, (d) Homomorphic filtering, (e) MSR, (f) SQI, (g) DCT normalization and (h)DoG.
10-3 10-2 10-1 100 101 102
False Positive Rate (%)
0
20
40
60
80
100
Fal
se N
egat
ive
Rat
e (%
)
Before TransformationAfter HomomorphicAfter CLAHEAfter GammaAfter DCTAfter DoGAfter MSRAfter SQI
(a)
10-4 10-2 100 102
False Positive Rate (%)
0
10
20
30
40
50
Fal
se N
egat
ive
Rat
e (%
)
Before TransformationAfter HomomorphicAfter CLAHEAfter GammaAfter DCTAfter DoGAfter MSRAfter SQI
(b)
10-4 10-2 100 102
False Positive Rate (%)
0
20
40
60
80
100
Fal
se N
egat
ive
Rat
e (%
)
Before TransformationAfter HomomorphicAfter CLAHEAfter GammaAfter DCTAfter DoGAfter MSRAfter SQI
(c)
10-4 10-2 100 102
False Positive Rate (%)
0
20
40
60
80
100
Fal
se N
egat
ive
Rat
e (%
)
Before TransformationAfter HomomorphicAfter CLAHEAfter GammaAfter DCTAfter DoGAfter MSRAfter SQI
(d)
Fig. 6: ROC curves depicting sensor identification performance of photometrically transformed images. (a) Basic SPN, (b)Phase SPN, (c) MLE SPN and (d) Enhanced SPN.
cally modified images.
V. EXPLANATORY MODEL
The results in the previous section indicate that PRNUestimation schemes are able to recover sensor informationreliably for some illumination normalization schemes, barringDoG filtering and SQI transformation. In this section, westudy the probability distribution of pixel intensities, i.e.,the normalized histograms of the original image and thephotometrically transformed images after being subjected tothe wavelet based denoising filter, to provide a principledanalysis of the performance of PRNU-based sensor identifi-cation algorithms. We hypothesize that the degree of disparitybetween the histograms of the denoised original images andthe denoised transformed images will provide insight intothe general performance of PRNU estimation algorithms onphotometrically modified images. The four sensor identifi-cation schemes used in this work are not applied to theraw images directly; rather, the images (both original and
transformed) are first subjected to wavelet based denoising,followed by PRNU estimation in the wavelet domain. Thus,it is necessary to consider the denoised images, instead ofthe raw images, to develop a suitable explanatory model. Tothis end, we employed the Jensen-Shannon (JS) divergence tocompute the dissimilarity between denoised image histogramscorresponding to the original image and the photometricallymodified image. JS divergence is a symmetric and smoothedversion of Kullback-Liebler divergence and yields a finitevalue [48]. Given two probability distributions, Po and Pt,the JS divergence is computed as follows, JS(Po||Pt) =H( 12Po +
12Pt)− {
12H(Po) +
12H(Pt)}. Here, H indicates the
Shannon entropy measure corresponding to a random variable,say X , and is computed as H(X) = −
∑i pi log2(pi). Here,
pi = P[X = xi]. The JS measure is bounded between 0and 1 (0 corresponds to identical distributions and 1 indicateshigh dissimilarity). Thus, JS divergence computes the averageentropy of the two distributions: higher the entropy value, themore dissimilar are the two distributions.
S. Banerjee and A. Ross, "Impact of Photometric Transformations on PRNU Estimation Schemes: A Case Study Using Near Infrared Ocular Images," Proc. of 6th IAPR/IEEE International Workshop on Biometrics and Forensics, (Sassari, Italy), June 2018

First, we generated the probability distributions (i.e., thenormalized histograms) of the denoised original and denoisedtransformed images.3 Next, we computed the JS divergencebetween the two probability distributions. Finally, the JS val-ues corresponding to all the images were averaged to computea single JS measure value for a given sensor. Table III reportsthe JS divergence pertaining to different transformations foreach of the 11 sensors. The average and standard deviation ofthe JS values corresponding to the 11 sensors are computedfor each of the photometric transformations. The highestdivergence value corresponding to a particular transformationis bolded, while the lowest divergence value is italicized. Someimportant observations from Table III are summarized below.
• Observation#1: Gamma transformation resulted in theleast JS divergence value. It indicates that the normal-ized histograms of denoised original and Gamma trans-formed images are highly similar. So it is not surprisingthat Gamma transformation resulted in only a marginaldegradation (for Enhanced SPN) in sensor identificationaccuracy as evident from the fourth row in Table II.
• Observation#2: 7 out of 11 sensors reported maximumdivergence values for the SQI transformation, which re-sulted in the second worst degradation in Rank 1 accuracy(note the last row in Table II), trailing just behind DoG.
• Observation#3: The overall results indicate that pixelintensity distributions of the wavelet denoised imageshave an important role to play with regards to PRNU.
In summary, Enhanced SPN and MLE SPN are robust tomost of the illumination normalization schemes considered inthis work. Both these methods use L2−normalization of noiseresiduals to account for the variations arising due to construc-tional differences of sensors [13], which possibly facilitates amore accurate PRNU estimation. Gamma correction and MSRcan be used for ocular image enhancement without impairingthe performance of the sensor identification module. SQI andDoG filtering, on the other hand, degrade the performance ofsensor identification algorithms.
VI. SUMMARY AND FUTURE WORK
This work investigated the impact of photometric trans-formations on PRNU estimation schemes and employed anexplanatory model to understand their performance in thepresence of photometrically modified images. Iris and peri-ocular recognition systems typically use illumination normal-ization to enhance ocular images. In this work, photometrictransformations which are known to positively impact ocularrecognition have been considered for experimental analysis.Experiments involving 7 ocular enhancement schemes and4 PRNU estimation schemes indicate that Enhanced SPNand MLE SPN are robust to a majority of the illuminationnormalization schemes considered in this work, and that DoGfiltering and SQI are detrimental for sensor identification (see
3Note that PRNU estimation schemes do not require the input scene to begeometrically aligned, since PRNU is a function of the pixel location in theoriginal image.
Section IV-B). The explanatory model indicates that thosephotometric transformations causing significant deviation ofthe distribution pertaining to the denoised photometricallymodified image from that of the denoised original imagecan negatively impact sensor identification performance. Therelative dissimilarity between the distributions pertaining tothe denoised original and photometrically transformed imageswas quantified using the Jensen-Shannon divergence whichexplained sensor identification performance in presence ofphotometric transformations.
Future work will focus on determining if multiple PRNUestimation schemes can be combined to generate a robustsensor identification scheme that can successfully work on di-verse images. Further, methods to detect deliberately perturbedPRNU noise patterns [49] will be developed. In the currentwork, 11 ocular datasets corresponding to 11 different sensorbrands were utilized. Similar experiments involving differentdevices corresponding to the same sensor brand need to beconducted. Finally, effective fusion schemes for combiningiris recognition with device recognition will be designed toperform reliable person authentication in devices such asmobile phones.
ACKNOWLEDGEMENT
Images in Figure 3 are taken from the following websites.http://www.cbsr.ia.ac.cn/china/Iris%20Databases%20CH.asphttps://us.sourcesecurity.com/technical-details/access-control/access-control-systems-and-kits.2/access-control-systems-and-kits/lg- iris- irisaccess-4000.htmlhttp://www.neurotechnology.com/eye-iris-scanner- irisguard-ig-ad100.htmlhttps://www.barcodesinc.com/panasonic/bm-et100us.htmhttp://www.globalsources.com/si/AS/Jiris-Co/6008823662914/pdtl/Jpc-1000-Iris-Recognition-Camera/1056704625.htmhttp://biometrics.idealtest.org/dbDetailForUser.do?id=2http://www.airportsinternational.com/wp-content/directory/pdf/1343040479.pdfhttp://biometrics.idealtest.org/dbDetailForUser.do?id=2https://www.researchgate.net/figure/220887602 fig8 Fig-8-a-LG-EOU2200-system-b-The-iris- images- that-do-not-include-enough-irishttps://www.indiamart.com/proddetail/cogent-3m-cis202-iris-scanner-device-10601918633.htmlhttps://www.bhphotovideo.com/c/product/583849-REG/EverFocus EZ235E C16 EZ235E C16 1 3 CCDWeatherproof.html
REFERENCES
[1] H. Farid, Photo Forensics. The MIT Press, 2016.[2] L. Chen, L. Xu, X. Yuan, and N. Shashidhar, “Digital forensics in
social networks and the cloud: Process, approaches, methods, tools, andchallenges,” in International Conference on Computing, Networking andCommunications (ICNC), Feb 2015, pp. 1132–1136.
[3] J. A. Redi, W. Taktak, and J.-L. Dugelay, “Digital image forensics:A booklet for beginners,” Multimedia Tools Appl., vol. 51, no. 1,pp. 133–162, Jan. 2011. [Online]. Available: http://dx.doi.org/10.1007/s11042-010-0620-1
[4] R. Mercuri, “Courtroom considerations in digital image forensics,”in Digital Image Forensics: There is More to a Picture thanMeets the Eye, H. T. Sencar and N. Memon, Eds. New York,NY: Springer New York, 2013, pp. 313–325. [Online]. Available:https://doi.org/10.1007/978-1-4614-0757-7 11
[5] Z. J. Geradts, J. Bijhold, M. Kieft, K. Kurosawa, and K. Kuroki,“Methods for identification of images acquired with digital cameras,”Proc. SPIE 4232, Enabling Technologies for Law Enforcement andSecurity, 2001.
[6] S. Bayram, H. Sencar, N. Memon, and I. Avcibas, “Source camera iden-tification based on CFA interpolation,” in IEEE International Conferenceon Image Processing, vol. 3, Sept 2005, pp. III–69–72.
[7] J. Lukas, J. Fridrich, and M. Goljan, “Digital camera identification fromsensor pattern noise,” IEEE Transactions on Information Forensics andSecurity, vol. 1, no. 2, pp. 205–214, June 2006.
[8] M. Chen, J. Fridrich, M. Goljan, and J. Lukas, “Determining image ori-gin and integrity using sensor noise,” IEEE Transactions on InformationForensics and Security, vol. 3, no. 1, pp. 74–90, March 2008.
[9] M. Goljan, “Digital camera identification from images - Estimating falseacceptance probability,” Proc. 7th International Workshop on DigitalWatermarking, Nov 2008.
S. Banerjee and A. Ross, "Impact of Photometric Transformations on PRNU Estimation Schemes: A Case Study Using Near Infrared Ocular Images," Proc. of 6th IAPR/IEEE International Workshop on Biometrics and Forensics, (Sassari, Italy), June 2018

[10] J. Fridrich, “Digital image forensics,” IEEE Signal Processing Magazine,vol. 26, no. 2, pp. 26–37, March 2009.
[11] L. Debiasi and A. Uhl, “Blind biometric source sensor recognitionusing advanced PRNU fingerprints,” in 23rd European Signal ProcessingConference (EUSIPCO), Aug 2015, pp. 779–783.
[12] ——, “Comparison of PRNU enhancement techniques to generatePRNU fingerprints for biometric source sensor attribution,” in 4thInternational Workshop on Biometrics and Forensics (IWBF), March2016, pp. 1–6.
[13] C. Kauba, L. Debiasi, and A. Uhl, “Identifying the Origin of Iris ImagesBased on Fusion of Local Image Descriptors and PRNU Based Tech-niques,” in 3rd International Joint Conference on Biometrics (IJCB),October 2017.
[14] N. Kalka, N. Bartlow, B. Cukic, and A. Ross, “A preliminary study onidentifying sensors from iris images,” in IEEE Conference on ComputerVision and Pattern Recognition Workshops (CVPRW), June 2015, pp.50–56.
[15] S. Banerjee and A. Ross, “From image to sensor: Comparative evaluationof multiple PRNU estimation schemes for identifying sensors fromNIR iris images,” in Fifth International Workshop on Biometrics andForensics, 2017.
[16] F. Marra, G. Poggi, C. Sansone, and L. Verdoliva, “Adeep learning approach for iris sensor model identification,”Pattern Recognition Letters, 2017. [Online]. Available: http://www.sciencedirect.com/science/article/pii/S0167865517301186
[17] R. Jillela, A. A. Ross, V. N. Boddeti, B. V. K. Vijaya Kumar,X. Hu, R. Plemmons, and P. Pauca, “Iris segmentation for challengingperiocular images,” in Handbook of Iris Recognition, K. W. Bowyerand M. J. Burge, Eds. London: Springer, 2016, pp. 281–308. [Online].Available: https://doi.org/10.1007/978-1-4471-6784-6 13
[18] C. Galdi, M. Nappi, and J. L. Dugelay, “Multimodal authentication onsmartphones: Combining iris and sensor recognition for a double checkof user identity,” Pattern Recognition Letters, vol. 3, pp. 34–40, 2015.
[19] X. Kang, Y. Li, Z. Qu, and J. Huang, “Enhancing source cameraidentification performance with a camera reference phase sensor patternnoise,” IEEE Transactions on Information Forensics and Security, vol. 7,no. 2, pp. 393–402, April 2012.
[20] X. Lin and C. T. Li, “Preprocessing reference sensor pattern noise viaspectrum equalization,” IEEE Transactions on Information Forensics andSecurity, vol. 11, no. 1, pp. 126–140, Jan 2016.
[21] ——, “Enhancing sensor pattern noise via filtering distortion removal,”IEEE Signal Processing Letters, vol. 23, no. 3, pp. 381–385, March2016.
[22] J. R. Matey, “Iris device,” in Encyclopedia of Biometrics, S. Z. Li andA. K. Jain, Eds. Springer, 2009, pp. 774–778.
[23] N. J. W. Morris, S. Avidan, W. Matusik, and H. Pfister, “Statistics ofinfrared images,” in IEEE Conference on Computer Vision and PatternRecognition, June 2007, pp. 1–7.
[24] S. Samaras, V. Mygdalis, and I. Pitas, “Robustness in blind cameraidentification,” in 23rd International Conference on Pattern Recognition(ICPR), Dec 2016, pp. 3874–3879.
[25] R. Singh, M. Vatsa, and A. Noore, “Improving verification accuracyby synthesis of locally enhanced biometric images and deformablemodel,” Signal Processing, vol. 87, no. 11, pp. 2746 – 2764,2007. [Online]. Available: http://www.sciencedirect.com/science/article/pii/S0165168407001806
[26] L. Nie, A. Kumar, and S. Zhan, “Periocular recognition using un-supervised convolutional rbm feature learning,” in 22nd InternationalConference on Pattern Recognition, Aug 2014, pp. 399–404.
[27] F. Juefei-Xu and M. Savvides, “Subspace-based discrete transform en-coded local binary patterns representations for robust periocular match-ing on NIST’s Face Recognition Grand Challenge,” IEEE Transactionson Image Processing, vol. 23, no. 8, pp. 3490–3505, Aug 2014.
[28] “CASIA Iris Version 2 database,” http://biometrics.idealtest.org/dbDetailForUser.do?id=2, [Online: accessed 14-April-2018].
[29] R. C. Gonzalez and R. E. Woods, Digital Image Processing (3rdEdition). Upper Saddle River, NJ, USA: Prentice-Hall, Inc., 2006.
[30] G. Stockman and L. G. Shapiro, Computer Vision, 1st ed. Upper SaddleRiver, NJ, USA: Prentice Hall PTR, 2001.
[31] R. Jillela and A. Ross, “Ocular and periocular biometrics,” in WileyEncyclopedia of Electrical and Electronics Engineering. John Wiley& Sons, Inc., 2016. [Online]. Available: http://dx.doi.org/10.1002/047134608X.W8307
[32] K. Zuiderveld, “Contrast Limited Adaptive Histogram Equalization,”in Graphics Gems IV, P. S. Heckbert, Ed. San Diego, CA, USA:Academic Press Professional, Inc., 1994, pp. 474–485. [Online].Available: http://dl.acm.org/citation.cfm?id=180895.180940
[33] W. Chen, M. J. Er, and S. Wu, “Illumination compensation and nor-malization for robust face recognition using discrete cosine transformin logarithm domain,” IEEE Transactions on Systems, Man, and Cyber-netics, Part B (Cybernetics), vol. 36, no. 2, pp. 458–466, April 2006.
[34] V. Struc and N. Pavesic, “Photometric normalization techniques for illu-mination invariance,” in Advances in Face Image Analysis: Techniquesand Technologies, Y. Zhang, Ed. IGI-Global, 01 2011, pp. 279–300.
[35] B. Jahne and H. Haußecker, Eds., Computer Vision and Applications: AGuide for Students and Practitioners. Orlando, FL, USA: AcademicPress, Inc., 2000.
[36] D. J. Jobson, Z. Rahman, and G. A. Woodell, “A multiscale retinexfor bridging the gap between color images and the human observationof scenes,” Trans. Img. Proc., vol. 6, no. 7, pp. 965–976, Jul. 1997.[Online]. Available: http://dx.doi.org/10.1109/83.597272
[37] C. W. Tan and A. Kumar, “Towards online iris and periocular recog-nition under relaxed imaging constraints,” IEEE Transactions on ImageProcessing, vol. 22, no. 10, pp. 3751–3765, Oct 2013.
[38] H. Wang, S. Z. Li, and Y. Wang, “Face recognition under varyinglighting conditions using self quotient image,” in Sixth IEEE Interna-tional Conference on Automatic Face and Gesture Recognition, 2004.Proceedings., May 2004, pp. 819–824.
[39] C. N. Padole and H. Proenca, “Compenstaing for pose and illumina-tion in unconstrained periocular biometrics,” International Journal ofBiometrics, vol. 5, no. 3, pp. 336–359, 2013.
[40] M. Al-Ani and F. Khelifi, “On the SPN estimation in image forensics:A systematic empirical evaluation,” IEEE Transactions on InformationForensics and Security, vol. 12, no. 5, pp. 1067–1081, May 2017.
[41] C. T. Li, “Source camera identification using enhanced sensor patternnoise,” IEEE Transactions on Information Forensics and Security, vol. 5,no. 2, pp. 280–287, June 2010.
[42] “CASIA Iris Version 4 Thousand database,” http://www.cbsr.ia.ac.cn/china/Iris%20Databases%20CH.asp, [Online: accessed 14-April-2018].
[43] “IITD database,” http://www4.comp.polyu.edu.hk/∼csajaykr/IITD/Database Iris.htm, [Online: accessed 14-April-2018].
[44] “IIITD Multispectral Periocular database,” http://www.iab-rubric.org/resources/impdatabase.html, [Online: accessed 14-April-2018].
[45] “MMU2 database,” http://www.cs.princeton.edu/∼andyz/irisrecognition, [Online: accessed 14-April-2018].
[46] “ND Cross Sensor and Cosmetic Contact Lenses databases,” https://sites.google.com/a/nd.edu/public-cvrl/data-sets, [Online: accessed 14-April-2018].
[47] S. A. C. Schuckers, N. A. Schmid, A. Abhyankar, V. Dorairaj, C. K.Boyce, and L. A. Hornak, “On techniques for angle compensation innonideal iris recognition,” IEEE Transactions on Systems, Man, andCybernetics, Part B (Cybernetics), vol. 37, no. 5, pp. 1176–1190, Oct2007.
[48] E. Shutova, S. Teufel, and A. Korhonen, “Statistical MetaphorProcessing,” Comput. Linguist., vol. 39, no. 2, pp. 301–353, Jun. 2013.[Online]. Available: http://dx.doi.org/10.1162/COLI a 00124
[49] A. E. Dirik, H. T. Sencar, and N. Memon, “Analysis of seam-carving-based anonymization of images against PRNU noise pattern-basedsource attribution,” IEEE Transactions on Information Forensics andSecurity, vol. 9, no. 12, pp. 2277–2290, Dec 2014.
S. Banerjee and A. Ross, "Impact of Photometric Transformations on PRNU Estimation Schemes: A Case Study Using Near Infrared Ocular Images," Proc. of 6th IAPR/IEEE International Workshop on Biometrics and Forensics, (Sassari, Italy), June 2018