S. Bahadoorsingh and S.M. Rowland IEEE Transactions on ...
10
This is the accepted manuscript, and which has been accepted by IEEE for publication. © 2010 IEEE. Personal use of this material is permitted. Permission from IEEE must be obtained for all other uses, in any current or future media, including reprinting/republishing this material for advertising or promotional purposes, creating new collective works, for resale or redistribution to servers or lists, or reuse of any copyrighted component of this work in other works. The full reference is: ‘Investigating the Impact of Harmonics on the Breakdown of Epoxy Resin through Electrical Tree Growth’ S. Bahadoorsingh and S.M. Rowland IEEE Transactions on Dielectrics and Electrical Insulation, Vol. 17, Issue 5, pp. 1576-1584, 2010 DOI: 10.1109/TDEI.2010.5595560
Transcript of S. Bahadoorsingh and S.M. Rowland IEEE Transactions on ...

This is the accepted manuscript, and which has been accepted by IEEE for publication. ©
2010 IEEE. Personal use of this material is permitted. Permission from IEEE must be
obtained for all other uses, in any current or future media, including reprinting/republishing
this material for advertising or promotional purposes, creating new collective works, for
resale or redistribution to servers or lists, or reuse of any copyrighted component of this work
in other works. The full reference is:
‘Investigating the Impact of Harmonics on the Breakdown of Epoxy Resin through Electrical Tree Growth’
S. Bahadoorsingh and S.M. Rowland
IEEE Transactions on Dielectrics and Electrical Insulation, Vol. 17, Issue 5, pp. 1576-1584, 2010
DOI: 10.1109/TDEI.2010.5595560

S. Bahadoorsingh and S. M. Rowland: Investigating the Impact of Harmonics on the Breakdown of Epoxy Resin
1070-9878/10/$25.00 © 2010 IEEE
1576
Investigating the Impact of Harmonics on the Breakdown of Epoxy Resin through Electrical Tree Growth
S. Bahadoorsingh and S. M. Rowland
The University of Manchester, School of Electronic and Electrical Engineering, Manchester, M13 9PL, United Kingdom
ABSTRACT
Many studies have investigated the influence of harmonics on insulation life. A limited number of these studies address electrical tree growth characteristics while even fewer employ harmonics maintaining a constant peak voltage. This experimental study sought to quantitatively identify any distinguishing features of electrical tree growth characteristics as a consequence of harmonic content. The total harmonic distortion (THD) and waveshape (Ks) indices were varied to a maximum of 40% and 1.6 respectively. Electrical trees were developed in point-plane geometry using 2 μm tip radius hypodermic needles and a 2 mm gap in epoxy resin (LY/HY 5052) samples. Upon electrical tree initiation, 50 Hz composite waveforms incorporating harmonic content were applied as the excitation waveform at a constant voltage of 14.4 kV peak for 2.5 hours. No change in the electrical tree growth characteristics was identified using the width/length ratio. Electrical tree growth resulting from low power quality reduced operational insulation life and decreased the Weibull shape parameter β with the 7th harmonic displaying particular characteristics worthy of further investigation.
Index Terms — Electrical treeing, dielectric breakdown, Weibull distribution, epoxy resin insulation, harmonics, power quality.
1 INTRODUCTION
HARMONICS superimposed onto the fundamental frequency produce a distorted waveform. The sources of harmonics in power networks are non-linear loads consuming non-sinusoidal currents from sinusoidal voltage sources. These non-sinusoidal currents are harmonic currents yielding harmonic voltages across the network impedances. This distortion of the power frequency waveform on the grid mainly results from the use of power electronic devices such as adjustable speed drives, switching power supplies, inverters and other high speed switching devices [1]. Other sources of harmonics include static power converters, electric arc furnaces, electrical equipment with magnetic cores (transformers and motors) and static var compensators.
On power networks there may be an unacknowledged harmonic contribution. This may also be true for reported experimental laboratory work. Comprehending the effect of the periodic abnormalities in any resultant waveform on insulation ageing mechanisms is crucial to asset management. In polymeric insulation, electrical treeing is one such ageing mechanism.
Life tests conducted on polyethylene terephthalate (PET) and cross-linked polyethylene (XLPE) employing the 3rd, 5th and 7th harmonic orders separately, confirmed that the
resultant composite waveform may increase the voltage peak and the likelihood of partial discharge inception [2, 3]. The phase and magnitude attributes of the harmonic orders influence the peak parameter (Kp) and are a potential cause of variation of failure times. Hence, the voltage peak has been cited as the principal factor for insulation life reduction, with constant rms voltage [2-8] even in the absence of partial discharge activity [5]. Resulting life model equations of [5] confirmed the voltage peak parameter Kp was most detrimental to insulation life for the XLPE and polypropylene (PP) materials tested. Furthermore, the voltage waveshape parameter Ks was marginally more influential than the rms parameter Krms especially when partial discharge activity occurred [5]. However further investigations later confirmed the outright dominance of Ks over Krms [9]. This was consistent with the argument that for a voltage waveform characterized by a rapid increase of voltage, there is a chance of faster activation of field-assisted ageing processes [9].
Published literature progressively describing electrical tree growth measurements under the influence of multiple harmonics is scarce. Electrical treeing tests conducted employing the 3rd, 5th and 7th harmonics in XLPE [3] and using electroluminescence images at constant rms voltage confirm that harmonic content increased the peak voltage beyond the ‘short-term tree inception voltage’ resulting in bush trees. A reduction of the peak voltage below this tree inception voltage increased tree inception time, resulting in Manuscript received on 12 November 2009, in final form 7 May 2010.
IEEE Transactions on Dielectrics and Electrical Insulation Vol. 17, No. 5; October 2010 1577
growth of branch trees [3]. Similar trends were observed by Auckland et al increasing the frequency beyond the power frequency - the tree growth changed from a branch tree into a bushy tree in epoxy and polyester resins [10]. Similar observations were recorded in the presence of mechanical stress in XLPE by Zheng et al [11].
This contribution investigates the electrical tree growth characteristics in epoxy resin samples as a consequence of constant peak voltage waveforms with harmonic frequencies superimposed onto the fundamental power frequency. An analysis of the breakdown times using the Weibull distribution is also explored. In practical insulation systems, reliability tools and techniques should strive to identify changes of likelihood at low failure probabilities rather than the mean times to failure. Hence, our interest in both the shape parameter β and the scale parameter α of the Weibull distribution.
2 MODELLING ELECTRICAL STRESS
WITH HARMONIC CONTENT Conventionally the total harmonic distortion (THD)
index [12] is used to express distortion. This index, provided in equation (1), utilizes only the harmonic components, not the fundamental.
2
2 1
THD (%) 100N
h
h
VV=
⎛ ⎞= ×⎜ ⎟
⎝ ⎠∑ (1)
where h is the harmonic order present in the composite waveform, Vh the rms voltage of the hth harmonic and V1 the rms voltage of the fundamental. Montanari et al [5, 13] formulated three parameters to model distorted, non-sinusoidal voltage waveforms as a consequence of harmonic content. These were: • peak parameter - Kp • rms parameter - Krms • waveshape parameter – Ks and Kf
Kp is ratio of the peak voltage of the resultant waveform Vp to the peak fundamental V1p. Krms is ratio of the rms voltage of the resultant waveform Vrms, to the rms fundamental V1rms. The waveshape parameters are defined below in equations (2) and (3).
2 21
10
N
s hh
K hω
αω =
= ∑ (2)
2 2
1
N
f hh
K h α=
= ∑ (3)
where 1
hh
VV
α = and h is the harmonic component number.
In equation (2) the ratio of 1
0
ωω
is unity, since ω0 is the
angular frequency of the 50 Hz waveform and ω1 is the angular frequency of the fundamental waveform, also 50 Hz. Hence Ks = Kf will be used to represent this parameter. Equations (2) and (3) are proportional to the rms derivative of the waveform and thus related to its steepness [5].
Hence, the value of this index is indicative of the distortion of the resultant waveform. THD and Ks express distortion differently and both have been employed in this research.
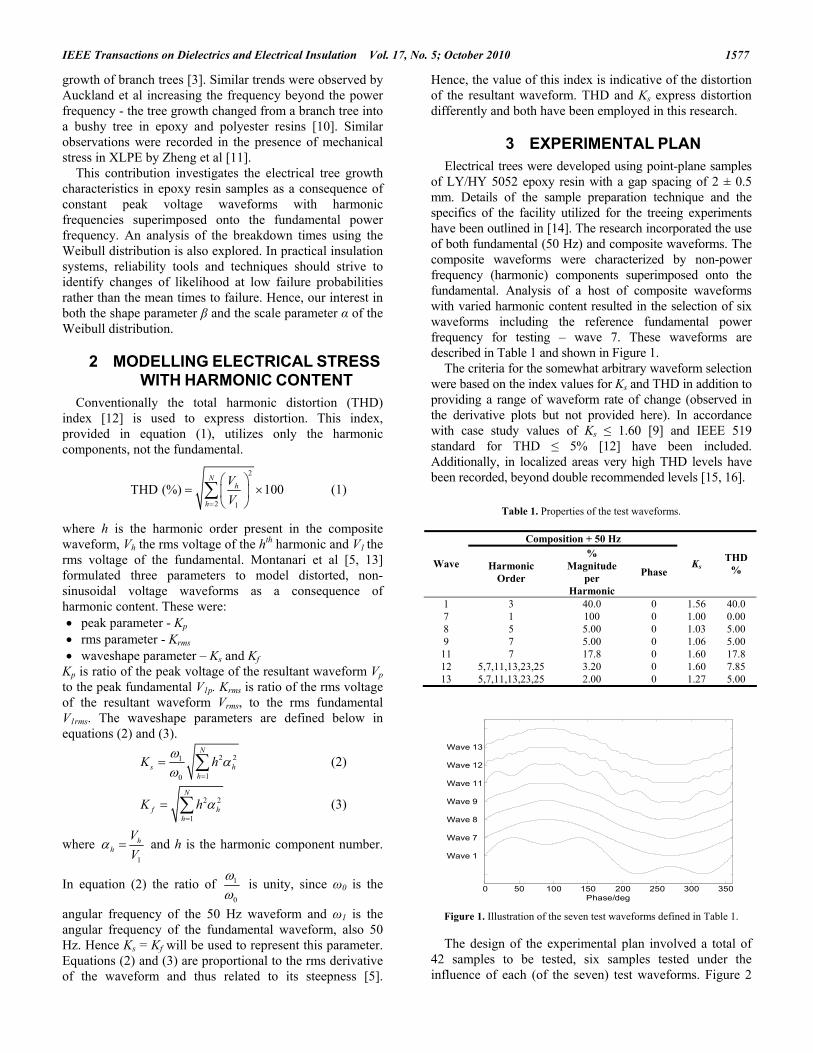
3 EXPERIMENTAL PLAN Electrical trees were developed using point-plane samples
of LY/HY 5052 epoxy resin with a gap spacing of 2 ± 0.5 mm. Details of the sample preparation technique and the specifics of the facility utilized for the treeing experiments have been outlined in [14]. The research incorporated the use of both fundamental (50 Hz) and composite waveforms. The composite waveforms were characterized by non-power frequency (harmonic) components superimposed onto the fundamental. Analysis of a host of composite waveforms with varied harmonic content resulted in the selection of six waveforms including the reference fundamental power frequency for testing – wave 7. These waveforms are described in Table 1 and shown in Figure 1.
The criteria for the somewhat arbitrary waveform selection were based on the index values for Ks and THD in addition to providing a range of waveform rate of change (observed in the derivative plots but not provided here). In accordance with case study values of Ks ≤ 1.60 [9] and IEEE 519 standard for THD ≤ 5% [12] have been included. Additionally, in localized areas very high THD levels have been recorded, beyond double recommended levels [15, 16].
Table 1. Properties of the test waveforms.
Composition + 50 Hz
Wave Harmonic Order
% Magnitude
per Harmonic
Phase Ks
THD %
1 3 40.0 0 1.56 40.0 7 1 100 0 1.00 0.00 8 5 5.00 0 1.03 5.00 9 7 5.00 0 1.06 5.00 11 7 17.8 0 1.60 17.8 12 5,7,11,13,23,25 3.20 0 1.60 7.85 13 5,7,11,13,23,25 2.00 0 1.27 5.00
0 50 100 150 200 250 300 350
Wave 1
Wave 7
Wave 8
Wave 9
Wave 11
Wave 12
Wave 13
Phase/deg Figure 1. Illustration of the seven test waveforms defined in Table 1.
The design of the experimental plan involved a total of 42 samples to be tested, six samples tested under the influence of each (of the seven) test waveforms. Figure 2

S. Bahadoorsingh and S. M. Rowland: Investigating the Impact of Harmonics on the Breakdown of Epoxy Resin 1578
shows the sequence for each sample under test. The first stage encompassing the electrical tree initiation lasted no longer than 30 mins. If an electrical tree of length ≈ 10 μm did not initiate within this period under the influence of 50 Hz at 18.0 kV peak, that sample was discarded and a new sample tested. Upon electrical tree initiation to the desired length (≈ 10 μm), the composite waveform was activated without supply interruption using the software suite developed. In this second stage the composite waveform was maintained at 14.4 kV peak for a maximum of 2.5 hours as the excitation waveform. During this period, partial discharge readings were recorded continuously in 15 minute batches and visual images of tree growth were captured every two minutes. Should the sample suffer breakdown during this stage, the time of failure was recorded.
Initiation Growth Ramp
Stage 1 Stage 2 Stage 3
50 Hz
150 mins
50 HzComposite waveform
18.0 kV peak
14.4 kV peak
10.6 kV peak to 24.8 kV
peak<30 mins 10 mins
Time (mins)0 30 180 190
Figure 2. Experimental sequence for testing each sample. Six samples stressed with each of the seven composite waveforms, yielding a total of 42 tested samples.
If the sample did not fail after 2.5 h, a ramp process was invoked in the final stage, increasing the voltage at rate of 1.0 kV rms/min from 10.6 – 24.8 kV peak. If the sample suffered breakdown during this ten minute interval the breakdown voltage was recorded. The voltage range employed here is consistent with previous investigations on epoxy resins using 14.1 kV peak test voltage in [10, 17-19] with [17] utilizing a range of 14.1 – 25.5 kV peak. Samples were tested 7 to 13 days after manufacture to minimize the variation of material ageing [20] on electrical tree growth; consistent with similar studies [17]. This exercise sought to comprehensively analyze electrical tree growth measurements and breakdown times for all 42 samples tested as a function of the composite waveforms determined by THD and Ks.
4 RESULTS 4.1 ELECTRICAL TREE GROWTH
The electrical tree is a three-dimensional structure visually captured by a two-dimensional digital image. An index of the width/length ratio of electrical tree growth was used to detect any change in tree growth characteristics. Explanation of the width/length ratio has been detailed in [14]. The commercially available needles used in this exercise were manufactured with shank width of 1.1 mm.
The digital images of the electrical trees were processed using MATLAB. Edges of the needle shank boundaries along the same horizontal axis were highlighted and the corresponding X-Y coordinates (pixels) recorded to determine the pixels/length ratio. Using this ratio, the length and width coordinates of the electrical tree branches of interest were recorded and processed. Since a linear relationship for length and coordinates (pixels) was assumed, this facilitated an estimation of tree measurements. These width/length measurements have been correlated to produce subsequent three-dimensional plots for growth with time and varying power quality indices.
Limitations of this process included the inconsistency of lighting and optics to realize distinct visual images of electrical tree growth. The use of one camera to capture images of the three-dimensional electrical tree limited precise measurement of the absolute length of branches and estimation of the general direction of the furthest branches. This limitation could possibly influence the interpretation of the width/length plots and in one extreme case, resulted in the omission of one sample (T421-09-N) from those width/length plots due to the optically poor images. The significance of the sample name has been provided in [14]. It includes the unique sample identifier (e.g. T421), the waveform sampled was tested with (e.g. 09) and whether a lubricant coating was present on the needle (e.g. Yes or No) [14].
At 18.0 kV peak in stage one, electrical tree inception occurred extremely quickly (≈ seconds) and engaging the composite waveform precisely at 10 μm proved impossible. Upon visible electrical tree initiation, the composite waveforms were instantaneously initiated as the excitation waveform, maintaining a constant peak of 14.4 kV. This provided assurance that the electrical tree length would be no greater than 30 μm at that instant. The creation of the tree was not the focus of this exercise but the starting point for the investigation on the electrical tree growth.
Figure 3 provides three-dimensional plots for the samples tested as functions of THD and Ks. There is a significant degree of reproducibility within the marginal variations of these curves. After the tree has traversed the insulation gap and growth continues, there are instances where the width/length ratio decreased; producing a dip in the curve, identifying periods when some branches grew backwards behind the needle tip. Despite this, there is insufficient evident to suggest any detectable change in the electrical tree growth characteristics in epoxy resin, due to variation in harmonic content at constant peak voltage. Therefore these plots do not confirm that acceleration of field assisted ageing processes occur owing to the waveshape of composite waveforms at constant peak voltage.
Detecting a change in tree structure, should such a relationship exist, requires a revised approach improving the precision and accuracy of the measuring system.

IEEE Transactions on Dielectrics and Electrical Insulation Vol. 17, No. 5; October 2010 1579
020
4060
80100
120140
160
1
1.1
1.2
1.3
1.4
1.5
1.60
1
2
3
4
5
6
T396
T431T365
T414
T433
T341
♥T323
T383
T392♥
♥
T412♥
T355
T325
♥
♥T374
♥
♥♥
T393
T332
♥
♥
T381
♥
Time/min
T363
T376
♦
♥
♥
♥
♦
T331
♦♦♦♦♦♦
♦
♦♦♦
T324
♦
♥
♥
T423
♦
♦
T415
T366
T335
T385
T411
♦
T345
♦
T381
♥
T394
♥
♥
T372T354♥
♦
♦
T346
T342
♥
♦
♥
♥
♦
T391♥T373♥
♦
♦
♥
♥T424
T425
♥
♦
T426
♦
Waveshape Factor (Ks)
♥♦♦♦♦♦♦♦♦♦
♦♦♦♦♦
♦♦
Wid
th/L
engt
h R
atio
020
4060
80100
120140
160
0
5
10
15
20
25
30
35
400
1
2
3
4
5
6
T396
T431
T365
T393
T414
T433
T383
T341
T323♥♥
♥
T335T412T385
T392♥
♥
T355
T394
♥
♥
T325
T376
♥
♥♥
♥
♥♥
♥T342♥
T381
T332
T411
♥
♥
T345
♥
♥
♥
T324♥T372
Time/min
♥♥
♦
T391
♦♦
♦
♥
T333
♦
♥
♦♦
♦
♦♦
♦
♦♦
♦
♦
♦♦♦♦♦
♦
♦♦♦♦
♦
T366
T415
♦♦
♦
T425
T381
♥♦
♥
♦
T354
♦♦
♥T346
♦
♦
♥T426
THD %
♥
♦
♦♦♦♦
♦
Wid
th/L
engt
h R
atio
T323-09-NT324-13-NT325-09-NT331-13-NT332-07-NT333-11-NT335-12-NT341-08-NT342-12-NT343-07-NT344-09-NT345-11-NT346-01-NT354-01-NT355-07-NT363-13-NT365-08-NT366-01-NT372-11-NT373-12-NT374-08-NT376-13-NT381-09-NT382-01-NT383-07-NT385-12-NT391-11-NT392-08-NT393-13-NT394-12-NT396-07-NT411-11-NT412-09-NT414-08-NT415-01-NT423-13-NT424-12-NT425-11-NT426-01-NT431-07-NT433-08-N
Plot A - THD
Plot B - Ks
♥= breakdown
♦= touch ground electrode (L=2mm)
Waveshape Factor (Ks) Figure 3. Plot A shows the ratio of width/length as a function of THD while Plot B shows the ratio as a function of Ks. The symbol ♦ denotes the instant the electrical tree first traversed the insulation gap, reaching the ground electrode while the symbol ♥ represents the time of electrical breakdown.
Tree growth measurements may be complimented by electroluminescence measurements to support this claim [21]. The applied constant voltage of 14.4 kV peak was consistent with previous studies conducted [17-19] but
may be too high for the waveshape factor to have a detectable influence on the tree growth. This voltage level was justified as it allowed significant growth and breakdown activity in the 2.5 hour duration, facilitating
S. Bahadoorsingh and S. M. Rowland: Investigating the Impact of Harmonics on the Breakdown of Epoxy Resin 1580
numerous experiments. Further work should employ lower voltages for increased durations for the growth of the electrical trees subjected to the composite waveforms.
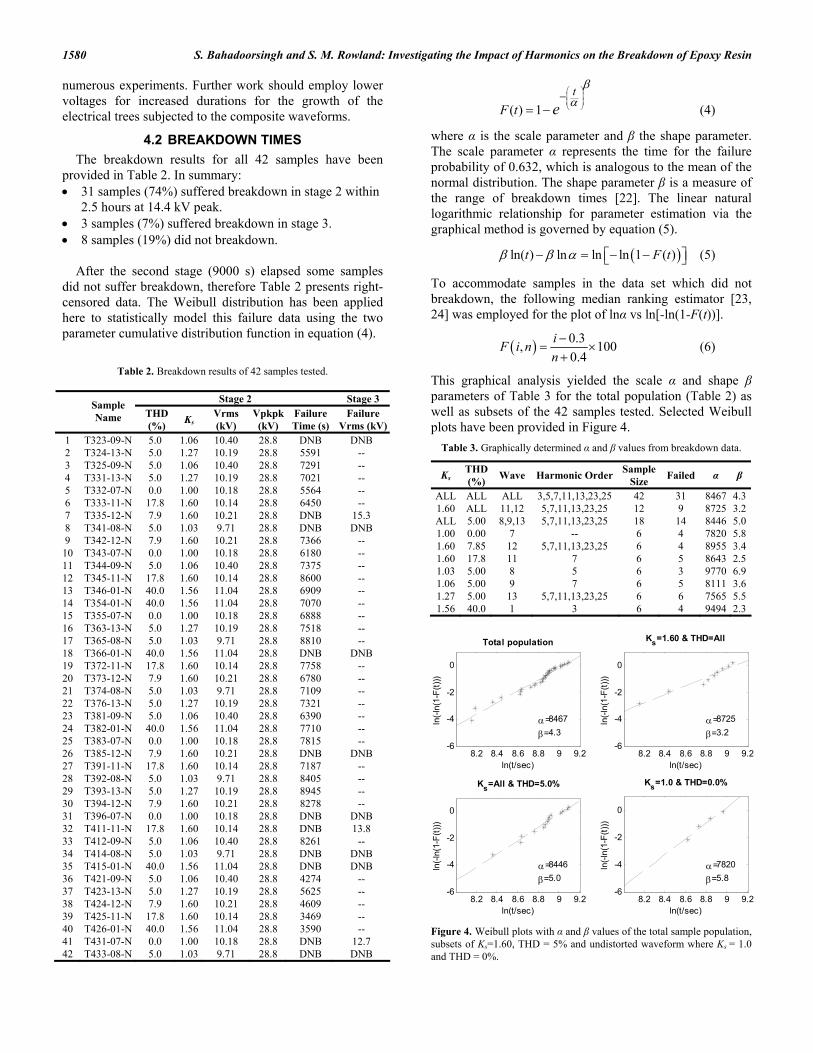
4.2 BREAKDOWN TIMES The breakdown results for all 42 samples have been
provided in Table 2. In summary: • 31 samples (74%) suffered breakdown in stage 2 within
2.5 hours at 14.4 kV peak. • 3 samples (7%) suffered breakdown in stage 3. • 8 samples (19%) did not breakdown.
After the second stage (9000 s) elapsed some samples did not suffer breakdown, therefore Table 2 presents right-censored data. The Weibull distribution has been applied here to statistically model this failure data using the two parameter cumulative distribution function in equation (4).
Table 2. Breakdown results of 42 samples tested.
Stage 2 Stage 3 Sample
Name THD (%) Ks
Vrms (kV)
Vpkpk (kV)
Failure Time (s)
Failure Vrms (kV)
1 T323-09-N 5.0 1.06 10.40 28.8 DNB DNB 2 T324-13-N 5.0 1.27 10.19 28.8 5591 -- 3 T325-09-N 5.0 1.06 10.40 28.8 7291 -- 4 T331-13-N 5.0 1.27 10.19 28.8 7021 -- 5 T332-07-N 0.0 1.00 10.18 28.8 5564 -- 6 T333-11-N 17.8 1.60 10.14 28.8 6450 -- 7 T335-12-N 7.9 1.60 10.21 28.8 DNB 15.3 8 T341-08-N 5.0 1.03 9.71 28.8 DNB DNB 9 T342-12-N 7.9 1.60 10.21 28.8 7366 -- 10 T343-07-N 0.0 1.00 10.18 28.8 6180 -- 11 T344-09-N 5.0 1.06 10.40 28.8 7375 -- 12 T345-11-N 17.8 1.60 10.14 28.8 8600 -- 13 T346-01-N 40.0 1.56 11.04 28.8 6909 -- 14 T354-01-N 40.0 1.56 11.04 28.8 7070 -- 15 T355-07-N 0.0 1.00 10.18 28.8 6888 -- 16 T363-13-N 5.0 1.27 10.19 28.8 7518 -- 17 T365-08-N 5.0 1.03 9.71 28.8 8810 -- 18 T366-01-N 40.0 1.56 11.04 28.8 DNB DNB 19 T372-11-N 17.8 1.60 10.14 28.8 7758 -- 20 T373-12-N 7.9 1.60 10.21 28.8 6780 -- 21 T374-08-N 5.0 1.03 9.71 28.8 7109 -- 22 T376-13-N 5.0 1.27 10.19 28.8 7321 -- 23 T381-09-N 5.0 1.06 10.40 28.8 6390 -- 24 T382-01-N 40.0 1.56 11.04 28.8 7710 -- 25 T383-07-N 0.0 1.00 10.18 28.8 7815 -- 26 T385-12-N 7.9 1.60 10.21 28.8 DNB DNB 27 T391-11-N 17.8 1.60 10.14 28.8 7187 -- 28 T392-08-N 5.0 1.03 9.71 28.8 8405 -- 29 T393-13-N 5.0 1.27 10.19 28.8 8945 -- 30 T394-12-N 7.9 1.60 10.21 28.8 8278 -- 31 T396-07-N 0.0 1.00 10.18 28.8 DNB DNB 32 T411-11-N 17.8 1.60 10.14 28.8 DNB 13.8 33 T412-09-N 5.0 1.06 10.40 28.8 8261 -- 34 T414-08-N 5.0 1.03 9.71 28.8 DNB DNB 35 T415-01-N 40.0 1.56 11.04 28.8 DNB DNB 36 T421-09-N 5.0 1.06 10.40 28.8 4274 -- 37 T423-13-N 5.0 1.27 10.19 28.8 5625 -- 38 T424-12-N 7.9 1.60 10.21 28.8 4609 -- 39 T425-11-N 17.8 1.60 10.14 28.8 3469 -- 40 T426-01-N 40.0 1.56 11.04 28.8 3590 -- 41 T431-07-N 0.0 1.00 10.18 28.8 DNB 12.7 42 T433-08-N 5.0 1.03 9.71 28.8 DNB DNB
( ) 1 αβ
⎛ ⎞⎜ ⎟⎜ ⎟⎝ ⎠
−= −
tF t e (4)
where α is the scale parameter and β the shape parameter. The scale parameter α represents the time for the failure probability of 0.632, which is analogous to the mean of the normal distribution. The shape parameter β is a measure of the range of breakdown times [22]. The linear natural logarithmic relationship for parameter estimation via the graphical method is governed by equation (5).
( )ln( ) ln ln ln 1 ( )β β α− = − −⎡ ⎤⎣ ⎦t F t (5)
To accommodate samples in the data set which did not breakdown, the following median ranking estimator [23, 24] was employed for the plot of lnα vs ln[-ln(1-F(t))].
( ) 0.3, 1000.4
iF i nn−
= ×+
(6)
This graphical analysis yielded the scale α and shape β parameters of Table 3 for the total population (Table 2) as well as subsets of the 42 samples tested. Selected Weibull plots have been provided in Figure 4.
Table 3. Graphically determined α and β values from breakdown data.
Ks THD (%) Wave Harmonic Order Sample
Size Failed α β
ALL ALL ALL 3,5,7,11,13,23,25 42 31 8467 4.31.60 ALL 11,12 5,7,11,13,23,25 12 9 8725 3.2ALL 5.00 8,9,13 5,7,11,13,23,25 18 14 8446 5.01.00 0.00 7 -- 6 4 7820 5.81.60 7.85 12 5,7,11,13,23,25 6 4 8955 3.41.60 17.8 11 7 6 5 8643 2.51.03 5.00 8 5 6 3 9770 6.91.06 5.00 9 7 6 5 8111 3.61.27 5.00 13 5,7,11,13,23,25 6 6 7565 5.51.56 40.0 1 3 6 4 9494 2.3
8.2 8.4 8.6 8.8 9 9.2-6
-4
-2
0
ln(t/sec)
ln(-l
n(1-
F(t))
)
Total population
β=4.3α=8467
8.2 8.4 8.6 8.8 9 9.2-6
-4
-2
0
ln(t/sec)
ln(-l
n(1-
F(t))
)
Ks=1.60 & THD=All
β=3.2α=8725
8.2 8.4 8.6 8.8 9 9.2-6
-4
-2
0
ln(t/sec)
ln(-l
n(1-
F(t))
)
Ks=All & THD=5.0%
β=5.0α=8446
8.2 8.4 8.6 8.8 9 9.2-6
-4
-2
0
ln(t/sec)
ln(-l
n(1-
F(t))
)
Ks=1.0 & THD=0.0%
β= 5.8α=7820
Figure 4. Weibull plots with α and β values of the total sample population, subsets of Ks=1.60, THD = 5% and undistorted waveform where Ks = 1.0 and THD = 0%.

IEEE Transactions on Dielectrics and Electrical Insulation Vol. 17, No. 5; October 2010 1581
Figure 5. The probability density and cumulative distribution function plots are similar shapes except wave 8 and wave 1 which correspond to minimum and maximum β values respectively containing the highest α values. Inset at T < 4000 s wave 11 (7th harmonic – THD 17.8% and Ks = 1.6) shows earliest failures.
In Figure 5, the calculated scale α and shape β parameters have been used to plot the modeled density and cumulative distribution curves. Since the maximum experiment time = 9000 s (2.5 hr), extrapolation occurs beyond 9000 s.
Figure 5 shows the mean estimates (50 percentile) of the probability density functions closely clustered, providing very limited information in comparison to the width distributions which are described by the shape parameter β. High values of β imply a low degree of data variability [25], depicted as repeatable breakdown times, representative of a consistent ageing process.
The sample sizes used for subsets Ks = 1.6 and THD = 5.0% were 12 and 18 respectively and were sufficient for credible results. A sample size less than five can lead to erroneous estimation of these parameters [22]. Hence with a marginal sample size of six for the remaining subsets, there exists some uncertainty in the results of those parameters estimated as illustrated in Figure 6.
Figure 6 provides the 90% confident intervals for the determined α and β parameters, calculated using the guidelines the IEEE Guide for the Statistical Analysis of Electrical Insulation Data [22]. An increase of the sample size is the best avenue to address this uncertainty. Alternatively, application of techniques to determine unbiased estimates of these parameters can be employed [26, 27].
ALL 11,12 8,9,13 7 12 11 8 9 13 10
10
20
30
40
Waveforms
Sha
pe P
aram
eter
β
90% confidence Interval for β
ALL 11,12 8,9,13 7 12 11 8 9 13 10.6
0.8
1
1.2
1.4x 10⁴
Waveforms
Sca
le P
aram
eter
α
90% confidence Interval for α
Figure 6. 90% confidence intervals for α (top) and β (below) parameters.
5 DISCUSSION A graphical summary of all determined Weibull
parameters as functions of Ks and THD is provided in Figure 7.
0 2000 4000 6000 8000 10000 12000 14000 16000 180000
1
2
x 10-4
Time (s)
Probability Density Function
Ks= All THD= 5.00%
Ks= 1.60 THD= All
Total population
0 2000 4000 6000 8000 10000 12000 14000 16000 180000
0.2
0.4
0.6
0.8
1
Time (s)
Cumulative Distribution Function
0 1000 2000 3000 40000
0.05
0.1
0.15
0.2
Ks= All THD= 5.00%Total populationKs= 1.60 THD= All Ks= All THD= All α= 8467 β =4.3
Ks= 1.60 THD= All Wave 11,12 α= 8725 β =3.2
Ks= All THD= 5.00% Wave 8,9 13 α= 8446 β =5.0
Ks= 1.00 THD= 0.00% Wave 7 α= 7820 β =5.8
Ks= 1.60 THD= 7.85% Wave 12 α= 8955 β =3.4
Ks= 1.60 THD= 17.8% Wave 11 α= 8643 β =2.5
Ks= 1.03 THD= 5.00% Wave 8 α= 9770 β =6.9
Ks= 1.06 THD= 5.00% Wave 9 α= 8111 β =3.6
Ks= 1.27 THD= 5.00% Wave 13 α= 7565 β =5.5
Ks= 1.56 THD= 40.0% Wave 1 α= 9494 β =2.3
0 2000 4000 6000 8000 10000 12000 14000 16000 180000
Time (s)

S. Bahadoorsingh and S. M. Rowland: Investigating the Impact of Harmonics on the Breakdown of Epoxy Resin 1582
20003000400050006000700080009000
10000
ALL ALL 1.00 1.03 1.06 1.27 1.56 1.60 1.60 1.602.0
3.0
4.0
5.0
6.0
7.0
8.0ALL 8,9,13 7 8 9 13 1 11,12 12 11
Plot of α and β as a function of KsSc
ale
para
met
er α
Shap
e pa
ram
eter
β
Ks □ α ♦ β
20003000400050006000700080009000
10000
ALL ALL 0.0 5.0 5.0 5.0 5.0 7.85 17.8 40.02.0
3.0
4.0
5.0
6.0
7.0
8.0ALL 11,12 7 8,9,13 8 9 13 12 11 1
THD (%) □ α ♦ βSh
ape
para
met
erβ
Scal
e pa
ram
eter
α
Plot of α and β as a function of THD
Waveforms
Waveforms
Figure 7. Graphical summary of α and β relationship as a function of Ks (top) and THD (below).
The Weibull shape parameter estimated for all 42 test
samples yielded βALL = 4.3. A reduction of 25.5% resulted with β11,12 = 3.2, for 3% reduction in α when the subset of waves 11 and 12 were analyzed collectively (for Ks = 1.60 and THD = 17.8% and 7.85% respectively). When waves 8, 9 and 13 were analyzed collectively for THD = 5% and Ks = 1.03, 1.06 and 1.27 respectively, there was an increase of 14% in the shape parameter resulting in β8,9,13 = 5.0. Notably variation of scale parameter values was only ≈ 3.2.
The subset of waves 11 and 12 were analyzed separately with THD = 17.8% and 7.85% respectively, for Ks = 1.60. Separately β11 = 2.5, and β12 = 3.4, hence the shape parameter β increased as THD decreased with only 3% variation in α. Additionally, the THD values were significantly higher in wave 1 at 40.0% resulting in β1 = 2.3. These observations confirm that electrical treeing in a significantly distorted environment where the THD is beyond the recommended level outlined in [12] will consequently reduce operational life, suggesting a variation in the insulation ageing process. Conversely, electrical treeing in an undistorted environment of the fundamental power frequency only (wave 7) will yield relatively increased operational life, where β7 = 5.8. This observation is consistent with previous studies in distorted environments for electrical treeing [3] and other mechanisms of insulation ageing [2, 4, 5, 7, 13, 28].
The undistorted waveform (wave 7) yielded β7 = 5.8 and α7 = 7820, while wave 8 yielded β8 = 6.9 and α8 = 9770. Wave 8 resulted in a lower rms voltage of 9.71 kV rms in comparison to wave 7 with 10.18 kV rms. Despite both being statistically weak analyses (only three of six samples failed), this implied that waveforms with low tolerable THD and Ks indices yield increased shape parameters (relative to
undistorted waveforms), provided the distortion decreased the rms index. This suggests, the amalgamated effect of some harmonic combinations can prolong insulation life. This was characteristic of the isolated 5th harmonic.
A discrepancy was observed with the collective results from waves 8, 9 and 13 compared with the isolated results from these waveforms as seen in Table 4. Collectively β8,9,13 = 5.0 with THD constant at 5%. Individually, β8 = 6.9, β9 = 3.6 and β13 = 5.5 where Ks
8 ≤ Ks9 ≤ Ks
13. A proportional trend for Ks with β (as previously observed for THD with β) might have been expected to yield β8 ≤ β9 ≤ β13, instead the results attained were β9 ≤ β13 ≤ β8.
Table 4. Comparison of the 5th and 7th harmonic influence on β values.
Wave Harmonic Order Ks
Vrms (kV)
Harmonic (%) β Samples
Failed 7 1 1.00 10.00 --- 5.8 4 8 5 1.03 9.71 5.00 6.9 3 9 7 1.06 10.40 5.00 3.6 5 13 5,7,11,13,23,25 1.27 10.19 2.00 5.5 6
The value of β9 = 3.6 (7th harmonic) appears anomalous
and requires further investigation. We make the following observations: • Waves 8 and 9 have identical THD levels of 5% but with ∆Ks ≈ 3%, and resulting β8 = 6.9 and β9 = 3.6, i.e. ∆β ≈ 48% as illustrated in Table 4. The rms value of wave 8 was the lowest compared to wave 7 (undistorted), wave 9 and wave 13 which were all at the same peak voltage. Wave 8 (5th harmonic) appeared least detrimental having the lowest sample failure rate (50%) and the highest β value (β8 = 6.9). Additionally, the rms value of wave 9 (7th harmonic) was the highest and resulted in a significantly reduced β value (β9 = 3.6). Wave 13 characterized by THD = 5% contained both 5th and 7th harmonic components and resulted in β13 within the range β9 ≤ β13 ≤ β8. There is therefore the need to further investigate the impact of the 7th harmonic as it appears more influential than the 5th harmonic for breakdown due to electrical treeing at constant peak voltage. Notably, the shortest breakdown times (including electrical treeing) at constant rms voltage were also functions of the 7th harmonic [2, 3].
• An increase in the 7th harmonic magnitude resulted in a reduction of the shape parameter. This was independent of the other harmonics present as illustrated in Table 5.
• During the tests using waves 9 and 11, five of the six samples tested failed, within the 2.5 hour duration of stage two giving similar levels of confidence in these results.
Table 5. Influence of 7th harmonic magnitude on β values.
Wave Harmonic Order
Magnitude of 7th Harmonic (%)
Shape Parameter β
13 5,7,11,13,23,25 2.00 5.5 9 7 5.00 3.6 12 5,7,11,13,23,25 13.2 3.4 11 7 17.8 2.5
IEEE Transactions on Dielectrics and Electrical Insulation Vol. 17, No. 5; October 2010 1583
6 CONCLUSIONS There is no detectable change in the electrical tree
growth characteristics using the width/length ratio in epoxy resin due to variation in harmonic content at a constant peak voltage of 14.4 kV. Further investigation using improved optics, capturing electroluminescence activity, lower voltage levels and increased duration for experiments are recommended.
Statistical analysis of breakdown times at approximately constant Ks and increasing THD yielded reduced Weibull shape parameters indicating increased early failure rates despite less than 10% variation in the respective Weibull scale parameters. This cannot be confirmed for constant THD and increasing Ks. This is summarized in Table 6.
Table 6. Variation in Weibull α and β values highlighting the 5th percentile of breakdown times of Ks and THD indices for each composite waveform. An increase in Ks or THD yields reduced β values.
Ks % THD Wave α β 5th Percentile (s) 1.60 7.85 12 8955 3.4 3740 1.60 17.8 11 8643 2.5 2640 1.56 40.0 1 9494 2.3 2610 1.03 5.00 8 9770 6.9 6360 1.06 5.00 9 8111 3.6 3560 1.27 5.00 13 7565 5.5 4410
The work reported here confirms that electrical treeing in a distorted environment exceeding THD standards [12] will ultimately reduce the operational life of the insulation. In particular, the waveforms employed in this study containing the 7th harmonic produced low Weibull shape parameters, β ≤ 3.6 for breakdown times due to electrical treeing at constant peak voltage, suggesting it (7th harmonic) is more detrimental to insulation life than the 5th harmonic (β = 6.9). However, physically this must be interpreted in the time domain considering the resulting impact of rate of change of applied voltage within each cycle on partial discharge incidence.
ACKNOWLEDGMENT This work is funded through the EPSRC Supergen V,
UK Energy Infrastructure (AMPerES) grant in collaboration with UK electricity network operators working under Ofgem's Innovation Funding Incentive scheme; - full details on http://www.supergen-amperes.org
REFERENCES [1] A. Kusko and M. T. Thompson, Power quality in electrical
systems. New York: McGraw-Hill, 2007. [2] R. Bozzo, C. Gemme, F. Guastavino, and G. C. Montanari,
"Investigation of aging rate in polymer films subjected to surface discharges under distorted voltage", IEEE Conf. Electr. Insul. Dielectr. Phenomena (CEIDP), Minneapolis, USA, pp. 435-438, 1997.
[3] F. Guastavino, L. Centurioni, G. Coletti, A. Dardano, and E. Torello, "An experimental study about the treeing phenomena in XLPE subjected to distorted voltages", IEEE Conf. Electr. Insul. Dielectr. Phenomena (CEIDP), Albuquerque, USA, pp. 600-603, 2003.
[4] D. Fabiani and G. C. Montanari, "The effect of voltage distortion on ageing acceleration of insulation systems under partial discharge activity", IEEE Electr. Insul. Mag., Vol. 17, No. 3, pp. 24 - 33 2001.
[5] G. C. Montanari and D. Fabiani, "The effect of non-sinusoidal voltage on intrinsic aging of cable and capacitor insulating materials", IEEE Trans. Dielectr. Electr. Insul., Vol. 6, pp. 798 - 802, 1999.
[6] A. Cavallini, D. Fabiani, G. Mazzanti, G. C. Montanari, and A. Contin, "Voltage endurance of electrical components supplied by distorted voltage waveforms", IEEE Intern. Sympos. Electr. Insul., Anaheim, California, USA, pp. 73-76, 2000.
[7] P. Caramia, G. Carpinelli, P. Verde, G. Mazzanti, A. Cavallini, and G. C. Montanari, "An approach to life estimation of electrical plant components in the presence of harmonic distortion", Intern. Conf. Harmonics and Quality of Power, Orlando, USA, pp. 887-892, 2000.
[8] A. Cavallini, G. Mazzanti, G. C. Montanari, and D. Fabiani, "The effect of power system harmonics on cable endurance and reliability", IEEE Industr., Appl. Soc. Annual Meeting, Rome, Italy, pp. 240-247, 2000.
[9] G. Mazzanti, G. Passarelli, A. Russo, and P. Verde, "The effects of voltage waveform factors on cable life estimation using measured distorted voltages", IEEE Power Engineering Soc. General Summer Meeting, Quebec, Canada, pp. 1-8, 2006.
[10] D. W. Auckland, J. M. Cooper, and B. R. Varlow, "Factors affecting electrical tree testing", IEE Proc. Sci., Measurement and Technology, Vol. 139, pp. 9-13, 1992.
[11] X. Zheng, G. Chen, A. E. Davies, S. J. Sutton, and S. G. Swingler, "The influence of survival mechanical stress and voltage frequency on electrical tree in XLPE", IEEE Conf. Electr. Insul. Dielectr. Phenomena (CEIDP), Cancun, Mexico, pp. 955-958, 2002.
[12] IEEE, "Std 519-1992, IEEE recommended practices and requirements for harmonic control in electrical power systems", 1992.
[13] G. C. Montanari and D. Fabiani, "Searching for the factors which affect self-healing capacitor degradation under non-sinusoidal voltage", IEEE Trans. Dielectr. Electr. Insul., Vol. 6, pp. 319-325, 1999.
[14] S. Bahadoorsingh and S. M. Rowland, "Investigating the influence of the lubricant coating on hypodermic needles on electrical tree characteristics in epoxy resin", IEEE Trans. Electr. Insul.,Vol. 17, pp. 703-710, 2010.
[15] M. Negnevitsky, J. V. Milanovic, T. Nguyen, and P. Rayner, "Power quality collaborative project in Tasmania", Power Quality, 1998, pp. 1-6.
[16] J. V. Milanovic and M. Negnevitsky, "Power quality problems and solutions: current understanding", Intern. Conf. Harmonics and Quality of Power, Vol. 1, 1998, pp. 30-35.
[17] H.-Z. Ding and B. R. Varlow, "Electrical treeing studies on the Araldite LY/HY 5052 epoxy resin over a wide range of stressing voltage", IEEE Conf. Electr. Insul. Dielectr. Phenomena (CEIDP), Boulder, USA, pp. 306-309, 2004.
[18] H. Z. Ding and B. R. Varlow, "Thermodynamic model for electrical tree propagation kinetics in combined electrical and mechanical stresses", IEEE Trans. Dielectr. Electr. Insul., Vol. 12, pp. 81-89, 2005.
[19] H. Z. Ding and B. R. Varlow, "The effect of material age on electrical tree growth in mechanically prestressed fibre-reinforced composite insulations", IEEE Intern. Conf. Properties and Applications of Dielectric Materials, pp. 940-943, 2003.
[20] J. V. Champion and S. J. Dodd, "The effect of voltage and material age on the electrical tree growth and breakdown
S. Bahadoorsingh and S. M. Rowland: Investigating the Impact of Harmonics on the Breakdown of Epoxy Resin 1584
characteristics of epoxy resins", J. Phys. D: Appl. Phys., Vol. 28, pp. 398-407, 1995.
[21] S. Bahadoorsingh and S. M. Rowland, "A framework linking knowledge of insulation ageing to asset management", IEEE Electr. Insul. Mag., Vol. 24, Issue 3, pp. 38-46, 2008.
[22] "IEEE Std 930-2004 Guide for the Statistical Analysis of Electrical Breakdown Data.
[23] J. C. Fothergill, "Estimating the cumulative probability of failure data points to be plotted on Weibull and other probability paper", IEEE Trans. Electr. Insul., Vol. 25, pp. 489-492, 1990.
[24] L. A. Dissado and J. C. Fothergill, Electrical Degradation and Breakdown in Polymers. London, U.K.: P. Peregrinus on behalf of the Institution of Electrical Engineers, 1992.
[25] ReliaSoft, "A high value of beta is not necessarily cause for concern", Reliability Edge, Vol. 2, p. 10, 2001.
[26] J. S. White, "The Moments of Log-Weibull Order Statistics," Technometrics, Vol. 11, pp. 373-386, 1969.
[27] G. C. Montanari, G. Mazzanti, M. Cacciari, and J. C. Fothergill, "Optimum estimators for the Weibull distribution of censored data: singly-censored tests", IEEE Trans. Dielectr. Electr. Insul., Vol. 4, pp. 462-469, 1997.
[28] A. Cavallini, D. Fabiani, G. Mazzanti, and G. C. Montanari, "Models for degradation of self-healing capacitors operating under voltage distortion and temperature", IEEE Intern. Conf. Properties and Applications of Dielectric Materials (ICPADM), Xi'an, China, 2000, pp. 108-111.
Sanjay Bahadoorsingh (S’03-M’09) was born in Port of Spain, Trinidad. He completed the B.Sc. degree in electrical and computer engineering from the University of The West Indies, St Augustine Campus in 2003 and the M.Sc. degree in power system engineering and economics from UMIST in 2005. In 2009, he completed the Ph.D. degree at the University of Manchester where he is currently employed as a Research Associate. His areas of
research are asset management and dielectric ageing.
Simon M. Rowland (SM’07) was born in London, England. He completed the B.Sc. degree in physics at UEA and the Ph.D. degree at London University. He was awarded the IEE Duddell Premium in 1994 and became a FIEE in 2000. He has worked for many years on dielectrics and their applications. He has also been Operations and Technical Director multinational manufacturing companies. He joined The School of Electrical and Electronic Engineering in The University of
Manchester as a Senior Lecturer in 2003 and was appointed Professor of Electrical Materials in 2009. He is Vice-President Admin. of the IEEE Dielectric and Electrical Insulation Society.