Rutile and Ilmenite Placer Deposits Roseland … and Ilmenite Placer Deposits Roseland District,...
23
Rutile and Ilmenite Placer Deposits Roseland District, Nelson and Amherst Counties, Virginia By NORMAN HERZ, L. E. VALENTINE, and E. R. IBERALL CONTRIBUTIONS TO ECONOMIC GEOLOGY GEOLOGICAL SURVEY BULLETIN 1312-F Analyses of panned concentrates of heavy minerals from the Roseland district indicate the possibility of valuable placer deposits of titanium minerals UNITED STATES GOVERNMENT PRINTING OFFICE, WASHINGTON : 1970
-
Upload
phungnguyet -
Category
Documents
-
view
222 -
download
1
Transcript of Rutile and Ilmenite Placer Deposits Roseland … and Ilmenite Placer Deposits Roseland District,...
Rutile and Ilmenite Placer Deposits Roseland District, Nelson and Amherst Counties, VirginiaBy NORMAN HERZ, L. E. VALENTINE, and E. R. IBERALL
CONTRIBUTIONS TO ECONOMIC GEOLOGY
GEOLOGICAL SURVEY BULLETIN 1312-F
Analyses of panned concentrates of heavy minerals from the Roseland district indicate the possibility of valuable placer deposits of titanium minerals
UNITED STATES GOVERNMENT PRINTING OFFICE, WASHINGTON : 1970

UNITED STATES DEPARTMENT OF THE INTERIOR
WALTER J. HICKEL, Secretary
GEOLOGICAL SURVEY
William T. Pecora, Director
For sale by the Superintendent of Documents, U.S. Government Printing Office Washington, D.C. 20402

CONTENTS
Abstract_ ____________________Introduction. __________________General geology________________Methods of study.._____________Results of mineralogical analysis..
Rutile _ __________________Zircon.._ __________________Ilmenite.. _________________Magnetite_________________
Results of chemical analysis. Suggestions for further work.____References cited._______________
PageFl
13466777788
ILLUSTRATIONS
PagePLATE 1. Map showing sample location and heavy-mineral content
of panned concentrates from alluvium in present stream channels, Roseland district________________________._ In pocket
FIGURE 1. Index map of Virginia showing the Roseland district__-__ F2 2. Geologic sketch map of the Roseland district-.._._____ 6
TABLES
TABLE 1. Location and description of stream-placer samples.__________2. Results of analysis of heavy-mineral concentrates in stream-
placer samples ________________________________________3. Mean weight percents and standard deviations for rutile,
zircon, ilmenite, and magnetite in heavy-mineral concen trates in each sieve fraction by drainage area.____________
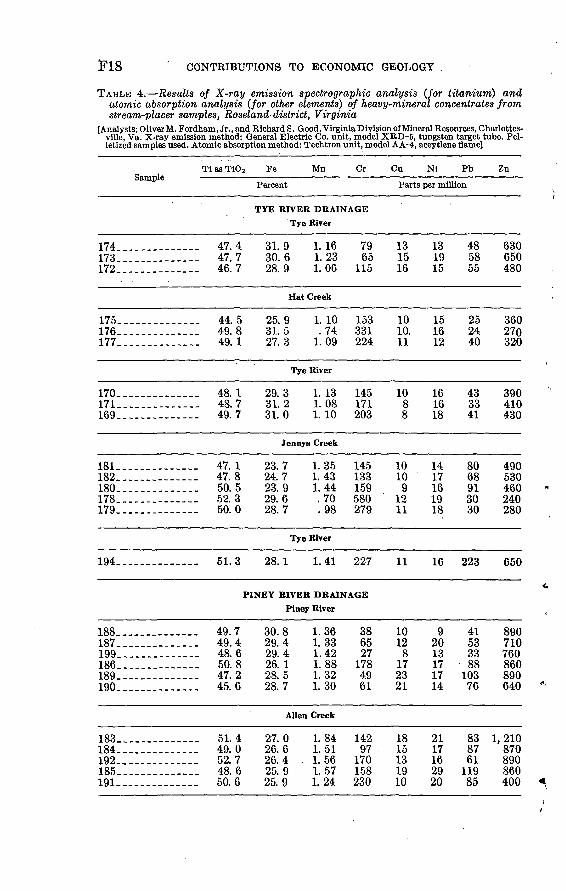
4. Results of X-ray emission spectrographic analysis (for titanium) and atomic absorption analysis (for other elements) of heavy-mineral concentrates from stream-placer samples __
5. Results of semiquantitative spectrographic analysis of six selected samples of heavy-mineral concentrates from stream- placer deposits -_----_-_-_----__-_-_-_____-_-__________
Page F9
14
17
18
19m


CONTRIBUTIONS TO ECONOMIC GEOLOGY
RUTILE AND ILMENITE PLACER DEPOSITS, ROSELAND DISTRICT, NELSON AND AMHERST COUNTIES, VIRGINIA
By NORMAN HERZ, L. E. VALENTINE, and E. R. IBERALL
ABSTRACT
The Roseland district, Virginia, has long been one of America's leading pro ducers of titanium minerals from both lode and saprolite deposits. Inasmuch as more than 20 million tons of saprolite ore is present in the area, it was conclud ed that placer deposits might have formed as a result of the winnowing of the saprolite by modern streams. To test this concept, 31 panned concentrates of heavy minerals were collected from alluvium in the Tye and Piney River drainage areas and analyzed for rutile, zircon, ilmenite, and magnetite. Rutile was found to be concentrated in the +40-mesh fraction, in which it averages 11.4 and 8.8 percent, respectively, in samples from the Tye and Piney River drainage areas. Ilmenite is abundant in all samples, from an average low in the Tye River area + 200-mesh fraction of 53.7 percent to a high in the Piney River area -{-100-mesh fraction of 76.5 percent. Zircon is largely concentrated in the -f 200-mesh fraction, and magnetite is present and generally has a low concentration in all samples.
The results indicate the possibility of valuable placer deposits of titanium minerals in large flood-plain and other alluvial deposits in the Roseland area; they also indicate that further exploration is warranted to determine their grade and tonnage.
INTRODUCTION
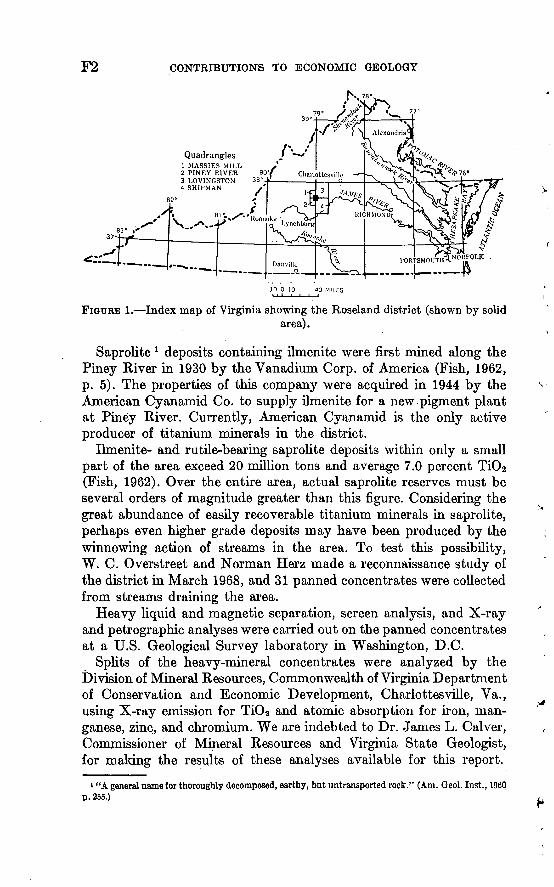
The Roseland district of Nelson and Amherst Counties, Virginia, has long been one of the world's most important sources of the titanium minerals ilmenite and rutile. The district is in the west- central part of Virginia about midway between Charlottesville and Lynchburg in the Piney River and Massies Mill 7^-niinute quad rangles and the Lovingston and Shipman 15-minute quadrangles (fig. 1). Mining in the area began in 1878 for iron, but it was ap parently unsuccessful because the nature of the ilmenite ore was not understood (Watson and Taber, 1913, p. 47-50). Beginning in the early part of this century, however, both rutile and apatite were mined, and soon the American Rutile Co. was supplying the entire world demand for rutile. Mining of rutile continued until 1949 when it was discontinued because of competition from Australian beach placer deposits.
Fl
F2 CONTRIBUTIONS TO ECONOMIC GEOLOGY
Quadrangles1 MASSIES MILL
JO 0 10 40 MILES
FIQXJRE 1. Index map of Virginia showing the Roseland district (shown by solidarea).
Saprolite * deposits containing ilmenite were first mined along the Piney River in 1930 by the Vanadium Corp. of America (Fish, 1962, p. 5). The properties of this company were acquired in 1944 by the American Cyanamid Co. to supply ilmenite for a new pigment plant at Piney River. Currently, American Cyanamid is the only active producer of titanium minerals in the district.
Ilmenite- and rutile-bearing saprolite deposits within only a small part of the area exceed 20 million tons and average 7.0 percent Ti02 (Fish, 1962). Over the entire area, actual saprolite reserves must be several orders of magnitude greater than this figure. Considering the great abundance of easily recoverable titanium minerals hi saprolite, perhaps even higher grade deposits may have been produced by the winnowing action of streams in the area. To test this possibility, W. C. Overstreet and Norman Herz made a reconnaissance study of the district in March 1968, and 31 panned concentrates were collected from streams draining the area.
Heavy liquid and magnetic separation, screen analysis, and X-ray and petrographic analyses were carried out on the panned concentrates at a U.S. Geological Survey laboratory in Washington, D.C.
Splits of the heavy-mineral concentrates were analyzed by the Division of Mineral Resources, Commonwealth of Virginia Department of Conservation and Economic Development, Charlottesville, Va., using X-ray emission for TiOg and atomic absorption for iron, man ganese, zinc, and chromium. We are indebted to Dr. James L. Calver, Commissioner of Mineral Resources and Virginia State Geologist, for making the results of these analyses available for this report.
» "A general name for thoroughly decomposed, earthy, but untransported rock." (Am. Geol. Inst., 1960 p. 255.)

RUTILE AND ILMENITE PLACER DEPOSITS, VIRGINIA F3
U.S. Geological Survey laboratories in Denver, Colo., analyzed splits of six samples by semiquantitative spectrographic methods.
The conclusion of the study is that valuable placer deposits of ilmenite and rutile may be present in the Roseland district, and that further exploration of flood-plain deposits is warranted to determine their grade and tonnage.
This study was carried out as part of a comprehensive research program authorized by the Office of Emergency Planning and under taken by the Department of the Interior under the Defense Produc tion Act for the purpose of developing a domestic source of rutile.
GENERAL GEOLOGY
The titanium deposits are associated with a northeast-trending anorthosite body about 8 miles long and 2% miles wide, which parallels the trend of Precambrian Piedmont structural features. This body is in or near the core of the Catoctin Mountain-Blue Ridge anticlinorium (a series of recumbent folds, overturned to the north west and trending northeast) and is part of the Virginia Blue Ridge complex of Brown (1958). The anticlinorium is bounded to the south east by the "Martic Line" and the James River synclinorium of younger Precambrian and lower Paleozoic(?) rocks (Brown, 1953). The northwest limb of the anticlinorium contains upper Precambrian and lower Paleozoic formations (Werner, 1966).
The Virginia Blue Ridge complex in the Roseland area is made up primarily of schists, granites, charnockites, gneisses, anorthosite and its associated rocks, and migmatites. The country rock gneisses are well foliated, medium to coarse grained, and porphyritic in places; they are composed largely of feldspar, quartz, and biotite, and contain some ilmenite, muscovite, and hornblende (Watson and Taber, 1913, p. 2,01). Bloomer and Werner (1955) divided the gneisses into two units the Lovingston Gneiss (contains large feldspathic augen) and the Marshall Gneiss (lacks conspicuous augen).
Hypersthene granodiorite, more correctly termed "charnockite," underlies much of the northwestern part of the Blue Ridge anti clinorium (Jonas, 1935) in Virginia and is either massive or layered in this area (Hillhouse, 1960). The layered variety is far more abundant and consists of alternating mafic-rich and quartz-feldspar-rich layers that average 10 centimeters in thickness. Fresh samples are composed of andesine antiperthite, microcline, andesine-oligoclase, quartz, and hypersthene. . :
The anorthosite consists largely of light-bluish-gray megacrysts of andesine antiperthite that are cut by zones of cream to white gran ulated feldspar (Ross, 1941). Charnockitic and mafic rocks occur as dikes and irregular patches and lenses throughout the .anorthosite

F4 CONTRIBUTIONS TO ECONOMIC GEOLOGY
body, but they are most abundant in its border zone. The border zone consists of charnockitic rocks and interlayered charnockite, anorthosite, mafic rocks, and gneiss; it ranges in width from 0 to about 1.6 miles but averages less than 0.6 mile, except on the south west border of the anorthosite body (fig. 2) where it is wider.
Nelsonite dikes, which consist essentially of ilmenite and apatite, are most abundant within the border zone (Watson and Tabor, 1913, p. 101). Some varieties of these nelsonite dikes are rich in rutile, magnetite, biotite, hornblende, or gabbro. The dikes range in width from a few inches to as much as 65 feet or more, and are as much as 2,000 feet long (Watson and Taber, 1913, p. 102). The dikes are younger than the anorthosite and its associated mafic rocks and are the source of the richest saprolite deposits of ilmenite (Fish and Swanson, 1964).
Apatite in the nelsonite is the fluorapatite variety and contains abundant cerium (700 ppm) and lanthanum (700 ppm) and elements of their rare-earth groups (Herz, 1969).
METHODS OF STUDY
The central and eastern parts of the anorthosite body are drained by the Tye River and its tributaries, especially Hat Creek and Jennys Creek (pi. 1). The western part of the anorthosite is drained by the Piney River and its tributaries, especially Alien Creek and Maple Run. Fifteen samples of stream alluvium were collected from the Tye River drainage system, including three on Hat Creek and five on Jennys Creek; and 16 from the Piney River system, including five on Alien Creek and three on Maple Run. One sample was obtained on Piney River 1.7 miles below its junction with Tye River (table 1).
The samples were taken from the upper 6-12 inches of riffles and bars in the beds of the streams. The riffle sand or gravel was shoveled wet into a 10-quart bucket (0.34 cu ft), and at each sample locality the bucket was filled so that the same volume of alluvium was always collected. The full sample was poured from the bucket through a sieve made of punch plate with Js-inch openings. Alluvium passing through the sieve was caught in a 16-inch prospector's pan and then shaken to make a concentrate. Later, in the laboratory, the dried concentrate was weighed (table 2). Heavy-mineral recovery by panning of riffle samples has been estimated as follows: Ilmenite, 64 percent; magnetite, 59 percent; rutile, 68 percent; and zircon, 72 percent (Theobald, 1957, p. 21). The total weight of the panned concentrates and the percentages of the recovered heavy minerals may thus be used to obtain qualitative data on the tenors of stream- bed materials; also, in conjunction with a study of aerial photographs, these data can be used to estimate lengths and widths of flood-plain

RUTILE AND ILMENITE PLACER DEPOSITS, VIRGINIA
79°00
F5
37°45
EXPLANATION
Nelsonite dikes
Inclined
Contact
VerticalX. 55
Anorthosite
Border zone of charnockitic rocks and interlayered charnockite, anorthosite, mafic rocks, and gneiss
Showing bearing _ of lineation Foliation
Pollution or compositional layering in. yneiss and charnockite; aheur planes or mafic dikes in anorthosite. Lineation in crinkling or mineral alinemciit
Augen gneiss, granitic gneiss, and biotite-quartz schist
FIGURE 2. Geologic sketch map of the Roseland district. Modified from Hillhouse(1960) and Herz (1969).
deposits and to identify areas where detailed sampling and drilling is justified (Overstreet and others, 1968).
In the laboratory the samples were first weighed dry and then sieved using standard sieve sizes of 40, 100, and 200 mesh. The light
1302-824 69 '2

F6 CONTRIBUTIONS TO ECONOMIC GEOLOGY -
minerals were separated from each sieve fraction with bromoform (sp gr 2.86). A hand magnet was passed through the heavy minerals to remove the magnetite, and then the heavy minerals were passed through a Frantz isodynamic separator to remove and concentrate ilmenite. The remaining nonmagnetic heavy fraction was examined with a binocular microscope to determine the mineral assemblage and was then X-rayed. Percentages of rutile and zircon were calcu lated from the X-ray data, and percentages of magnetite and ilmenite were calculated from the two magnetic separates (table 2).
RESULTS OF MINERALOGICAL ANALYSIS
Both table 2 and plate 1 show that all samples are enriched in ilmenite and that the greatest amounts of heavy minerals are con centrated in stream deposits in two general areas (1) the northeast border zone of the anorthosite body and (2) the southeast border zone of the anorthosite. A slight increase in total heavy-mineral content of stream deposits has also taken place in a southeasterly direction, which coincides with the major drainage direction. How ever, samples 194 and 195 about 2 and 4 miles, respectively, from the downstream contact of the anorthosite body have a.noticably lower content of heavy minerals than the samples in the contact area (table 2). This relation suggests that the heavy minerals have either remained close to their source or that physical changes, such as narrow valleys and high stream gradient downstream: from the contact, have prevented deposition of large amounts of heavy min erals in these areas.
Average mineral abundances and standard deviations for rutile, zircon, ilmenite, and magnetite are given in table 3 and are sum marized below.
BTJTILE
Rutile is strongly concentrated in the -j-40-mesh fraction, which implies that it is close to its source, inasmuch as the mineral is rather brittle and would have been further comminuted if it had been transported far. Average abundances are higher in the Tye River drainage area than in the Piney, but by far the greatest amounts of rutile are found in the Jennys Creek-Alien Creek area. Surprisingly, the Tye River south of Roseland does not have anomalously high amounts of rutile even though it drains the area of the old Roseland rutile mine. Rutile has been found at the Buffalo quarry near sample 184, in a mafic dike in anorthosite. From these data, it is apparent that the most important rutile mineralization is, in the southern, part of the anorthosite body, probably in dikes similar to the one in the Buffalo quarry; the mineral also occurs as disseminations in anorthosite.

RUTILE AND ILMENITE PLACER DEPOSITS, VIRGINIA F7
ZIRCON
Zircon is strongly concentrated in the +200-mesh fraction and does not appear to have been transported far. It is more abundant in the Tye Eiver drainage area than in the Piney. In samples that contain the greatest amount of heavy minerals., the percentage of zircon is generally low. The average zircon content for concentrates in the > 1,000-gram class is 1.4 percent; in the 400- to 999-gram class, 4.4 percent; in the 100- to 399-gram class, 3.9 percent; and in the <99-gram class, 3.9 percent. This size distribution suggests that most of the zircon is derived from schists and gneisses outside the anorthosite. Where large amounts of rutile and ilmenite were con tributed by anorthosite and related rocks, the absolute amount of zircon has remained the same; but the percentage of zircon has consequently decreased.
ILMENITE
Ilmenite makes up more than half the average content of all sieve fractions but it is most abundant in the -(-100-mesh fraction. Its abundance in every sample suggests that ilmenite-bearing rocks are widespread throughout the area. The source of large volumes of ilmenite in saprolite deposits has been assumed to be nelsonite dikes (Fish and Swanson, 1964), and these dikes may possibly be much more abundant than is presently known. As contrasted with rutile and zircon, ilmenite is somewhat more abundant in the Piney River drainage area than in the Tye River drainage area.
MAGNETITE
Magnetite shows no systematic distribution according to grain size, but its abundance bears an inverse relationship to the abundance of ilmenite. Except for sample 193, magnetite reaches its greatest abundance in concentrates from the Tye River drainage area. The local abundance of magnetite in the northern part of the anorthosite body, as well as its occurrence along the southeastern contact zone, is here interpreted to indicate that magnetite is derived largely from rock types associated with the anorthosite.
BESULTS OF CHEMICAL ANALYSIS
The results of analysis for some major and minor elements are given in tables 4 and 5. Gold content in six concentrates was determined in a U.S. Geo
logical Survey laboratory by both atomic absorption and fire assay; it was found to be below 0.05 ppm in all samples.
Chevkinite, a titanosilicate of the cerium metals, is reported to have been found as an isolated 20-pound mass on Hat Creek, near Massies

F8 CONTRIBUTIONS TO ECONOMIC GEOLOGY
Mill (Ford, 1932, p. 691). Ross (1941, p. 15) reported sphalerite in a small vein in Alien Creek half a mile southwest of Rose Union associated with quartz, pyrite, scarce galena, and a cobalt- and manganese-bearing clay (with a CoO content of 1.51 percent and an MnO+O content of 8.28 percent) that fills joint cracks in a nelsonite body mined by the Southern Minerals Corp. None of these mineral occurrences could be corroborated by X-ray analysis of the panned concentrates, although nearby samples do have highZn (table 4).
SUGGESTIONS FOR FURTHER WORK
The information obtained in this study on detrital ilmenite and rutile in stream placers in the Roseland district is considered to be only qualitative until more complete data are obtained on the volume and tenor of available alluvium. The data do not define commercial placers. It is a well-known characteristic of stream deposits that the concentration of heavy minerals in active riffle sediments tends to be greater than the concentration through the full sequence of flood-plain alluvium from grass roots to bedrock. The work does show, however, that these heavy minerals are abundant in riffle gravel and that valuable deposits may have been created by stream action in the Roseland district. Such deposits seem likely to consist largely of ilmenite, but, in places, rutile is also rather abundant. To fully evaluate the available resources of ilmenite and rutile, churn drilling and detailed mapping in stream valleys will have to be carried out to determine the actual area, volume, and tenor of the deposits; the depth to bedrock; and the nature of the alluvial material.
REFERENCES CITED
American Geological Institute, 1960, Glossary of geology and related sciences,with supplement [2d ed.]: Washington, Am. Geol. Inst., 325, 72 p.
Bloomer, R. 0., and Werner, H. J., 1955, Geology of the Blue Ridge region incentral Virginia: Geol. Soc. America Bull. v. 66, p. 579-606.
Brown, W. R., 1953, Structural framework and mineral resources of the VirginiaPiedmont: Kentucky Geol. Survey Spec. Pub. 1, p. 88-111.
1958, Geology and mineral resources of the Lynchburg quadrangle,Virginia: Virginia Div. Mineral Resources Bull, 74, 99 p.
Fish, G. E., Jr., 1962, Titanium resources of Nelson and Amherst Counties,Virginia {Pt.] 1, Saprolite ores: U.S. Bur. Mines Rept. Inv. 6094, 44 p.
Fish, G. E., Jr., and Swanson, V. F., 1964, Titanium resources of Nelson andAmherst Counties, Virginia [Pt.] 2, Nelsonite: U.S. Bur. Mines Rept.Inv. 6429, 25 p.
Ford, W. E., 1932, A textbook of mineralogy with an extended treatise on crystal lography and physical mineralogy, by Edward Salisbury Dana; 4th ed.revised and enlarged by W. E. Ford: New York, John Wiley & Sons, 851 p.
Herz, Norman, 1969, The Roseland alkalic anorthosite massif, Virginia, inIsachsen, Y. W., ed., The origin of anorthosite and related rocks: New YorkState Mus. and Sci. Service Mem. 18 (in press).

RUTILE AND ILMENTTE PLACER DEPOSITS, VIRGINIA F9
Hillhouse, D. N., 1960, Geology of the Piney River-Roseland titanium area, Nel son and Amherst Counties, Virginia: Virginia Polytechnic Inst., Blacksburg, Va., Ph. D. dissert. .
Jonas, A. I., 1935, Hypersthene granodiorite in Virginia: Geol. Soc. America Bull., v. 46, p. 47-59.
Nelson, W. A., 1928, Geologic map of Virginia: Virginia Geol. Survey. Scale 1:500,000.
Overstreet, W. C., White, A. M., Whitlow, J. W., Theobald, P. K., Jr., Caldwell, D. W., and Cuppels, N. P., 1968, Fluvial monazite deposits in the south eastern United States: U.S. Geol. Survey Prof. Paper 568, 85 p.
Ross, C. S., 1941, Occurrence and origin of the titanium deposits of Nelson and Amherst Counties, Virginia: U.S. Geol. Survey Prof. Paper 198, 59 p.
Theobald, P. K., Jr., 1957, The gold pan as a quantitative geologic tool: U.S. Geol. Survey Bull. 1071-A, 54 p. .
Watson, T. L., and Taber, Stephen, 1913, Geology of the titanium and apatite deposits of Virginia: Virginia Geol. Survey Bull. 3-A, 308 p.
Werner, H. J., 1966, Geology of the Vesuvius quadrangle, Virginia: Virginia Div. Mineral Resources Rept. Inv. 7, 53 p.
TABLE 1. Location and description of stream-placer samples, Roseland district,Virginia
[Samples collected by W. C. Overstreet and Norman Herz, March 1968. See fig. 3 for sample location]
Sample Quadrangle Description
TYE RIVER DRAINAGE
Tye River
174...... Massies Mill.... North of anorthosite contact and just downstreamfrom Cub Creek, 1.2 miles south of Tyro. River flowing swiftly over boulders, 8- to 20-in. in diameter common; sparse trails of black sand. Sample dug between boulders.
173_.__._ Lovingston__-_. 1 mile upstream from Lanes Ford. Gravel as muchas 4 in. in diameter, in riffle.
172___________do--------_ State Route 156, 2 miles southeast of Massies Mill.Very swift flowing stream; cobble-boulder riffle that contains .boulders as much as 18 in. in diameter. Sample contained cobbles as much as 7 in. in diameter.
Hat Creek
175_.___- Lovingston__._. 0.3 mile east of Bryant. Riffle gravel, maximumdiameter 5 in. Abundant black sand in 5-ft-wide streambed. Petrographic examination of the + 100-mesh fraction by J. W. Whitlow shows (1) nonmagnetic fraction rutile, fluorescent zircon, dark-gray to black ilmenite with many grains having a light-colored leucoxene alteration product; 20 percent light-colored fragments with

F10 CONTRIBUTIONS TO ECONOMIC GEOLOGY
TABLE 1. Location: and description of stream-placer samples, Roseland district,Virginia Continued
Sample Quadrangle , Description
TYE RIVER DRAINAGE Continued
Hat Creek Continued
darker cores (apatite?); traces of mica, sulfides, hematite, green mineral (not epidote); and questionable tantalite-columbite; (2) magnetic fraction magnetite and traces of ilmenite.
176_---_- Lovingston___._ East branch, 0.6 mile south of Shaeffer Hollow.Gravel as much as 5 in. in diameter. Stream 2^ ft wide. Black sand common on bed between cobbles.
177_-__-___-_-do-_-_-_--_ 0.8 mile southwest of Shaeffer Hollow road. Rifflegravel as much as 3 in. in diameter. Sand in stream rich in ilmenite and light-yellowish-green apatite.
Tye River
170______ Shipman.______ Near American Rutile Co. quarry at Roseland.Sample taken of riffle gravel at outside edge of river. Cobbles and boulders as much as 15 in. in diameter; sample contains cobbles as much as 5 in. in diameter.
171_____-_-_-_do-________ Same locality as for sample 170 but in slough thathas a fast current and 3-in. diameter cobbles.
Petrographic examination of the +100-mesh frac tion by J. W. Whitlow shows; (1) nonmagnetic fraction fluorescent zircon, rutile, gray to black
. ilmenite that has a light-colored leucoxene alter ation product; traces of hematite, epidote, garnet; an unidentified mineral; and questionable traces of monazite, xenotime, and staurolite; (2) magnetic fraction magnetite and trace of ilmenite.
169_._-___-_--do_____.___ Gaging station at State Route 158. Cobbles andsmall boulders as much as 14 in. in diameter; sample is riffle gravel as much as 4 in. in diameter. Black sand trails downstream from cobbles.
Jennys Creek
181.___._ _ Piney River.___ East branch, 2 ft wide, 0.3 mile west-southwest ofHendersons Store. Gravel has maximum diameterof 2 in., on gray clay botton.
182_._____.___.do._--.--__ West branch, 3 ft wide, 0.5 mile east of St. JamesChurch. Gravel has maximum diameter of 3 in.,on a clay bottom.
RUTILE AND ILMENITE PLACER DEPOSITS, VIRGINIA Fll
TABLE 1. ^Location and description of stream-placer sampks, Roseland district,Virginia Continued
Sample Quadrangle Description
TYE RIVER DRAINAGE Continued
Jennys Creek Continued
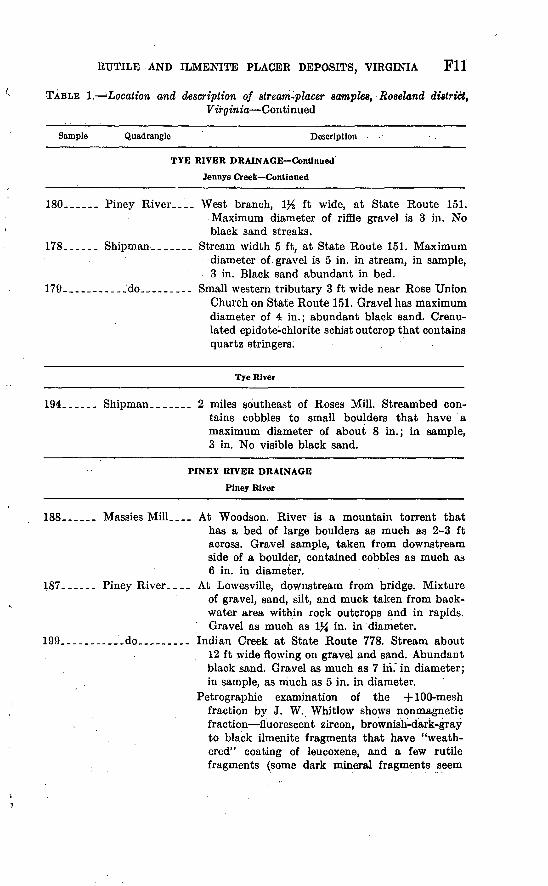
ISO-....- Piney River____ West branch, 1% ft wide, at State Route 151.Maximum diameter of riffle gravel is 3 in. No black sand streaks.
178--___- Shipman_______ Stream width 5 ft, at State Route 151. Maximumdiameter of gravel is 5 in. in stream, in sample, 3 in. Black sand abundant in bed.
179-------.___do_________ Small western tributary 3 ft wide near Rose UnionChurch on State Route 151. Gravel has maximum diameter of 4 in.; abundant black sand. Crenu- lated epidote-chlorite schist outcrop that contains quartz stringers! .
Tye River
194__-._- Shipman.______ 2 miles southeast of Roses Mill. Streambed con tains cobbles to small boulders that have a maximum diameter of about 8 in.; in sample, 3 in. No visible black sand.
PINEY RIVER DRAINAGE
Piney River
188------ Massies Mill____ At Woodson. River is a mountain torrent thathas a bed of large boulders as much as 2-3 ft across. Gravel sample, taken from downstream side of a boulder, contained cobbles as much as 6 in. in diameter.
187_-_-__ Piney River.___ At Lowesville, downstream from bridge. Mixtureof gravel, sand, silt, and muck taken from back water area within rock outcrops and in rapids. Gravel as much as 1% in. in diameter.
199__--_-_-___do---___-_- Indian Creek at State Route 778. Stream about12 ft wide flowing on gravel and sand. Abundant black sand. Gravel as much as 7 in. in diameter; in sample, as much as 5 in. in diameter.
Petrographic examination of the +100-mesh fraction by J. W. Whitlow shows nonmagnetic fraction fluorescent zircon, brownish-dark-gray to black ilmenite fragments that have "weath ered" coating of leucoxene, and a few rutile fragments (some dark mineral fragments seem

F12 : .CONTRIBUTIONS TO ECONOMIC GEOLOGY
TABLE l.^Locatiqnand description of stream-placer samples, Roseland district, Virginia Continued
Sample Quadrangle Description
soft and have a patina similar to cassiterite, whereas others are hard and brittle and have
. shiny fra ctures); traces of hematite, monazite or xenotime, sillimanite or actinolite, questionable tantalite-columbite, and other unidentified min erals were also found. The +200-mesh fraction contains fluorescent zircon, largely pink but some clear; ilmenite; questionable traces of monazite, sphene, and epidote; and traces of unidentified gray-brown to black minerals.
186...-__ Piney River____ Unnamed tributary, about 1.3 miles east of Lowes-ville. Stream, 1-2% ft wide, flows on gravel and sand overlying gray clay. Sample from gravel that has maximum diameter of about 4 in. No black sand streaks.
189. __________ do. ___-___. At Old Dominion quarry. Sample is contaminatedwith anorthosite fragments and dust from crushed rock operations. Gravelly sand has maximum diameter of % in.
190.-__-__._-_do_-_--___. At gaging station on State Route 151. Abundantcoarse sand-size quartz and feldspar grains from Old Dominion plant. Maximum diameter of gravel in sample is 3% in.
Alien Creek
183_--_-_ Piney River____ East branch, east fork, 0.8 miles west of St. JamesChurch. Creek flowing on outcrops of anorthosite and bed contains gravel as much as 1}£ in. in diameter.
184. _-_.,_ Piney River.___ East branch, west fork. Stream 2-7 ft wide flowson gravel that has a diameter of 4 in., sand and clay. No black sand streaks.
192___--______do.________ East branch at State Route 151. Stream flow issluggish; sample contains gravel that has a maximum diameter of 4 in. and an abundant red sand matrix. No black sand streaks.
185___----__-_do--------- West branch at State Route 676. Stream about 1 ftwide flowing on clay that contains sparse gravel as much as 1^_ in. in diameter. No black sand streaks.
191____-______do.-------- West branch at State Route 151. Stream about 1}_ft wide, flowing sluggishly. Cobbles and small boulders as much as 8 in. in diameter, on gray

RUTILE AND ILMENITE PLACER DEPOSITS, VIRGINIA F13
TABLE 1. Location and description of stream-placer samples, Roseland district,Virginia Continued
Sample Quadrangle Description
PINEY RIVER DRAINAGE Continued
Alien Creek Continued
clay. Sample has cobbles as much as 5 in. in diameter. No black sand streaks.
Maple Run
198_-___- Piney River.__. At State Route 778. Steam about 3K ft wideflowing over gravelly sand that has a maximum diameter of about % in. Abundant black sand streaks.
197_________-_do.________ At State Route 665. Sluggish stream about 4 ftwide flowing on gravelly sand that has a maxi mum diameter of 1% in. Abundant black sand in streambed.
196. _____-.--.do. ________ At State Route 151. Stream about 4% ft wideflowing on cobble gravel that has a maximum diameter of 2 in. Abundant black sand in streambed.
193_-_--_ Shipman.______ At Alien Creek-Piney River Junction (Roses Mill).Industrial waste from pigment plant causes red stain on pebbles and fine-grained black pre cipitate, possibly an iron sulfide, on streambed. Riffle gravel as much as 11 in. in diameter. Sample has abundant contaminant and gravel as much as 6 in. in diameter.
Petrographic examination of the +40-mesh fraction by J. W. Whitlow shows ilmenite, magnetite, light-colored silicate(?) minerals, and rutile; traces of fluorescent zircon, tantalite-columbite, monazite, xenotime, sulfides, mica, garnet(?) kyanite(?), and other minerals. The +100-mesh fraction is largely magnetic with magnetite and ilmenite; many fragments have an overgrowth that appears siliceous; and traces of other mineral were also found.
TYE-PINEY RIVER COMBINED DRAINAGE
195------ Shipman.______ In Tye River below U.S. Route 29. River dammedabout 600 ft downstream from highway bridge. Riffle gravel as much as 7 in. in diameter below dam (dam and flooded area not shown on pi. 1). Gravel sample as much as 3 in. in diameter. Red stain from industrial waste on pebbles.

F14 CONTRIBUTIONS TO ECONOMIC GEOLOGY
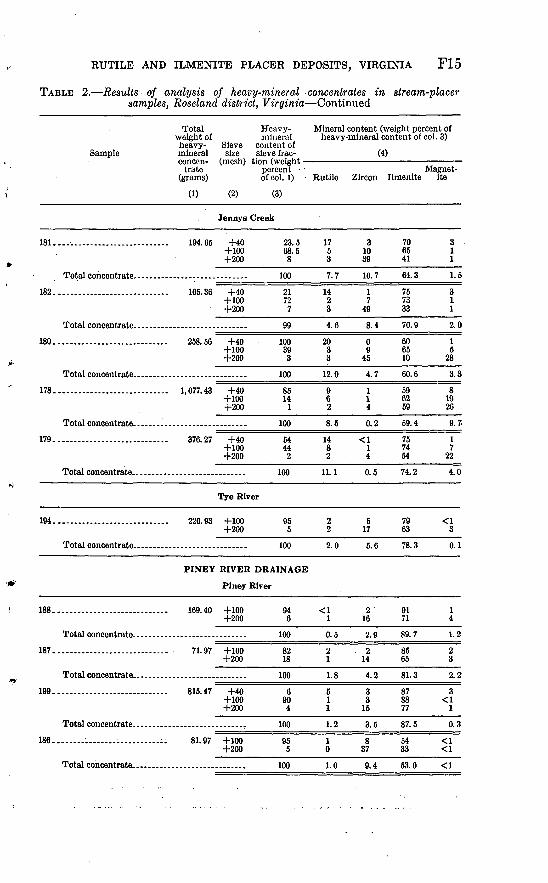
TABLE 2. Results of analysis of heavy-mineral concentrates in stream-placer samples, Roseland district, Virginia
Sample
Total Heavy weight of mineral heavy- Sieve content of mineral size sieve frac- concen- (mesh) tion (weight
trate percent(grams) of col. 1)
(1) (2) (3)
Mineral content (weight percent of heavy-mineral content of col. 3)
_____ (4) ______Magnet-
Rutile Zircon Ilmenite ite
TYE RIVER DRAINAGE
Tye River
174............................. 47.40 +100 83 2 1 73 2+200 17 2 9 68 4
Total concentrate......-...............- 100____2____2.4 72.2 2.3.
173............................. 46.95 +100 94 2 1 70 2+200 6 2 4 63 3
Total concentrate.-.....-....-.......--..--... 100____2 l.2 69.6____2.1
172............................. 75.91 +40 76 10 2 34 8+100 22 5 4 45 3+200 2 2 5 53 4
Total concentrate..........._............... 100 8.7 2.5 36.8 6.8.
Hat Creek
175............................. 1,008.72 +40 42 10 1 73 7+100 55 3 2 72 4+200 3 2 27 53 4
Total concentrate............................. 100 5.9 2.3 71.9 5.5
176............................. 1,008.94 +40 52 6 0 82 4+100 45 1 2 83 4+200 3 <1 8 77 8
Total concentrate.-.....-..--..-......-...-...____100____3.6 1.1___82.3 5.0<
177............................. 580.01 +40 26 9 <1 66 20+100 70 5 9 73 4+200 4 3 21 57 3
Total concentrate............................. 100 6.0 7.2 70.5 8.1
Tye River
170.... ...................... 409.53 +40 15 7 <1 73 14+100 82 2 4 70 13+200 3 2 15 61 9
Total concentrate............................. 100_____2.8 3.7 70.2 13. ft
171............................. 430.37 +40 .12 5 0 76 15+100 86 2 4 76 9+200______2_____2 17 59_____6
Total concentrate..-... ........-.........____100_____2.4 3.8 76.7____9.7
169............. ....... 1,066.46 +40 11 16 0 61 11+100 85 5 3 .61 16+200 4 2 19 54 19
'Total concentrate.. ........................ 100 6.1 3.3 60.7 15.6
RUTILE AND ILMENITE PLACER DEPOSITS, VIRGINIA F15
TABLE 2. Results of analysis of heavy-mineral concentrates in stream-placer samples, Roseland district, Virginia Continued
Sample
Totalweight ofheavy-mineralconcen
trate (grams)
(1)
Heavy- mineral
Sieve content of size sieve frac-
(mesh) tion (weight percent of col. 1)
(2) (3)
Mineral content (weight percent of heavy-mineral content of col. 3)
_________(4)________Magnet-
Rutile Zircon ILmenite ite
Jennys Creek
1.5
2.0
3.3
9.7.
4.0
181....- ................... 194.65 +40 23.5 17 3 70 3+100 68.5 5 10 65 1+200 8 3 39 41 1
Total concentrate-.....----..----.-----------____100_____7.7 10.7 64.3_____
182............................ 165.36 +40 21 14 1 75 3+100 72 2 7 73 1+200______7_____3 49 33 1
Total concentrate.-..........................____99____4.6___8.4 70.9____
180.. ..................... 258.56 +40 100 20 0 60 1+100 39 3 9 65 5+200______3_____3 45 10 28
Total concentrate. .........................____100____12.9 4.7 60.6
178. ......... ..... 1,077.43 +40 85 9 1 59. +100 14 6 1 62
+200______1_____2_____4 69
Total concentrate.--.... ...................____100____8.6___0.2 69.4_____
179.. .. 376.27 +40 54 14 <1 75 1+100 44 8 1 74 7+200 224 54_____22
Total concentrate. ........ 100 11.1 0.5 74.2
Tye River
194......... ............. 220.93 +100 95 2 6 79+200 5 2 17 63
Total concentrate.---............ .. .... 100 2.0 5.6 78.3
PINEY RIVER DRAINAGE
Piney River
188.. . 169.40 +100 94 <1 2 ' 91+200 6 1 16 71
Total concentrate.. . .. ____100____0.5 2.9 89.7
187.... 71.97 +100 82 2 "~~~2 85+200 18 1 14 65
Total concentrate. . .____100____1.8 4.2 81.3
199.. 815.47 +40 6 5 3 87+100 90 1 3 88+200______4 1_____16 77
Total concentrate..-. ...........____100____1.2 3.5 87.5
186-.- 81.97 +100 95 I 8 54+200 5 0 37 33
Total concentrate . 100 1.0 9.4 63.0
0.1
1.2
2.2
0.3

F16 CONTRIBUTIONS TO ECONOMIC GEOLOGY
TABLE 2. Results of analysis of heavy-mineral concentrates in stream-placer samples, Roseland district, Virginia Continued
Sample
Total Hei weight of mir heavy- Sieve conte mineral size sieve concen- (mesh) tion 0
trate peri (grams) of c<
(1) (2) 0
ivy- leral mt of i frac-
cent o\. 1)
3)
Mineral content (weight percent of heavy-mineral content of col. 3)
(4)
RutileMagnet-
Zircon Ilmenite ite
PINEY RIVER DRAINAGE Continued
Piney River Continued
189
190
Total concentrate.. _
202.62 +40+100 +200
147.50 +40+100 +200
2 75 23
100°
9 83 8
100
6
2
1.2
15 2 2
3.1
0 3
17
6.2
0 1
14
2.0
25 83 66
77.9
59 83 57
78.9
2
1
0.3
11 1 1
1.9
Alien Creek
183.
184
19?
185
191.
Total concentrate......
Total concentrate... _
m Q9 -4-4ft+100 +200
142.57 +40+100 +200
330.74 +40+100 +200
174.45 +40+100 +200
+100 +200
8 89 3
100
9 85
6
100
23 75 2
100
61 372
100
84 15
100
6 2 1
2.3
5 1 2
1.4
15 1
4.2
6 4 3
5.2
23 10 4
20.9
326
3.4
1
4
0.4
2 28
2.0
1 3
15
2.0
0 2
14
0.4
88 68 57
69.3
90 81 65
80.8
76 77 38
76.1
86 80 48
83.0
6377 57
65.1
34
12
4.1
1
0.1
3
<.l
5
3.0
3 6
0.5
Maple Run
198
197
196
Total concentrate .
654.84 +40+100 +200
1,751.25 +40+100 +200
... 1,992.64 +40+100 +200
7 83 10
100
4157 2
100
35 63 2
100
4 3 2
3.0
2 1 1
1.4
17 3 1
8.0
2 15
3.2
0
4
<0.1
1 5
13
3.8
83 77 61
75.8
67 80 67
74.5
68 83 78
77.7
1 5
11
5.3
10 8
10
8.9
3 2 3
2.4
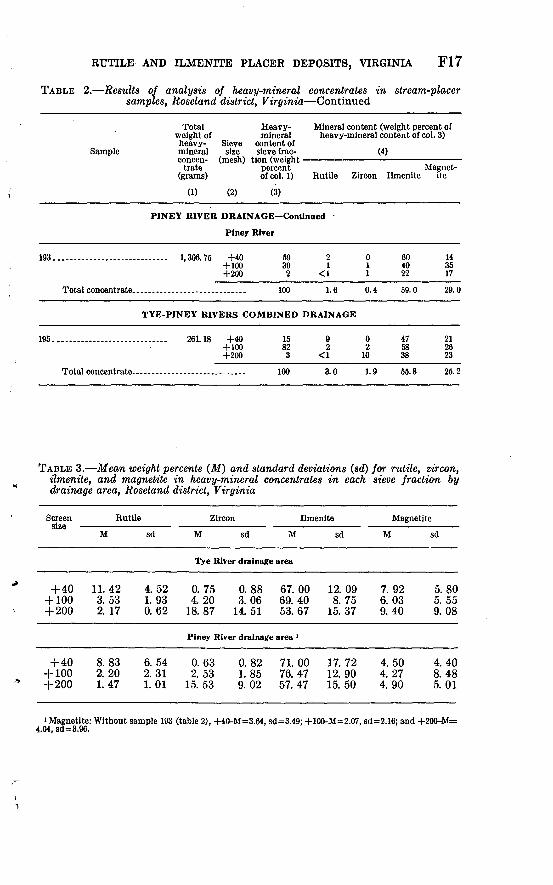
RUTILE AND ILMENITE PLACER DEPOSITS, VIRGINIA F17
TABLE 2. Results of analysis of heavy-mineral concentrates in stream-placer samples, Roseland district, Virginia Continued
Total Heavy weight of mineral heavy- Sieve content of
Sample mineral size sieve frac- concen- (mesh) tion (weight
trate percent (grams) of col. 1)
(1) (2) (3)
Mineral content (weight percent of heavy-mineral content of col. 3)
(4)Magnet-
Rutile Zircon Ilmenite ite
PINEY RIVER DRAINAGE Continued
Piney River
193............................ 1,306.75 +40+100 +200
59 39
2
100
TYE-PINEY RIVERS COMBINED
195............................. 261.18 +40+100 +200
15 82
3
100
2 1
<1
1.6
DRAINAGE
9 2
<1
3.0
0 1 1
0.4
0 2
10
1.9
60 40 22
59.0
47 58 38
55.8
14 35 17
29.0
21 26 23
25.2
TABLE 3. Mean weight percents (M) and standard deviations (sd) for rutile, zircon, ilmenite, and magnetite in heavy-mineral concentrates in each sieve fraction by drainage area, Roseland district, Virginia
Screen Rutile
M sd
Zircon
M sdIlmenite
M sd
Magnetite
M sd
Tye River drainage area
+ 40+ 100+ 200
11.423.532. 17
4.521. 930.62
0.754. 20
18.87
0.883.06
14. 51
67.0069.4053.67
12. 098.75
15.37
7.926.039.40
5.805. 559. 08
Piney River drainage area '
+ 40+ 100+ 200
8.832. 201.47
6.542.311.01
0.632. 53
15. 53
0.821.859.02
71.0076.4757.47
17.7212. 9015. 50
4. 504.274.90
4.408.485.01
i Magnetite: Without sample 193 (table 2), +40-M=3.64, sd=3.49; +100-M=2.07, sd=2.16; and +200-M= 4.04, sd=3.96.
F18 CONTRIBUTIONS TO ECONOMIC GEOLOGY
TABLE 4. Results of X-ray emission spectrographic analysis (for titanium) and atomic absorption analysis (for other elements) of heavy-mineral concentrates from stream-placer samples, Roseland district, Virginia
(Analysts: Oliver M. Fordham, Jr., and Richard S. Good, VirginiaDivision of Mineral Resources, Charlottes- ville, Va. X-ray emission method: General Electric Co. unit, model XRD-5, tungsten target tube. Pel- letized samples used. Atomic absorption method: Techtron unit, model AA-4, aceytlene flame]
SampleTi as TiO 3 Fe Mn
Percent
Cr Cu Ni Pb Zn
Parts per million
TYE RIVER DRAINAGE Tye River
174_.-._-.- 173
175176----.-----177
170 - -
169
181 --------182.... .180-.. --------178---.-------.179 -----
194
... 47.4
.-_ 47.7
.-_ 46.7
--. 44. 5.-_ 49. 8 49. 1
.-. 48. 1
.-_ 48.7_ 49. 7
... 47. 1_.- 47. 8_._ 50. 5 52.3.-_ 50.0
-.- 51.3
31. 9 1. 16 30. 6 1. 2328. 9 1. 06
Hat Creek
25. 9 1. 10 31. 5 . 74 27. 3 1. 09
Tye River
29. 3 1. 13 31. 2 1. 08 31. 0 1. 10
Jennys Creek
23. 7 1. 35 24. 7 1. 43 23. 9 1. 44 29. 6 . 70 28. 7 . 98
Tye River
28.1 1.41
79 65
115
153 331 224
145 171 203
145 133 159 580 279
227
13 15 16
10 10. 11
108 8
10 10 9
12 11
11
13 19 15
15 16 12
16 1618
14 17 16 19 18
16
48 58 55
25 24 40
43 33 41
80 68 91 30 30
223
630 650 480
360 27Q 320
390 410 430
490 530 460 240 280
650
PINEY RIVER DRAINAGE Piney River
188 .187 ------1QQ186 189 -----190 ------
183
192.. ---------185-.- _ -----191------
... 49.7-_. 49.4..- 48. 6... 50. 8.-- 47.2-.. 45. 6
_ 51.449. 0
... 52.7
... 48.6 50.6
30. 8 1. 36 29. 4 1. 33 29. 4 1. 42 26. 1 1. 88 28. 5 1. 32 28. 7 1. 30
Alien Creek
27. 0 1. 84 26. 6 1. 51 26. 4 1. 56 25. 9 1. 57 25. 9 1. 24
38 6527
178 49 61
142 97
170 158 230
10 12
8 17 23 21
18 15 13 19 10
9 20 13 17 17 14
21 17 16 29 20
41 53 33 88
103 76
83 87 61
119 85
890 710 760 860 890 640
1,210 870 890 860 400
'M
<.
f,

F19
TABLE 4. Results of X-ray emission spectrographic analysis (for titanium) and atomic absorption analysis (for other elements) of heavy-mineral concentrates from stream-placer samples, Roseland district, Virginia Continued
SampleTiasTi0 2 Fe
Percent
Mn Cr Cu Ni Pb Zn
Parts per million
Maple Run
198-_. -.--.--..197.. ...---.._.196--_-.. ......
._. 49.7
... 49. 0
... 49. 5
28.0 29.6 29.8
1.25 .86 .96
202 160 192
10 13 9
18 20 22
76 38 43
330 170 270
Piney River
193--------..195... --..-_...
... 37. 5
... 45.928.2 31.3
0.54 .72
233268
22 17
27 20
58 39
240 380
NOTE. Dilution factor of 0.5-g sample: Fe=10<;Mn=10*;Cr=l(P; Cu=lQ2; Ni=l(P; Pb=10i; Zn=W.
TABLE 5. Results of semiquantitative spectrographic analysis of six selected samplesof heavy-mineral concentrates from stream-placer deposits, Roseland district,Virginia
[Analyst: Harriet Neiman, U.S. Geological Survey. Au content determined by Claude Huffman, Jr.,and W. D. Goss, U.S. Geological Survey, by fire assay and atomic absorption and found to be <0.05ppm in all samples]
Elemeiit :175
Sample
178 188 194 198 199
Percent
Si.............Al... _-._--_-.Kg....- ..Ca_____ .......Mn_____ ......
.......... 1.5
.._-_._-.. 1.5
._.._._... .3
.......... 1.5
........__ 1.0
1.0 .7 .3 .3 .5
1.0 .7 . 1 .3
1.0
1.0.7 . 15 .7
1.0
1.0 .7 .2 .2
1.0
1.5 .7 .05 .2
1.0
Parts per million
Ba _______ .Co.......... ..Cr__ . ...__.__.Cu._.....__...Ga_. _____._..Hf... .. ...---.Mo.. -_.-_..-.Nb.._ .-..--Ni............Pb......... ...So.. ..........Sr._. .........V. ___ ... _ .¥._...._.....-Zr _----_--_.
..----_-.- 200
.. __ . _ 20
.--.__--.. 200
.......... <10
.__.-..-_. 10
..-.----.- <200
.......... <3
. ___ ... 1507
......... 10.......... 15.......... 100.......... 300.-.-..._.. 70.._..-..._ 15,000
70 30
500 <15
10 200 <3 150
7<io
20 20
700<io
1,500
70 10 50
<io10
200 15
700 2
10 30 20
300 30
5,000
100 15
200<io
15 200 <3 300
5 10 20 50
500 30
7,000
100 15
200<io
10 <200
<3 150
3 70 20 50
500 70
5,000
200 20 20
<io15
:<200 15
500 <5
<io20 30
200 30
7,000
NOTE. In all samples the following elements were looked for, but not found, as they were below sensi tivity limits (given in parentheses in parts per million):Na (500), K (7,000), P (2,000), Ag (0.5). As (1,000), Au (20), B (20),Be (1), Bi (10), Cd (20), Ce (150), Eu (100), Ge (10), In (20), La (30), Li (50). Pd (1), Pt (30), Re (30), Sb (150), Sn (10), Ta (200), Te (2,000), Th (200) Tl (50), U (500), W (100), Zn (500). In samples 175 and 198 the following were also looked for, but were below detection limits (given in parentheses in parts per million): Gd (50), Tb (300), Dy (50), Ho (20), Er (50), Tm (20), Lu (30).
o