Rutherford Backscattering Spectrometry Timothy P. Spila, Ph.D.

© 2014University of Illinois Board of Trustees. All rights reserved.
Rutherford Backscattering Spectrometry
Timothy P. Spila, Ph.D.
Frederick Seitz Materials Research Laboratory University of Illinois at Urbana-Champaign

© 2015 University of Illinois Board of Trustees. All rights reserved.
Geiger-Marsden Experiment
Top: Expected results: alpha particles passing through the plum pudding model of the atom undisturbed. Bottom: Observed results: a small portion of the particles were deflected, indicating a small, concentrated positive charge.

© 2015 University of Illinois Board of Trustees. All rights reserved.
Rutherford Backscattering Spectrometry
He+
He
RBS is an analytical technique where high energy ions (~2 MeV)
are scattered from atomic nuclei in a sample. The energy of the
back-scattered ions can be measured to give information on
sample composition as a function of depth.

© 2015 University of Illinois Board of Trustees. All rights reserved.
Van de Graaff accelerator
http://archive.thedailystar.net/newDesign/print_news.php?nid=73473
http://cnx.org
© 2015 University of Illinois Board of Trustees. All rights reserved.
Rutherford Backscattering Spectrometry
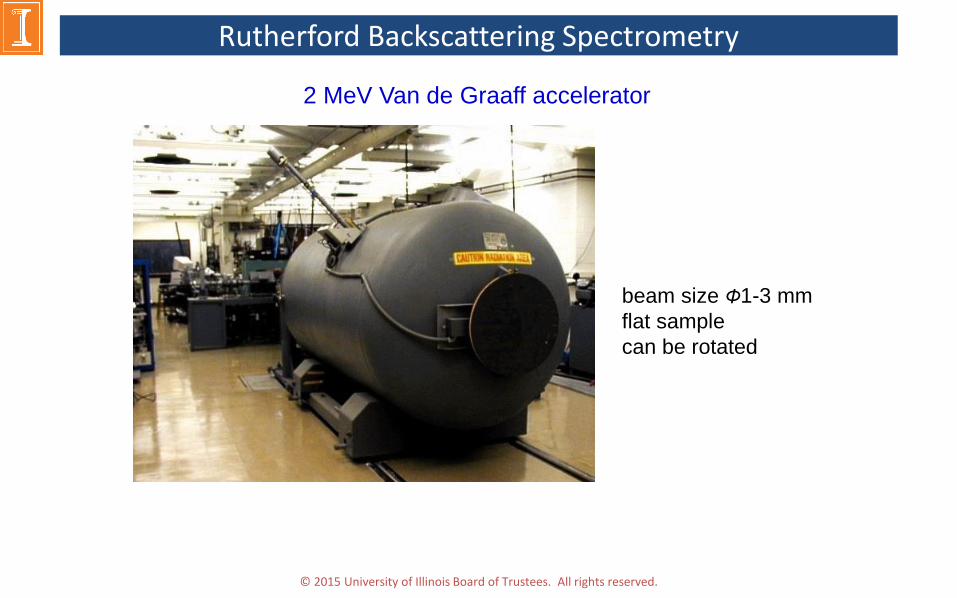
2 MeV Van de Graaff accelerator
beam size Φ1-3 mm
flat sample
can be rotated

© 2015 University of Illinois Board of Trustees. All rights reserved.
Primary Beam Energy
thin film projected on to a plane: atoms/cm2
Figure after W.-K. Chu, J. W. Mayer, and M.-A. Nicolet, Backscattering Spectrometry (Academic Press, New York, 1978).
(Nt)[at/cm2] = N[at/cm3] * t[cm]
en
erg
y loss p
er
cm
lo
g(d
E/d
x)
1 keV 1 MeV (log E)
1 keV 1 MeV

© 2015 University of Illinois Board of Trustees. All rights reserved.
Elastic Two-Body Collision
22 22 sin cos
t i i
i t
MMMKM M
E1 = KEo M1<M2, 0 ≤θ≤180o
RBS: He backscatters
from M2>4
0 ≤Φ≤90o
0 50 100 150 2000.0
0.2
0.4
0.6
0.8
1.0
= 150o
He4
K
ine
ma
tic f
acto
r: K
Target mass (amu)
M1vo2 = M1v1
2 + M2v22
M1vo = M1v1 + M2v2
Elastic Scattering
© 2015 University of Illinois Board of Trustees. All rights reserved.
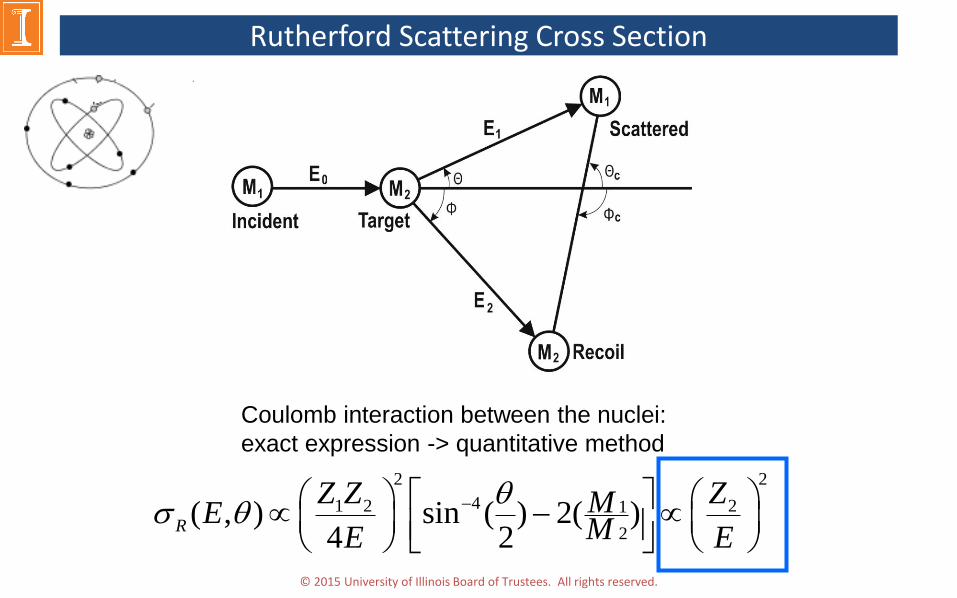
Rutherford Scattering Cross Section
2 2
41 2 21
2( , ) sin ( ) 2( )
4 2R
Z Z ZMEME E
Coulomb interaction between the nuclei:
exact expression -> quantitative method

© 2015 University of Illinois Board of Trustees. All rights reserved.
Electron Stopping
Figure after W.-K. Chu, J. W. Mayer, and M.-A. Nicolet, Backscattering Spectrometry (Academic Press, New York, 1978).
1 keV
en
erg
y loss p
er
cm
lo
g(d
E/d
x)
1 MeV (log E)

© 2015 University of Illinois Board of Trustees. All rights reserved.
RBS – Simulated Spectra
Element (Z,M): O(8,16), Al(13,27), Ti(22,48), In(49,115), Au(79,197)
hypothetical alloy Au0.2In0.2Ti0.2Al0.2O0.2/C
Au
In
Ti Al O
C
10 ML 100 ML Au
In
Ti Al O C
1200 8000
Au
In
Ti Al O C
1000 ML
16000
2
2( , )R
ZE
E
0 50 100 150 2000.0
0.2
0.4
0.6
0.8
1.0
= 150o
He4
Kin
em
atic f
acto
r: K
Target mass (amu)
4000 ML 10000 ML 20000 50000

© 2015 University of Illinois Board of Trustees. All rights reserved.
SIMNRA Simulation Program for RBS and ERD
27.5%
Hf
1.8% Zr 13% Al
N O

© 2015 University of Illinois Board of Trustees. All rights reserved.
Thickness Effects
Series 0
Series 1
Channel700650600550500450400350300250200150100500
Co
un
ts
11,500
11,000
10,500
10,000
9,500
9,000
8,500
8,000
7,500
7,000
6,500
6,000
5,500
5,000
4,500
4,000
3,500
3,000
2,500
2,000
1,500
1,000
500
0
100 200 300 400 500 600 700 800 900 1000 1100 1200 1300 1400 1500
Energy [keV]
N surface
300 nm
Ti surface
Ti
interface
N, O, Mg
interface
Series 0
Simulated
Channel700650600550500450400350300250200150100500
Co
un
ts
14,000
13,000
12,000
11,000
10,000
9,000
8,000
7,000
6,000
5,000
4,000
3,000
2,000
1,000
0
100 200 300 400 500 600 700 800 900 1000 1100 1200 1300 1400 1500
Energy [keV]
Ti surface
400 nm
Ti
interface
N, O, Mg
interface
N surface
Series 0
Simulated
Channel700650600550500450400350300250200150100500
Co
un
ts
14,000
13,000
12,000
11,000
10,000
9,000
8,000
7,000
6,000
5,000
4,000
3,000
2,000
1,000
0
100 200 300 400 500 600 700 800 900 1000 1100 1200 1300 1400 1500
Energy [keV]
600 nm
Ti surface
Ti
interface
N, O, Mg
interface
N surface
TiN/MgO
N
He
DScattered
15
15
Incident

© 2015 University of Illinois Board of Trustees. All rights reserved.
Incident Angle Effects
TiN/MgO
Series 0
Simulated
Channel700650600550500450400350300250200150100500
Co
un
ts
14,000
13,000
12,000
11,000
10,000
9,000
8,000
7,000
6,000
5,000
4,000
3,000
2,000
1,000
0
100 200 300 400 500 600 700 800 900 1000 1100 1200 1300 1400 1500
Energy [keV]
Ti surface 400 nm
Ti
interface
N, O, Mg
interface
N surface
Series 0
Simulated
Channel700650600550500450400350300250200150100500
Co
un
ts
8,500
8,000
7,500
7,000
6,500
6,000
5,500
5,000
4,500
4,000
3,500
3,000
2,500
2,000
1,500
1,000
500
0
100 200 300 400 500 600 700 800 900 1000 1100 1200 1300 1400 1500
Energy [keV]
400 nm
N surface
Ti surface
Ti
interface
N, O, Mg
interface
22.5
52
N
N
He
Scattered
15
15
Incident
Surface peaks do not change position with incident angle
© 2015 University of Illinois Board of Trustees. All rights reserved.
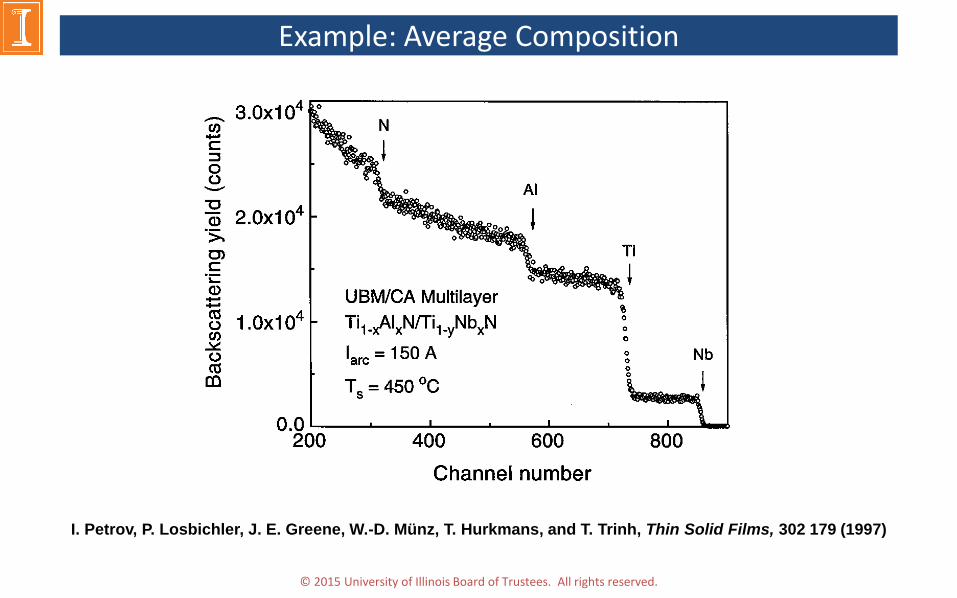
Example: Average Composition
I. Petrov, P. Losbichler, J. E. Greene, W.-D. Münz, T. Hurkmans, and T. Trinh, Thin Solid Films, 302 179 (1997)

© 2015 University of Illinois Board of Trustees. All rights reserved.
RBS: Oxidation Behavior
TiN/SiO2
Annealed in
atmosphere for 12
min at Ta = 600 °C
As-deposited
Experimental
spectra and
simulated spectra
by RUMP

© 2015 University of Illinois Board of Trustees. All rights reserved.
RBS Summary
N
He
DScattered
15
15
Incident
• Quantitative technique for elemental composition • Requires flat samples; beam size Φ1-3 mm • Non-destructive • Detection limit varies from 0.1 to 10-6, depending on Z
•optimum for heavy elements in/on light matrix, e.g. Ta/Si, Au/C… • Depth information from monolayers to 1 m

Thanks to our sponsors!
© 2015 University of Illinois Board of Trustees. All rights reserved.
Platinum Sponsors


![[Chu] Backscattering Spectrometry](https://static.fdocuments.net/doc/165x107/553e2752550346b9308b4919/chu-backscattering-spectrometry.jpg)


![Rutherford Backscattering Spectrometry (RBS) · [2] typical depth resolution in RBS (a) 0.2 nm (b) 2 nm (c) 20 nm [1] RBS is more sensitive for (a) heavy elements (b) light elements](https://static.fdocuments.net/doc/165x107/5e75f0ab028eba0359436748/rutherford-backscattering-spectrometry-rbs-2-typical-depth-resolution-in-rbs.jpg)