Russian Wheat Value Chain and Global Food Security Russian Wheat Value Chain and Global Food...
40
May 2017 Russian Wheat Value Chain and Global Food Security Ghada Ahmed, Sona Nahapetyan, Danny Hamrick, Jonathan Morgan
Transcript of Russian Wheat Value Chain and Global Food Security Russian Wheat Value Chain and Global Food...
May 2017
RussianWheatValueChainandGlobalFoodSecurity
Ghada Ahmed, Sona Nahapetyan, Danny Hamrick, Jonathan Morgan
i
Russian Wheat Value Chain and Global Food Security
Abstract The Black Sea, particularly Russia, began expanding wheat production in the 1990s and is now the top global wheat exporter, accounting for nearly 30% of global trade. Russia’s rapid growth is attributed to firms that capitalized on their position—both geographically and along the chain to expand production and competitiveness. Despite this rapid growth, several vulnerabilities in the wheat industry increase uncertainty in the nation and among importing partners, especially MENA nations. This report uses the global value chain (GVC) framework and social network analysis (SNA) to study the structure of the wheat industry and to uncover five catalysts (environmental events, geopolitical dynamics, market conditions, trade shifts, and public policy) that have the potential of disrupting the wheat value chain internally and at a global level. We argue that in order to maintain its position as global leader and to promote stability in the global wheat value chain, Russia must improve policy to minimize the actual and perceived threats associated with these catalysts. Without policy change, the system will remain volatile for importers and Black Sea nations.
ii
This research is prepared on behalf of the Duke University Minerva Research Initiative Project FY 2011-2015:
Global Value Chain Analysis of Food Security and Food Staples for Major Energy- Exporting Nations in the Middle East and North Africa
The Duke University team is a partnership between the Nicholas School of Environment and the Center on Globalization, Governance and Competitiveness.
The lead author can be contacted at:
Ghada Ahmed: [email protected]
Acknowledgements
Duke CGGC would like to thank all of the interviewees and reviewers, who gave generously of their time and expertise. Further thanks go to Natalia Mirovitskaya at Duke Center for International Development for her assistance and political economy expertise during field research. Duke University, Center on Globalization, Governance and Competitiveness (Duke CGGC) The Duke University Center on Globalization, Governance & Competitiveness undertakes client-sponsored research that addresses economic and social development issues for governments, foundations and international organizations. We do this principally by utilizing the global value chain (GVC) framework, created by Founding Director Gary Gereffi, and supplemented by other analytical tools. As a university-based research center, we address clients’ real world questions with transparency and rigor. www.cggc.duke.edu
Center on Globalization, Governance & Competitiveness, Duke University © May 2017
iii
Table of Content Abstract ........................................................................................................................................... i List of Acronyms .......................................................................................................................... iv Introduction ................................................................................................................................... 1 Food Systems and Food Security through a Value Chain Lens ............................................... 2 Methodology .................................................................................................................................. 7
Global Value Chain Analysis ................................................................................................... 7 Social Network Analysis ........................................................................................................... 8 Why Perform Structural Analyses of Value Chains? ............................................................ 9
The Wheat GVC in Russia ......................................................................................................... 10 Country Overview ................................................................................................................... 10 Russia’s Participation in the Wheat GVC ............................................................................ 12
Structural Analysis of ohe Chain and Impact on Food Security ............................................ 24 Industrial Organization .......................................................................................................... 24 Disruptions in the Wheat Value Chain ................................................................................. 26
Conclusion ................................................................................................................................... 29 References .................................................................................................................................... 31 List of Figures Figure 1. Russian Wheat Usage, Imports and Exports (1987–2015) ...................................... 11Figure 2. MENA Wheat Imports by Sourcing Region ............................................................ 12Figure 3. Russia’s Wheat GVC Timeline .................................................................................. 13Figure 4. Global Value Chain in Russia ................................................................................... 14Figure 5. Lead Private Agroholdings by GVC Segment ......................................................... 16Figure 6. Market Share of the Main Exporters in 2013 .......................................................... 20Figure 7. Wheat Value Chain, Multinational and Domestic Firms ....................................... 24 List of Tables Table 1. GVC Perspectives on Food System Aspects and Outcome ......................................... 5 Table 2. Key Network Measures and Definitions ...................................................................... 9 Table 3. Inputs in the Wheat VC in Russia .............................................................................. 15 Table 4. Overview of the Top Commodity Traders ................................................................. 19 Table 5. Overview of Lead Traders Active in Port Capacity ................................................. 21 Table 6. Russian Wheat Policies ................................................................................................ 22 Table 7. Major Catalysts for Disruptions in the Russian Wheat GVC ................................. 28
iv
List of Acronyms AEGIC Australian Export Grain Innovation Center CIS Commonwealth of Independent States COFCO China National Cereals, Oils and Foodstuffs Corporation EBRD European Bank for Reconstruction and Development EIB European Investment Bank ESPO Eastern Siberia Pacific Ocean EU European Union FAO Food and Agriculture Organization of United Nations GASK General Authority for Supply Commodities GVC Global Value Chain HQ Headquarters IMF International Monetary Fund LDC Louis Dreyfus Company MENA Middle East and North Africa MT Metric Tons OECD Organization of Economic Cooperation and Development PSE Producer support estimate R&D Research and Development ROSSTAT Russian Federation Federal State Statistical Service RUR Russian Ruble RZhD Russian Railways Company Joint Stock SNA Social Network Analysis UGC United Grain Company USD United States Dollar USDA United States Department of Agriculture WB World Bank WTO World Trade Organization
1
Introduction Since the early 2000s, Russia, Ukraine and Kazakhstan have emerged as the largest global suppliers of wheat with about 30% of global wheat trade (AEGIC et al., 2016). Russia is the largest exporter in the Black Sea and surpasses its neighbors in economic, political and geographical terms. The country established itself as major player in the wheat global value chain (GVC) and is now the world’s largest supplier with about 25 million MT in exports in 2015/16 (USDA, 2016). The rise of Russia in the wheat GVC is particularly important for countries that rely on wheat imports including nations in the Middle East and North Africa (MENA). Our research shows how changes in Russian supply due to lower production, geopolitical dynamics, and trade restrictions can lead to global market shocks. These shocks create disruptions along the value chain that impact food security in importing countries. In this report, we adopt a detailed qualitative case study approach to provide a firm level analysis of lead players in the wheat value chain. We draw on primary data collected by interviewing key GVC actors as well as secondary data, including trade and agricultural statistics, academic journals and international and industry reports. We use the GVC analysis framework to map the role of actors in the wheat value chain and identify the type of governance structure that impact wheat exports. We complement GVC analysis with social network analysis to map the geography of actors in Russia and their activities to uncover power relations in the chain and their implications on food security. The wheat GVC encompasses a complex network of stakeholders that bring the grain from production to consumption. The geographic shift of the chain from the West to Russia is marked by the entry of a handful of lead international firms that forged deep relationships with producers and invested in exports. The government in Russia and importing countries also play a key role in setting policy frameworks that influence production, trade and consumption patterns. Interactions between governments, trade policy and firms in the chain have implications on food security outcomes and can lead to market disruptions. This study examines the Russian wheat GVC and its implications on food security in the Middle East and North Africa region. Our research identifies the lead firms that are critical to wheat exports and analyzes relationships within the chain. We also focus on identifying sources of volatility in the chain and the responses that actors use to adapt to volatility. A distinctive feature of our approach is to apply the GVC methodology and social network analysis (SNA) to better understand food security. GVC analysis focuses on transnational corporations and inter-firm relations to understand industry dynamics that underpin economic growth. Studying economic upgrading—defined as the development of firms, countries, or regions from lower to higher value added activities—is a cornerstone of GVC research. Additionally, identifying the
2
governance structure or the type of relationships between firms that determine upgrading outcomes, is central to the framework. SNA complements GVC analysis by mapping and measuring relationships between people, organizations and other actors. Social network analysis gives us insights into power relations based on roles and groupings within a network of interest. Both the GVC and SNA methodology adds to food security studies by highlighting firm and institutional level analysis that influence outcomes. By understanding the complex relationships between markets, including global lead firms and domestic actors, we are able to uncover specific inefficiencies that lead to disruptions in food supply or factors that underlie chronic vulnerabilities. For example, we find that Russia’s wheat value chain is primarily organized around the Volga river watershed. Multinational firms, such as Glencore, Cargill, and Olam, are hubs in this network due to their major investments in logistics, storage, and port facilities. The export orientation of these firms reflects the concentration of their investments in either southern production, storage, and export facilities or in northern logistics and processing centers. The network analysis shows that these firms use Russian export ports for their Ukrainian subsidiaries which is likely to continue to be a source of instability. The depth of the investment in Russia is long term and an incentive for these firms to diversify their operations in growing markets such as animal feed and export regions such as Northern Asia. We further discuss our findings and their implications in four sections. Section 1 provides an overview of the relevant themes in the study of food systems and food security while section 2 introduces the methodology used. Section 3 presents the Russian wheat context and the wheat value chain. Section 4 presents the analysis of the wheat GVC and its implications on food security.
Food Systems and Food Security through a Value Chain Lens The food system is a complex network of processes necessary to deliver food to people. The system spans all aspects of food production, distribution, and preparation as well as processing, retail, and consumption. Literature around food systems is vast, highlighting global shifts on a broad level that impact agriculture production and food consumption (Friedma & McMichael, 1989; McMichael, 2008, 2009). Scholars focusing on global trends often focus on major shifts, such as the transition from colonial based agriculture schemes to nation centered programs and the more recent firm led organizational structures. They also explore the rise of industrial agriculture and its impact on farmers and consumers (McMichael, 2009). These shifts in organizations are well documented and have important implications for food security as consumers rely on a global system to access food1.
1 For example, the inclusion of agriculture in the General Agreement on Tariffs and Trade (GATT) helped advance the argument that trade liberalization is the optimal way to promote economic growth and improve food security (Lang, 1996).
3
However, some scholars question the impact of trade liberalization on food security as public sector institutions privatized and reduced social welfare in developing countries. Liberalization policies and economic globalization are key factors that enabled internationalization, consolidation, and vertical integration of agribusiness. They also spurred the increased reliance on a handful of firms for food access and intensified the exposure of food import dependent countries to global trade and price volatilities (Ahmed et al., 2014). High food prices and volatility in commodity markets renewed food security concerns and put agriculture and food security challenges on the top of policy makers’ agendas across the globe. Threats to food production and access, compounded by increasing population and urbanization rates, climate change and environmental stress and shifting diets are putting pressure on land and water resources and threatening nation’s ability to feed their populations. The United Nations Food and Agriculture Organization defined food security at the 1996 World Food Summit as the “situation that exists when all people, at all times, have physical, social, and economic access to sufficient, safe, and nutritious food that meets their dietary needs and food preferences for an active and healthy life” (FAO, 1996). This definition, builds on four key dimensions:
• Food Access: Population has ability to purchase or produce food to meet dietary needs.
• Food Availability: Food is consistently available for consumption. • Food Utilization: Proper knowledge of preparation and sanitation exists for
available food and the food is culturally appropriate for the target population. • Stability: Availability and Access is consistent over time.
Food security, food insecurity, and food sovereignty2 are outcomes of complex interactions of actors in the food system. Food security occurs when the food system is functioning and able to supply food to all of a target population (Sobal et al., 1998). Despite its prominence and importance, scholars often debate the best ways to study food security. To date, most studies of food security have either taken a broad, global approach or looked at a specific nation. Globally oriented studies examine macro-level shifts that impact food security on a global level. In contrast, another body of scholarship take a country or sub-region approach, focusing on the particular dynamics of a bound geographic region while largely ignoring global level features. As a result, these approaches overlook the role of transnational actors and activities, and how these actor’s actions ripple across the food system, creating disparate outcomes3.
2In the declaration of 2001 in Via Campesina, food sovereignty is defined as “The right of peoples to define their own agriculture and food policies, to protect and regulate domestic agricultural production and trade in order to achieve sustainable development objectives, to determine the extent to which they want to be self-reliant, and to restrict the dumping of products in their markets. Food sovereignty does not negate trade, but rather it promotes the formulation of trade policies and practices that serve the rights of peoples to safe, healthy, and ecologically sustainable production”. While not a central focus for this paper, it is often discussed in relationship to food security and seen by some scholars as the more appropriate goal for food system actors. See Jarosz 2014. 3 Important exceptions include Lampiette 2011, Clapp 2013, and Murphy et al 2012.
4
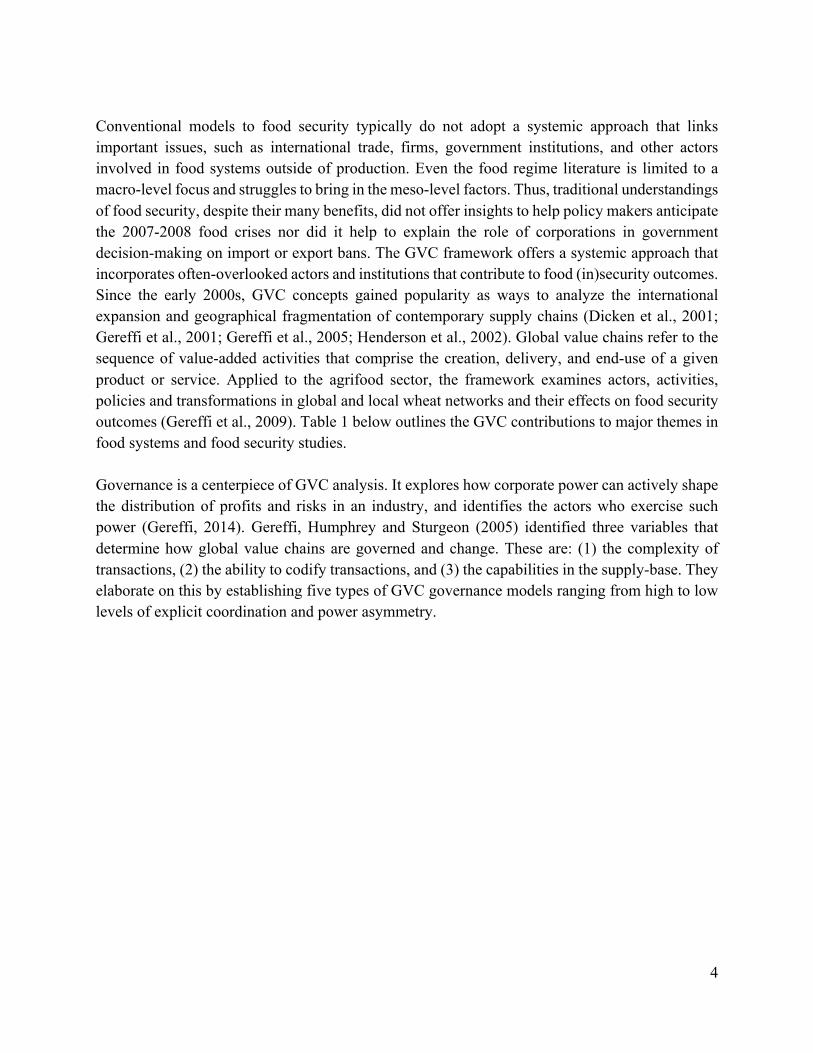
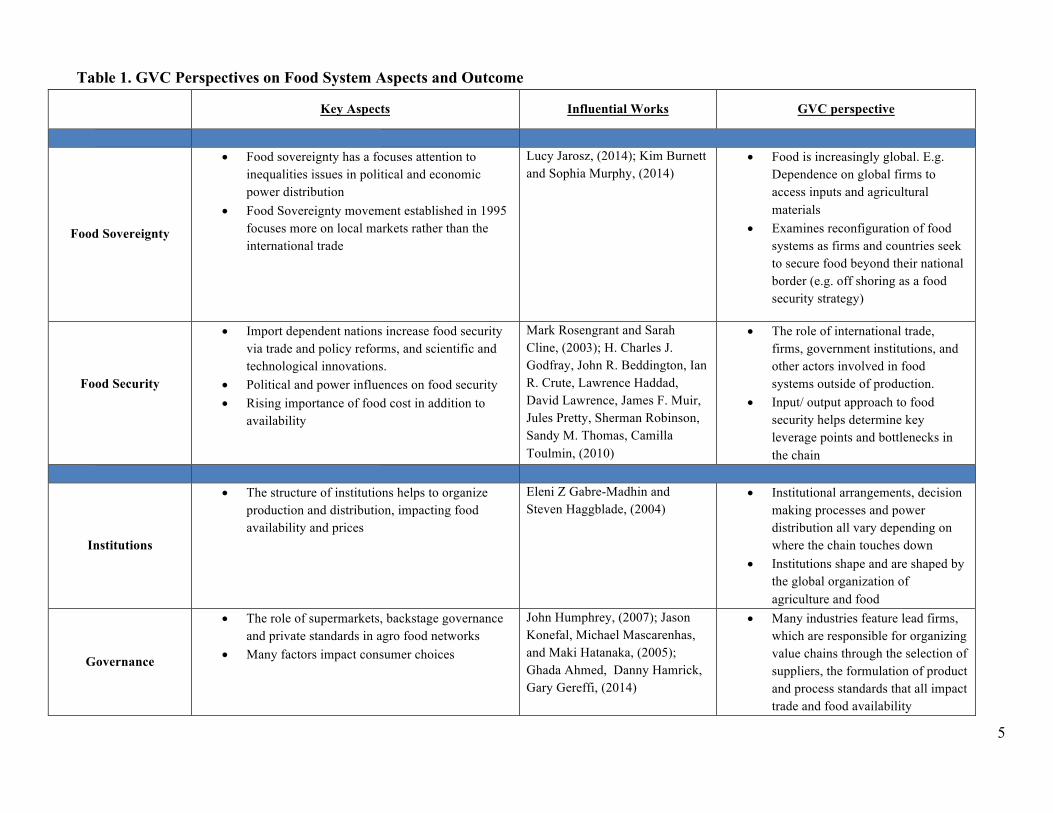
Conventional models to food security typically do not adopt a systemic approach that links important issues, such as international trade, firms, government institutions, and other actors involved in food systems outside of production. Even the food regime literature is limited to a macro-level focus and struggles to bring in the meso-level factors. Thus, traditional understandings of food security, despite their many benefits, did not offer insights to help policy makers anticipate the 2007-2008 food crises nor did it help to explain the role of corporations in government decision-making on import or export bans. The GVC framework offers a systemic approach that incorporates often-overlooked actors and institutions that contribute to food (in)security outcomes. Since the early 2000s, GVC concepts gained popularity as ways to analyze the international expansion and geographical fragmentation of contemporary supply chains (Dicken et al., 2001; Gereffi et al., 2001; Gereffi et al., 2005; Henderson et al., 2002). Global value chains refer to the sequence of value-added activities that comprise the creation, delivery, and end-use of a given product or service. Applied to the agrifood sector, the framework examines actors, activities, policies and transformations in global and local wheat networks and their effects on food security outcomes (Gereffi et al., 2009). Table 1 below outlines the GVC contributions to major themes in food systems and food security studies. Governance is a centerpiece of GVC analysis. It explores how corporate power can actively shape the distribution of profits and risks in an industry, and identifies the actors who exercise such power (Gereffi, 2014). Gereffi, Humphrey and Sturgeon (2005) identified three variables that determine how global value chains are governed and change. These are: (1) the complexity of transactions, (2) the ability to codify transactions, and (3) the capabilities in the supply-base. They elaborate on this by establishing five types of GVC governance models ranging from high to low levels of explicit coordination and power asymmetry.
5
Table 1. GVC Perspectives on Food System Aspects and Outcome
Key Aspects Influential Works GVC perspective
Food Sovereignty
• Food sovereignty has a focuses attention to inequalities issues in political and economic power distribution
• Food Sovereignty movement established in 1995 focuses more on local markets rather than the international trade
Lucy Jarosz, (2014); Kim Burnett and Sophia Murphy, (2014)
• Food is increasingly global. E.g. Dependence on global firms to access inputs and agricultural materials
• Examines reconfiguration of food systems as firms and countries seek to secure food beyond their national border (e.g. off shoring as a food security strategy)
Food Security
• Import dependent nations increase food security via trade and policy reforms, and scientific and technological innovations.
• Political and power influences on food security • Rising importance of food cost in addition to
availability
Mark Rosengrant and Sarah Cline, (2003); H. Charles J. Godfray, John R. Beddington, Ian R. Crute, Lawrence Haddad, David Lawrence, James F. Muir, Jules Pretty, Sherman Robinson, Sandy M. Thomas, Camilla Toulmin, (2010)
• The role of international trade, firms, government institutions, and other actors involved in food systems outside of production.
• Input/ output approach to food security helps determine key leverage points and bottlenecks in the chain
Institutions
• The structure of institutions helps to organize production and distribution, impacting food availability and prices
Eleni Z Gabre-Madhin and Steven Haggblade, (2004)
• Institutional arrangements, decision making processes and power distribution all vary depending on where the chain touches down
• Institutions shape and are shaped by the global organization of agriculture and food
Governance
• The role of supermarkets, backstage governance and private standards in agro food networks
• Many factors impact consumer choices
John Humphrey, (2007); Jason Konefal, Michael Mascarenhas, and Maki Hatanaka, (2005); Ghada Ahmed, Danny Hamrick, Gary Gereffi, (2014)
• Many industries feature lead firms, which are responsible for organizing value chains through the selection of suppliers, the formulation of product and process standards that all impact trade and food availability
6
• The politicization of food creates an environment where many state government take on the role firms in the wheat industry
• Grains trade is often governed by global traders who have competitive advantages in infrastructure and logistics
Trade
• Changes in political systems in post-soviet countries altered trade dynamics
• Trade liberalization worldwide at the end of 20th century reduced strength of domestic institutions
• Increasing influence of international institutions • The benefits of free trade in ensuring food
security and less price volatility is debated
M. Ataman Aksoy, John S. Beghin, (2004); Paul de Heresy, (1956); Ronald Trostle, (2008); Derek Headey, (2011); Martine Rutten, Lindsay Shutes, Gerdien Meijeri, (2013); Siddhartha Mitra And Tim Josling (2009); Helen V. Milner, (1999)
• Seeks to understand how goods flow across the globe and their impact of food security
• Understandings of food security from an availability and access lens
• Actor and policy driven approach to understanding food trade
Political Economy
• Helps study distortions to in agricultural production in transitions countries.
• Explores interaction between production, trade and consumption and government polices influence economic outcomes on a broad level
• Treatment of firms as homogeneous, overlooking important differences in firm’s strategies, goals and capabilities
Lawrence Busch and Arunas Juska, (1997); Scott Rozelle and Johan Swinnen, (2009)
• Analyzes Key Actors and the governance structure manifested in chains
• Looks at nexus of institutions, firms and public policy in outcomes
• Role of Government policy in organization and orientation of firms
Climate/Weather
• Climate change consequences might endanger food security and regional security.
• Weather volatility could result in increased hunger in developing regions like Africa
Oli Brown and Alec Crawford, (2009); Martin Parry, Cynthia Rosenzweig, Ana Iglesias, GuKnther Fischer, Matthew Livermore, (1999)
• Explores how climate disruption create ripple effects in the flow of food in the chain across the globe
• Impact of chain activities on the environment
Source: Authors based on review of literature
7
Methodology To explore the contributions of the GVC theoretical concepts on understandings of food security, we perform a GVC analysis of the wheat industry in Russia. Building on an extensive review of existing literature, this report preforms rigorous quantitative analysis of trade and in-depth qualitative research (20 semi-structured interviews with trade association representatives, domestic and global firms, government offices, and academics). We complement the GVC analysis with another methodological tool, social network analysis (SNA). Both methods seek to understand social structures through a focus on relational ties between social actors. GVC analysis maps industry actors and activities to understand the intersections of trade, government policy and firm strategy. The methodology seeks to examine how countries and firms connect in the global economy and the roles they play that impact economic, social and environmental outcomes. SNA supplements the GVC framework by exploring the geography of actors and ways that they link to one another to uncover network dynamics and power relations that impact the wheat value chain. This section introduces both concepts and details how each is used in this report.
Global Value Chain Analysis Growth in trade since the 1980s, rising foreign direct investment and the fragmentation of production reflects the quantitative dimension of GVCs (Milner, 1999). At the same time, the qualitative component of the research provides us with valuable insights on the structure of trade and global production that determine winners in these shifts (Milberg, 2004). In most cases government policy shifted from import substitution towards trade liberalization and export-oriented development, and corporate strategies of transnational firms focus on honing their competitive advantage while vertically disintegrating. The fragmentation of production networks lead to a global economy increasingly structured around GVCs with countries and firms competing to entering and upgrading in these chains. GVCs link firms, workers and consumers all of which have implications on food security. By mapping the geography of supply and demand in the wheat industry, activities from research to consumption and actors, we are able to identify leverage points and governance structures that influence food security outcomes. Global value chain analysis draws heavily from political economy theories to help conceptualize global industries while focusing on the role of firms. Political economists seek to understand how the interaction between production, trade and consumption and government polices influence economic outcomes on a broad level. Consequently, political economy studies often view firms as a homogeneous group, overlooking important differences between firm’s strategies, goals and capabilities. As a largely inter-disciplinary field, political economy studies utilize insights from a variety of disciplines (for example:
8
economics, law, political science, public policy, and sociology) to better understand social phenomenon. Political economist research of international trade often occurs among three key areas: trade policy preferences, institutional arrangements, and the evolution of international political system. Political economy studies uncover underlying structures that govern trade between states. As a result, they often look at the organizational features of the international political and economic system and institutional arrangements at the national and global level. GVC analysis builds on insights from political economy studies to gain a better understanding of the institutional arrangements at the local, national and international level, and the means by which they interact with firms, influence industries and stimulate winners and losers among firms. This is done primarily via an examination of governance structures, both formal and informal. Governance refers to the “authority and power relationships that determine how financial, material and human resources are allocated and flow within a chain” (Gereffi, 1994).
Social Network Analysis To deepen our understanding of actors in the wheat GVC and the impact of the organization of actors on governance structures, this report combines GVC analysis with social network analysis (SNA). SNA maps and measures the relationships and flows between people, groups, organizations and other connected information/knowledge entities. The nodes, or individual units, in the network are people and groups. The links between individual nodes shows the relationships or flow patterns. SNA provides both a visual and a mathematical analysis of human relationships (Orgnet, 2016). SNA investigates social structures to answer questions including (Analytictech, 2016):
• The relationship between actors rather than attributes of actors • The interdependence among actors, taking a molecular rather than atomistic view • The ways network structures affect outcomes for various actors • Analysis of power relationships and asymmetries between actors, as well as their
consequences
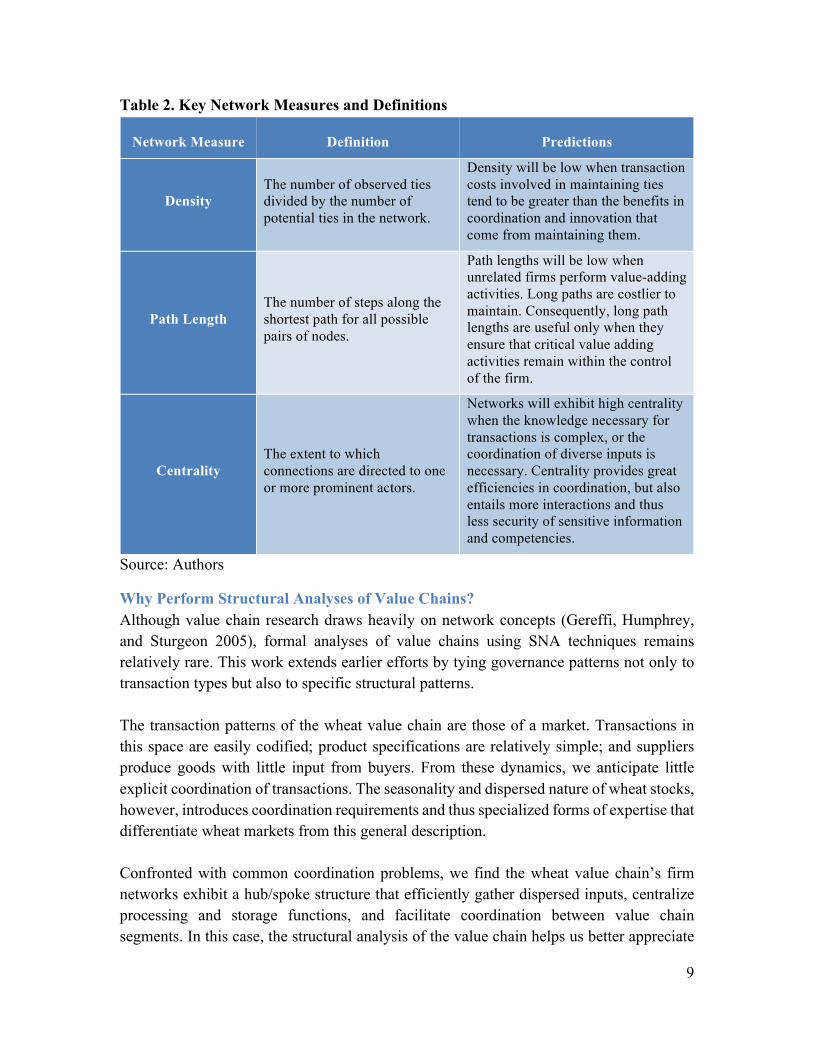
SNA is concerned with a variety of social phenomenon. The main SNA variables used in this report are presented and defined in Table 2 below. Additionally, the table introduces the predictions that guide our analysis of the Russian wheat network.
9
Table 2. Key Network Measures and Definitions
Network Measure Definition Predictions
Density The number of observed ties divided by the number of potential ties in the network.
Density will be low when transaction costs involved in maintaining ties tend to be greater than the benefits in coordination and innovation that come from maintaining them.
Path Length The number of steps along the shortest path for all possible pairs of nodes.
Path lengths will be low when unrelated firms perform value-adding activities. Long paths are costlier to maintain. Consequently, long path lengths are useful only when they ensure that critical value adding activities remain within the control of the firm.
Centrality The extent to which connections are directed to one or more prominent actors.
Networks will exhibit high centrality when the knowledge necessary for transactions is complex, or the coordination of diverse inputs is necessary. Centrality provides great efficiencies in coordination, but also entails more interactions and thus less security of sensitive information and competencies.
Source: Authors
Why Perform Structural Analyses of Value Chains? Although value chain research draws heavily on network concepts (Gereffi, Humphrey, and Sturgeon 2005), formal analyses of value chains using SNA techniques remains relatively rare. This work extends earlier efforts by tying governance patterns not only to transaction types but also to specific structural patterns. The transaction patterns of the wheat value chain are those of a market. Transactions in this space are easily codified; product specifications are relatively simple; and suppliers produce goods with little input from buyers. From these dynamics, we anticipate little explicit coordination of transactions. The seasonality and dispersed nature of wheat stocks, however, introduces coordination requirements and thus specialized forms of expertise that differentiate wheat markets from this general description. Confronted with common coordination problems, we find the wheat value chain’s firm networks exhibit a hub/spoke structure that efficiently gather dispersed inputs, centralize processing and storage functions, and facilitate coordination between value chain segments. In this case, the structural analysis of the value chain helps us better appreciate
10
the factors that differentiate wheat markets from other kinds of markets, and allows us to consider how common coordination problems inform the value chain’s governance patterns. We would anticipate this hub/spoke pattern to occur where firms confront common coordination problems and dispersed inputs, but we would also expect the transactional processes identified by Gereffi et al. (2005) to influence the value chain’s level of complexity and hierarchy.
The Wheat GVC in Russia
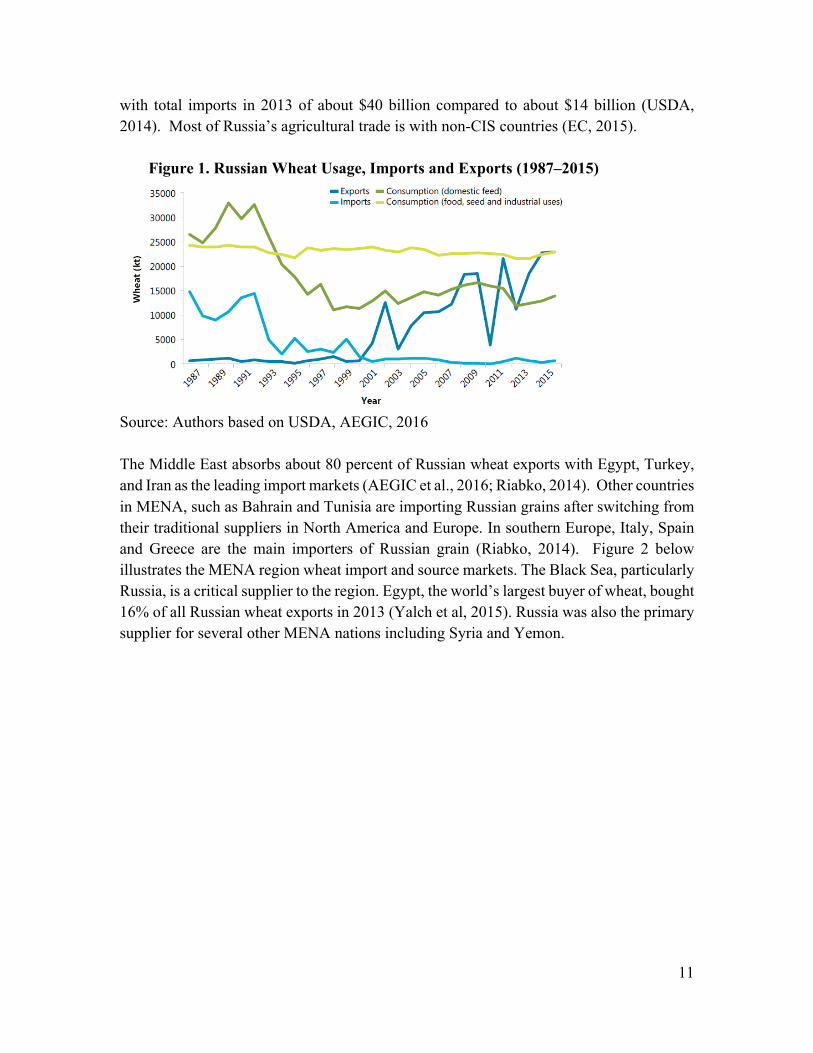
Country Overview The Russian economy depends on commodity exports with the oil and gas revenues making about 68% of total export in 2013 (EIA, 2015). The decline in oil prices since 2014 has significantly impacted the Russian economy leading to an economic crisis, devaluation of the ruble and high inflation4. These challenges are compounded by economic sanctions against Russia that echoed into the agriculture sector. The Russian government raised wheat export tariffs to compensate for lower Russian wheat prices and banned food imports from the West. In 2013, the agricultural sector contributed about 4% to the Russian GDP (OECD, 2015). The country holds about 8 percent of the world's arable land with a fifth planted with wheat. The most popular wheat variety is soft winter wheat, which is mostly harvested in Southern and Central Russia. These regions have better climate, a developed processing and transportation infrastructures and account for almost 90 percent of total wheat and agricultural production (FAO-EBRD, 2009; Salputra et al., 2013). With only 2 percent of the agricultural land under irrigation, the sector suffers from chronic draughts that impact yield (World-Bank, 2008). Almost 25% of the population lives in rural areas and 9.7% of the country’s workforce is employed in the agricultural sector. Wheat is strategic for food security and for livestock production5. Russia exports commodity crops, such as grains, and imports high value products such as meat, fruits and vegetables. Since the late 1990s, the country shifted from being a net importer of wheat to being the Black Sea region’s biggest grain producer and a leading global exporter. The decline in using wheat for animal feed and stable domestic consumption increased wheat supply for exports (see figure 1). Russia is now the largest producer of wheat with exports projected to reach million 25 million tons in 2016/2017 outpacing both Canada and the United States (USDA, 2016). The country is also the 5th-largest importer of agricultural products after the EU, China, the United States and Japan,
4 Official Monetary Unit of Russian Federation 5 Around 36 percent of grain consumption goes into animal feed
11
with total imports in 2013 of about $40 billion compared to about $14 billion (USDA, 2014). Most of Russia’s agricultural trade is with non-CIS countries (EC, 2015).
Figure 1. Russian Wheat Usage, Imports and Exports (1987–2015)
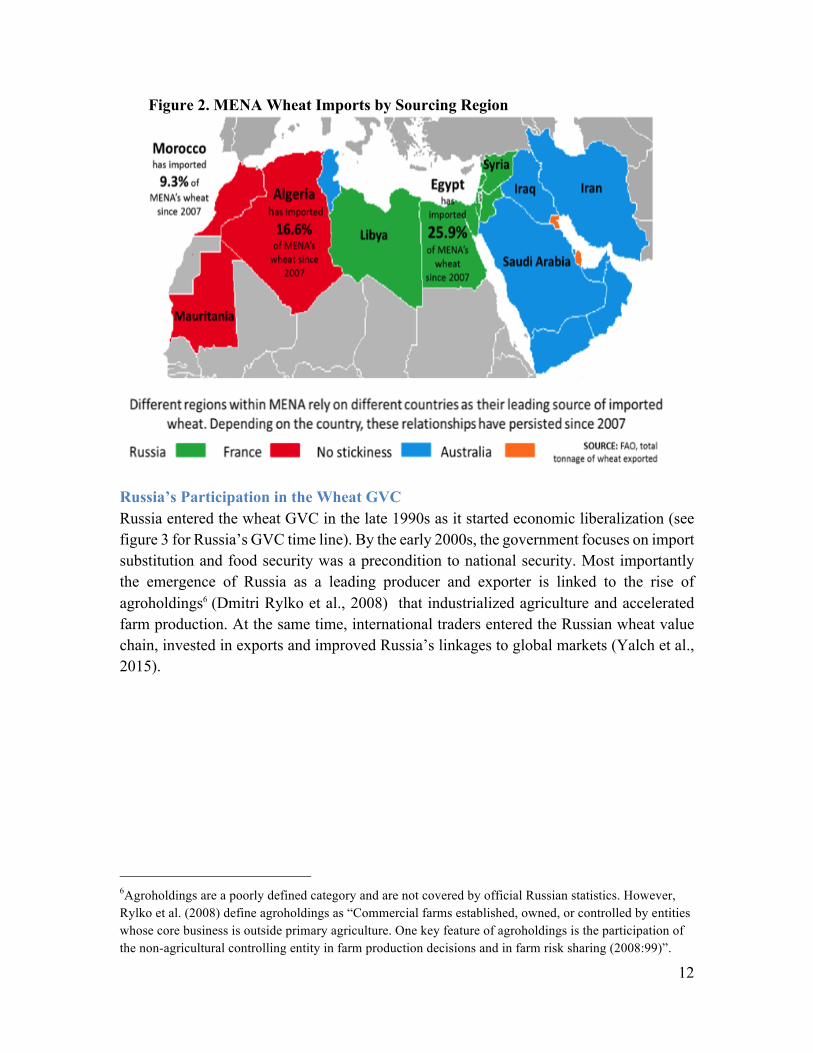
Source: Authors based on USDA, AEGIC, 2016 The Middle East absorbs about 80 percent of Russian wheat exports with Egypt, Turkey, and Iran as the leading import markets (AEGIC et al., 2016; Riabko, 2014). Other countries in MENA, such as Bahrain and Tunisia are importing Russian grains after switching from their traditional suppliers in North America and Europe. In southern Europe, Italy, Spain and Greece are the main importers of Russian grain (Riabko, 2014). Figure 2 below illustrates the MENA region wheat import and source markets. The Black Sea, particularly Russia, is a critical supplier to the region. Egypt, the world’s largest buyer of wheat, bought 16% of all Russian wheat exports in 2013 (Yalch et al, 2015). Russia was also the primary supplier for several other MENA nations including Syria and Yemon.
12
Figure 2. MENA Wheat Imports by Sourcing Region
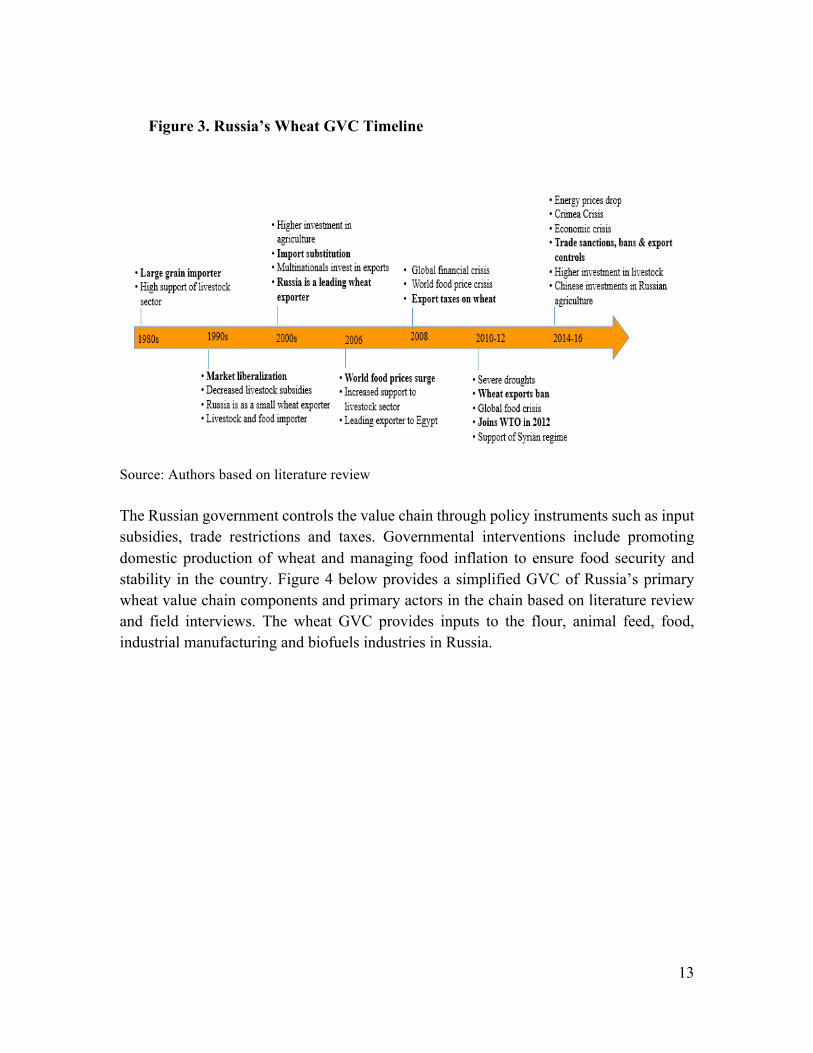
Russia’s Participation in the Wheat GVC Russia entered the wheat GVC in the late 1990s as it started economic liberalization (see figure 3 for Russia’s GVC time line). By the early 2000s, the government focuses on import substitution and food security was a precondition to national security. Most importantly the emergence of Russia as a leading producer and exporter is linked to the rise of agroholdings6 (Dmitri Rylko et al., 2008) that industrialized agriculture and accelerated farm production. At the same time, international traders entered the Russian wheat value chain, invested in exports and improved Russia’s linkages to global markets (Yalch et al., 2015).
6Agroholdings are a poorly defined category and are not covered by official Russian statistics. However, Rylko et al. (2008) define agroholdings as “Commercial farms established, owned, or controlled by entities whose core business is outside primary agriculture. One key feature of agroholdings is the participation of the non-agricultural controlling entity in farm production decisions and in farm risk sharing (2008:99)”.
13
Figure 3. Russia’s Wheat GVC Timeline
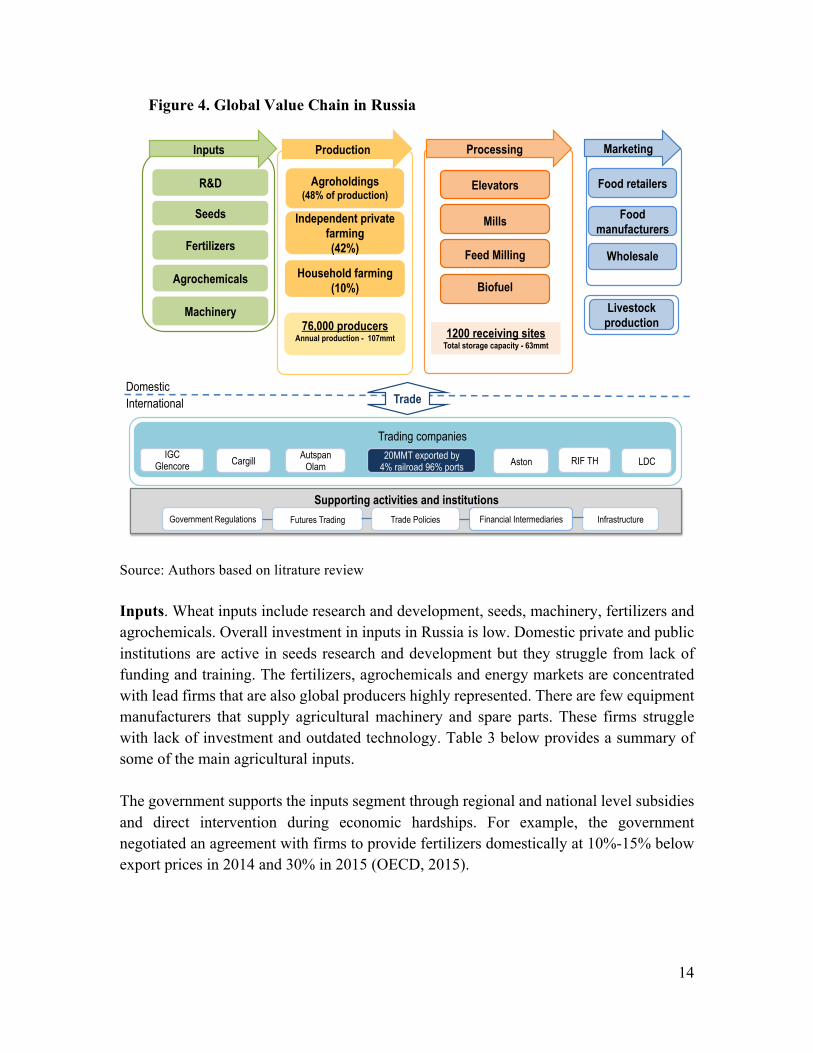
Source: Authors based on literature review The Russian government controls the value chain through policy instruments such as input subsidies, trade restrictions and taxes. Governmental interventions include promoting domestic production of wheat and managing food inflation to ensure food security and stability in the country. Figure 4 below provides a simplified GVC of Russia’s primary wheat value chain components and primary actors in the chain based on literature review and field interviews. The wheat GVC provides inputs to the flour, animal feed, food, industrial manufacturing and biofuels industries in Russia.
14
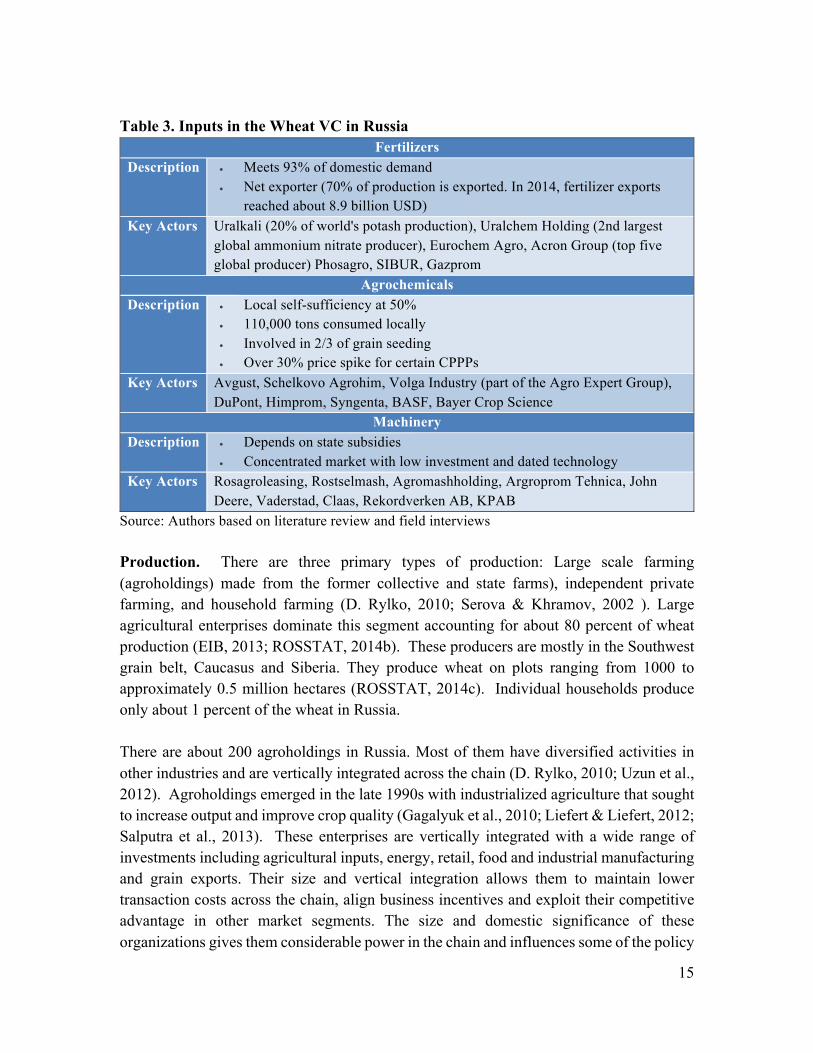
Source: Authors based on litrature review Inputs. Wheat inputs include research and development, seeds, machinery, fertilizers and agrochemicals. Overall investment in inputs in Russia is low. Domestic private and public institutions are active in seeds research and development but they struggle from lack of funding and training. The fertilizers, agrochemicals and energy markets are concentrated with lead firms that are also global producers highly represented. There are few equipment manufacturers that supply agricultural machinery and spare parts. These firms struggle with lack of investment and outdated technology. Table 3 below provides a summary of some of the main agricultural inputs. The government supports the inputs segment through regional and national level subsidies and direct intervention during economic hardships. For example, the government negotiated an agreement with firms to provide fertilizers domestically at 10%-15% below export prices in 2014 and 30% in 2015 (OECD, 2015).
Trade Domestic International
Livestock production
Food manufacturers
Wholesale
Food retailers
Marketing
Supporting activities and institutions
Trade Policies Financial Intermediaries Futures Trading Government Regulations Infrastructure
Trading companies IGC
Glencore 20MMT exported by
4% railroad 96% ports LDC Aston RIF TH Cargill Autspan Olam
Elevators
Processing
Mills
1200 receiving sites Total storage capacity - 63mmt
Feed Milling
Biofuel
Inputs
Machinery
Agrochemicals
Seeds
R&D
Fertilizers
Production
Household farming (10%)
76,000 producers Annual production - 107mmt
Independent private
farming (42%)
Agroholdings (48% of production)
Figure 4. Global Value Chain in Russia
15
Table 3. Inputs in the Wheat VC in Russia
Fertilizers Description • Meets 93% of domestic demand
• Net exporter (70% of production is exported. In 2014, fertilizer exports reached about 8.9 billion USD)
Key Actors Uralkali (20% of world's potash production), Uralchem Holding (2nd largest global ammonium nitrate producer), Eurochem Agro, Acron Group (top five global producer) Phosagro, SIBUR, Gazprom
Agrochemicals Description • Local self-sufficiency at 50%
• 110,000 tons consumed locally • Involved in 2/3 of grain seeding • Over 30% price spike for certain CPPPs
Key Actors Avgust, Schelkovo Agrohim, Volga Industry (part of the Agro Expert Group), DuPont, Himprom, Syngenta, BASF, Bayer Crop Science
Machinery Description • Depends on state subsidies
• Concentrated market with low investment and dated technology Key Actors Rosagroleasing, Rostselmash, Agromashholding, Argroprom Tehnica, John
Deere, Vaderstad, Claas, Rekordverken AB, KPAB Source: Authors based on literature review and field interviews Production. There are three primary types of production: Large scale farming (agroholdings) made from the former collective and state farms), independent private farming, and household farming (D. Rylko, 2010; Serova & Khramov, 2002 ). Large agricultural enterprises dominate this segment accounting for about 80 percent of wheat production (EIB, 2013; ROSSTAT, 2014b). These producers are mostly in the Southwest grain belt, Caucasus and Siberia. They produce wheat on plots ranging from 1000 to approximately 0.5 million hectares (ROSSTAT, 2014c). Individual households produce only about 1 percent of the wheat in Russia. There are about 200 agroholdings in Russia. Most of them have diversified activities in other industries and are vertically integrated across the chain (D. Rylko, 2010; Uzun et al., 2012). Agroholdings emerged in the late 1990s with industrialized agriculture that sought to increase output and improve crop quality (Gagalyuk et al., 2010; Liefert & Liefert, 2012; Salputra et al., 2013). These enterprises are vertically integrated with a wide range of investments including agricultural inputs, energy, retail, food and industrial manufacturing and grain exports. Their size and vertical integration allows them to maintain lower transaction costs across the chain, align business incentives and exploit their competitive advantage in other market segments. The size and domestic significance of these organizations gives them considerable power in the chain and influences some of the policy
16
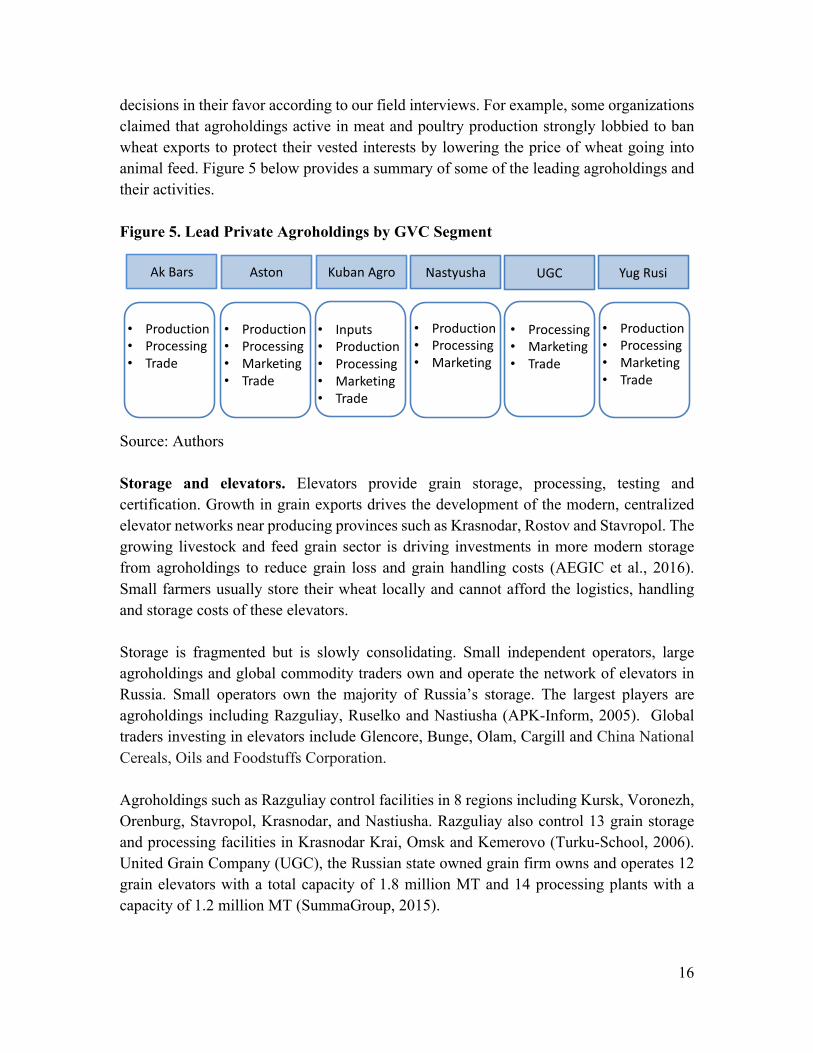
decisions in their favor according to our field interviews. For example, some organizations claimed that agroholdings active in meat and poultry production strongly lobbied to ban wheat exports to protect their vested interests by lowering the price of wheat going into animal feed. Figure 5 below provides a summary of some of the leading agroholdings and their activities. Figure 5. Lead Private Agroholdings by GVC Segment
Source: Authors Storage and elevators. Elevators provide grain storage, processing, testing and certification. Growth in grain exports drives the development of the modern, centralized elevator networks near producing provinces such as Krasnodar, Rostov and Stavropol. The growing livestock and feed grain sector is driving investments in more modern storage from agroholdings to reduce grain loss and grain handling costs (AEGIC et al., 2016). Small farmers usually store their wheat locally and cannot afford the logistics, handling and storage costs of these elevators. Storage is fragmented but is slowly consolidating. Small independent operators, large agroholdings and global commodity traders own and operate the network of elevators in Russia. Small operators own the majority of Russia’s storage. The largest players are agroholdings including Razguliay, Ruselko and Nastiusha (APK-Inform, 2005). Global traders investing in elevators include Glencore, Bunge, Olam, Cargill and China National Cereals, Oils and Foodstuffs Corporation. Agroholdings such as Razguliay control facilities in 8 regions including Kursk, Voronezh, Orenburg, Stavropol, Krasnodar, and Nastiusha. Razguliay also control 13 grain storage and processing facilities in Krasnodar Krai, Omsk and Kemerovo (Turku-School, 2006). United Grain Company (UGC), the Russian state owned grain firm owns and operates 12 grain elevators with a total capacity of 1.8 million MT and 14 processing plants with a capacity of 1.2 million MT (SummaGroup, 2015).
Ak Bars Aston KubanAgro Nastyusha UGC Yug Rusi
• Production• Processing• Trade
• Production• Processing• Marketing• Trade
• Inputs• Production• Processing• Marketing• Trade
• Production• Processing• Marketing
• Processing• Marketing• Trade
• Production• Processing• Marketing• Trade
Private Private Private Private PrivatePublic
17
In the early 2000s, Glencore, the Swiss based commodity giant invested in four elevators in Southern Russia with an estimated storage capacity of approximately 350,000 tones (APK-Inform, 2005). By September 2013, Glencore’s infrastructure increased to 11 facilities with a storage capacity exceeding 700,000 tones (Glencore, 2013). Also, in 2004 and 2005 “Bunge CIS” LLC, the Russian subsidiary of Bunge Ltd, purchased several grain elevators in Krasnodar, Voronezh and Rostov regions (BUNGE, 2016). Lead global firms invest in Russian grain elevators in the major producing regions to manage grain-handling costs to increase exports to the Middle East and North Africa. Most recently, the China National Cereals, Oils and Foodstuffs Corporation (COFCO) announced an investment deal that exceeds USD1.1 billion to establish a major logistics corridor consisting of 30 facilities, including a grain terminal and 29 elevators in various parts of Russia to export grains to China (RBTH, 2016). Flour Milling. Russia’s mills are outdated and have low profit margins, about three percent. The number of mills increased from 385 mills producing 18 million MT of flour in 1990s, to over 7000 mills but producing only 9.7 million MT of flour currently (Gordeeva, 2011; ROSSTAT, 2014a). The largest millers account for about one fourth of total flour output (Lyddon, 2013). The State is set to invest 6.8 billion RUR to develop grain and feed processing to supply a growing livestock market (MOA & Agriculture, 2014). Biofuels. Biofuels hold merely a 1.2 % share in the "overall energy production matrix of Russia (Muran, 2014). According to the USDA Gain Report of 2014, the Russian government has set the target of becoming more energy efficient by 2020 and has included it in the national strategy. While being one of the world’s leading producers and exporters of oil and gas, Russia has an insignificant share of biofuels (Muran, 2014). The emerging Russian biofuels industry’s export orientation is driven by continued demand from Europe and Asia. However, the production of biofuels still remains small and has almost no impact on Russia’s overall domestic grain and oilseed prices (Muran, 2014). The Russian Ministry of Energy reports that there are no government-backed biofuel projects in operation at this time. The majority of biofuel ventures in Russia are supported by regional governments or financed by foreign investors.
Trading. The majority of traders have offices in the central parts of Russia, the main grain producing and exporting region (Free-listing, 2015). The export segment is highly concentrated and competition among traders is intense. By 2014/2015 there were about 560 grain traders with the top 10 companies accounting for almost half of grain exports (Agroinvestor, 2015). Multinational firms accounted for approximately 42% of exports in 2014/2015 (Glencore, 2015). Most lead firms focus on wheat origination and trade
18
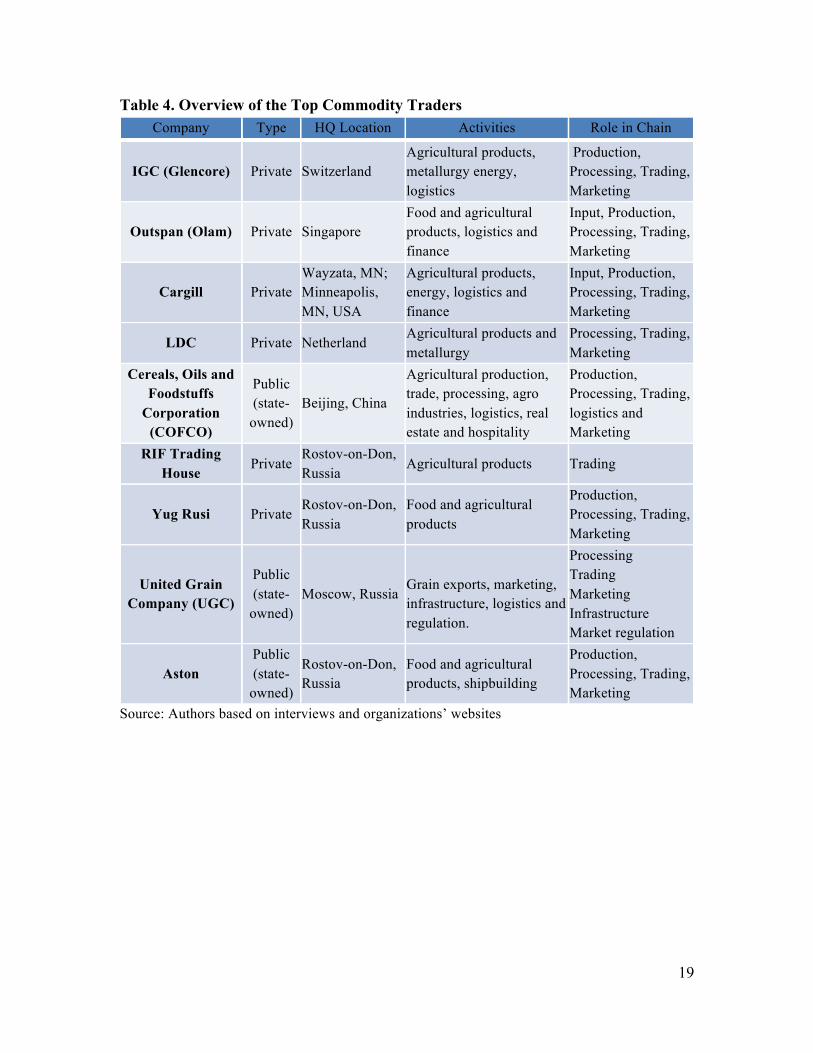
segments rather than wheat production (Gagalyuk et al., 2010). Lead exporting firms control deep and shallow water port elevators and terminals of the Black and Azov Seas and Volga-Don river basins. By 2005, these companies doubled Russia’s port capacity by investing in export infrastructure. The Russian government intervenes in wheat trade through the United Grain Company (UGC). UGC is the state owned firm that develops the grain infrastructure, promotes exports and trades wheat in international and domestic markets (SummaGroup, 2015). In 2012, Summa Group became a strategic investor in UGC, purchasing a major but non-controlling stake in the company. The United Grain Company operates across 18 regions in Russia. UGC is a shareholder in big elevators and port facilities in the port of Novorossiysk, the main grain and energy exporting hub (USDA, 2012, 2013). The company is also the stat agent handling and regulating the gain markets intervention fund. Competition for exports is intense in Russia and it is not unusual for new players to emerge to serve rising demand from the Middle East and North Africa. For example, RIF Trading House, a new operator headquartered in Rostov-on-Don, became Russia's second largest wheat exporter in 2013 and beat competitors such as Glencore in 2015 in a major bid to export wheat to Egypt (Medetsky, 2014). Lead global commodity traders established offices in Russia since the early 2000s. Top firms include Glencore, Cargill Inc., Archer-Daniels-Midland Co., Bunge Ltd., Louis Dreyfus and Olam. Glencore is the largest international trader of Russian wheat and is one of the top ten oil producers in Russia. These companies have diversified operations that range from wheat and other grain production, to processing and trading. Asian firms such as Mitsubishi and Marubeni also entered the Russian market and are investing in exports and processing. The Chinese COFCO is aggressively pursuing Russian grain market and recently announced a broad range of investments to export grains and livestock to China. Table 4 and Figure 6 below provide an overview of the top commodity traders.
19
Table 4. Overview of the Top Commodity Traders Company Type HQ Location Activities Role in Chain
IGC (Glencore) Private Switzerland Agricultural products, metallurgy energy, logistics
Production, Processing, Trading, Marketing
Outspan (Olam) Private Singapore Food and agricultural products, logistics and finance
Input, Production, Processing, Trading, Marketing
Cargill Private Wayzata, MN; Minneapolis, MN, USA
Agricultural products, energy, logistics and finance
Input, Production, Processing, Trading, Marketing
LDC Private Netherland Agricultural products and metallurgy
Processing, Trading, Marketing
Cereals, Oils and Foodstuffs
Corporation (COFCO)
Public (state-
owned) Beijing, China
Agricultural production, trade, processing, agro industries, logistics, real estate and hospitality
Production, Processing, Trading, logistics and Marketing
RIF Trading House
Private Rostov-on-Don, Russia
Agricultural products Trading
Yug Rusi Private Rostov-on-Don, Russia
Food and agricultural products
Production, Processing, Trading, Marketing
United Grain Company (UGC)
Public (state-
owned) Moscow, Russia
Grain exports, marketing, infrastructure, logistics and regulation.
Processing Trading Marketing Infrastructure Market regulation
Aston Public (state-
owned)
Rostov-on-Don, Russia
Food and agricultural products, shipbuilding
Production, Processing, Trading, Marketing
Source: Authors based on interviews and organizations’ websites
20
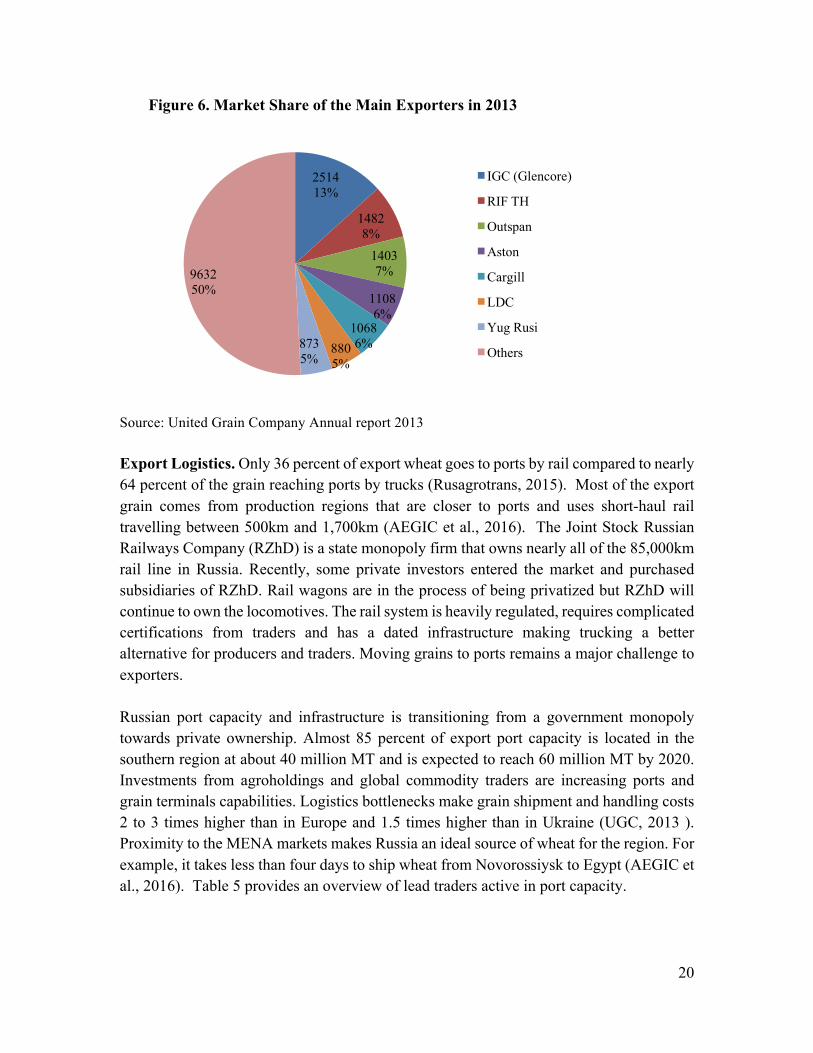
Figure 6. Market Share of the Main Exporters in 2013
Source: United Grain Company Annual report 2013 Export Logistics. Only 36 percent of export wheat goes to ports by rail compared to nearly 64 percent of the grain reaching ports by trucks (Rusagrotrans, 2015). Most of the export grain comes from production regions that are closer to ports and uses short-haul rail travelling between 500km and 1,700km (AEGIC et al., 2016). The Joint Stock Russian Railways Company (RZhD) is a state monopoly firm that owns nearly all of the 85,000km rail line in Russia. Recently, some private investors entered the market and purchased subsidiaries of RZhD. Rail wagons are in the process of being privatized but RZhD will continue to own the locomotives. The rail system is heavily regulated, requires complicated certifications from traders and has a dated infrastructure making trucking a better alternative for producers and traders. Moving grains to ports remains a major challenge to exporters. Russian port capacity and infrastructure is transitioning from a government monopoly towards private ownership. Almost 85 percent of export port capacity is located in the southern region at about 40 million MT and is expected to reach 60 million MT by 2020. Investments from agroholdings and global commodity traders are increasing ports and grain terminals capabilities. Logistics bottlenecks make grain shipment and handling costs 2 to 3 times higher than in Europe and 1.5 times higher than in Ukraine (UGC, 2013 ). Proximity to the MENA markets makes Russia an ideal source of wheat for the region. For example, it takes less than four days to ship wheat from Novorossiysk to Egypt (AEGIC et al., 2016). Table 5 provides an overview of lead traders active in port capacity.
251413%
14828%
14037%
11086%
10686%880
5%8735%
963250%
IGC (Glencore)
RIF TH
Outspan
Aston
Cargill
LDC
Yug Rusi
Others
21
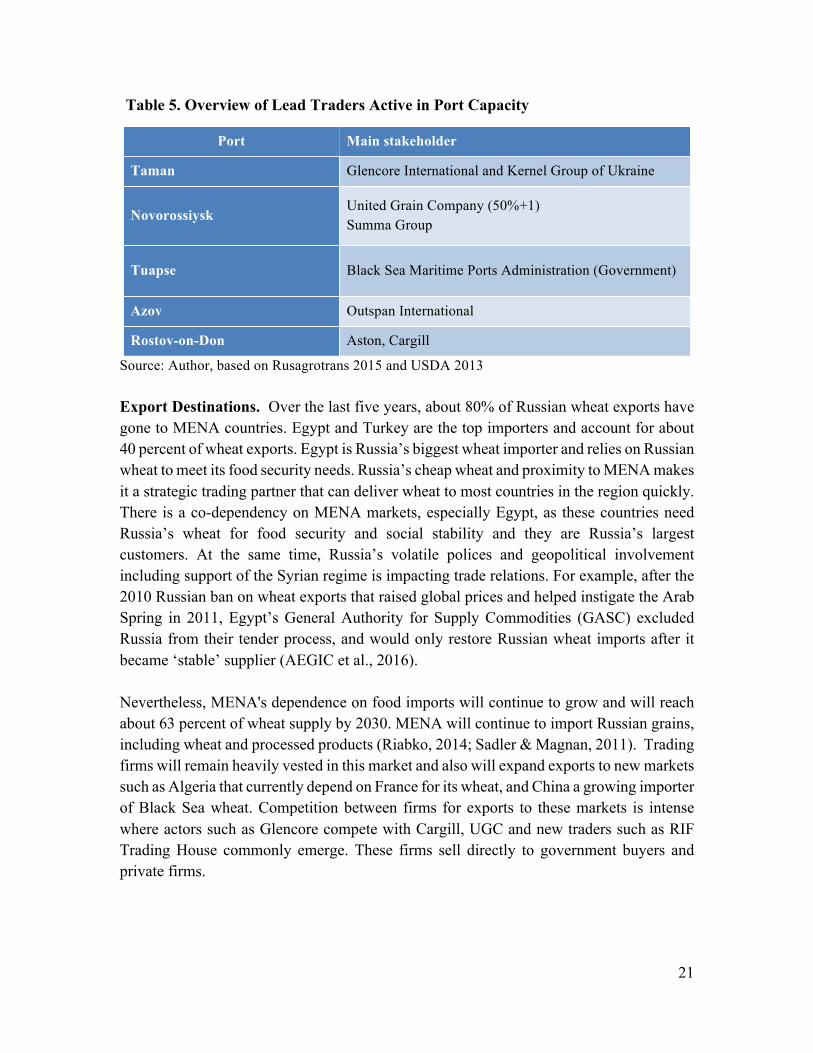
Table 5. Overview of Lead Traders Active in Port Capacity
Source: Author, based on Rusagrotrans 2015 and USDA 2013 Export Destinations. Over the last five years, about 80% of Russian wheat exports have gone to MENA countries. Egypt and Turkey are the top importers and account for about 40 percent of wheat exports. Egypt is Russia’s biggest wheat importer and relies on Russian wheat to meet its food security needs. Russia’s cheap wheat and proximity to MENA makes it a strategic trading partner that can deliver wheat to most countries in the region quickly. There is a co-dependency on MENA markets, especially Egypt, as these countries need Russia’s wheat for food security and social stability and they are Russia’s largest customers. At the same time, Russia’s volatile polices and geopolitical involvement including support of the Syrian regime is impacting trade relations. For example, after the 2010 Russian ban on wheat exports that raised global prices and helped instigate the Arab Spring in 2011, Egypt’s General Authority for Supply Commodities (GASC) excluded Russia from their tender process, and would only restore Russian wheat imports after it became ‘stable’ supplier (AEGIC et al., 2016). Nevertheless, MENA's dependence on food imports will continue to grow and will reach about 63 percent of wheat supply by 2030. MENA will continue to import Russian grains, including wheat and processed products (Riabko, 2014; Sadler & Magnan, 2011). Trading firms will remain heavily vested in this market and also will expand exports to new markets such as Algeria that currently depend on France for its wheat, and China a growing importer of Black Sea wheat. Competition between firms for exports to these markets is intense where actors such as Glencore compete with Cargill, UGC and new traders such as RIF Trading House commonly emerge. These firms sell directly to government buyers and private firms.
Port Main stakeholder
Taman Glencore International and Kernel Group of Ukraine
Novorossiysk United Grain Company (50%+1) Summa Group
Tuapse Black Sea Maritime Ports Administration (Government)
Azov Outspan International
Rostov-on-Don Aston, Cargill
22
Government Policy. Russia has slowly integrated into the global economy; adopting market based systems and joining the World Trade Organization. Agricultural and trade policies in the past twenty years indicate a clear focus on food security and national security. Challenges such as draughts, economic downturns and geopolitical dynamics are factors that make self-sufficiency and food affordability a priority in Russian policies. The government continues to play a major role in agriculture and intervenes in the sector by using policy instruments that influence the market. Russian policies support agriculture through the State Programme for Development of Agriculture, import substitution and trade restriction tools (FAO-EBRD, 2009). These policies have spillover effects in international and domestic markets that range from distorting markets to creating trade uncertainty among trading partners and investors. Trades bans, restrictions and geopolitical dynamics strain trade relations and expose importing countries to volatility and puts their food security at risk. Russia has a long history of using trade policies to protect domestic wheat supply and combat internal food inflation (Liefert & Liefert, 2012). In response to rising food prices in 2008, Russia restricted exports by imposing a tariff to stem domestic inflation. In 2010, after a severe drought that devastated the region’s wheat harvest, Russia banned all wheat exports for 6 months (Welton, 2011). More recently, as a result of the Crimea crisis and international sanctions that caused a surge in domestic food prices and the devaluation of the ruble, Russia imposed a high tax on wheat exports, essentially ending all shipments (Götz et al., 2013). Table 6 below provides a brief overview of these policies.
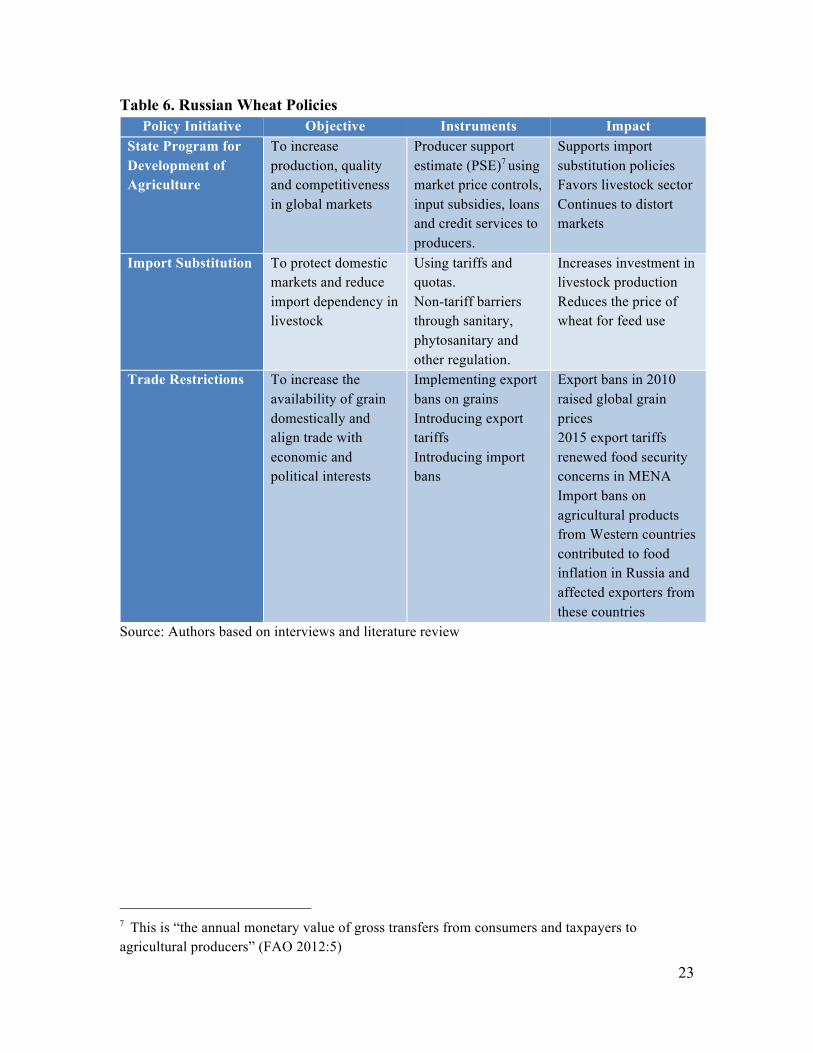
23
Table 6. Russian Wheat Policies Policy Initiative Objective Instruments Impact
State Program for Development of Agriculture
To increase production, quality and competitiveness in global markets
Producer support estimate (PSE)7 using market price controls, input subsidies, loans and credit services to producers.
Supports import substitution policies Favors livestock sector Continues to distort markets
Import Substitution To protect domestic markets and reduce import dependency in livestock
Using tariffs and quotas. Non-tariff barriers through sanitary, phytosanitary and other regulation.
Increases investment in livestock production Reduces the price of wheat for feed use
Trade Restrictions To increase the availability of grain domestically and align trade with economic and political interests
Implementing export bans on grains Introducing export tariffs Introducing import bans
Export bans in 2010 raised global grain prices 2015 export tariffs renewed food security concerns in MENA Import bans on agricultural products from Western countries contributed to food inflation in Russia and affected exporters from these countries
Source: Authors based on interviews and literature review
7 This is “the annual monetary value of gross transfers from consumers and taxpayers to agricultural producers” (FAO 2012:5)
24
Structural Analysis of the Chain and Impact on Food Security
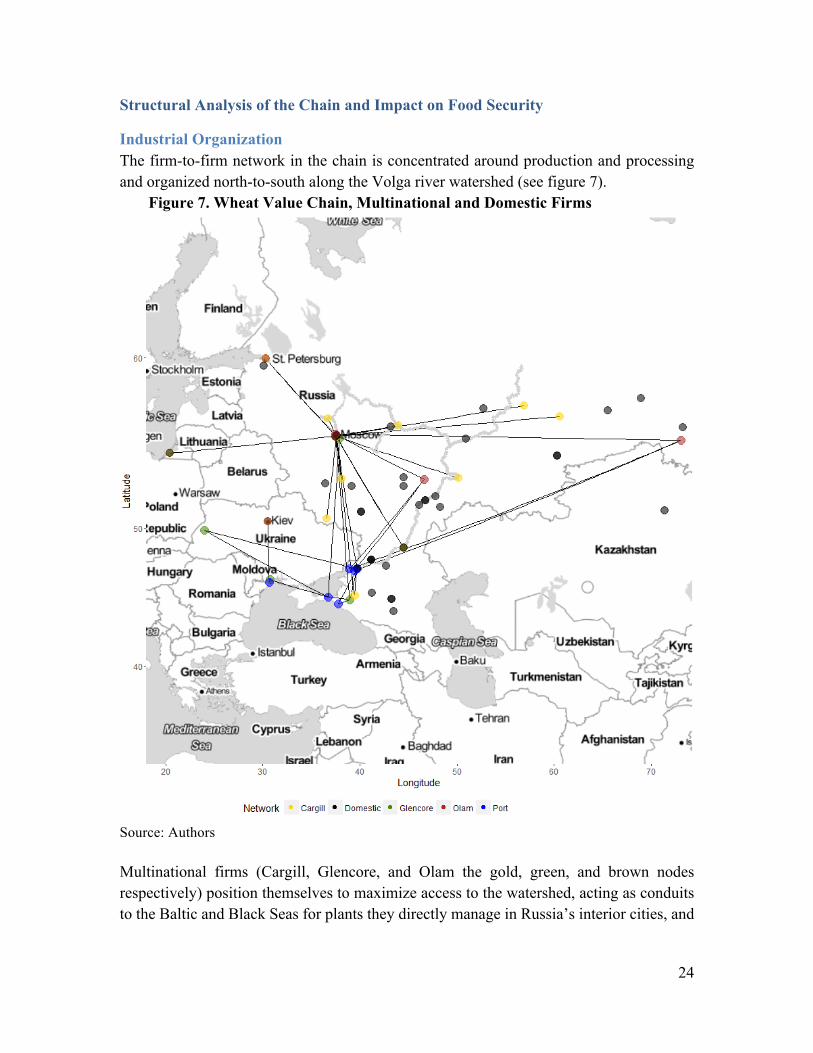
Industrial Organization The firm-to-firm network in the chain is concentrated around production and processing and organized north-to-south along the Volga river watershed (see figure 7).
Figure 7. Wheat Value Chain, Multinational and Domestic Firms
Source: Authors Multinational firms (Cargill, Glencore, and Olam the gold, green, and brown nodes respectively) position themselves to maximize access to the watershed, acting as conduits to the Baltic and Black Seas for plants they directly manage in Russia’s interior cities, and
25
for domestic producers and firms (black nodes). 8 Lines between nodes indicate coordination between offices and plants owned by multinational firms. The organization of the firm network reflects the overall governance of the wheat value chain. The wheat value chain has a hub/spoke network structure reflecting the multitude of actors involved in certain segments of the chain that become more integrated as more complex operations require economies of scale. This type of chain needs high coordination among actors, specialized knowledge, infrastructure and human capital to produce, process and export wheat efficiently. The network is fragmented within the wheat production stage of the chain and becomes more centralized in the processing and trading segments where large global firms are the lead players. Actors such as agroholdings and global lead firms consolidate value-adding activities to specific hubs to improve chain efficiency and manage costs. This organization allows actors to integrate different segments of the wheat chain and connect to other relevant chains to leverage their competitive advantage (Tsai, 2001). For example, Glencore’s operation in Russia extends beyond grain trading, including grain production, elevators, logistics, processing and energy. Similarly, Rusagro, one of the largest Russian agroholdings, has diversified operations in the grain chain, livestock chain, agricultural inputs and energy. The geography of the chain reveals a North and South divide based on function. Connections between the northern and southern hubs allow for efficient coordination and facilitate the development of more diversified production structures. This is evident in the diversification of both the multinational and domestic firms’ products and services in recent years (Authors Interviews 2015). Hubs in Moscow are the political and administrative centers of firms. Production, processing and trade are mostly in the South. These locations highlight the operational focus, logistical efficiency and trade orientations of actors. For example, the cities of Rostov-on-Don, Novorossiysk, and Taganrog, the blue port cities in Figure 7, have production, storage and ports that are closer to wheat demand markets in MENA. Also, firms such as Olam that are expanding in the growing Russian livestock sector have expanded their capacity in the central parts of Russia. The location of these firms suggests that they are oriented to domestic demand markets and growing exports to China. The
8 Multinational subsidiaries in Russia and Ukraine operate largely independently of each other; however, the chains are linked through both their mutual dependence on Black Sea ports and the importance of MENA as a major destination market.
26
central location captures the existing industrial capacity of the interior cities and lower production costs to process livestock. This chain depends on deep and established relationships among actors, which require high levels of trust. The highest number of ties is in the production segment, illustrating that lead firms diversify suppliers to manage the risk of disruptions and have buying power along the chain. The ties also reflect that the chain is sensitive to transaction costs, economic conditions and market prices. Firms in the chain have vested interests to maintain these ties and reduce costs to ensure that operations are efficient and the chain is well-functioning at all times. Lead global commodity traders can face coordination problems including variation in supply and/or price. This implies that tensions in the chain can emerge if challenges such as shifts in agroholdings production and processing divert wheat from exports or creates higher prices9.
Disruptions in the Wheat Value Chain Although the wheat export sector is one of the most developed business systems in Russia, traders and importers are at risk of chain disruptions due to policy shifts. These policies serve the geopolitical and food security interests of the Russian government and can have spillover effects on the food security and social stability of importing countries, such as Egypt. For example, the 2014 export duties imposed by the government raised fears of higher global wheat prices and lower Russian exports. Global prices experienced a brief increase and the State-sought objective to decrease inflation was not achieved. Moreover, market interventions hit hardest on wheat producers and discouraged quality improvement, and traders are increasingly associated with contract default risks (IKAR, 2015). Export restrictions and self-imposed sanctions in reaction to Western trade sanctions on Russia after Russia’s annexation of Crimea in 2015 served as another signal of Russian trade volatility. The sanctions limited exporters and benefited most the livestock industry, which continues to profit from the bulk of state support (Fellmann & Olexandr, 2012). The livestock industry actors comprised of large agro holdings and their lobbying
9 We compared the Russian wheat firm network to the energy sector to evaluate recent trade developments with East Asia. We believe expansion of Russia’s energy sector to East Asian markets foreshadows a similar expansion of wheat and wheat-based products. Oil and gas pipelines require pumping stations at 100-mile intervals depending on the terrain (Trench 2001). Although the workforce necessary to man these stations is small, they require train and road networks to support them. Presently, transportation networks are primarily located to the south. The development of transportation infrastructure to support the expanding Eastern Siberia Pacific Ocean (ESPO) pipeline has the potential of opening another northern route to East Asian markets. More generally, we believe recent investment in the East Asian market signals a deepening commitment on the part of Russia to expanding its role in East Asian markets, a commitment that aligns with the interests of both energy and food sector stakeholders.
27
groups are competing with large grain traders for influence in power in agricultural policy-making10. During depressed commodity prices, investments from foreign capital can play a big role in continuing to expand the grain sector and meeting growing export demand. Our analysis of the wheat value chain implies that lead global commodity traders will continue to invest in Russian exports. Multinational participation in the market benefits Russia directly by providing Russian growers and firms greater access to world markets. In addition, the combination of fertile agricultural regions capable of supporting wheat-based exports, geographic proximity to Northern Europe and the Middle East, as well as the presence of a specialized workforce and facilities capable of supporting a competitive export sector makes the exodus of multinational firms unlikely. These firms are likely to protect their investment and competitiveness by harnessing political and market power while operating in an unstable policy, geopolitical and economic environment. In our analysis of the global wheat value chain we identified four leading catalysts that influence actors and food security outcomes:
1. Environmental challenges- the ecosystem problems that negatively impact biodiversity such as draughts and water challenges.
2. Geopolitical dynamics- regional forces and power struggles that impact trade and security. These include political hostilities, social unrest, military interventions and armed conflicts that lead to national and regional instabilities.
3. Economic dynamics- market and trade conditions that shape the flow of commodities, private sector development and purchasing power. Market factors are characteristic elements of the market and shape trends over the short, medium or longer term such as energy prices and shifts in sourcing regions. Trade dynamics are the changes in trade that impact supply and demand. These dynamics include food trade bans and restrictions.
4. Public policy such as tariff and subsidy support policies. These are the legal, regulatory and other governance related processes that affect the economy, the environment and the population. The convergence of these catalysts can lead to disruptions in the wheat value chain in Russia and high prices in global markets. Table 7 below summarizes ways that these catalysts impact the wheat GVC and food security.
10 Glencore is attributed to having influenced the 2010 export ban decision in its favor (Seeds 2010).
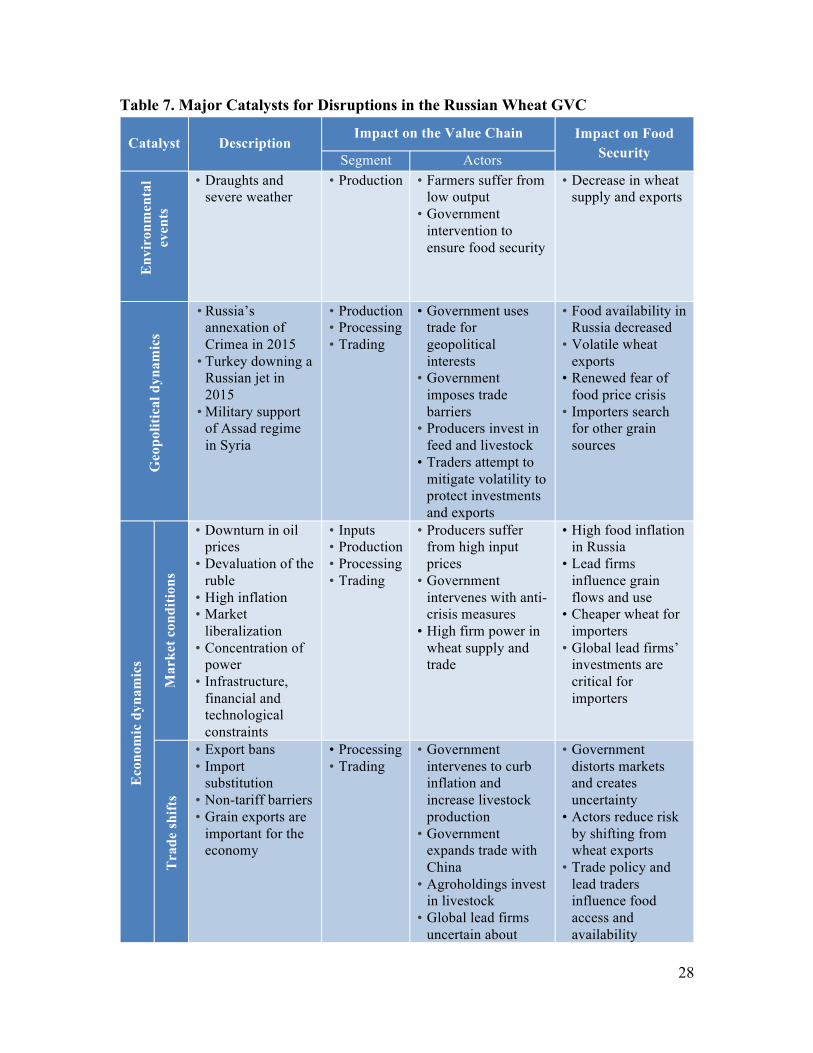
28
Table 7. Major Catalysts for Disruptions in the Russian Wheat GVC
Catalyst Description Impact on the Value Chain Impact on Food
Security Segment Actors E
nvir
onm
enta
l ev
ents
• Draughts and
severe weather • Production
• Farmers suffer from low output
• Government intervention to ensure food security
• Decrease in wheat supply and exports
Geo
polit
ical
dyn
amic
s
• Russia’s annexation of Crimea in 2015
• Turkey downing a Russian jet in 2015
• Military support of Assad regime in Syria
• Production • Processing • Trading
• Government uses trade for geopolitical interests
• Government imposes trade barriers
• Producers invest in feed and livestock
• Traders attempt to mitigate volatility to protect investments and exports
• Food availability in Russia decreased
• Volatile wheat exports
• Renewed fear of food price crisis
• Importers search for other grain sources
Eco
nom
ic d
ynam
ics
Mar
ket c
ondi
tions
• Downturn in oil prices
• Devaluation of the ruble
• High inflation • Market
liberalization • Concentration of
power • Infrastructure,
financial and technological constraints
• Inputs • Production • Processing • Trading
• Producers suffer from high input prices
• Government intervenes with anti-crisis measures
• High firm power in wheat supply and trade
• High food inflation in Russia
• Lead firms influence grain flows and use
• Cheaper wheat for importers
• Global lead firms’ investments are critical for importers
Tra
de sh
ifts
• Export bans • Import
substitution • Non-tariff barriers • Grain exports are
important for the economy
• Processing • Trading
• Government intervenes to curb inflation and increase livestock production
• Government expands trade with China
• Agroholdings invest in livestock
• Global lead firms uncertain about
• Government distorts markets and creates uncertainty
• Actors reduce risk by shifting from wheat exports
• Trade policy and lead traders influence food access and availability
29
wheat trade and investments
• Shifts in supply increase prices and food insecurity of importers
Publ
ic p
olic
y • High government
intervention • Slow transition to
a market economy • Increasing
producer price support
• Import substitution
• Trade barriers
• Production • Processing • Trading
• Government highly impacts the chain and trade geography
• Producers depend on government support
• Agroholdings leverage policies to invest in livestock
• Traders worry about regulatory instability
• Policies and inefficiencies disrupt investments in agriculture
• Shifts in government support decrease production
• Changes in wheat use can reduce exports
• Policies create uncertainty among traders and importers
Source: Authors based on interviews and literature review
Conclusion Russia is now the largest exporter of wheat. Private investment has increased production and export capacity. The government continues to monopolize some value chain segments, such as transportation, and intervenes in the sector to support national interests. Policy interventions distort the market, discourage foreign investments and disrupt trade. As Russia increases its share of the wheat market it must improve the policy environment and remove these bottlenecks along its wheat value chain. The country has a long history of using trade policies to protect domestic wheat supplies and to combat internal food inflation. In 2010, after a severe drought that devastated the region’s wheat harvest, Russia banned all wheat exports for 6 months. More recently, as a result of the Crimea crisis and international sanctions that caused a surge in domestic food prices and the devaluation of the ruble, Russia has imposed a high tax on wheat exports essentially ending all shipments. These trade disruptions have significant implications for importing countries that are reliant on Russian wheat and often push these nations to purchase more expensive wheat from alternative partners. Trade relations with Russia and wheat exports contribute to food security around the world, especially import-dependent regions like MENA. In the last decade, these countries have increased their reliance on Russian wheat imports and are therefore vulnerable to price and supply fluctuations that occur in the country. MENA's import dependence on food products will continue to making the region even more vulnerable to global food price shocks (Wright & Cafiero, 2010). Wheat price will continue to be the main determinant in wheat
30
purchases for a region experiencing modest regional macroeconomic outlook and reduced oil revenues, as well as fiscal deficits and high public debt. The inflationary impact on vulnerable populations could potentially spark unrests in a region that remains unstable, with persisting conflicts in Iraq, Syria, Libya and Yemen (Devarajan & Mottaghi, 2015; World-Bank, 2012). Yemen tops the list as the most vulnerable country to wheat price and quantity shocks (USDA, 2015). Timely access to stable and cheaper supplies of wheat is essential to guarantee food security and political stability in the MENA region.
31
References AEGIC,ProfRossKingwel,DrChrisCarter,MrPeterElliott,andDrPeterWhite.
(2016).Russia’swheatindustry:ImplicationsforAustralia.Perth;Sydney:
AustralioanExportGrainInnnovationCenterpp.7-50.
Agroinvestor.(2015).Топ-10экспортеровзернасезона-2014/15.
Ahmed,Ghada,DannyHamrickandGaryGereffi.(2014)."Shiftinggovernance
structuresinthewheatvaluechain:Implicationsforfoodsecurityinthe
MiddleEastandNorthAfrica."CenteronGlobalization,Governance&Competitiveness,Durham:DukeUniversity.
Aksoy,MAtamanandJohnCBeghin.(2004).Globalagriculturaltradeanddevelopingcountries:WorldBankPublications.
Analytictech.(2016).WhatIsSocialNetworkAnalysis?
APK-Inform.(2005).GlencorebuyselevatorsinthesouthofRussia,APKInform-Agrinews.
Brown,OliandAlecCrawford.(2009)."RisingTemperatures,RisingTensions."
ClimatechangeandtheriskofviolentconflictintheMiddleEast.Winnipeg:InternationalInstituteforSustainableDevelopment.
BUNGE.(2016).BungeinRussia.
Burnett,KimandSophiaMurphy.(2014)."Whatplaceforinternationaltradeinfood
sovereignty?".JournalofPeasantStudies,41(6):1065-1084.Busch,LawrenceandArunasJuska.(1997)."Beyondpoliticaleconomy:actor
networksandtheglobalizationofagriculture."ReviewofInternationalPoIiticaIEconomy,4(4):688-708.
Clapp,Jennifer.(2013)."Financialization,DistanceandGlobalFoodPolitics".Paper
presentedattheFoodSovereignty:ACriticalDialogueYaleUniversity.
September14-15.
Devarajan,ShantaandLiliMottaghi.(2015)."Towardsanewsocialcontract."MENAEconomicMonitor.
Dicken,Peter,PhilipFKelly,KrisOlds,andHenryWai�ChungYeung.(2001)."Chainsandnetworks,territoriesandscales:towardsarelationalframework
foranalysingtheglobaleconomy."Globalnetworks,1(2):89-112.EC.(2015).Agri-foodtradein2014:EU-USinteractionstrengthened.European
Union:EuropeanUnion,2015.http://ec.europa.eu/agriculture/trade-analysis/map/2015-1_en.pdf.
EIA.(2015).Russia:InternationalEnergyDataandAnalysis.Washington,DC:U.S.
EnergyInformationAdministration.
https://www.eia.gov/beta/international/analysis.cfm?iso=RUS.EIB.(2013).SmallandMediumEntrepreneurshipinRussia.Luxemburg:European
InvestmentBank,EY,TheEUBank.November2013.
FAO.(1996)."WorldFoodSmmit."
FAO-EBRD.(2009).RussianFederation:AnalysisoftheAgribusinessSectorin
SouthernRussia.Rome,Italy:FAOINVESTMENTCENTRE/EBRD
COOPERATIONPROGRAMME.January.
http://www.fao.org/docrep/012/aj281e/aj281e00.htm.
32
Fellmann,ThomasandNekhayOlexandr.(2012).Agriculturalsectorandmarket
developments:aspecialfocusonUkraine,RussiaandKazakhstan(No.EUR
25554EN).JointResearchCenter:EuropeanCommission.
Free-listing.(2015).ListofcompaniesinRussianFederation_wheat-grain.companyprofile,productsandtradeleads2015,fromhttp://www.listofcompaniesin.com/russian-federation/wheat-grain/
Friedma,HarrietandPhilipMcMichael.(1989)."Agricultureandthestatesystem:
Theriseanddeclineofnationalagricultures,1870tothepresent."Sociologiaruralis,29(2):93-117.
Gabre-Madhin,EleniZandStevenHaggblade.(2004)."SuccessesinAfrican
agriculture:resultsofanexpertsurvey."Worlddevelopment,32(5):745-766.Gagalyuk,T.,JHanfandBelayaV.(2010)."VerticalCoordinationinCentralandEast
EuropeanCountries:StatusQuoandOutlook."19THANNUALWORLDFORUM&SYMPOSIUM(AgribusinessandAgro-industriesDevelopmentinCentralandEasternEurope.WorkshopProceedings.FAO).
Gereffi,Gary.(1994).TheOrganizationofBuyer-DrivenCommodityChains:How
U.S.RetailersShapeOverseasProduction.InG.Gereffi&M.Korzeniewiez
(Eds.),CommodityChainsandGlobalCapitalism(pp.95-122).Westport,Connecticut:Praeger.
---.(2014)."Globalvaluechainsinapost-WashingtonConsensusworld."ReviewofInternationalPoliticalEconomy,21(1):9-37.
Gereffi,Gary,JohnHumphreyandRaphaelKaplinsky.(2001)."Introduction:
Globalisation,valuechainsanddevelopment."IDSbulletin,32(3):1-8.Gereffi,Gary,JohnHumphreyandTimothySturgeon.(2005)."Thegovernanceof
globalvaluechains."Reviewofinternationalpoliticaleconomy,12(1):78-104.Gereffi,Gary,JoonkooLeeandMichelleChristian.(2009)."US-basedfoodand
agriculturalvaluechainsandtheirrelevancetohealthydiets."Journalofhunger&environmentalnutrition,4(3-4):357-374.
Glencore.(2013)."InvestorDay_10September2013."Glencorepresentation.---.(2015)."Glencorecompanypresentation."PresentationgiventoGhadaAhmed,
DannyHamrickandNataliaMirovitskaya.Godfray,HCharlesJ,IanRCrute,LawrenceHaddad,DavidLawrence,JamesFMuir,
NicholasNisbett,JulesPretty,ShermanRobinson,CamillaToulmin,and
RosalindWhiteley.(2010).Thefutureoftheglobalfoodsystem:TheRoyal
Society.
Gordeeva,M.(2011).Мельничныйапгрейд.
Götz,Linde,ThomasGlaubenandBernhardBrümmer.(2013)."Wheatexport
restrictionsanddomesticmarketeffectsinRussiaandUkraineduringthe
foodcrisis."FoodPolicy,38:214-226.TransportStrategyoftheRussianFederationupto20301032-pC.F.R.(2014).
Headey,Derek.(2011)."Rethinkingtheglobalfoodcrisis:Theroleoftradeshocks."
FoodPolicy,36(2):136-146.Henderson,Jeffrey,PeterDicken,MartinHess,NeilCoe,andHenryWai-Chung
Yeung.(2002)."Globalproductionnetworksandtheanalysisofeconomic
development."Reviewofinternationalpoliticaleconomy,9(3):436-464.Heresy,Paulde.(1956)."WheatandWorldTrade."FEE.
33
Humphrey,John.(2007)."Thesupermarketrevolutionindevelopingcountries:tidal
waveortoughcompetitivestruggle?".JournalofEconomicGeography,7(4):433-450.
IKAR.(2015)."Новаяэкспортнаяпошлинанапшеницу"хромает"спервых
днейприменения-эксперты."IKAR.Jarosz,Lucy.(2014)."Comparingfoodsecurityandfoodsovereigntydiscourses."
DialoguesinHumanGeography,4(2):168-181.Konefal,Jason,MichaelMascarenhasandMakiHatanaka.(2005)."Governanceinthe
globalagro-foodsystem:Backlightingtheroleoftransnationalsupermarket
chains."AgricultureandHumanValues,22(3):291-302.Lampietti,Julian,MichelleBattat,SeanMichaels,DanaErekat,ArnolddeHartog,and
DonaldLarson.(2011).TheGrainChain:ManagingWheatImportsinArab
Countries.WashingtonDC:TheWorldBankandFoodandAgriculture
OrganizationoftheUnitedNations.
Lang,Tim.(1996)."Economicglobalizationandfoodsecurity."GlobalPesticideCampaigner,6(3).
Liefert,WilliamM.andOlgaLiefert.(2012)."RussianAgricultureduringTransition:
Performance,GlobalImpact,andOutlook."AppliedEconomicPerspectivesandPolicy,34(1):37-75.
Lyddon,Chris(2013).FocusonGrain:WorldGrain.
McMichael,Philip.(2008)."Thepeasantas‘canary’?Nottooearlywarningsofglobal
catastrophe."Development,51(4):504-511.---.(2009)."Afoodregimeanalysisofthe‘worldfoodcrisis’."Agricultureandhuman
values,26(4):281.Medetsky,Anatoly.(2014).RussianGrainTraderBeatingCargilltoOlamasExports
Surge:Bloomberg.
Milberg,William.(2004)."Thechangingstructureoftradelinkedtoglobal
productionsystems:whatarethepolicyimplications?".InternationalLabourReview,143(1�2):45-90.
Milner,Helen.(1999)."ThePoliticalEconomyofInternationalTrade."AnnualReviewofPoliticalScience,2(1):91-114.
Mitra,SiddhartaandTimJosling.(2009)."Agriculturalexportrestrictions:Welfare
implicationsandtradedisciplines."InternationalFood&AgriculturalTradePolicyCouncil(IPC).
166C.F.R.(2014).
Muran,Marina.(2014).GrainReport_Russia_BiofuelsSectorUpdate.Moscow:USDA
FAS.6/30/2014.http://gain.fas.usda.gov/Recent GAIN Publications/Biofuels Annual_Moscow_Russian Federation_6-30-2014.pdf.
Murphy,Sophia,DavidBurchandJenniferClapp.(2012)."Cerealsecrets:theworld's
largestgraintradersandglobalagriculture."Cerealsecrets:theworld'slargestgraintradersandglobalagriculture.
OECD.(2015).AgriculturalPolicyMonitoringandEvaluation2015.PARISOECDPublishing.
Orgnet.(2016).SocialNetworkAnalysis:AnIntroduction:Orgnet.
34
Parry,Martin,CynthiaRosenzweig,AnaIglesias,GüntherFischer,andMatthew
Livermore.(1999)."Climatechangeandworldfoodsecurity:anew
assessment."Globalenvironmentalchange,9:S51-S67.RBTH.(2016).Russia-Chinaagreementongrainhubcallsforinvesting$1.1bln.
RussiaBeyondtheHeadlinesfromhttp://rbth.com/business/2016/06/24/russia-china-agreement-on-grain-hub-calls-for-investing-11-bln_605857.
Riabko,Natalija.(2014).Agro-tradedynamicsoftheblackseacountries.In
MediTERRA2014(english)(pp.73-85):PressesdeSciencesPo(PFNSP).Rosegrant,MarkWandSarahACline.(2003)."Globalfoodsecurity:challengesand
policies."Science,302(5652):1917-1919.ROSSTAT.(2014a).Productionoffoodstuffs.
---.(2014b).ProductionStructureforDifferentCategoriesofOrganizations
---.(2014c).WheatYieldsforDifferentCatergoriesofCrops.
Rozelle,ScottandJohanSwinnen.(2009)."Politicaleconomyofagricultural
distortionsintransitioncountriesofAsiaandEurope."AgriculturalDistortionsWorkingPaper-WorldBank(82).
Rusagrotrans.(2015).Перевозкизернаиэкспортнаяинфраструктурав
преддверииновогосезона.
Rutten,Martine,LindsayShutesandGerdienMeijerink.(2013)."Sitdownattheball
game:Howtradebarriersmaketheworldlessfoodsecure."FoodPolicy,38:1-10.
Rylko,D.(2010).NewAgriculturalOperators(“agroholdings”)inRussiaandBlack
SeaFSU:causes,currentstate,andfuturechallenges:IKAR-Institutefor
AgriculturalMarketStudies.
http://www.agribenchmark.org/fileadmin/Dateiablage/B-Cash-Crop/Conferences/2010/Presentations/a2-_agroholdings_in_Russia_Rylko.pdf.
Rylko,Dmitri,IrinaKhramova,VasiliUzun,andRobertJolly.(2008)."Agroholdings:
Russia'sNewAgricultural
Operators."Russia'sAgricultureinTransition:96-131.Sadler,MarcandNicholasMagnan.(2011)."GrainimportdependencyintheMENA
region:riskmanagementoptions."FoodSecurity,3(1):77-89.Salputra,Guna,MyrnavanLeeuwen,PetraSalamon,ThomasFellmann,Martin
Banse,OlivervonLedebur,OlexandrNekhay,andRobertM'barek.(2013).
Theagri-foodsectorinRussia:Currentsituationandmarketoutlookuntil
2025.InstituteforProspectiveandTechnologicalStudies,JointResearchCentre,2016,fromftp://ftp.jrc.es/pub/EURdoc/EURdoc/JRC76915.pdf.
Seeds.(2010)."Foodcrisisoragribusinessasusual?".Seeds.Serova,E.andI.Khramov.(2002)."MarketTransactionsinRussia’sAgriculture."
Sobal,Jeffery,LauraKettelKhanandCaroleBisogni.(1998)."Aconceptualmodelof
thefoodandnutritionsystem."SocialScience&Medicine,47(7):853-863.SummaGroup.(2015).Agriculture_UnitedGrainCompany.Agriculture,2015,from
https://www.summagroup.ru/agriculture/united_grain_company/en/.Trench,CherylJ.(2001)."HowPipelinesMaketheOilMarketWork–Their
Networks,OperationandRegulation."AMemorandumPreparedfortheAssociationofOilPipeLinesandtheAmericanPetroleumInstitute’sPipelineCommittee,AllegroEnergyGroup,NewYork.
35
Trostle,Ronald.(2008).Globalagriculturalsupplyanddemand:factorscontributingtotherecentincreaseinfoodcommodityprices:USDepartmentofAgriculture,EconomicResearchServiceWashington,DC.
Tsai,Wenpin.(2001)."Knowledgetransferinintraorganizationalnetworks:Effects
ofnetworkpositionandabsorptivecapacityonbusinessunitinnovationand
performance."Academyofmanagementjournal,44(5):996-1004.Turku-School.(2006)."FoodIndustryValueChainsinLeningradOblastand
KrasnodarKrai."TurkuSchoollofEconomicsandBusinessAdministration.UGC.(2013)."UnitedGrainCompanyAnnualReport."
USDA.(2012).USDAAgriculturalProjectionsto2021(No.OCE-2012-1).
---.(2013).RussianGrainPortCapacityandTransportationUpdate(No.RS1352):
UnitedStatesdepartmentofAgricultureFAS.August,16.
http://gain.fas.usda.gov/Recent GAIN Publications/Russian Grain Port Capacity and Transportation Update_Moscow_Russian Federation_8-16-2013.pdf.
---.(2014).RussiaBansKeyU.S.AgriculturalExports.Washington,DC:UnitedStates
DepartmentofAgriculture,ForeignAgriculturalService
http://www.fas.usda.gov/data/russia-bans-key-us-agricultural-exports.---.(2015).GrainandFeedAnnual(No.RS1514).Moscow:FASMoscow.3/31/2015.
http://gain.fas.usda.gov/Recent GAIN Publications/Grain and Feed Annual_Moscow_Russian Federation_3-30-2015.pdf.
---.(2016).Grain:WorldMarketsandTrade.Washington,DC:UnitedStates
DepartmentofAgriculture-ForeignAgriculturalService.July2016.
http://apps.fas.usda.gov/psdonline/circulars/grain.pdf.Uzun,V.,N.ShagaidaandV.Saraykin.(2012).RussianAgroholdingsandTheirRole
inGrainProduction,ResearchonAgriculturalTransitionPolicy.FAORegionalOfficeforEuropeandCentralAsia:FAO.
Welton,George.(2011)."TheimpactofRussia's2010grainexportban."OxfamPolicyandPractice:Agriculture,FoodandLand,11(5):76-107.
World-Bank.(2008).RussianFederation_Agriculturalirrigatedland.WorldBankData,2016,fromhttp://data.worldbank.org/indicator/AG.LND.IRIG.AG.ZS?locations=RU.
---.(2012)."MENA:FacingaNewFoodCrisis?."MENAMonitor.Wright,BrianandCARLOCafiero.(2010).Grainreservesandfoodsecurityinmena
countries.Conference:UCBerkeleyconferenceonagriculturefordevelopment-revisited.
Yalch,Teale,GhadaAhmedandDannyHamrick.(2015)."ComparingRussia’sand
Ukraine’sWheatGVC."[ResearchBrief].DukeMINERVA(No6).


![Field Screening of Lesotho and South African Wheat ...Russian wheat aphid (Diuraphis noxia (Kurdjumov)) has spread from its native area in central Asia [1]to all the major wheat producing](https://static.fdocuments.net/doc/165x107/60815ffd4942667de122f31b/field-screening-of-lesotho-and-south-african-wheat-russian-wheat-aphid-diuraphis.jpg)