Running title: Nuclear Telomeric Architecture Profiling in MDS and
29
1 Profiling Three-Dimensional Nuclear Telomeric Architecture of Myelodysplastic Syndrome and Acute Myeloid Leukemia Defines Patient Subgroups Gadji Macoura 1, 2 , Awe Julius Adebayo 1, 3 , Rodriguez Prerana 1 , Kumar Rajat 4 , Houston Donald S. 4 , Ludger Klewes 1 , Tandakha Ndiaye Dièye 2 , Rego Eduardo Magalhães 5 . Falcão Passetto Roberto 5 , de Oliveira Fábio Morato 5 , Mai Sabine 1 1- The University of Manitoba, Manitoba Institute of Cell Biology (MICB), Cancer Care Manitoba (CCMB), The Genomic Centre for Cancer Research and Diagnosis (GCCRD), The University of Manitoba, 675 McDermot Avenue, Winnipeg, Manitoba, Canada R3E 0V9 2- The Cheikh Anta Diop University of Dakar, Laboratory of Haematology and Immunology, National Centre of Blood Transfusion of Dakar, BP 5002, Dakar Fann, Senegal 3- School of Life Sciences, Skvde University, Box 408, 541 28, Skvde, Sweden 4- Section of Hematoloy/Oncology, Department of Internal Medicine, University of Manitoba, 675 McDermot Avenue, Winnipeg, Manitoba, Canada R3E 0V9 5- Department of Internal Medicine – Division of Hematology, School of Medicine of Ribeirão Preto, University of São Paulo – Av. Bandeirantes, 3900, 14049-900 Ribeirão Preto, SP, Brazil; National Institute of Science and Technology in Stem Cell and Cell Therapy, Ribeirão Preto, Brazil. Running title: Nuclear Telomeric Architecture Profiling in MDS and AML Keywords: Nuclear Architecture, MDS, AML, Anemia, Telomeres, Genomic Instability Competing interest statement: The authors have no conflict of interest to disclosure Corresponding author: Dr Sabine Mai Manitoba Institute of Cell Biology, 675 McDermot Ave, Winnipeg Manitoba, Canada R3E 0V9 Email: [email protected] Research. on April 10, 2019. © 2012 American Association for Cancer clincancerres.aacrjournals.org Downloaded from Author manuscripts have been peer reviewed and accepted for publication but have not yet been edited. Author Manuscript Published OnlineFirst on April 26, 2012; DOI: 10.1158/1078-0432.CCR-12-0087
Transcript of Running title: Nuclear Telomeric Architecture Profiling in MDS and

1
Profiling Three-Dimensional Nuclear Telomeric Architecture of Myelodysplastic Syndrome and Acute Myeloid Leukemia Defines Patient Subgroups Gadji Macoura1, 2, Awe Julius Adebayo1, 3, Rodriguez Prerana1, Kumar Rajat4, Houston Donald
S.4, Ludger Klewes1, Tandakha Ndiaye Dièye2, Rego Eduardo Magalhães5. Falcão Passetto
Roberto5, de Oliveira Fábio Morato5, Mai Sabine1
1- The University of Manitoba, Manitoba Institute of Cell Biology (MICB), Cancer Care
Manitoba (CCMB), The Genomic Centre for Cancer Research and Diagnosis (GCCRD), The
University of Manitoba, 675 McDermot Avenue, Winnipeg, Manitoba, Canada R3E 0V9
2- The Cheikh Anta Diop University of Dakar, Laboratory of Haematology and Immunology,
National Centre of Blood Transfusion of Dakar, BP 5002, Dakar Fann, Senegal
3- School of Life Sciences, Sk�vde University, Box 408, 541 28, Sk�vde, Sweden
4- Section of Hematoloy/Oncology, Department of Internal Medicine, University of Manitoba,
675 McDermot Avenue, Winnipeg, Manitoba, Canada R3E 0V9
5- Department of Internal Medicine – Division of Hematology, School of Medicine of Ribeirão
Preto, University of São Paulo – Av. Bandeirantes, 3900, 14049-900 Ribeirão Preto, SP, Brazil;
National Institute of Science and Technology in Stem Cell and Cell Therapy, Ribeirão Preto,
Brazil.
Running title: Nuclear Telomeric Architecture Profiling in MDS and AML
Keywords: Nuclear Architecture, MDS, AML, Anemia, Telomeres, Genomic
Instability
Competing interest statement: The authors have no conflict of interest to disclosure
Corresponding author: Dr Sabine Mai Manitoba Institute of Cell Biology,
675 McDermot Ave, Winnipeg
Manitoba, Canada R3E 0V9
Email: [email protected]
Research. on April 10, 2019. © 2012 American Association for Cancerclincancerres.aacrjournals.org Downloaded from
Author manuscripts have been peer reviewed and accepted for publication but have not yet been edited. Author Manuscript Published OnlineFirst on April 26, 2012; DOI: 10.1158/1078-0432.CCR-12-0087

2
Statement of translational relevance We describe three-dimensional (3D) nuclear telomere dysfunction in Myelodysplastic
Syndromes (MDS) and Acute Myeloid Leukemia (AML). Blindly performed profiling of
MDS and AML allows for the categorization of both MDS and AML patients and patient
subgroups. This is the first time that such a clear distinction in between MDS and AML
becomes reality based on specific quantitative 3D nuclear telomeric parameters that
include telomeric sizes, telomere numbers/nucleus, the presence of telomeric aggregates,
nuclear volumes, and the telomere distribution in the nucleus (1-3). Our 3D nuclear
telomere marker is proposed as a new structural molecular biomarker for MDS and AML
with possible future implications on clinical management of patients.
Summary: Purpose
Myelodysplastic Syndromes (MDS) are a group of disorders characterized by cytopenias, with a
propensity for evolution into Acute Myeloid Leukemias (AML). This transformation is driven by
genomic instability but mechanisms remain unknown. Telomere dysfunction might generate
genomic instability leading to cytopenias and disease progression.
Experimental Design
We undertook a pilot study of 94 patients with MDS (56 patients) and AML (38 patients). The
MDS cohort consisted of RCMD (32 cases), RA (12 cases), RAEB1 (8 cases), RAEB2 (1 case),
RARS (2 cases), and MDS with isolated del(5q) (1 case). The AML cohort was composed of
AML-M4 (12 cases), AML-M2 (10 cases), AML-M5 (5 cases), AML-M0 (5 cases), AML-M1 (2
cases), AML-M4eo (1 case), and AML with multidysplasia related changes (1 case). Three-
dimensional quantitative fluorescent in situ hybridization of telomeres was performed on nuclei
from bone marrow samples and analyzed using TeloViewTM.
Results
Research. on April 10, 2019. © 2012 American Association for Cancerclincancerres.aacrjournals.org Downloaded from
Author manuscripts have been peer reviewed and accepted for publication but have not yet been edited. Author Manuscript Published OnlineFirst on April 26, 2012; DOI: 10.1158/1078-0432.CCR-12-0087

3
We defined 3D nuclear telomeric profiles based on telomere numbers, telomeric aggregates,
telomere signal intensities, nuclear volumes, and nuclear telomere distribution. Using these
parameters, we blindly subdivided the MDS patients into 9 subgroups and the AML patients into
6 subgroups. Each of the parameters showed significant differences between MDS and AML.
Combining all parameters revealed significant differences between all subgroups. 3D telomeric
profiles are linked to the evolution of telomere dysfunction defining a model of progression from
MDS to AML.
Conclusions
Our results show distinct 3D telomeric profiles specific to patients with MDS and AML that help
subgroup patients based on the severity of telomere dysfunction highlighted in the profiles.
Introduction
Myelodysplastic syndromes (MDS) are composed of a heterogeneous group of clonal disorders
affecting hematopoietic progenitors that display genomic instability (4). MDS is characterized by
dysplasia and ineffective haematopoiesis (5,6). MDS represents one of the five major categories
of myeloid neoplasms according to the classification of hematological cancers by the World
Health Organization (WHO) (5 , 6, 7). Myeloid neoplasms display a fundamental characteristic
feature that is stem-cell-derived clonal myelopoiesis with altered proliferation and differentiation
(6). MDS, de novo or secondary to ionizing radiation, toxins or chemotherapeutic drug exposure,
generally follows a course of progressive cytopenias with varying degrees of anemia, leucopenia,
and thrombocytopenia. This renders the patients dependent on red cell transfusions or susceptible
to infection or hemorrhage (5, 7). Pathologically, the two main characteristics of MDS are
excessive intramedullary apoptosis of hematopoietic cells accompanied by excessive proliferation
in the marrow (8, 9). This excessive apoptosis is largely cytokine-mediated, with a number of
pro-inflammatory cytokines being over-expressed in the marrows such as TNFα, TGFß, and
IL1ß. This phenomenon is related to the non-specific haploinsufficiency of RP14 (10-13).
However, the cellular and molecular mechanisms of the cytopenias are not well understood.
Importantly, 1/3 of cases of MDS are characterized by progression to acute myeloid leukemia
(AML/MDS), by the accumulation of genetic abnormalities and blockage of cell differentiation
Research. on April 10, 2019. © 2012 American Association for Cancerclincancerres.aacrjournals.org Downloaded from
Author manuscripts have been peer reviewed and accepted for publication but have not yet been edited. Author Manuscript Published OnlineFirst on April 26, 2012; DOI: 10.1158/1078-0432.CCR-12-0087

4
and accumulation of blast cells. The pathology of MDS and AML/MDS are cytologically
distinguishable since the cell types show very different morphologies including their dysplastic
features. The evolution of MDS to AML/MDS is characterized by genomic instability (14, 15).
Acute myeloid leukemia (AML) is a clonal expansion of myeloid blasts in bone marrow, blood or
other tissues, and is distinguished from MDS by the increased numbers of blast cells (more than
20% of blast cells in the marrow). MDS and AML are sustained by genomic instability, which is
a hallmark of all cancers (14, 16). Although chromosomal aberrations are common in both MDS
and AML, a substantial proportion of cases have normal karyotypes (15).
One major cause of genomic instability and cellular apoptosis is telomere dysfunction. However,
few studies have addressed the impact of telomeres in MDS and AML/MDS (14, 17). Telomeres
are the ends of chromosomes capped by a protective protein complex, termed shelterin (18).
Proper telomere capping preserves chromosomal integrity and prevents terminal end-to-end
fusions. Telomere loss or dysfunction results in breakage-bridge-fusion cycles, aneuploidy and
ongoing chromosomal rearrangements (15). Telomeres also are thought to contribute to
chromosome positioning within the nucleus (19). The 3D nuclear organization of telomeres
allows for a distinction between normal and tumour cells: nuclei of the latter tend to be
disorganized, and commonly contain telomeric aggregates (20). Alterations in telomere
architecture and telomeric dysfunction are associated with the onset of genomic instability (2, 3,
21). Our previous work showed altered 3D telomeric organization in different types of cancer (3 ,
15 , 20 , 21 , 22 , 23 , 24 , 25 , 26). However, despite several studies demonstrating the role of
telomere dysfunction in the occurrence of hematopoietic malignancies, little is known about their
possible role(s) in the evolution of MDS and transition to AML/MDS (27). Data describing the
average telomere length and individual telomere length in MDS and AML showed that the
transition from MDS to AML was characterized by increased telomere shortening and
chromosomal abnormalities (14, 17 , 28 , 29 , 30, 31). However, the underlying mechanism(s)
remain unknown. To decipher cellular and molecular mechanisms in MDS and AML, we
examined telomere dysfunction and alterations in the 3D nuclear telomere architecture.
3- Materials and Methods 3.1- Patients
Research. on April 10, 2019. © 2012 American Association for Cancerclincancerres.aacrjournals.org Downloaded from
Author manuscripts have been peer reviewed and accepted for publication but have not yet been edited. Author Manuscript Published OnlineFirst on April 26, 2012; DOI: 10.1158/1078-0432.CCR-12-0087

5
This study received approval by the Research Ethics Board on human studies at the University of
Manitoba (H2010:277), and in Brazil (1735/2011). Patients were enrolled at regular basis during
their clinical follow-up after informed consent and before any treatment. The patient population
included in this study was composed of 7 patients from Cancer Care Manitoba (CCMB) and 87
patients from Brazil. In this latter country, all patients' samples were sent to the Hematology
Service of the University Hospital, School of Medicine of Ribeirão Preto, University of São
Paulo. The diagnosis of MDS and AML was based on morphology, immunophenotypic analysis
and cytogenetics. The patients enrolled for this investigation have no previous diagnosis of other
hematological disease. The diagnosis and clinical management of our cohort patients were made
according to their clinical presentation based on clinical features, pathological,
immunophenotypic, cytological, and cytogenetic diagnoses as recommended by the WHO.
3.2- Clinical surrogates, FAB and WHO classifications
Clinical data were collected from a total of 94 patients from Brazil and Manitoba following their
enrolment in this study between 2006-2011 (Brazil) and 2010-2011 (Manitoba). Only patients
with suspicion of MDS or AML were included in this cohort before any treatment. According to
WHO criteria based on clinical, pathological and cytogenetic diagnoses, our cohort was
composed of 56 cases of MDS and 38 cases of AML. The MDS cohort consisted of Refractory
Cytopenia with Multilineage Dysplasia (RCMD = 32 cases), Refractory Anaemia (RA = 12
cases), Refractory Anaemia with Excess of Blasts 1 and 2 (RAEB-1 = 8; RAEB-2 = 1 case),
Refractory Anaemia with Ring Sideroblasts (RARS = 2 cases), and MDS associated with isolated
del(5q) (1 case). The AML cohort was composed of AML-M4 (12 cases), AML-M2 (10 cases),
AML-M5 (5 cases), AML-M0 (5 cases), AML-M1 (2 cases), AML-M4eo (1 case), and AML
with multidysplasia related changes (1 case) (Tables S1 and S2). The mean age of the patients
was 58 years (range 17 to 88 years), and the median age 62 (range 17 to 88 years) (Suppl. data
Tables S1 and S2).
3.3- Sampling
Bone marrow-aspiration was performed from each patient following standard clinical procedure
and sent to the haematological laboratory, and to the cytogenetic laboratory for clinical and
pathological diagnosis, and to our research laboratory for the analysis of the 3D nuclear telomeric
Research. on April 10, 2019. © 2012 American Association for Cancerclincancerres.aacrjournals.org Downloaded from
Author manuscripts have been peer reviewed and accepted for publication but have not yet been edited. Author Manuscript Published OnlineFirst on April 26, 2012; DOI: 10.1158/1078-0432.CCR-12-0087

6
architecture. Cytological diagnosis and the cytogenetic determination of chromosomal
abnormalities were assessed according to standard protocols (supplemental data Tables S1, S2).
Samples from Brazil were 3D-fixed prior to shipment to the Manitoba Institute of Cell Biology
(MICB), where samples from CCMB were 3D directly fixed. 3D fixation was performed
according to our standard methods (21, 26).
3.4- Three-dimensional (3D) Quantitative Fluorescent In Situ Hybridization (Q-FISH)
The QFISH procedure was performed as described previously (21, 26). Briefly, after incubation
in 3.7% formaldehyde/ 1xPBS for 20 minutes, slides were immerged in 20% glycerol/ 1xPBS for
1 hour. Then, the nuclei were treated by four repeated cycles of freeze-thaw in glycerol/ liquid
nitrogen. The next step was equilibration of the slides in 0.1 HCL solution and fixation in 70%
formamide/ 2xSCC for at least 1 hour. Immediately after this fixation, 8μl of PNA telomeric
probe (Dako, Glostrup, Denmark) were applied to the slides, which were sealed and placed into a
HybriteTM (Vysis, Abbott Diagnostics, Des Plaints, IL). Denaturation was performed at 80°C for
3 minutes for both cells and probe, followed by their hybridization at 30°C for 2 hours. The slides
were then washed twice for 15 minutes in 70% formamide/ 10mM Tris pH 7.4 followed by
washing in 1x PBS at room temperature for 1 minute while shaking and in 0.1x SSC at 55°C for
5 minutes while shaking. Furthermore, the slides were washed in 2x SSC/ 0.05% Tween 20 twice
for 5 minutes each at room temperature while shaking. Thereafter, the slides were counter-stained
with 4’,6-diamino-2-phenylindole (DAPI) (0.1μg/ml) and cover slipped with ProLong GOLD
antifade reagent (Invitrogen, Molecular probes, USA) prior to image acquisition.
3.5- Image acquisition and 3D image analysis using TeloViewTM system
We performed 3D image analysis on 30 interphase nuclei per slide using an AxioImager Z1
microscope (Carl Zeiss Canada Ltd, Toronto, Canada.) and an AxioCam HRm charge-coupled
device (Carl Zeiss Canada Ltd.). A 63-x oil objective lens (Carl Zeiss Canada Ltd.) was used at
acquisition times of 600 milliseconds (ms) for Cy3 (telomeres) and 7 ms for DAPI (nuclei). Sixty
z-stacks were acquired at a sampling distance of x,y: 102 nm and z: 200 nm for each slice of the
stack. AxioVision 4.8 software (Carl Zeiss Canada Ltd.) was used for 3D image acquisition, and
a constrained iterative algorithm (1, 32) was used for deconvolution. Deconvolved images were
Research. on April 10, 2019. © 2012 American Association for Cancerclincancerres.aacrjournals.org Downloaded from
Author manuscripts have been peer reviewed and accepted for publication but have not yet been edited. Author Manuscript Published OnlineFirst on April 26, 2012; DOI: 10.1158/1078-0432.CCR-12-0087

7
converted into TIFF files and exported for 3D-analysis using the TeloViewTM software program
(1, 32) (Figure 1 A and B).
3.6- Data analysis
TeloViewTM (1, 21, 26) computes five parameters on each sample:
1- the number of signals, i.e. the number of telomeres
2- the signal intensity, i.e. the telomere length
3- the number of telomere aggregates, which means clusters of telomeres that are found
in close proximity that cannot be further resolved as separate entities by TeloViewTM
at an optical resolution limit of 200 nm
4- the a/c ratios determined by representing the nuclear space occupied by the telomeres
as an ovoid, with two main axes, a and b, that are equal in length, and a third axis, c,
that has a different length (1). This distribution of telomeres in the three-dimensional
space of the nucleus varies with cell cycle; as the specific stages of the cell cycle
(G0/G1, S, and G2) phases have characteristic a/c ratios, one can determine where
they reside in the cell cycle (1). The a/c ratio is a means of defining progression
through cell cycle in interphase cells (26).
5- the distance of each telomere from the nuclear centre versus the periphery
These parameters in a 3D nucleus define all 3D telomere features we measured.
Three types of histograms were produced: i) line graphs showing the distribution in the intensity
of the acquired telomere fluorescent signals; ii) histograms of the distribution of the number of
aggregates per cell; and iii) histograms of the distribution of the number of acquired signals per
cell. The percentage of cells having telomeric aggregates, and the mean number of signals, and
mean number of aggregates per cell was calculated. The histogram data from different samples
were combined into a single chart for comparison.
3.7- Statistical considerations
Fifteen subgroups were defined based on their 3D telomeric profiles. The telomeric parameters
(number, length, telomere aggregates, nuclear volumes, and a/c ratio) were compared between
these fifteen subgroups using a nested factorial analysis of variance. Multiple pairwise
comparisons using a least square mean tests followed a significant omnibus subgroup effect.
Research. on April 10, 2019. © 2012 American Association for Cancerclincancerres.aacrjournals.org Downloaded from
Author manuscripts have been peer reviewed and accepted for publication but have not yet been edited. Author Manuscript Published OnlineFirst on April 26, 2012; DOI: 10.1158/1078-0432.CCR-12-0087

8
Distribution of telomere intensities in MDS and AML clinical categories was compared between
various patient subgroups using chi-square contingency analysis. Cell parameters averages were
analyzed between subgroups with nested factorial analysis of variance taking both patient and
cellular variations into account. Significance level was set at alpha = 0.05. Classification of the
different clinical subgroups of patients according to the number of telomeres (signals), telomere
lengths (intensities), and the number of telomeric aggregates were determined by stepwise
discriminate analyses.
4- Results
4.1- 3D Nuclear profiling using the number of telomeres, nuclear distribution of telomeres,
signal intensities, and telomeres aggregates.
All samples were analyzed in a blinded fashion. We first analyzed the 3D telomere profiles
(Figure 1C), i,e. the total number of telomeres versus their lengths and aggregates in each cell of
each sample using TeloViewTM (1, 21, 26). Subsequently, the 3D telomere profile was defined by
the distribution pattern of telomeres per sample according to their intensity (length and aggregate
formation). This profile allows one to identify in each patient cell population those nuclei with
short, intermediate and long telomeres. Patients showing the same profiles were classified in the
same subgroup. According to the 3D telomere profiles, we were blindly able to classify all the
patients into fifteen different subgroups without knowing their clinical diagnosis (Figures 2, 3;
supplemental data Figure S1, Table S5).
All patients of a subgroup display similar 3D telomeric profiles. Comparison with clinical
diagnosis (see section 4.3) after the classification according to telomere profile showed that all
MDS patients were classified in the 9 first subgroups (Figure 2, subgroups from A to F; and from
I to K; supplemental data Figure S1, Table S5), whereas all but 2 of the AML patients were
classified in the last 6 subgroups (Figure 3, subgroups G, H, L, M, N and O; supplemental data
Figure S1, Table S5). Statistical analyses showed significant differences between the MDS-
subgroups and the AML subgroups (p < 0.001). Each of the quantitative telomere parameters
exhibited significant differences between MDS and AML. Furthermore, statistical analyses
combining all 3D telomere parameters revealed significant differences between all subgroups (p
< 0.05) (Supplemental data Table S5).
Research. on April 10, 2019. © 2012 American Association for Cancerclincancerres.aacrjournals.org Downloaded from
Author manuscripts have been peer reviewed and accepted for publication but have not yet been edited. Author Manuscript Published OnlineFirst on April 26, 2012; DOI: 10.1158/1078-0432.CCR-12-0087

9
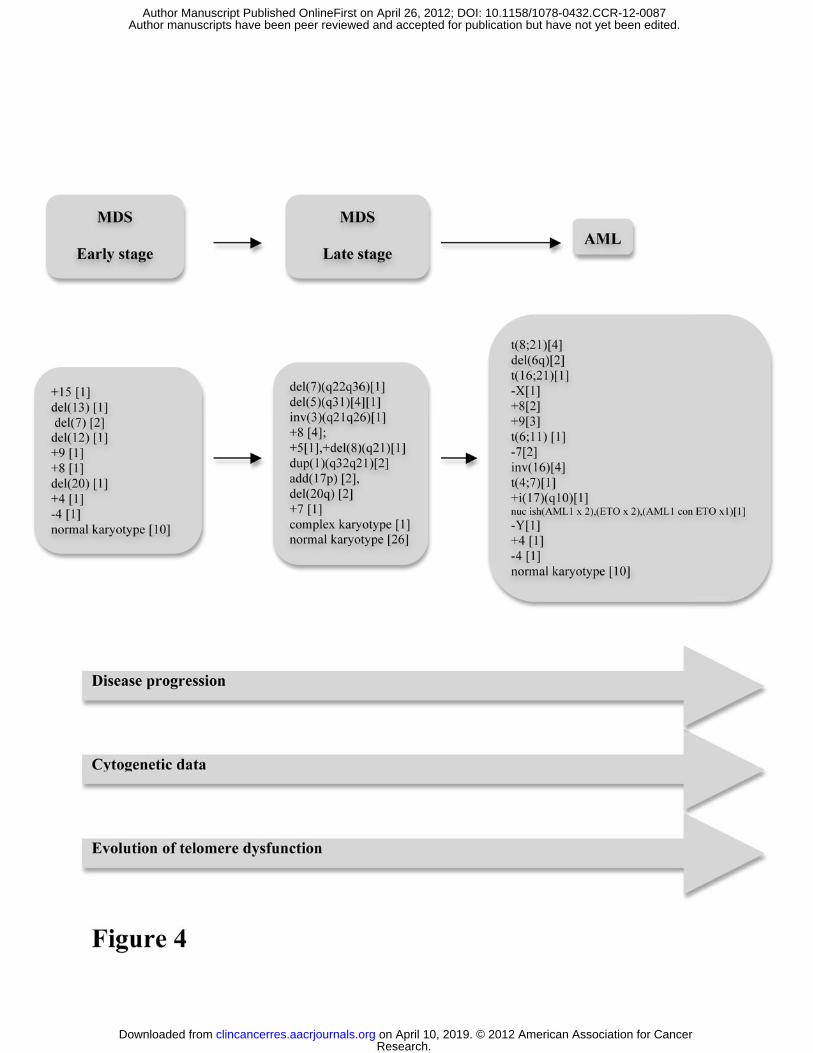
Studying the dynamic variation of the number of telomeres versus the telomere intensities and the
number of telomeres aggregates, we suggest a chronological evolution between these different
subgroups (Figure 2A to Figure 3O, supplemental data Figure S1, Table S5). In fact, these
profiles appear linked to the evolution of increased telomere dysfunction in these subgroups. We
suggest that the evolution of MDS progresses from early low to later high level of telomere
dysfunction, i.e. from early stage of MDS to more severe stages followed by the transformation
to AML (Figure 2A to Figure 3O) (Figure 4). Future studies into this process are warranted.
4.2- 3D telomere profiles versus chromosomal abnormalities in the fifteen subgroups
To evaluate the chromosomal abnormalities in the fifteen blindly examined subgroups, the code
was removed and patients were placed into their respective disease groups. We compared the
cytogenetic data in the fifteen subgroups (Table 1), and we found patients with distinct
cytogenetic aberrations, patients sharing identical chromosomal abnormalities in all groups
(Table 1; Figure 4) as well as patients with normal karyotypes. Overall, the cytogenetic features
of each patient and group did not indicate cumulative acquisitions of chromosomal abnormalities
from one subgroup to the following one.
We conclude that the cytogenetic analyses of the samples did not discriminate the patient
subgroups (Figure 4). This is in contrast to their definition based on the 3D nuclear telomeric
profiles (Table 1; Figure 4).
4.3- 3D Telomere parameters in MDS and AML
We analyzed the telomere parameters between patients with clinical diagnoses of MDS and AML
(Table 2). Number of signals per nucleus, telomere aggregates per nucleus, total telomere
intensity, and average intensity of signals were all higher in the AML cases than in the MDS
cases (p < 0.0001 for all comparisons except the average intensity of signal for which p <0.05).
We conclude that telomere parameters are highly accurate to distinguish MDS to AML. This
reinforces our model of applying the 3D telomeric profiles for the classification of both MDS and
AML (Figures 2 and 3; supplemental data Figure S1, Table S5).
4.4- 3D Telomere parameters versus cytogenetic risk factor classifications of AML
Research. on April 10, 2019. © 2012 American Association for Cancerclincancerres.aacrjournals.org Downloaded from
Author manuscripts have been peer reviewed and accepted for publication but have not yet been edited. Author Manuscript Published OnlineFirst on April 26, 2012; DOI: 10.1158/1078-0432.CCR-12-0087

10
The WHO classification of AML takes into account the cytogenetic and molecular data to predict
the clinical outcome of AML-patients following treatment. Eight cases of our AML-patients fall
into the “Favourable” category, 12 into “Intermediate”, and 5 into “Unfavourable”, 9 into “AML
not otherwise specified”, and 4 lacked karyotype information. We compared the 3D-telomeric
profiles of each WHO group of patients to the other groups and vice -versa. Comparing the
telomere parameters (section 4.4) between the “Favorable”, “Intermediate” and “Unfavorable”
categories, only the number of signals per nucleus displays a difference, with the “Unfavourable”
cases having on average 35% more signals than the “Favourable” cases (p = 0.03). All other
comparative pairing analyses using these parameters were not significant (Supplemental data
Table S3). However, according to 3D telomere profiles, the 6- AML subgroups are different from
WHO classes. We conclude that future validation with larger patient cohorts is needed to
establish our 3D telomeric profiling as an additional tool for clinical management in AML.
Notwithstanding, these results reflect a relative cytological homogeneity of the categories that
might be linked to the increase number of blast cells. Indeed, AML is characterized by increasing
number of blasts due to the hiatus of maturation that avoids the differentiation of precursor cells.
The number of blasts in AML can vary from 20 to 70 and to finally reach 100%. At this latter
level, maybe all the blasts cell display the same 3D telomere profile paving the way of a possible
link between number of blast and telomere dysfunction. Indeed, telomere dysfunction is a
continuum with increased genomic changes as is the continuing increased number of blasts. We
conclude that the cytogenetic categorisations from WHO classification of AML did not reflect the
genomic instability in AML as observed using the 3D telomeric profiles (Figures 2 and 3; Table
2; and Supplemental data Figure S1, Table S5).
4.5- 3D Telomere parameters compared to IPSS and WPSS in MDS-patients
Using the defined indexes such as IPSS (International Prognostic Scoring System) and WPSS
(WHO Prognostic Scoring System) (33, 34) to establish the prognostic of the follow-up of MDS-
patients, we classified our patients and compared these indexes with aforementioned telomere
parameters. Using IPSS, our MDS-patients fall into 3 groups: IPSS < 2 (47 cases); IPSS > 2 with
age < 60 years (3 cases); and IPSS > 2 with age > 60 years (6 cases). Comparative statistical
analyses using the different telomere parameters between these 3 groups show no significant
differences (p > 0.05) (Suppl. data Table S4a).
Research. on April 10, 2019. © 2012 American Association for Cancerclincancerres.aacrjournals.org Downloaded from
Author manuscripts have been peer reviewed and accepted for publication but have not yet been edited. Author Manuscript Published OnlineFirst on April 26, 2012; DOI: 10.1158/1078-0432.CCR-12-0087

11
Furthermore, all our MDS-patients fall in 4 groups using WHO Prognostic Scoring System
(WPSS): WPSS = 0 (43 cases); WPSS = 1 (12 cases); WPSS = 2 (1 case); and WPSS = 3 (1
case). Comparative statistical analyses using the different aforementioned telomere parameters
between these 4 groups show no significant differences, except the average intensity of all the
telomere signals between both groups in the WPSS = 0 and WPSS = 1 (p = 0.03) (Suppl. data
Table S4b). We found that the prognostic indexes such as IPSS, and WPSS did not discriminate
MDS patients while this was achieved using their 3D nuclear telomeric profiles. These indexes
although taking into account the cytogenetic abnormalities, appear less representative of the
disease when compared to the 3D telomeric profiles (Suppl. data Table S4; Figures 2 and 3;
Table 1).
4.6- 3D telomeres and Cell Cycle Distribution in MDS and AML We next investigated nuclear volumes, the distribution of the telomeres per nuclear volume and
the a/c ratio. These three parameters allow for the characterization of cell cycle distribution,
similar to Ki67 (26), cell size and overall distribution of telomeres within the 3D nuclear space.
The nuclear volume is significantly higher in AML than MDS (p < 0.0001), which likely might
be attributable to the increased number of blast cells in AML. This early process of
transformation of MDS to AML is detected by the variation in the nuclear volume. Furthermore,
this latter is significantly different between WHO AML classes (all p < 0.05). This reinforces the
value of the increased numbers of blast cells in the prognostic course of AML that our tool can
detect very early.
We evaluated whether there was a difference in cell cycle between our patients with MDS and
AML. While the a/c ratio in AML patients was somewhat higher, this did not achieve
significance (Table 2). In line with the a/c ratio, telomere distribution per nuclear volume did not
show any significant difference between MDS and AML. This might be related to a similar
cycling state of cells in both diseases, where cells are in a proliferative state.
Finally, in MDS subgroups defined by the IPSS or the WPSS, no significant difference was found
in any of the three aforementioned parameters (Suppl. Data Table S4). This is in line with the fact
that the IPSS and the WPSS do not reflect the cell cycle of MDS, nor its proliferative index.
Research. on April 10, 2019. © 2012 American Association for Cancerclincancerres.aacrjournals.org Downloaded from
Author manuscripts have been peer reviewed and accepted for publication but have not yet been edited. Author Manuscript Published OnlineFirst on April 26, 2012; DOI: 10.1158/1078-0432.CCR-12-0087

12
5- Discussion We analyzed the 3D nuclear telomeric architecture, and determined the telomere numbers, the
presence of telomere aggregates, telomere signal intensities, nuclear volumes, and nuclear
telomere distribution in MDS and AML. Using these parameters, we determined 3D telomeric
profiles, and we were able to blindly subdivide the MDS patients into 9 subgroups and the AML
patients into 6 subgroups. WHO classifications distinguish also 8 classes of MDS and 4 major
classes (regrouping many entities in one class) of AML (5 , 6 , 7).
Analyzing the evolution of telomere dysfunction in MDS and AML allows us to propose a model
of telomere dysfunction in the progression from MDS to AML. Our results show distinct
telomeric profiles specific to patients with MDS and AML, and imply for the first time a
chronological and evolutionary process of telomere dysfunction in both diseases. Our data are
consistent with the hypothesis that telomere dysfunction generates genomic instability, leading to
worsening cytopenias and to the transformation of MDS to AML. 3D telomere profiles seem to
be a potential biomarker that, in the future, may improve the clinical management of these
patients.
3D telomere profiles are indicative of apoptosis and proliferation in MDS
In all subtypes of MDS, high rates of apoptosis mediated by inflammatory cytokines in the bone
marrow contribute to the ineffective hematopoiesis and peripheral cytopenias (11, 13, 35).
However, apoptosis is not inherited uniformly by all the cell lineages in the marrow, since the
cells most sensitive to apoptosis are the ones undergoing premature death in the marrow while
those most resistant to it are the cells that make it into the blood (35, 36). This assertion is
strongly supported by the fact that granulocytes from normal healthy donors are more sensitive to
apoptosis than the clonal granulocytes in MDS (36). The initial clonal expansion and the selective
apoptosis of three different cell lineages in the marrow remain to be understood.
Haploinsufficiency of both RPS14 and RBM22 genes may contribute to this phenomenon in the
pathogenesis of the 5q- syndrome (6), but the mechanisms in other subtypes of MDS remain to be
elucidated.
One major causal phenomenon producing apoptosis and genomic instability is telomere
dysfunction (15). Telomere dysfunction is tissue- and cell type specific, and may explain the
occurrence of both proliferation and apoptosis in specific cell lineages. In MDS, cytopenias affect
Research. on April 10, 2019. © 2012 American Association for Cancerclincancerres.aacrjournals.org Downloaded from
Author manuscripts have been peer reviewed and accepted for publication but have not yet been edited. Author Manuscript Published OnlineFirst on April 26, 2012; DOI: 10.1158/1078-0432.CCR-12-0087

13
three cell lineages (erythroid, granulocytic and megakaryocytic lineages). Taking into account
that the granulocytic cell lineage is more resistant to apoptosis, the fact that anaemia is most often
the first manifestation of marrow failure in MDS might be explained by apoptosis due to telomere
dysfunction in this specific cell lineage. This also might explain the abnormalities in the
megakaryocytic lineage. In the end, telomere dysfunction might prevent maturation in the
granulocytic lineage, which resists apoptosis, and maintains this cell lineage at the level of blast
cells. The result of this phenomenon is the increase of blast cells and the transformation of MDS
to AML. Telomere dysfunction might generate proliferation in one cell lineage (cells in which
genomic instability gives a proliferative advantage), and apoptosis in another cell lineage (cells in
which genomic instability leads to cell death) at the same time. It may thus explain the clonal
expansion and the selective apoptosis in the bone marrow. A suitable assessment of telomere
dynamics in MDS and AML might explain the pathogenesis of both diseases (28, 29). Taking
these findings into account, a chronological and evolutionary process of telomere dysfunction in
both diseases might be linked to worsening cytopenias and to the transformation of MDS to
AML.
3D telomere profiles define MDS and AML subgroups
Using TeloViewTM to evaluate telomere dynamics in every cell, we show for the first time
different 3D telomeric profiles specific to subgroups of MDS and AML (Figures 2 and 3;
supplemental data Figure S1). These profiles follow an apparently sequential progression,
consistent with a working model of telomere changes as drivers of evolution of MDS to AML
(Figure 4). It will therefore be important to investigate with larger patient cohorts whether these
telomere profiles can serve as biomarker of MDS and AML.
While we have not examined a longitudinal profile of single patients, our data set describes the
existence of MDS- and AML-specific 3D nuclear telomere dysfunction. Using our 3D nuclear
parameters blindly, we were able to subgroup the patients into MDS and AML and to subdivide
these disease groups further. Future analyses will have to provide evidence on a patient-by-
patient basis as to whether 3D nuclear telomere dysfunction can serve as reliable biomarker in
predicting disease progression. Indeed, our previous work has demonstrated that one key
difference between normal and cancer cells is the presence of telomere aggregates (20). We
found telomere aggregates in all the samples in both diseases, but with a significant difference
Research. on April 10, 2019. © 2012 American Association for Cancerclincancerres.aacrjournals.org Downloaded from
Author manuscripts have been peer reviewed and accepted for publication but have not yet been edited. Author Manuscript Published OnlineFirst on April 26, 2012; DOI: 10.1158/1078-0432.CCR-12-0087

14
between MDS and AML (Table 2; p <0.0001). This might allow for the detection of the early
stages of MDS in patients presenting with anemia since changes in nuclear architecture precede
the development of chromosomal abnormalities (20, 37). It was shown that telomere shortening
in MDS is independent of the presence of cytogenetic abnormality (29).
Nuclear telomere profiling seems to be more accurate to reflect genomic instability underlying
MDS and AML than FAB classification of both diseases. Further analyses according to the WHO
classification are in line with that, despite the consideration of cytogenetic and molecular
abnormalities in MDS and AML patients. However, all these clinical classes of AML show
genomic instability that we profiled accurately. 3D nuclear telomeric profiles are the direct
reflection of chromosomal abnormalities, rather than clinical response to treatment grouping (15,
26 ). Telomere-associated genomic instability might, in the future, be a better indicator of the
clinical outcome of MDS/AML. This hypothesis, of course, will need to be validated in a
prospective clinical trial.
Comparison of 3D telomeres profiles with the IPSS and WPSS in MDS
Analyses of MDS patients in parallel to the available prognostic markers IPSS and WPSS led to
the conclusion that both indexes did not discriminate MDS patients while this was achieved using
their 3D nuclear telomeric profiles. Indeed, IPSS, which is based on percent marrow blasts, type
of cytogenetic abnormalities, and degree and number of cytopenias, and WPSS, which adds to
IPSS number of blood transfusions, both predict survival and evolution to acute leukemia
characterized by increased genomic instability. We propose that monitoring 3D telomere
dysfunction might be a very powerful marker to measure this transformation. Furthermore, it may
be a better indicator of therapeutic response since an optimal response will lead to a normal
cellular biology, including elimination of abnormal telomeric aggregates and the increase of
normal 3D telomeric profiles.
3D telomeres profiles as a potential biomarker of genomic instability in MDS and AML
MDS and AML both undergo a dynamic process of genomic instability, which may be monitored
by the 3D analyses of telomeres. Combinatorial analyses of these 3D nuclear telomere parameters
versus different classification of MDS and AML strengthen the validity of our telomeric profiles
for the classification of MDS vs. AML and describe patient subgroups in both. Notwithstanding,
due to the difficulties to obtain 3D preserved patient samples at different time points of the
disease and to have a longitudinal follow-up of the patients due to slow evolution of MDS in
Research. on April 10, 2019. © 2012 American Association for Cancerclincancerres.aacrjournals.org Downloaded from
Author manuscripts have been peer reviewed and accepted for publication but have not yet been edited. Author Manuscript Published OnlineFirst on April 26, 2012; DOI: 10.1158/1078-0432.CCR-12-0087

15
several cases, we are beginning to investigate an animal model of MDS/AML to follow disease
progression and 3D telomere dysfunction during this process (38). C57BL/6-Tg(Vav1-
NUP98/HOXD13)G2Apla/J hemizygote mice develop myelodysplastic syndromes with
peripheral blood cytopenia and dysplasia and normocellular to hypercellular bone marrow. By 14
months of age a subset of hemizygotes succumbs to malignant acute meyloid leukemia or severe
anemia and leucopenia. This mutant mouse strain may be useful in studies of myelodysplastic
syndromes and leukemia and to validate our 3D nuclear telomeric profiling of both diseases.
6- Conclusion Our results demonstrate significant differences in the 3D nuclear telomeric organization between
MDS and AML in terms of telomere numbers, telomeres aggregates, telomere length, nuclear
volume, and telomere distribution, suggesting that progressive telomere dysfunction may
contribute to the evolution of MDS and AML.
Acknowledgements The authors are grateful to Dr William Foulkes (McGill) for careful review of the manuscript, to
Mary Chuang for statistical analyses, and to Shubha Mathur for help with image analysis. The
authors acknowledge the patients who make this study feasible. This study was supported by
post-doctoral fellowship from Manitoba Health Research Council (MHRC) to MG, and an
operating grant from the Canadian Institute of Health Research (CIHR) to SM.
Funding Manitoba Health Research Council (MHRC) (MG), and the Canadian Institutes of Health
Research (CIHR) (SM) supported this work.
Contributions of each author MG: set-up the project, oversaw the project, defined the experimental design, performed the
different manipulations, analysed the data, and wrote the first draft of the manuscript.
JAA: as a master student trainee under the supervision of MG, participated actively to the
different manipulations of the study.
Research. on April 10, 2019. © 2012 American Association for Cancerclincancerres.aacrjournals.org Downloaded from
Author manuscripts have been peer reviewed and accepted for publication but have not yet been edited. Author Manuscript Published OnlineFirst on April 26, 2012; DOI: 10.1158/1078-0432.CCR-12-0087

16
RP: as a summer student trainee under the supervision of MG, participated actively to the
different manipulations of the study for two months
RK and DH: did the clinical management and follow-up of the patients in CCMB, corrected and
approved the manuscript
LK: participated to the sampling from MICB/CCMB
TND: participated to the experimental design
REM: reviewed and commented the clinical diagnosis of the samples from Brazil
De OFM, FPR: provided samples from Brazil and all the clinical data of their patients, corrected
and approved the manuscript
MS: Supervisor of MG, JAA and RP, supervised the whole project, reviewed and revised the
manuscript.
Research. on April 10, 2019. © 2012 American Association for Cancerclincancerres.aacrjournals.org Downloaded from
Author manuscripts have been peer reviewed and accepted for publication but have not yet been edited. Author Manuscript Published OnlineFirst on April 26, 2012; DOI: 10.1158/1078-0432.CCR-12-0087

17
References 1. Vermolen BJ, Garini Y, Mai S, Mougey V, Fest T, Chuang TC, et al. Characterizing the
three-dimensional organization of telomeres. Cytometry A 2005;67: 144-50.
2. Mai S, Garini Y. Oncogenic remodeling of the three-dimensional organization of the
interphase nucleus: c-Myc induces telomeric aggregates whose formation precedes chromosomal
rearrangements. Cell Cycle 2005;4: 1327-31.
3. Mai S, Garini Y. The significance of telomeric aggregates in the interphase nuclei of
tumor cells. J Cell Biochem 2006;97: 904-15.
4. Drexler HG, Dirks WG, Macleod RA. Many are called MDS cell lines: one is chosen.
Leuk Res 2009;33: 1011-6.
5. Vardiman JW, Thiele J, Arber DA, Brunning RD, Borowitz MJ, Porwit A, et al. The 2008
revision of the World Health Organization (WHO) classification of myeloid neoplasms and acute
leukemia: rationale and important changes. Blood 2009;114: 937-51.
6. Tefferi A, Vardiman JW. Myelodysplastic syndromes. N Engl J Med 2009;361: 1872-85.
7. Howe RB, Porwit-MacDonald A, Wanat R, Tehranchi R, Hellstrom-Lindberg E. The
WHO classification of MDS does make a difference. Blood 2004;103: 3265-70.
8. Raza A, Gezer S, Mundle S, Gao XZ, Alvi S, Borok R, et al. Apoptosis in bone marrow
biopsy samples involving stromal and hematopoietic cells in 50 patients with myelodysplastic
syndromes. Blood 1995;86: 268-76.
9. Raza A, Mundle S, Shetty V, Alvi S, Chopra H, Span L, et al. Novel insights into the
biology of myelodysplastic syndromes: excessive apoptosis and the role of cytokines. Int J
Hematol 1996;63: 265-78.
10. Raza A, Gregory SA, Preisler HD. The myelodysplastic syndromes in 1996: complex
stem cell disorders confounded by dual actions of cytokines. Leuk Res 1996;20: 881-90.
11. Mundle SD, Ali A, Cartlidge JD, Reza S, Alvi S, Showel MM, et al. Evidence for
involvement of tumor necrosis factor-alpha in apoptotic death of bone marrow cells in
myelodysplastic syndromes. Am J Hematol 1999;60: 36-47.
Research. on April 10, 2019. © 2012 American Association for Cancerclincancerres.aacrjournals.org Downloaded from
Author manuscripts have been peer reviewed and accepted for publication but have not yet been edited. Author Manuscript Published OnlineFirst on April 26, 2012; DOI: 10.1158/1078-0432.CCR-12-0087

18
12. Claessens YE, Bouscary D, Dupont JM, Picard F, Melle J, Gisselbrecht S, et al. In vitro
proliferation and differentiation of erythroid progenitors from patients with myelodysplastic
syndromes: evidence for Fas-dependent apoptosis. Blood 2002;99: 1594-601.
13. Campioni D, Secchiero P, Corallini F, Melloni E, Capitani S, Lanza F, et al. Evidence for
a role of TNF-related apoptosis-inducing ligand (TRAIL) in the anemia of myelodysplastic
syndromes. Am J Pathol 2005;166: 557-63.
14. Lange K, Holm L, Vang Nielsen K, Hahn A, Hofmann W, Kreipe H, et al. Telomere
shortening and chromosomal instability in myelodysplastic syndromes. Genes Chromosomes
Cancer 2010;49: 260-9.
15. Gadji M, Vallente R, Klewes L, Righolt C, Wark L, Kongruttanachok N, et al. Nuclear
remodeling as a mechanism for genomic instability in cancer. Adv Cancer Res 2011;112: 77-126.
16. Hanahan D, Weinberg RA. Hallmarks of cancer: the next generation. Cell 2011;144: 646-
74.
17. Ohyashiki K, Iwama H, Yahata N, Tauchi T, Kawakubo K, Shimamoto T, et al. Telomere
dynamics in myelodysplastic syndromes and acute leukemic transformation. Leuk Lymphoma
2001;42: 291-9.
18. de Lange T. Shelterin: the protein complex that shapes and safeguards human telomeres.
Genes Dev 2005;19: 2100-10.
19. Callen E, Surralles J. Telomere dysfunction in genome instability syndromes. Mutat Res
2004;567: 85-104.
20. Chuang TC, Moshir S, Garini Y, Chuang AY, Young IT, Vermolen B, et al. The three-
dimensional organization of telomeres in the nucleus of mammalian cells. BMC Biol 2004;2: 12.
21. Louis SF, Vermolen BJ, Garini Y, Young IT, Guffei A, Lichtensztejn Z, et al. c-Myc
induces chromosomal rearrangements through telomere and chromosome remodeling in the
interphase nucleus. Proc Natl Acad Sci U S A 2005;102: 9613-8.
22. Guffei A, Lichtensztejn Z, Goncalves Dos Santos Silva A, Louis SF, Caporali A, Mai S.
c-Myc-dependent formation of Robertsonian translocation chromosomes in mouse cells.
Neoplasia 2007;9: 578-88.
23. Guijon FB, Greulich-Bode K, Paraskevas M, Baker P, Mai S. Premalignant cervical
lesions are characterized by dihydrofolate reductase gene amplification and c-Myc
overexpression: possible biomarkers. J Low Genit Tract Dis 2007;11: 265-72.
Research. on April 10, 2019. © 2012 American Association for Cancerclincancerres.aacrjournals.org Downloaded from
Author manuscripts have been peer reviewed and accepted for publication but have not yet been edited. Author Manuscript Published OnlineFirst on April 26, 2012; DOI: 10.1158/1078-0432.CCR-12-0087

19
24. Knecht H, Sawan B, Lichtensztejn D, Lemieux B, Wellinger RJ, Mai S. The 3D nuclear
organization of telomeres marks the transition from Hodgkin to Reed-Sternberg cells. Leukemia
2009;23: 565-73.
25. Guffei A, Sarkar R, Klewes L, Righolt C, Knecht H, Mai S. Dynamic chromosomal
rearrangements in Hodgkin's lymphoma are due to ongoing three-dimensional nuclear
remodeling and breakage-bridge-fusion cycles. Haematologica 2010;95: 2038-46.
26. Gadji M, Fortin D, Tsanaclis AM, Garini Y, Katzir N, Wienburg Y, et al. Three-
dimensional nuclear telomere architecture is associated with differential time to progression and
overall survival in glioblastoma patients. Neoplasia 2010;12: 183-91.
27. Drummond MW, Balabanov S, Holyoake TL, Brummendorf TH. Concise review:
Telomere biology in normal and leukemic hematopoietic stem cells. Stem Cells 2007;25: 1853-
61.
28. Boultwood J, Fidler C, Kusec R, Rack K, Elliott PJ, Atoyebi O, et al. Telomere length in
myelodysplastic syndromes. Am J Hematol 1997;56: 266-71.
29. Sashida G, Ohyashiki JH, Nakajima A, Sumi M, Kawakubo K, Tauchi T, et al. Telomere
dynamics in myelodysplastic syndrome determined by telomere measurement of marrow
metaphases. Clin Cancer Res 2003;9: 1489-96.
30. Ohyashiki JH, Iwama H, Yahata N, Ando K, Hayashi S, Shay JW, et al. Telomere
stability is frequently impaired in high-risk groups of patients with myelodysplastic syndromes.
Clin Cancer Res 1999;5: 1155-60.
31. Ohyashiki JH, Ohyashiki K, Fujimura T, Kawakubo K, Shimamoto T, Iwabuchi A, et al.
Telomere shortening associated with disease evolution patterns in myelodysplastic syndromes.
Cancer Res 1994;54: 3557-60.
32. Schaefer LH, Schuster D, Herz H. Generalized approach for accelerated maximum
likelihood based image restoration applied to three-dimensional fluorescence microscopy. J
Microsc 2001;204: 99-107.
33. Malcovati L, Della Porta MG, Strupp C, Ambaglio I, Kuendgen A, Nachtkamp K, et al.
Impact of the degree of anemia on the outcome of patients with myelodysplastic syndrome and its
integration into the WHO classification-based Prognostic Scoring System (WPSS).
Haematologica 2011;96: 1433-40.
Research. on April 10, 2019. © 2012 American Association for Cancerclincancerres.aacrjournals.org Downloaded from
Author manuscripts have been peer reviewed and accepted for publication but have not yet been edited. Author Manuscript Published OnlineFirst on April 26, 2012; DOI: 10.1158/1078-0432.CCR-12-0087

20
34. Hasle H, Baumann I, Bergstrasser E, Fenu S, Fischer A, Kardos G, et al. The International
Prognostic Scoring System (IPSS) for childhood myelodysplastic syndrome (MDS) and juvenile
myelomonocytic leukemia (JMML). Leukemia 2004;18: 2008-14.
35. Raza A, Cruz R, Latif T, Mukherjee S, Galili N. The biology of myelodysplastic
syndromes: unity despite heterogeneity Hematology Reports 2010;2:e4: 28-31.
36. Horikawa K, Nakakuma H, Kawaguchi T, Iwamoto N, Nagakura S, Kagimoto T, et al.
Apoptosis resistance of blood cells from patients with paroxysmal nocturnal hemoglobinuria,
aplastic anemia, and myelodysplastic syndrome. Blood 1997;90: 2716-22.
37. De Vos WH, Hoebe RA, Joss GH, Haffmans W, Baatout S, Van Oostveldt P, et al.
Controlled light exposure microscopy reveals dynamic telomere microterritories throughout the
cell cycle. Cytometry A 2009;75: 428-39.
38. Lin YW, Slape C, Zhang Z, Aplan PD. NUP98-HOXD13 transgenic mice develop a
highly penetrant, severe myelodysplastic syndrome that progresses to acute leukemia. Blood
2005;106: 287-95.
Research. on April 10, 2019. © 2012 American Association for Cancerclincancerres.aacrjournals.org Downloaded from
Author manuscripts have been peer reviewed and accepted for publication but have not yet been edited. Author Manuscript Published OnlineFirst on April 26, 2012; DOI: 10.1158/1078-0432.CCR-12-0087

21
Figures and Legends Table 1: Patients subgroups according to 3D telomeric profiles and their cytogenetic data.
Table 2: Telomere parameters according to clinical diagnosis. Figure 1: A) 2D and B) 3D view of QFISH of bone-marrow cell nucleus (blue), and telomeres
(red); C) Graph distribution of number of telomeres according to their intensity (length of
telomeres) for one sample; this 3D telomere distribution is one part of the 3D telomeric profile.
(Red bars) separate the 3 cell populations with short, intermediate and long telomeres,
respectively.
Figure 2: MDS graphs of Panel A (composed by subgroups A, B and C; see supplemental data
Figure S1, Table S5) that might evolve to Panel B (composed by subgroups D, E and F; see
supplemental data Figure S1, Table S5) or to Panel C (composed by subgroups I, J and K; see
supplemental data Figure S1, Table S5)
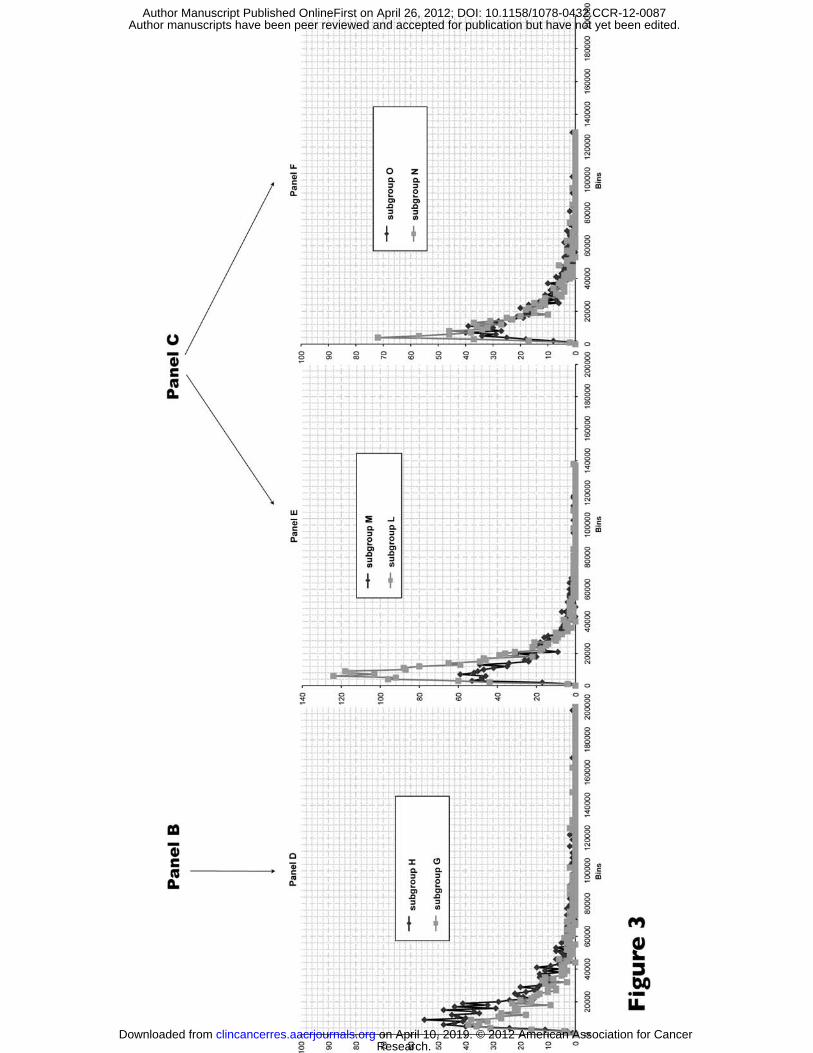
Figure 3: AML Graphs of Panel D (composed by subgroups G and H; see supplemental data
Figure S1, Table S5); Panel E (composed by subgroups L and M; see supplemental data Figure
S1, Table S5) and Panel F (composed by subgroups N and O; see supplemental data Figure S1,
Table S5). MDS Panel B (Figure 2) might evolve to AML Panel D (see supplemental data figure
S1, Table S5); MDS Panel C (figure 2) might evolve to AML Panels E or F (see supplemental
data Figure S1, Table S5).
Figure 4: Proposed modal of chronological evolution of 3D telomere profiles of patients from
MDS to AML
Research. on April 10, 2019. © 2012 American Association for Cancerclincancerres.aacrjournals.org Downloaded from
Author manuscripts have been peer reviewed and accepted for publication but have not yet been edited. Author Manuscript Published OnlineFirst on April 26, 2012; DOI: 10.1158/1078-0432.CCR-12-0087

22
Research. on April 10, 2019. © 2012 American Association for Cancerclincancerres.aacrjournals.org Downloaded from
Author manuscripts have been peer reviewed and accepted for publication but have not yet been edited. Author Manuscript Published OnlineFirst on April 26, 2012; DOI: 10.1158/1078-0432.CCR-12-0087

Table 1: Patients subgroups according to 3D telomeric profiles and their cytogenetic data.
Telomere profile subgroups Patients Cytogenetic results
Figure 2A
P8 P34 P32
46,XX[20] 47,XX,+15[4]/46,XX[12] 46,XX[20]
Figure 2B
P40 P37 P46 P39 P44
46,XY,del(13)(q12q14)[9]/46,XY[9][cp9] 46,XX[20] 46,XX[20] 46,XX[20] 46,XX,del(7)(q22)[3]/46,XX[17]
Figure 2C
P11 P52 P12 P25 P3 P4
P20 P10 P48 P19 P93 P55
46,XX[20] 44,XX,-4[3],del(7)(p15)[2],del(12)(p12)[3]/46,XX[10] 47,XX,+9[6]/46,XX[14] 47,XY,+8[4]/46,XY[16] 46,XX,del(20)(q11)[7]/46,XX[13] 46,XX,del(20)(q11)[6]/46,XX[10] 47,XX,+4[2]/46,XY[18] 46,XX[20] 46,XX[20] 46,XX[20] 46,XX[20] 46, XY [20]
Figure 2D
P33 P5
P45 P50
46,XX,del(7)(q22q36)[3]/46,XX[13] 46,XY[20] 46,XY[20] 47,XX,+i(17)(q10)[4]/46,XX[16]
Figure 2E
P35 P42 P51 P28 P22 P15 P2
P16 P18
46,XX[20] 46,XX,del(5)(q31)[4]/46,XX[11] 46,XX[20] 47,XY,+8[6]/46,XY[14] 46,XY[20] 46,XY[20] 46,XX,inv(3)(q21q26)[3]/46,XX[13] 46,XY[20] 46,XX[20]
Figure 2F
P49 P17 P54 P56
47-48,XY,+5[3],+del(8)(q21)[4]/46,XY[12] 46,XX,dup(1)(q32q21)[5]/46,XX[15] 46, XX [20] 46, XY [20]
Figure 3G
P74 P71 P85 P75
46,XY,t(8;21)(q22;q22)[16]/46,XY[4] 46,XY,del(6)(q21q22)[3]/46,XY[13] 46,XX,t(16;21)(p11;q22)[11]/46,XX[9] 45,X,-X[7]/46,XX[10]
Figure 3H
P68 P76
No metaphase available 46,XX[20]
Figure 2I
P21 P23 P26 P27 P29 P30 P38 P41 P43 P9 P6 P7
P13 P31 P14 P36 P47 P94 P53
46,XX[20] 46,XY[20] 46-47,XY,add(17)(p12)[4],+8[2]/46,XY[14] 46,XX[20] 46,XX,del(20)(q11)[8]/46,XX[6] 46,XX[20] 47,XY,+7[8]/46,XY[12] 46,XY[20] 46,XX[20] 46,XX[20] 45,X,-Y[3]/46,XY[12] 46,XY,del(20)(q11)[4]/46,XY[16] 45-46,X,-Y[6],del(17)(p12)[4]/46,XY[12] 46,XX[20] 47,XX,+8[20] 46,XX[20] 47,XY,+8[8]/46,XY[11] 46,XY [20] 46, XY [20]
Figure 2J
P1
46,XY[20]
Figure 2K
P92 P24
Very complex karyotype with about 20 abnormalities 46,XY,dup(1)(q21q32)[9]/46,XY[11]
Figure 3L
P84 P58 P87 P79 P80 P77 P89
47,XY,+8[12][cp12]/46,XY[8] 46,XX[14] 46,XY[18] 46,XY[20] 47,XX,+9[6]/46,XX[12] No metaphase available 47,XY,t(6;11)(q21;q23),+9[13]/46,XY[7]
Figure 3M
P66 P72 P61 P63 P69 P91 P64 P57
45,XY,-7[5],inv(16)(p13q22)[5]/46,XY[10] 46,XY[20] 47,XY,+8[9]/46,XY[11] 47,XX,+9[5]/46,XX[13] 45,XY-7[12]/46,XY[7] 46,XX,t(4;7)(q21;q36)[12]/46,XX[8] 45,XY,inv(16)(p13q22)[12]/46,XY[8] 46,XX,del(6)(q15q23)[6],inv(16)(p13q22)[4]/46,XX[10]
Figure 3N
P82 P59 P81 P60 P83 P78 P90 P86 P62
46,XX,t(8;21)(q22;q22)[9]/46,XX[11] 47,XX,t(8;21)(q22;q22),+i(17)(q10)[4]/46,XX[16] nuc ish(AML1 x 2),(ETO x 2),(AML1 con ETO x1)[167/200] 46,XX[16] 46,XX[20] 45,X,-Y[3],t(8;21)(q22;q22)[12]/46,XY[6] No metaphase available 46,XY[14] no metaphase available
Figure 3O
P70 P73 P88 P65 P67
46,XX[18] 45,XX,inv(16)(p13q22)[8]/46,XY[9] 47,XY,+4[10]/46,XY[10] 46,XY[20] 45,XY,-4[12]/46,XY[8]
Research. on April 10, 2019. © 2012 American Association for Cancerclincancerres.aacrjournals.org Downloaded from
Author manuscripts have been peer reviewed and accepted for publication but have not yet been edited. Author Manuscript Published OnlineFirst on April 26, 2012; DOI: 10.1158/1078-0432.CCR-12-0087

Tab
le 2
: 3D
Tel
omer
e pa
ram
eter
s acc
ordi
ng to
clin
ical
dia
gnos
is.
Clin
ical
di
agno
sis
Tot
al n
umbe
r of
sign
als
Tot
al
num
ber
of
aggr
egat
es
Tot
al in
tens
ity
Ave
rage
in
tens
ity o
f all
sign
als
a/c
ratio
N
ucle
ar v
olum
e T
elom
ere
per
K
volu
me
mea
n St
d D
ev
mea
n St
d D
ev
mea
n St
d D
ev
mea
n St
d D
ev
mea
nSt
d D
ev
mea
n St
d D
ev
mea
n St
d D
ev
M
DS
20.1
0 8.
17
1.81
1.
56
3075
6713
7676
1574
0 52
37
9.65
6.
21
2219
6913
9522
0.11
0.
05
A
ML
31.1
0 13
.09
3.32
2.
46
5236
4124
5868
1750
4 65
13
14.3
57.
86
3164
2818
7906
0.11
0.
05
p.va
lue
betw
een
MD
S an
d A
ML
p <
0.00
01
p <
0.00
01
p <
0.00
01
p =
0.0
2 p
<0.
0001
p
<0.
0001
p
= 0
.48
Std
Dev
: sta
ndar
d de
viat
ion
Research. on April 10, 2019. © 2012 American Association for Cancerclincancerres.aacrjournals.org Downloaded from
Author manuscripts have been peer reviewed and accepted for publication but have not yet been edited. Author Manuscript Published OnlineFirst on April 26, 2012; DOI: 10.1158/1078-0432.CCR-12-0087

Published OnlineFirst April 26, 2012.Clin Cancer Res Macoura Gadji, Julius Adebayo Awe, Prerana Rodriguez, et al. defines patient subgroupsMyelodysplastic Syndrome and Acute Myeloid Leukemia Profiling Three-Dimensional Nuclear Telomeric Architecture of
Updated version
10.1158/1078-0432.CCR-12-0087doi:
Access the most recent version of this article at:
Material
Supplementary
http://clincancerres.aacrjournals.org/content/suppl/2012/04/26/1078-0432.CCR-12-0087.DC1
Access the most recent supplemental material at:
Manuscript
Authoredited. Author manuscripts have been peer reviewed and accepted for publication but have not yet been
E-mail alerts related to this article or journal.Sign up to receive free email-alerts
Subscriptions
Reprints and
To order reprints of this article or to subscribe to the journal, contact the AACR Publications
Permissions
Rightslink site. Click on "Request Permissions" which will take you to the Copyright Clearance Center's (CCC)
.http://clincancerres.aacrjournals.org/content/early/2012/04/26/1078-0432.CCR-12-0087To request permission to re-use all or part of this article, use this link
Research. on April 10, 2019. © 2012 American Association for Cancerclincancerres.aacrjournals.org Downloaded from
Author manuscripts have been peer reviewed and accepted for publication but have not yet been edited. Author Manuscript Published OnlineFirst on April 26, 2012; DOI: 10.1158/1078-0432.CCR-12-0087