Running head: OPDA and dinor-OPDA-containing … address: Children's Nutrition Research Center,...
35
1 Running head: OPDA and dinor-OPDA-containing chloroplast polar lipids Corresponding author: Ruth Welti Division of Biology Ackert Hall Kansas State University Manhattan, KS 66506-4901 FAX: 785-532-6653 Phone: 785-532-6241 Email: [email protected] Journal research area: Breakthrough technologies Plant Physiology Preview. Published on July 14, 2006, as DOI:10.1104/pp.106.082115 Copyright 2006 by the American Society of Plant Biologists www.plantphysiol.org on June 30, 2018 - Published by Downloaded from Copyright © 2006 American Society of Plant Biologists. All rights reserved.
Transcript of Running head: OPDA and dinor-OPDA-containing … address: Children's Nutrition Research Center,...

1
Running head: OPDA and dinor-OPDA-containing chloroplast polar lipids
Corresponding author:
Ruth Welti
Division of Biology
Ackert Hall
Kansas State University
Manhattan, KS 66506-4901
FAX: 785-532-6653
Phone: 785-532-6241
Email: [email protected]
Journal research area:
Breakthrough technologies
Plant Physiology Preview. Published on July 14, 2006, as DOI:10.1104/pp.106.082115
Copyright 2006 by the American Society of Plant Biologists
www.plantphysiol.orgon June 30, 2018 - Published by Downloaded from Copyright © 2006 American Society of Plant Biologists. All rights reserved.

2
Wounding stimulates the accumulation of glycerolipids containing oxophytodienoic acid and
dinor-oxophytodienoic acid in Arabidopsis leaves
Christen M. Buseman2, Pamela Tamura, Alexis A. Sparks, Ethan J. Baughman2, Sara Maatta,
Jian Zhao3, Mary R. Roth, Steven Wynn Esch, Jyoti Shah, Todd D. Williams, and Ruth Welti*
Division of Biology (CMB, PT, AAS, EJB, SM, MRR, SWE, JS, RW), and Dept. of
Biochemistry (JZ), Kansas State University, Manhattan, KS 66506; and University of Kansas
Mass Spectrometry Laboratory, University of Kansas, Lawrence, KS 66045 (SWE, TDW)
www.plantphysiol.orgon June 30, 2018 - Published by Downloaded from Copyright © 2006 American Society of Plant Biologists. All rights reserved.

3
1Work and instrument acquisition was supported by grants from National Science Foundation
(MCB 0455318 and DBI 0520140). Support of the Kansas Lipidomics Research Center was
from National Science Foundation's EPSCoR program, under grant EPS-0236913, with matching
support from the State of Kansas through Kansas Technology Enterprise Corporation and Kansas
State University, as well as from Core Facility Support from NIH grant P20 RR016475 from the
INBRE program of the National Center for Research Resources. Accurate mass analysis was
performed at the University of Kansas Mass Spectrometry Laboratory, using a Micromass Q-
TOF2, which was purchased with funds from the University of Kansas, the University of Kansas
Mass Spectrometry Laboratory, and Kansas NSF EPSCoR. This is contribution 06-180-J from
the Kansas Agricultural Experiment Station. 2Current address: The University of Texas Southwestern Medical Center at Dallas,
5323 Harry Hines Boulevard, Dallas, Texas 75390 3Current address: Children's Nutrition Research Center, Department of Pediatrics, Baylor
College of Medicine, Houston, TX 77030
*Corresponding author: email [email protected]; fax 785-532-6653.
www.plantphysiol.orgon June 30, 2018 - Published by Downloaded from Copyright © 2006 American Society of Plant Biologists. All rights reserved.

4
Abstract
Although oxylipins can be synthesized from free fatty acids, recent evidence suggests that
oxylipins are components of plastid-localized polar complex lipids in Arabidopsis thaliana.
Using a combination of electrospray ionization collisionally-induced dissociation-time of flight
mass spectrometry to identify acyl chains, electrospray ionization triple quadrupole mass
spectrometry in the precursor mode to identify the nominal masses of complex polar lipids
containing each acyl chain, and electrospray ionization quadrupole-time of flight mass
spectrometry to confirm the identifications of the complex polar lipid species, seventeen species
of oxylipin-containing phosphatidylglycerols, monogalactosyldiacylglycerols (MGDG) and
digalactosyldiacylglycerols (DGDG) were identified. The oxylipins of these polar complex lipid
species include oxophytodienoic acid (OPDA), dinor-oxophytodienoic acid (dnOPDA), 18-
carbon ketol acids, and 16-carbon ketol acids. Using electrospray ionization triple quadrupole
mass spectrometry in the precursor mode, the accumulation of five OPDA- and/or dnOPDA-
containing MGDG and two OPDA-containing DGDG species were monitored as a function of
time in mechanically wounded leaves. In unwounded leaves, the levels of these oxylipin-
containing complex lipid species were low, between 0.001 and 0.023 nmol/mg dry weight.
However, within the first 15 minutes after wounding, the levels of OPDA-dnOPDA MGDG,
OPDA-OPDA MGDG, and OPDA-OPDA DGDG, each containing two oxylipin chains,
increased 200- to 1000-fold. In contrast, levels of OPDA-16:3 MGDG, 18:3-dnOPDA MGDG,
OPDA-18:3 MGDG, and OPDA-18:3 DGDG lipids, each containing a single oxylipin chain,
rose 2- to 9-fold. The rapid accumulation of high levels of galactolipid species containing
OPDA-OPDA and OPDA-dnOPDA in wounded leaves is consistent with these species being the
primary products of plastidic oxylipin biosynthesis.
www.plantphysiol.orgon June 30, 2018 - Published by Downloaded from Copyright © 2006 American Society of Plant Biologists. All rights reserved.

5
Oxylipins are cyclic or acyclic oxidation products of fatty acids and are effectors in many
biological pathways, including plant development and defense responses (Creelman and
Mulpuri, 2002; Turner et al., 2002). Jasmonic acid (JA), oxophytodienoic acid (OPDA) and
other cyclic oxylipins make up the jasmonate family (Creelman and Mulpuri, 2002; Turner et al.,
2002; Weber, 2002). The role of JA in defense response was suggested in 1992 (Farmer and
Ryan, 1992), when jasmonate synthesis was discovered to occur in response to wounding. More
recently, it has been demonstrated that OPDA is also capable of signaling and modulating gene
expression (Kutchan, 1993; Blechert et al., 1995; Stintzi et al., 2001; Taki et al., 2005). Current
understanding is that each plant or plant tissue produces its own “oxylipin signature”, or specific
mixture of various oxylipins that elicit appropriate responses to particular environmental cues
(Weber et al., 1997).
JA synthesis begins in the plastid and is completed in the peroxisome. The conversion of
precursor linolenic (18:3) acid to OPDA (Fig. 1) occurs in the plastid. The pathway involves
formation of a hydroperoxide by a lipoxygenase, formation of an epoxide by allene oxide
synthase, and formation of a cyclopentenone ring by allene oxide cyclase to produce OPDA.
Alternatively, 12,13-epoxyoctadecatrienoic acid can be converted non-enzymatically to a ketol
(Hamberg, 1988). 9S,13S-OPDA is transported from the plastid to the peroxisome, where it is
reduced by 12-oxo-phytodienoic acid 10,11 reductase. Subsequently, three cycles of β-oxidation
result in shortening of the 18-carbon compound to 12-carbon JA. In 1997, Weber et al.
identified dnOPDA [(7S,11S)-10-oxy] as a 16-carbon analog of OPDA, formed from
hexadecatrienoic acid (16:3) through the same pathway.
In 2001, Stelmach and coworkers determined that 80 to 90% of the OPDA in unstimulated
Arabidopsis shoots is esterified in complex lipid species. They purified and identified a novel
OPDA-containing galactolipid, 1-OPDA, 2-16:3 monogalactosyldiacylglycerol (MGDG). More
recently, Hisamatsu and colleagues (2003, 2005) have chemically characterized four additional
OPDA-containing galactolipids isolated from Arabidopsis leaves. These compounds are 1-
OPDA, 2-dnOPDA MGDG (annotated by these authors as “Arabidopside A”), OPDA-OPDA
MGDG (“Arabidopside B”), 1-OPDA, 2-dnOPDA digalactosyldiacylglycerol (DGDG)
(“Arabidopside C”), and OPDA-OPDA DGDG (“Arabidopside D”). The relationship between
www.plantphysiol.orgon June 30, 2018 - Published by Downloaded from Copyright © 2006 American Society of Plant Biologists. All rights reserved.
6
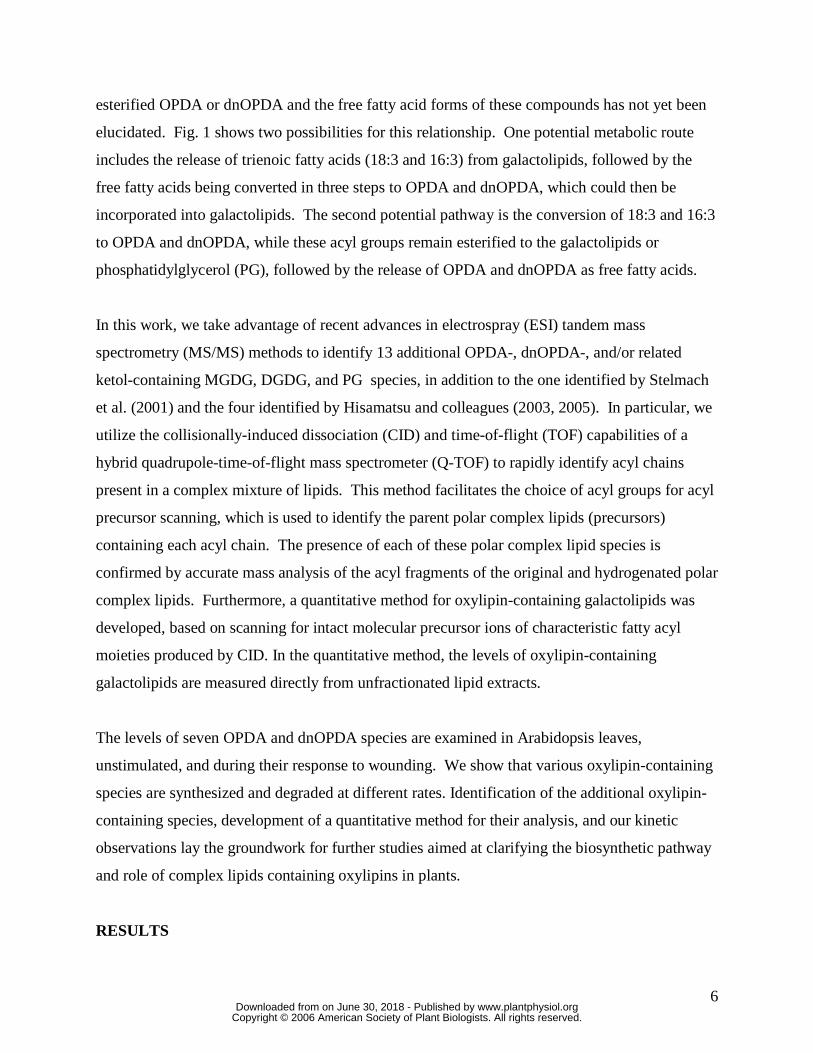
esterified OPDA or dnOPDA and the free fatty acid forms of these compounds has not yet been
elucidated. Fig. 1 shows two possibilities for this relationship. One potential metabolic route
includes the release of trienoic fatty acids (18:3 and 16:3) from galactolipids, followed by the
free fatty acids being converted in three steps to OPDA and dnOPDA, which could then be
incorporated into galactolipids. The second potential pathway is the conversion of 18:3 and 16:3
to OPDA and dnOPDA, while these acyl groups remain esterified to the galactolipids or
phosphatidylglycerol (PG), followed by the release of OPDA and dnOPDA as free fatty acids.
In this work, we take advantage of recent advances in electrospray (ESI) tandem mass
spectrometry (MS/MS) methods to identify 13 additional OPDA-, dnOPDA-, and/or related
ketol-containing MGDG, DGDG, and PG species, in addition to the one identified by Stelmach
et al. (2001) and the four identified by Hisamatsu and colleagues (2003, 2005). In particular, we
utilize the collisionally-induced dissociation (CID) and time-of-flight (TOF) capabilities of a
hybrid quadrupole-time-of-flight mass spectrometer (Q-TOF) to rapidly identify acyl chains
present in a complex mixture of lipids. This method facilitates the choice of acyl groups for acyl
precursor scanning, which is used to identify the parent polar complex lipids (precursors)
containing each acyl chain. The presence of each of these polar complex lipid species is
confirmed by accurate mass analysis of the acyl fragments of the original and hydrogenated polar
complex lipids. Furthermore, a quantitative method for oxylipin-containing galactolipids was
developed, based on scanning for intact molecular precursor ions of characteristic fatty acyl
moieties produced by CID. In the quantitative method, the levels of oxylipin-containing
galactolipids are measured directly from unfractionated lipid extracts.
The levels of seven OPDA and dnOPDA species are examined in Arabidopsis leaves,
unstimulated, and during their response to wounding. We show that various oxylipin-containing
species are synthesized and degraded at different rates. Identification of the additional oxylipin-
containing species, development of a quantitative method for their analysis, and our kinetic
observations lay the groundwork for further studies aimed at clarifying the biosynthetic pathway
and role of complex lipids containing oxylipins in plants.
RESULTS
www.plantphysiol.orgon June 30, 2018 - Published by Downloaded from Copyright © 2006 American Society of Plant Biologists. All rights reserved.
7
Detection of Oxylipins by CID-TOF Analysis
Fatty acyl species present in wounded and unwounded Arabidopsis leaves were identified with
an electrospray quadrupole/time-of-flight hybrid (Q-TOF) mass spectrometer. Subjecting a plant-
derived lipid extract, ionized by electrospray ionization in negative ion mode, to collisionally
induced dissociation (CID) in the collision cell of a Q-TOF mass spectrometer without selecting
precursor lipid species (i.e., with radio frequency/direct current mass selection in the quadrupole
off) produces a spectrum that includes acyl anions of fatty acids derived from both free fatty
acids and complex lipids (Figs. 2 and 3). This experiment is accomplished by increasing the
voltage offset on the collision to 35 V while acquiring data in “MS1 mode” (no precursor
selection), thus activating all ions produced at once. We call this analysis CID-TOF here to
distinguish it from traditional product ion analysis also performed with the Q-TOF mass
spectrometer. Accurate mass data produced by the time-of-flight (TOF) analyzer can be
correlated with chemical formulas to identify the acyl anions present (Table I). CID-TOF
analysis provides a reproducible and excellent semi-quantitative view of acyl species present. It
can only be considered semi-quantitative, mainly because the propensity of an acyl species in a
polar diacyl glycerolipid to form an anion depends on its position (Murphy, 1993). For example,
phospholipids typically produce acyl anion peaks from the 2-position approximately twice as
readily as from the 1-position (Murphy, 1993). Thus, because biological lipids typically contain
diacyl lipids with specific fatty acyl chains non-randomly distributed between the 1- and 2-
positions, a CID-TOF spectrum will provide a somewhat biased representation of the total acyl
species in the mixture, with over-representation of the more easily produced acyl anions. CID-
TOF analysis does, however, provide an excellent starting point for sample to sample
comparisons.
The spectra shown in Fig. 2 show the total acyl species present from such an analysis before and
five hours after wounding of Arabidopsis leaves. Species that increase in amount after
wounding include prominent anions with m/z 263.1656 and 291.1968 and smaller peaks at m/z
281.1733 and 309.2065. The best matches between these masses and chemical formulas for the
two largest peaks are C16H23O3 and C18H27O3 (Table I). Whereas typical fatty acid anions
www.plantphysiol.orgon June 30, 2018 - Published by Downloaded from Copyright © 2006 American Society of Plant Biologists. All rights reserved.

8
contain two oxygen atoms, these anions contain three oxygen atoms, suggesting that these anions
are derived from oxylipin species.
Table II shows oxylipin species described in the literature with anion formulas corresponding to
those detected. There are 3 described oxylipin anions with the formula, C18H27O3. Catalytic
hydrogenation, which removes only carbon-carbon double bonds, was used to identify the
oxylipins present from among these oxylipins. After hydrogenation of the mixture, prominent
peaks at nominal m/z 263 and 291 disappeared and new peaks appeared at m/z 267.1970 and
295.2275 (Fig. 3 and Table I). As shown in Table II, of the described oxylipins with anion
formulas of C18H27O3, only one, OPDA, gains only 4 amu upon hydrogenation. Similarly,
hydrogenation of the peak at m/z 263 to m/z 267 is consistent with identification of that peak as
dnOPDA and not a 16-carbon analog of either keto-trienoic acid or colnelenic acid. The peak at
m/z 309.2065 is consistent with a chemical formula of C18H29O4. This formula is consistent
with the presence of either or both characterized 18-carbon ketols, (12-oxo-13-hydroxy-
9(Z),15(Z)-octadecadienoic acid (12,13-α-ketol) and 9-hydroxy-12-oxo-10(E),15(Z)-
octadecadienoic acid (γ-ketol)), which can be formed non-enzymatically from allene oxide
(Hamberg, 1988; Ziegler et al., 2000; Fig. 1), as well as with HPOTE and di-HOTE.
Hydrogenation resulted in a peak at 313.2359; this mass would be expected when two carbon-
carbon double bonds are lost during catalytic hydrogenation, consistent with the identification of
the peak at m/z 309.2065 as α- or γ-ketol, but not HPOTE or di-HOTE, although the data do not
rule out the presence of complex lipids containing small amounts of these other oxylipin
components. The low magnitude of the m/z 281.1733 (Fig. 2) did not allow detection of a
corresponding hydrogenated acyl species via CID-TOF analysis.
Complex Lipids Containing dnOPDA, OPDA, and Ketols
Precursor scanning with an ESI triple quadrupole mass spectrometer was used to discover the
complex lipid species that contain the oxylipin species found in lipid extracts of wounded
Arabidopsis. Fig. 4 shows peaks identified in the range m/z 740-830; peaks in the range m/z 740-
1050 are shown in Supplemental Data Fig. 1. In Fig. 4, Panels A and B depict precursor ions of
head group-derived fragments, while Panels C-G depict precursor ions of specific acyl anions.
www.plantphysiol.orgon June 30, 2018 - Published by Downloaded from Copyright © 2006 American Society of Plant Biologists. All rights reserved.

9
Panel A shows a scan specific for phosphatidylglycerol species. Panel B depicts lipid species
containing a fragment of m/z 235, which corresponds to the mass of a negative ion of
glycerogalactose minus a water molecule. Thus, this panel represents MGDG and DGDG
species. Due to the presence of ammonium acetate (NH4OAc) in the infusion solvent, both [M-
H]- and [M+OAc]- ions are formed, and each MGDG molecular species is represented by two
peaks, although some of the MGDG [M+OAc]- peaks are at higher m/z than shown in Fig. 4.
Panels C and D depict the lipid species containing the normal acyl species 16:3 and 18:3,
respectively, while panels E through G depict the lipid species containing dnOPDA, OPDA, and
the 18C ketol, respectively. It was not possible to use precursor scanning to elucidate the species
containing a 16C ketol because the 16C ketol has the same nominal mass (m/z 281) as the normal
chain acyl species 18:1. Thus, a scan for precursors of m/z 281 would depict those lipid species
containing either a 16C ketol or 18:1. The difference in the scales of panels C and D (in the 108
range) as compared to Panels E and F (106 range) and Panel G (105 range) indicates the greater
prominence of the normal chain species (i.e., 16:3 and 18:3; Panels C and D) relative to the
oxylipin species (dnOPDA, OPDA, and ketols; Panels E, F, and G).
Panels E through G, in combination with the previous panels, provide tentative identification for
each putative oxylipin molecular species by identifying nominal masses of its acyl chains. The
indicated species account for most, but not all, of the complex lipid species in this m/z range
containing the investigated oxylipins. For example, the peak identifications shown in Fig. 4, as
well as additional identifications indicated in Supplemental Fig. 1, were confirmed by Q-TOF
(accurate mass) analysis of product (acyl) ions in extract fractions. Before performing the Q-TOF
analysis, the extract was fractionated by silicic acid chromatography to produce Fraction 2,
enriched in MGDG, and Fraction 3, enriched in PG. DGDG was enriched in both Fractions 2
and 3. Using fractionated material for the product ion analysis reduced the number of lipid
species present, allowing more certain identification of acyl pairs. The discovery scans implied
that the PG peaks at m/z 755 and 757 (Panel A) contained OPDA (Panel F), and their m/z values
indicated that the acyl species pairing with OPDA were 16:1 and 16:0, respectively. Product ion
analysis of these species in PG-containing Fraction 3 indicated that both OPDA and 16:0 were
indeed present in the species at m/z 757 and OPDA and 16:1 were present in the species at m/z
755 (Supplemental Table I). The latter species is depicted in Fig. 5. Similarly, each of the
www.plantphysiol.orgon June 30, 2018 - Published by Downloaded from Copyright © 2006 American Society of Plant Biologists. All rights reserved.

10
MGDG and DGDG species listed in Table III were identified by product ion mass analysis of the
[M-H]- ions in Fractions 2 and 3 using Q-TOF mass spectrometry, and detailed results of these
analyses are shown in Supplemental Table I.
Identifications were further substantiated by analysis of unfractionated and fractionated wounded
Arabidopsis leaf extracts that were subjected to catalytic hydrogenation. Precursor scanning of a
catalytically hydrogenated, unfractionated extract of wounded Arabidopsis (Supplemental Fig. 2)
and Q-TOF product ion analysis of the catalytically hydrogenated and fractionated extract
(Supplemental Table II) reveal the expected, hydrogenated product of each of the species
identified in Table III and Supplemental Table I. These data are consistent with the notion that
the oxylipin acyl species in the plastid-localized complex lipids include the same acyl species
(OPDA, dnOPDA, and a ketol or ketols) that were found to be increased during wounding by
CID-TOF mass spectrometry scanning of wounded Arabidopsis leaf extracts.
Interestingly, two of the most prominent OPDA-containing MGDG species were the di-oxylipin-
containing species, OPDA-dnOPDA (Fig. 4, Panels E and F) and OPDA-OPDA (Panel F), while
the largest DGDG species was OPDA-OPDA (Supplemental Fig. 1, Panel F, peaks o and o’).
These are the species denoted by Hisamatsu (2003, 2005) as Arabidopsides A, B and D,
respectively, and two of these lipid species are depicted in Fig. 5. The species denoted by
Hisamatsu (2005) as Arabidopside C, OPDA-dnOPDA DGDG (Supplemental Fig. 1, ArC and
ArC’ in Panels E and F), was also detected in the discovery scans.
Levels of OPDA and dnOPDA-containing Galactolipids after Wounding
Precursor scanning was used to quantify the levels of the major OPDA- and dnOPDA-containing
galactolipid molecular species in leaves without wounding and after mechanical wounding of the
leaves. 18:0-18:0 MGDG and 18:0-16:0 MGDG, prepared by catalytic hydrogenation of purified
MGDG, served as internal standards for MGDG quantification, and 18:0-18:0 DGDG and 18:0-
16:0 DGDG, similarly prepared, served as internal standards for DGDG quantification.
www.plantphysiol.orgon June 30, 2018 - Published by Downloaded from Copyright © 2006 American Society of Plant Biologists. All rights reserved.

11
In unwounded leaves, the level of each of the major OPDA- and dnOPDA-containing
galactolipid molecular species was low, at less than 25 pmol per mg of leaf dry weight (Fig. 6).
Upon wounding, the levels of these species, in particular the amounts of the species containing
two oxylipins, rose sharply in the first 15 min (Fig. 7). OPDA-dnOPDA MGDG rose about 200-
fold, OPDA-OPDA MGDG rose over 400-fold, and OPDA-OPDA DGDG rose over 1000-fold
in the first 15 minutes, while OPDA-16:3 MGDG, 18:3-dnOPDA MGDG, OPDA-18:3 MGDG,
and OPDA-18:3 DGDG rose 9-, 3-, 2-, and 7-fold respectively. Between 15 and 45 min after
wounding, the levels of OPDA-dnOPDA MGDG and OPDA-OPDA MGDG increased another
1.2 to 1.4-fold each while the levels of OPDA-16:3 MGDG, 18:3-dnOPDA MGDG, OPDA-18:3
MGDG, and OPDA-18:3 DGDG each rose 2- to 5-fold. Between 45 min and 20 h after
wounding, levels of all the OPDA- and dnOPDA-containing galactolipid species dropped 0 to
60% with the decrease tending to be more pronounced for the species with two oxylipin chains.
Still, at 20 h after wounding, OPDA-dnOPDA MGDG was increased about 100-fold, OPDA-
OPDA MGDG was increased 300-fold, and OPDA-OPDA DGDG was increased 600-fold over
the level in non-wounded tissues, while OPDA-16:3 MGDG, 18:3-dnOPDA MGDG, OPDA-
18:3 MGDG, and OPDA-18:3 DGDG were increased 21-, 5-, 4-, and 18-fold. Fig. 8 shows the
ratios of measured species containing two oxylipin chains to measured species containing one
oxylipin chain at each time point. This view of the data highlights the rapid increase in di-
oxylipin species, as compared to mono-oxylipin species, immediately after mechanical
wounding.
DISCUSSION
This work utilizes “CID-TOF” and traditional product ion spectra from a Q-TOF mass
spectrometer, plus discovery scans on a triple quadrupole mass spectrometer, to identify and
quantify numerous plastid complex lipid species containing oxylipins. In all, eighteen
(seventeen, plus partially characterized Arabidopside C) molecular species of MGDG-, DGDG-,
and PG-containing oxylipins were identified, thirteen for the first time. The major species
detected were galactolipids containing OPDA and dnOPDA. In addition, ketol acids were found
to be increased during wounding and were found to be present in MGDG and DGDG molecular
www.plantphysiol.orgon June 30, 2018 - Published by Downloaded from Copyright © 2006 American Society of Plant Biologists. All rights reserved.

12
species. This is a powerful combination of mass spectrometry methods for identification and
quantification of species of complex polar lipids.
Dramatic Increases of OPDA and dnOPDA Galactolipids after Wounding
Each of seven major OPDA- and dnOPDA-containing species was found to increase rapidly
upon wounding. Species containing two OPDA or dnOPDA chains rose 200- to 1400-fold,
while species with a single OPDA or dnOPDA chain rose 6- to 30-fold. Compared to previous
data on the levels of a single species, OPDA-16:3 MGDG, after wounding (Stelmach et al.,
2001), the current data are very similar, but the time course in the current study tends to indicate
faster production of the OPDA-containing species after wounding. Stelmach et al. (2001)
determined that the level of OPDA-16:3 MGDG rose to about 20 µg per g fresh weight. If dry
weight (minus lipids) were 7% of fresh weight, then 20 µg OPDA-16:3 MGDG/g fresh weight
would correspond to about 0.4 nmol/mg, which is the level measured in the current study. In the
study by Stelmach et al., the highest level of OPDA-16:3 MGDG was found to occur at about 10
hours, while in the current study, OPDA-16:3 MGDG rose insignificantly between 45 minutes
and 4 hours after wounding and decreased somewhat by 20 hours after wounding.
The presence of the ketol acids in the galactolipids (Table I) suggests that a minor portion of the
epoxyoctadecatrienoic acid formed during wounding is hydrolyzed non-enzymatically and that
the non-enzymatic pathway contributes to the formation of esterified oxylipin species. Non-
enzymatic reactions of epoxyoctadecatrienoic acid result in 85 to 90% α- and γ-ketols, and 10 to
15% racemic (9S,13S and 9R,13R) OPDA (Hamberg, 1988; Ziegler et al., 2000). Thus, the
relatively low level of the 18-carbon ketol acid in comparison to OPDA in wounded leaves (Fig.
2B, m/z 309 vs. m/z 291) implies that the major pathway is the enzymatic synthesis of OPDA,
presumably by allene oxide synthase. On the other hand, the formation of free α-ketol has been
shown to increase in response to exposure to the jasmonates, JA and dnOPDA (Weber et al.,
1997).
Potential Metabolic Pathways for Oxylipin-containing Polar Lipids
www.plantphysiol.orgon June 30, 2018 - Published by Downloaded from Copyright © 2006 American Society of Plant Biologists. All rights reserved.

13
The discovery that MGDG and DGDG species containing two OPDA chains or an OPDA and a
dnOPDA chain (as depicted in Fig. 5) are the major species formed in the initial response to
wounding could imply that lipoxygenase acts directly on plastid-localized lipid species (Fig. 1,
right-hand side), rather than on free fatty acids released from these lipids. Although the most
abundant lipoxygenase in plastids, LOX2, appears to be required for JA synthesis (Bell et al.,
1995) and seems to act on free fatty acids, especially linolenic acid, at least in barley (Bachmann
et al., 2002), it has been demonstrated that a lipoxygenase from soybean can act directly on intact
phospholipids (Brash et al., 1987; Tokumura et al., 2000). 18:3-16:3 MGDG is the most
abundant polar complex lipid species in wild-type Arabidopsis leaves, and 18:3-18:3 MGDG and
18:3-18:3 DGDG are the next most abundant galactolipid species. Thus, the high levels of
OPDA-dnOPDA MGDG production and next highest levels of OPDA-OPDA DGDG and
OPDA-OPDA MGDG production after wounding are consistent with the notion of direct
conversion of esterified 18:3 and 16:3 to OPDA and dnOPDA, respectively. Lipoxygenase
might be more likely to act on two acyl chains on the same lipid than on two acyl chains on
distinct molecules, due to the proximity of the second acyl substrate in an intact polar complex
lipid. If the di-oxylipin species are produced on the intact plastid polar complex lipids, then
decreases with time of di-oxylipin species and concomitant increases in species with a single
oxylipin chain may result from a deacylation of the di-oxylipin species, followed by reacylation
with a normal-chain fatty acid.
The very rapid and very large increase in levels of the OPDA-dnOPDA and OPDA-OPDA
species lend credence to the assertion that these species are created on the intact galactolipids
rather than via the free fatty acid pathway (Fig. 1). OPDA-dnOPDA and OPDA-OPDA
galactolipids rose 200-1000-fold in the first 15 minutes after wounding, while free OPDA has
been shown to rise from 3- to 15-fold in the first several hours after wounding (Weber et al.,
1997; Stintzi et al., 2001; Stelmach et al., 2001). Other free fatty acids, such as 18:3, also
increase upon wounding, though to a lesser extent, about two-fold (Zien et al., 2001). While the
production of di-oxylipin galactolipid species alternatively might be driven by high levels of free
OPDA and dnOPDA in relation to other fatty acyl species in the time frame soon after
wounding, this is difficult to envision, given the unimpressive increase in OPDA relative to other
free fatty acids. In addition, free OPDA is present at relatively low absolute levels after
www.plantphysiol.orgon June 30, 2018 - Published by Downloaded from Copyright © 2006 American Society of Plant Biologists. All rights reserved.

14
wounding as compared to OPDA-dnOPDA and OPDA-OPDA galactolipids. Using the estimate
of dry weight minus lipid being equal to 7% of fresh weight, OPDA levels after wounding range
from 0.035 to 0.085 nmol/mg dry weight (minus lipid) (Weber et al., 1997; Stintzi et al., 2001;
Stelmach et al., 2001), as compared to peak levels of more than 2.5 nmol/mg dry weight (minus
lipid) for the most prevalent oxylipin-containing galactolipid species, OPDA-dnOPDA MGDG.
Thus, while the current data do not exclude the possibility that OPDA and dnOPDA are
synthesized in their free forms and incorporated into the plastid membrane lipids, the rapid and
large increase favors the hypothesis that intact galactolipid molecules are the substrates for
OPDA and dnOPDA formation, rather than the oxygenated species being formed as free fatty
acids, followed by incorporation into galactolipids. The enzymes involved in production of
complex plastid lipid species containing oxylipins remain to be elucidated. Analyses of lipid
species levels in mutants with alterations in enzymes catalyzing acylation and deacylation
reactions are in progress.
In a wounded leaf, galactolipid species containing OPDA represent several percent of the total
galactolipids (typically totaling approximately 100 nmol/mg dry weight). If OPDA- and
dnOPDA-containing polar complex lipid species are precursors of free OPDA and dnOPDA,
then these species may serve as a reservoir for the production of free OPDA and dnOPDA at
later times. It is also plausible that these lipids, with their folded-back acyl chains, might create a
drastic alteration of plastid membrane structure that could affect the function of other membrane
components.
CONCLUSION
A combination of mass spectrometry methods has been used to discover acyl chains present in
complex lipid mixtures, to discover the polar complex lipid species containing each of these
chains, to verify the presence of particular complex lipid species, and to quantify the polar
complex lipid species in unfractionated lipid extracts. The ability to quantify specific, oxylipin-
containing, polar complex lipid species will facilitate our understanding of the physiological
roles of these prominent plant lipids.
www.plantphysiol.orgon June 30, 2018 - Published by Downloaded from Copyright © 2006 American Society of Plant Biologists. All rights reserved.

15
MATERIALS AND METHODS
Plant Material
Leaves from approximately 7-week old Arabidopsis thaliana ecotype Columbia (Col) plants,
were used for identification and kinetic analysis of the lipid species. Seeds were sown in Metro-
Mix 360 soil (The Scotts Company, Marysville, OH) and allowed to equilibrate in a 4°C
chamber, covered with clear plastic for 72 h. The plants were transferred to a growth chamber at
22°C and 60% humidity with a 12/12 photoperiod at 210 µmol m-2 s-1. The plants were covered
with clear plastic for one week, were left partially uncovered for 72 h, and then were uncovered
for the remainder of the growth period. Two weeks after the seeds were sown, seedlings were
thinned so that 4 or 5 plants remained, equidistant, in each 3” square pot. Miracle-Gro® Water
Soluble All Purpose Plant Food (The Scotts Company) was applied every 3 weeks, beginning at
the time the seeds were sown, according to manufacturer’s instructions.
Wounding Treatment, Sampling, and Lipid Extraction
Wounding was performed as described by Laudert and Weiler (1998). Five to six leaves of each
rosette were crushed using a hemostat so that approximately 10% of the total leaf area was
wounded. Care was taken to not crush the midvein. At the indicated time after wounding, 3 to 5
wounded leaves were collected and immediately immersed in 75°C isopropanol containing
0.01% butylated hydroxytoluene. Extractions were continued as described by Welti et al.
(2002). The solvent from each sample was evaporated and the sample was dissolved in 1 ml
chloroform. Lipid amounts were normalized to “dry weight”, as measured after extraction of the
lipid (Welti et al., 2002). Five replicate samples were collected for each experimental time point.
Chromatographic Fractionation
Activated silicic acid (Unisil, Clarkson Chemical Co., Williamsport, PA) was mixed with
chloroform and packed into a column (1.5 cm diameter, 40 ml column volume). Crude extract
containing lipid from 144 mg dry weight of Arabidopsis leaves in chloroform was allowed to
www.plantphysiol.orgon June 30, 2018 - Published by Downloaded from Copyright © 2006 American Society of Plant Biologists. All rights reserved.

16
bind to the column and was then eluted in five fractions: Fraction 1, chloroform:acetone (1:1,
v/v), 200 ml; Fraction 2, acetone, 400 ml; Fraction 3, chloroform:methanol (19:1, v/v), 400 ml;
Fraction 4, chloroform:methanol (4:1, v/v), 400 ml; Fraction 5, chloroform:methanol (1:1, v/v),
800 ml (Christie, 1982). This scheme resulted in the elution of MGDG primarily in Fraction 2,
PG primarily in Fraction 3, and DGDG in both Fractions 2 and 3. The major phospholipids (PE,
PC, PI, and PS) were eluted primarily in Fractions 4 and 5. The solvent was evaporated from
each fraction, and fractions were dissolved in chloroform before mass spectral analysis in
chloroform:methanol:300 mM ammonium acetate (60:133:7, v/v).
Catalytic Hydrogenation
Crude lipid extract was evaporated and dissolved in ethyl acetate/methanol (1:1, v/v) with
platinum (IV) oxide at 1% by lipid weight. The suspension was subjected to >1 atm H2 at 25ºC
for 6 hours. Hydrogenated lipid was centrifuged to remove platinum residue, and the supernatant
was evaporated and dissolved in chloroform.
Multiple Acyl Precursor Scans
An automated electrospray ionization-tandem mass spectrometry approach was used and data
acquisition and analysis were performed as described previously (Welti et al., 2002; Wanjie et
al., 2005) with minor modifications. Briefly, unfractionated lipid extracts were introduced by
continuous infusion into the ESI source on a triple quadrupole MS/MS (API 4000, Applied
Biosystems). Sequential precursor scans of acyl anions in the galactolipid mass range (740 to
1050 amu) of the extracts produced a series of spectra with each spectrum revealing a set of lipid
species containing either a common head group or specific fatty acyl chain. When scans were to
be used for quantification purposes, internal standards, 16:0-18:0 MGDG (2.01 nmol), 18:0-18:0
MGDG (0.39 nmol), 16:0-18:0 DGDG (0.49 nmol), and 18:0-18:0 DGDG (0.71 nmol), were
added. The internal standards were prepared by catalytic hydrogenation of MGDG and DGDG
purified (separately) from unwounded Arabidopsis (Christie, 1982). Each of the components,
i.e. 18:0-18:0 MGDG and 18:0-16:0 MGDG (and the same species in DGDG), were quantified
by gas chromatography of the fatty acid methyl esters. 18:0-18:0 MGDG, 18:0-16:0 MGDG,
www.plantphysiol.orgon June 30, 2018 - Published by Downloaded from Copyright © 2006 American Society of Plant Biologists. All rights reserved.

17
18:0-18:0 DGDG, and 18:0-16:0 DGDG can be used as internal standards because the biological
samples do not contain these fully saturated compounds.
Samples were introduced using an autosampler (LC Mini PAL, CTC Analytics AG, Zwingen,
Switzerland) fitted with the required injection loop for the acquisition time and presented to the
ESI needle at 30 µl/min. The collision gas pressure was set at four (arbitrary units), the source
temperature (heated nebulizer) was 100°C, the interface heater was on, -4.5 kV was applied to
the electrospray capillary, the curtain gas was set at 20 (arbitrary units), and the two ion source
gases at 45 (arbitrary units). The collision energy was -45 V with nitrogen in the collision cell,
declustering potential was -100 V, entrance potential was -10 V, and exit potential was -20 V.
The mass analyzers were adjusted to a resolution of 0.7 amu full width at half height. For each
spectrum, 36 continuum scans were averaged in multiple channel analyzer (MCA) mode. The
background was subtracted, the data were smoothed, and peak areas integrated using a custom
script and Applied Biosystems Analyst software.
Data Handling and Quantification of Galactolipid Species
The m/z and peak area data were sorted using Microsoft Excel to find peaks within each fatty
acyl precursor spectrum corresponding to each target galactolipid molecular species. Peak areas
were corrected for precursor ion isotopic distribution (Han and Gross, 2001). Peak areas of the
same precursor from its two acyl precursor scans were added, except when the precursor had two
of the same acyl chain, in which case, the peak area was used directly. The total peak areas for
each species were quantified in comparison to a standard line in a plot of total peak area vs. m/z,
created with isotopically corrected data from two galactolipid internal standards, 16:0-18:0
MGDG and 18:0-18:0 MGDG (for quantification of MGDG species) or 16:0-18:0 DGDG and
18:0-18:0 DGDG (for quantification of DGDG species).
Q-TOF MS/MS and CID-TOF MS Analysis
ESI-Q-TOF MS/MS and ESI-CID-TOF MS spectra were acquired with a Micromass Q-TOF-2
tandem mass spectrometer (Micromass Ltd, Manchester, UK). The time of flight analyzer was
www.plantphysiol.orgon June 30, 2018 - Published by Downloaded from Copyright © 2006 American Society of Plant Biologists. All rights reserved.

18
tuned for maximum resolution (10,000 resolving power) with argon in the collision cell.
Micromass MassLynx software was used as the operating software. All TOF spectra were
acquired with daily mass calibration.
For Q-TOF analysis, samples containing silicic acid-fractionated lipids were infused directly in
chloroform:methanol:300 mM ammonium acetate in water (60:133:7, v/v) at 30 µl/min into the
ESI source of the Q-TOF. Negatively charged precursor target peaks, selected by the quadrupole
tuned to transmit at 0.8 atomic mass units full width at half height, were subjected to product ion
scanning in the negative ion mode. The collision energy was 35 V. For CID-TOF MS analysis,
radio frequency/direct current mass selection in the quadrupole is turned off, while the collision
cell remains at 35 V offset. Unfractionated samples in chloroform:methanol:300 mM
ammonium acetate in water (60:133:7, v/v) were infused at 20 µl/min into the ESI source.
The unselected precursor ions were subjected to CID at 35 V in the negative mode.
Both Q-TOF and CID-TOF mass spectra were mass corrected by locking the m/z to the
determined theoretical m/z of the ion formed from a head group fragment with an exact mass of
m/z 253.0923 in MGDG (in both Q-TOF and CID-TOF modes) and m/z 397.1346 (in Q-TOF
mode) in DGDG. With the locked mass value set, the exact masses of product ions were
calculated to ten thousandths of an atomic mass unit. Chemical formulas for the product ions
were determined using the Micromass MassLynx chemical formula tool. Each designated
chemical formula match was the best match for a formula containing the indicated elements.
Deviations between the detected m/z and “theoretical” m/z, calculated by the chemical formula
tool, of the best matched chemical formula were determined.
ACKNOWLEDGEMENTS
We would like to thank Dr. Giorgis Isaac for critical reading of the manuscript. We would also
like to thank the reviewers for their helpful comments.
www.plantphysiol.orgon June 30, 2018 - Published by Downloaded from Copyright © 2006 American Society of Plant Biologists. All rights reserved.

19
LITERATURE CITED
Bachmann A, Hause B, Maucher H, Garbe E, Voros K, Weichert H, Wasternack C,
Feussner I (2002) Jasmonate-induced lipid peroxidation in barley leaves initiated by distinct
13-LOX forms of chloroplasts. J Biol Chem 383: 1645-1657
Bell E, Creelman RA, Mullet JE (1995) A chloroplast lipoxygenase is required for wound-
induced jasmonic acid accumulation in Arabidopsis. Proc Natl Acad Sci USA 92: 8675-8679
Blechert S, Brodschelm W, Hölderr S, Kammerer L, Kutchan TM, Mueller MJ, Xia A-Q,
Zenk MH (1995) The octadecanoid pathway: signal molecules for the regulation of
secondary pathways. Proc Natl Acad Sci USA 92: 4099-4105
Blée E, Joyard J (1996) Envelope membranes from spinach chloroplasts are a site of
metabolism of fatty acid hydroperoxides. Plant Physiol 110: 445-454
Blée E (1998) Phytooxylipins and plant defense reactions. Prog Lipid Res 37: 33-72
Brash AR, Ingram CD, Harris TM (1987) Analysis of a specific oxygenation reaction of
soybean lipoxygenase-1 with fatty acids esterified in phospholipids. Biochemistry 26: 5465-
5471
Christie WW (1982) Lipid Analysis, Ed 2. Pergamon Press, Oxford, England
Creelman RA, Mulpuri R (2002) The oxylipin pathway in Arabidopsis. In CR Somerville, EM
Meyerowitz, eds, The Arabidopsis Book, American Society of Plant Biologists, Rockville,
MD, www.aspb.org/publications/arabidopsis/
Farmer EE, Ryan CA (1992) Octadecanoid precursors of jasmonic acid activate the synthesis
of wound-inducible proteinase inhibitors. Plant Cell 4: 129-134
Hamberg M (1988) Biosynthesis of 12-oxo-10,15(Z)-phytodienoic acid: identification of an
allene oxide cyclase. Biochem Biophys Res Commun 156: 543-550
Hamberg M, Sanz A, Rodriguez, MJ, Calvo AP, Castresana C (2003) Activation of the fatty
acid α-dioxygenase pathway during bacterial infection of tobacco leaves. J Biol Chem 278:
51796-51805
Han X, Gross RW (2001) Quantitative analysis and molecular species fingerprinting of
triacylglyceride molecular species directly from lipid extracts of biological samples by
electrospray ionization tandem mass spectrometry. Anal Biochem 295: 88-100
www.plantphysiol.orgon June 30, 2018 - Published by Downloaded from Copyright © 2006 American Society of Plant Biologists. All rights reserved.
20
Hisamatsu Y, Goto N, Hasegawa K, Shigemori H (2003) Arabidopsides A and B, two new
oxylipins from Arabidopsis thaliana. Tetrahedron Lett 44: 5553-5556
Hisamatsu Y, Goto N, Sekiguchi M, Hasegawa K, Shigemori H (2005) Oxylipins
arabidopsides C and D from Arabidopsis thaliana. J Nat Prod 68: 600-603
Kutchan TM (1993) 12-Oxo-phytodienoic acid induces accumulation of berberine bridge
enzyme transcripts in a manner analogous to methyl jasmonate. J Plant Phys 142: 502-505
Laudert D, Weiler EW (1998) Allene oxide synthase: a major control point in Arabidopsis
thaliana octadecanoid signalling. Plant J 5: 675-684
Miquel M, Cassagne C, Browse J (1998) A new class of Arabidopsis mutants with reduced
hexadecatrienoic acid fatty acid levels. Plant Phys 117: 923-930
Murphy RC (1993) Mass Spectrometry of Lipids. Handbook of Lipid Research, Vol. 7, Chapter
7, pp 223-226
Somerville C, Browse J, Jaworski JG, Ohlrogge JB (2000) Lipids. In Biochemistry and
Molecular Biology of Plants. Buchanan B, Gruissem W, and Jones R, eds (Rockville, MD:
American Society of Plant Biologists), pp. 456–527
Stelmach BA, Müller A, Hennig P, Gebhardt S, Schubert-Zsilavecz M, Weiler EW (2001) A
novel class of oxylipins, sn1-O-(12-oxophytodienoyl)-sn2-O-(hexadecatrienoyl)-
monogalactosyl diglyceride, from Arabidopsis thaliana. J Biol Chem 276: 12832-12838;
Correction published, J Biol Chem 276: 28628
Stintzi A, Weber H, Reymond P, Browse J, Farmer EE (2001) Plant defense in the absence of
jasmonic acid: the role of cyclopentenones. Proc Natl Acad Sci USA 98: 12837-12842
Taki N, Sasaki-Sekimoto Y, Obayashi T, Kikuta A, Kobayashi K, Ainai T, Yagi K, Sakurai
N, Suzuki H, Masuda T et al. (2005) 12-Oxo-phytodienoic acid triggers expression of a
distinct set of genes and plays a role in wound-induced gene expression in Arabidopsis. Plant
Physiol 139: 1268-1283
Tokumura A, Sumida T, Toujima M, Kogure K, Fukuzawa K, Takahashi Y, Yamamoto S
(2000) Structural identification of phosphatidylcholines having an oxidatively shortened
linoleate residue generated through its oxygenation with soybean or rabbit reticulocyte
lipoxygenase. J Lipid Res 41: 953-962
Turner JG, Ellis C, Devoto A (2002) The jasmonate signal pathway. Plant Cell 14: S153-S164
www.plantphysiol.orgon June 30, 2018 - Published by Downloaded from Copyright © 2006 American Society of Plant Biologists. All rights reserved.

21
Vollenweider S, Weber H, Stolz S, Chételat A, Farmer EE (2000) Fatty acid ketodienes and
fatty acid ketotrienes: Michael addition acceptors that accumulate in wounded and diseased
Arabidopsis leaves. Plant J 24: 467-476
Wanjie SW, Welti R, Moreau RA, Chapman KD (2005) Identification and quantification of
glycerolipids in cotton fibers: reconciliation with metabolic pathway predictions from DNA
databases. Lipids 40: 773-785
Weber H, Vick BA, Farmer EE (1997) Dinor-oxo-phytodienoic acid: a new hexadecanoid
signal in the jasmonate family. Proc Natl Acad Sci USA 94: 10473-10478
Weber H, Chételat A, Caldelari D, Farmer EE (1999) Divinyl ether fatty acid synthesis in late
blight-diseased potato leaves. Plant Cell 11: 485-493
Weber H (2002) Fatty acid-derived signals in plants. Trends Plant Sci 7: 217-224
Welti R, Li W, Li M, Sang Y, Biesiada H, Zhou HE, Rajashekar CB, Williams TD, Wang X
(2002) Profiling membrane lipids in plant stress responses. Role of phospholipase Dα in
freezing-induced lipid changes in Arabidopsis. J Biol Chem 277: 31994-32002
Welti R, Wang X, Williams TD (2003) Electrospray ionization tandem mass spectrometry scan
modes for plant chloroplast lipids. Anal Biochem 314: 149-152
Ziegler J, Stenzel I, Hause B, Maucher H, Hamberg M, Grimm R, Ganal M, Wasternack C
(2000) Molecular cloning of allene oxide cyclase. The enzyme establishing the
stereochemistry of octadecanoids and jasmonates. J Biol Chem 275: 19132-19138
Zien CA, Wang C, Wang X, Welti R (2001) In vivo substrates and the contribution of the
common phospholipase D, PLDα, to wound-induced metabolism of lipids in Arabidopsis.
Biochim Biophys Acta 1530: 236-248
www.plantphysiol.orgon June 30, 2018 - Published by Downloaded from Copyright © 2006 American Society of Plant Biologists. All rights reserved.
22
Figure Legends
Figure 1. Biosynthetic and proposed biosynthetic pathway for 18-carbon ketols, OPDA, and
OPDA-containing MGDG. Analogous pathways are thought to convert hexadecatrienoic acid to
dnOPDA and 16-carbon ketols, and dnOPDA to JA via two cycles of β-oxidation. The
relationship of OPDA- and dnOPDA-containing MGDG, DGDG, and PG to this process is not
clear, as indicated by the question marks, but two possibilities are that (1) trienoic fatty acids are
released from galactolipids (or PG), converted to OPDA or dnOPDA, then reincorporated into
complex lipids, or (2) conversion of trienoic fatty acids to OPDA or dnOPDA takes place on the
complex lipids, and these species are later released.
Figure 2. CID-TOF spectra of anions from lipids of (A) unwounded and (B) wounded (after 5 h)
Arabidopsis leaves. Unselected molecular ions in an extract were subjected to collisionally
induced dissociation and analyzed with a time-of-flight analyzer. Table I provides additional
information about each peak. Note that the spectra are expanded 10x from approximately m/z
262 to 273 and 5x from 290 to 310. Insets show areas in which there are two peaks at similar
m/z.
Figure 3. CID-TOF spectra of anions from lipids of (A) unwounded and (B) wounded (after 5 h)
Arabidopsis leaves after catalytic hydrogenation. Unselected molecular ions in an extract were
subjected to collisionally induced dissociation and analyzed with a time-of-flight analyzer.
Table I provides additional information about each peak. Note that the spectra are expanded 20x
from approximately m/z 262 to 282 and 5x from 290 to 310. Insets show areas in which there are
two peaks at similar m/z.
Figure 4. Discovery scans: precursor scanning of an unfractionated extract from wounded
Arabidopsis. All scans were performed in the negative mode. The peak designations were
verified by determination of the exact masses of the acyl product ions as indicated in
Supplemental Table I. Most peaks indicate the [M-H]- ions, while peaks indicated by labels in
parentheses indicate the [M+OAc]- adducts of MGDG. A. Scan for precursors of m/z 227
indicates PG species (Welti et al., 2003). B. Scan for precursors of m/z 235, a glycerogalactose
www.plantphysiol.orgon June 30, 2018 - Published by Downloaded from Copyright © 2006 American Society of Plant Biologists. All rights reserved.

23
minus H2O fragment, indicates MGDG. C. Scan for precursors of m/z 249 or the acyl anion of
16:3. D. Scan for precursors of m/z 277 or the acyl anion of 18:3. E. Scan for precursors of m/z
263 or the acyl anion of dnOPDA. F. Scan for precursors of 291 or the acyl anion of OPDA. G.
Scan for precursors of m/z 309 or the acyl anion of the ketols derived from 18:3. The marked
species are MGDG unless explicitly designated as PG. Note the relative scales of the panels. In
addition, please note that panels A-F have breaks in the vertical scales, so that smaller peaks can
be seen more easily.
Figure 5. Three of the OPDA-containing lipid species from leaves of wounded Arabidopsis.
Please note that the acyl position assignments and the assignment of the double bond position in
the 16:1 acyl chain are not based on mass spectral data in this work. The assignments utilized in
producing this figure reflect the work of others (Hisamatsu et al., 2003, 2005), knowledge of the
16- and 18-carbon acyl positional specificity in plastidically produced lipids, and knowledge of
the structure of 16:1 typically found in plastidically produced PG (Miquel et al., 1998;
Somerville et al., 2000).
Figure 6. Levels of OPDA and dnOPDA-containing galactolipids in unwounded Arabidopsis. n
= 5. Error bars are standard deviation.
Figure 7. Levels of the major oxylipin-containing MGDG and DGDG species during response
to wounding in Arabidopsis leaves. Wounded leaves were collected at the time points indicated,
lipids were extracted, and galactolipids containing esterified oxylipins were analyzed using
multiple acyl precursor scanning. A. MGDG species. B. DGDG species. The zero time point
represents unwounded plants. n = 5. Error bars are standard deviation.
Figure 8. Ratios of measured galactolipid species containing two oxylipins and galactolipid
species containing one oxylipin. For MGDG, ([OPDA-dnOPDA MGDG] + [OPDA-OPDA
MGDG])/([OPDA-16:3 MGDG] + [18:3-dnOPDA MGDG] + [OPDA-18:3 MGDG]) and, for
DGDG, [OPDA-OPDA DGDG]/[OPDA-18:3 DGDG] are plotted as a function of the time after
wounding. The zero time point represents unwounded plants. n = 5. Error bars are standard
deviation.
www.plantphysiol.orgon June 30, 2018 - Published by Downloaded from Copyright © 2006 American Society of Plant Biologists. All rights reserved.

24
Tables with legends
Table I. Identification by TOF analysis of major anionic fragments, produced by CID in the negative mode, in the m/z range 230-310 in an extract from wounded Arabidopsis, and identification of the fragments in the m/z range 250-320 in a hydrogenated extract from wounded Arabidopsis. In each case, the mass calibration was “locked” by setting m/z of the glycerol-galactose fragment produced by mono- and di-galactosyldiacylglycerols to its theoretical value of 253.0923. Experimental m/z from Fig. 2 (wounded)
Theoretical m/z
Difference (ppm)
Formula Interpretation
235.0820 235.0818 +0.9 C9H15O7 Glycerogalactose - H2O 241.0104 241.0113 -3.7 C6H10O8P Inositol-phosphate - H2O 249.1846 249.1855 -3.6 C16H25O2 16:3 (253.0923) 253.0923 +0.0 C9H17O8 Glycerogalactose 253.2164 253.2168 -1.6 C16H29O2 16:1 255.2320 255.2324 -1.6 C16H31O2 16:0 263.1656 263.1647 +3.4 C16H23O3 dnOPDA 277.2155 277.2168 -4.7 C18H29O2 18:3 279.2317 279.2324 -2.5 C18H31O2 18:2 281.1733 281.1753 -7.1 C16H25O4 16C ketol 281.2471 281.2481 -3.6 C18H33O2 18:1 291.1968 291.1960 +2.8 C18H27O3 OPDA 309.2065 309.2066 -0.3 C18H29O4 18C ketol Experimental m/z from Fig. 3 (wounded)
Theoretical m/z
Difference (ppm)
Formula Interpretation
(253. 0923) 253.0923 +0.0 C9H17O8 Glycerogalactose 255.2311 255.2324 -5.1 C16H31O2 16:0 267.1970 267.1960 +3.7 C16H27O3 Hydrogenated dnOPDA 283.2614 283.2637 -8.1 C18H35O2 18:0 295.2275 295.2273 +0.7 C18H31O3 Hydrogenated OPDA 313.2359 313.2379 -6.3 C18H33O4 Hydrogenated 18C ketol
www.plantphysiol.orgon June 30, 2018 - Published by Downloaded from Copyright © 2006 American Society of Plant Biologists. All rights reserved.

25
Table II. Previously described oxylipin anions with chemical formulas identified in Fig. 2, and their predicted formulas and masses after catalytic hydrogenation. The shorthand used in this table indicates “total carbons: no. of double bond equivalents-oxygen atoms”. Double bond equivalents include carbon-carbon double bonds, carbon-oxygen double bonds, and rings. The double bond equivalent does not include the carbonyl of a fatty acid; i.e. a saturated fatty acid would be listed as having no double bonds. The left-hand side of the table shows oxylipin species described in the literature with the chemical formulas detected in the spectra shown in Fig. 2. The right hand side of the table shows the acyl species that would be formed from the species on the left after catalytic hydrogenation. The bold type indicates the species that were actually detected (Fig. 3).
w
ww
.plantphysiol.orgon June 30, 2018 - P
ublished by D
ownloaded from
C
opyright © 2006 A
merican S
ociety of Plant B
iologists. All rights reserved.

26
Naturally-occurring oxylipins with
chemical formulas identified in Fig. 2
Oxylipins potentially formed after
catalytic hydrogenation
Mass of anion detected Formula Shorthand Potential compound
References showing structure
Mass of anion (Bold indicates those detected; Fig. 3) Formula Shorthand
291.1960 C18H27O3 18:4-O OPDAa
Creelman and Mulpuri, 2002 295.2273 C18H31O3 18:2-O
“ “ “
keto-octadecatrienoic acid (13-KOTE shown; other isomers possible)b
Blée and Joyard, 1996; Vollenweider et al., 2000. 297.2430 C18H33O3 18:1-O
“ “ “ colnelenic acidc Weber et al., 1999 299.2586 C18H35O3 18:0-O
309.2066 C18H29O4 18:3-2O α- or γ-ketol acid (α-ketol shown; see Fig. 1 for γ-ketol)d Blée, 1998 313.2379 C18H33O4 18:1-2O
“ “ “
hydroperoxy-octadecatrienoic acid (13-HPOTE shown; other isomers possible)e
Blée and Joyard, 1996; Hamberg et al., 2003 315.2535 C18H35O4 18:0-2O
“ “ “
dihydroxy-octadecatrienoic acid (2,13-diHOTE shown; other isomers possible)f
Hamberg et al., 2003 315.2535 C18H35O4 18:0-2O
263.1647
C16H23O3
16:4-O
dnOPDAg
Creelman and Mulpuri, 2002
267.1960 C16H27O3 16:2-O
“ “ “ keto-hexadecatrienoic acid 269.2117 C16H29O3 16:1-O “ “ “ 16-carbon analog of colnelenic acid 271.2273 C16H31O3 16:0-O
281.1753 C16H25O4 16:3-2O 16-carbon ketol 285.2066 C16H29O4 16:1-2O “ “ “ hydroperoxy-hexadecatrienoic acid 287.2222 C16H31O4 16:0-2O “ “ “ dihydroxy-hexadecatrienoic acid 287.2222 C16H31O4 16:0-2O
a
O
COOH b
O
COOH c COOHO
d COOH
O
OH
e COOH
HOO f COOH
OH
HO
g COOH
O
w
ww
.plantphysiol.orgon June 30, 2018 - P
ublished by D
ownloaded from
C
opyright © 2006 A
merican S
ociety of Plant B
iologists. All rights reserved.

27
Table III. Lipid molecular species identified by accurate mass product ion analysis of fractionated extracts from wounded Arabidopsis (Supplemental Table I). The assignments of position are based on previous work showing that in species containing 16 and 18 carbon acyl chains, the 16-carbon acyl species are at position 2 (Miquel et al., 1998). Position assignments are not based on the mass spectral data. These identifications were confirmed by analysis of catalytically hydrogenated molecular species (Supplemental Table II).
[M-H]-
ion of m/z Interpretation
PG 755 OPDA/16:1 757 OPDA/16:0
MGDG 759 OPDA/16:3 759 18:3/dnOPDA 773 OPDA/dnOPDA 777 18C ketol/16:3 777 18:3/16C ketol 787 OPDA/18:3 791 18C ketol/dnOPDA 791 OPDA/16C ketol 801 OPDA/OPDA 805 18:3/18C ketol 819 OPDA/18C ketol
DGDG 949 OPDA/18:3 963 OPDA/OPDA 967 18:3/18C ketol 981 OPDA/18C ketol
www.plantphysiol.orgon June 30, 2018 - Published by Downloaded from Copyright © 2006 American Society of Plant Biologists. All rights reserved.

www.plantphysiol.orgon June 30, 2018 - Published by Downloaded from Copyright © 2006 American Society of Plant Biologists. All rights reserved.

www.plantphysiol.orgon June 30, 2018 - Published by Downloaded from Copyright © 2006 American Society of Plant Biologists. All rights reserved.

www.plantphysiol.orgon June 30, 2018 - Published by Downloaded from Copyright © 2006 American Society of Plant Biologists. All rights reserved.

www.plantphysiol.orgon June 30, 2018 - Published by Downloaded from Copyright © 2006 American Society of Plant Biologists. All rights reserved.

www.plantphysiol.orgon June 30, 2018 - Published by Downloaded from Copyright © 2006 American Society of Plant Biologists. All rights reserved.

www.plantphysiol.orgon June 30, 2018 - Published by Downloaded from Copyright © 2006 American Society of Plant Biologists. All rights reserved.

www.plantphysiol.orgon June 30, 2018 - Published by Downloaded from Copyright © 2006 American Society of Plant Biologists. All rights reserved.

www.plantphysiol.orgon June 30, 2018 - Published by Downloaded from Copyright © 2006 American Society of Plant Biologists. All rights reserved.