Rudolf Braun and Roland Kirchmayr · 2013. 7. 31. · • Benchmarking with Data Envelopment...
25
IEA Seminar Ludlow – April 17, 2008 R. Braun & R. Kirchmayr Results of 41 Co-digestion Digestion Plants in Austria Rudolf Braun and Roland Kirchmayr BOKU - University of Natural Resources and Applied Life Sciences, Vienna Department for Agrobiotechnology, IFA-Tulln Institute for Environmental Biotechnology Ludlow, April 17, 2008
Transcript of Rudolf Braun and Roland Kirchmayr · 2013. 7. 31. · • Benchmarking with Data Envelopment...

IEA Seminar Ludlow – April 17, 2008 R. Braun & R. Kirchmayr
Results
of 41 Co-digestion Digestion Plants
in AustriaRudolf Braun and Roland Kirchmayr
BOKU - University of Natural Resources and Applied Life Sciences, Vienna Department for Agrobiotechnology, IFA-Tulln Institute for Environmental Biotechnology
Ludlow, April 17, 2008

IEA Seminar Ludlow – April 17, 2008 R. Braun & R. Kirchmayr
CONTENTS
• Development of energy crop digestion• Acquisition of performance data from 41 biogas plants• Evaluation parameters elaborated• Compiled performance data • Benchmarking with Data Envelopment Analysis• Conclusions

IEA Seminar Ludlow – April 17, 2008 R. Braun & R. Kirchmayr
Development
of energy
crop
digestion
in Austria
0
50
100
150
200
250
300
350
2003 2004 2005YEAR
Num
ber,
inst
. cap
acity
[MW
el]
Number of plants Installed capacity
Austrian Eco Electricity Act (2002)
Ökostromgesetz
BGBl. I Nr. 2002/149Inst. capacity
(kW)
Feed-in tariff
(ct./kWh)*
< 100 16.5100-500 14.5
500-1000 12.5> 1,000 10.3
*) 25 % reduction in case of co-digestion of defined co-substrates; consent must be achieved by end of 2004

IEA Seminar Ludlow – April 17, 2008 R. Braun & R. Kirchmayr
Biogas Plants in AustriaData: e-control Austria
0
10
20
30
40
50
60
70
80
90
100
Dez.01 Apr.02 Aug.02 Dez.02 Apr.03 Aug.03 Dez.03 Apr.04 Aug.04 Dez.04 Apr.05 Aug.05 Dez.05 Apr.06 Aug.06 Dez.06
YEAR
Pow
er [
MW
]
0
40
80
120
160
200
240
280
320
360
400
Num
ber o
f Pla
nts
Power approvedPower constructedNumber approvedNumber constructed
IEA Seminar Ludlow – April 17, 2008 R. Braun & R. Kirchmayr
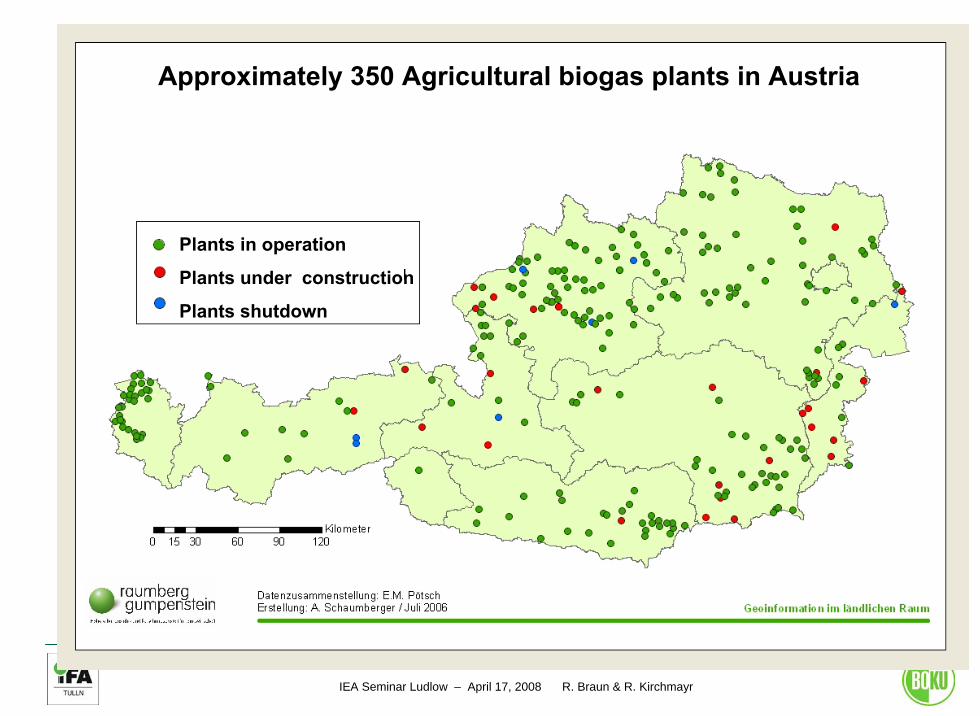
Plants
in operation
Plants
under construction
Plants
shutdown
Approximately
350 Agricultural
biogas
plants
in Austria

IEA Seminar Ludlow – April 17, 2008 R. Braun & R. Kirchmayr
1 A
1 B
2 A
2 B
3
4
Renewable raw materials
Bio-waste, by-products
Substrate preparation & dosage into digesters
Biogas use for power generation and /or upgrading to fuel
Use of digestate as fertilzer and/or compost

IEA Seminar Ludlow – April 17, 2008 R. Braun & R. Kirchmayr

IEA Seminar Ludlow – April 17, 2008 R. Braun & R. Kirchmayr

IEA Seminar Ludlow – April 17, 2008 R. Braun & R. Kirchmayr

IEA Seminar Ludlow – April 17, 2008 R. Braun & R. Kirchmayr
IEA Seminar Ludlow – April 17, 2008 R. Braun & R. Kirchmayr
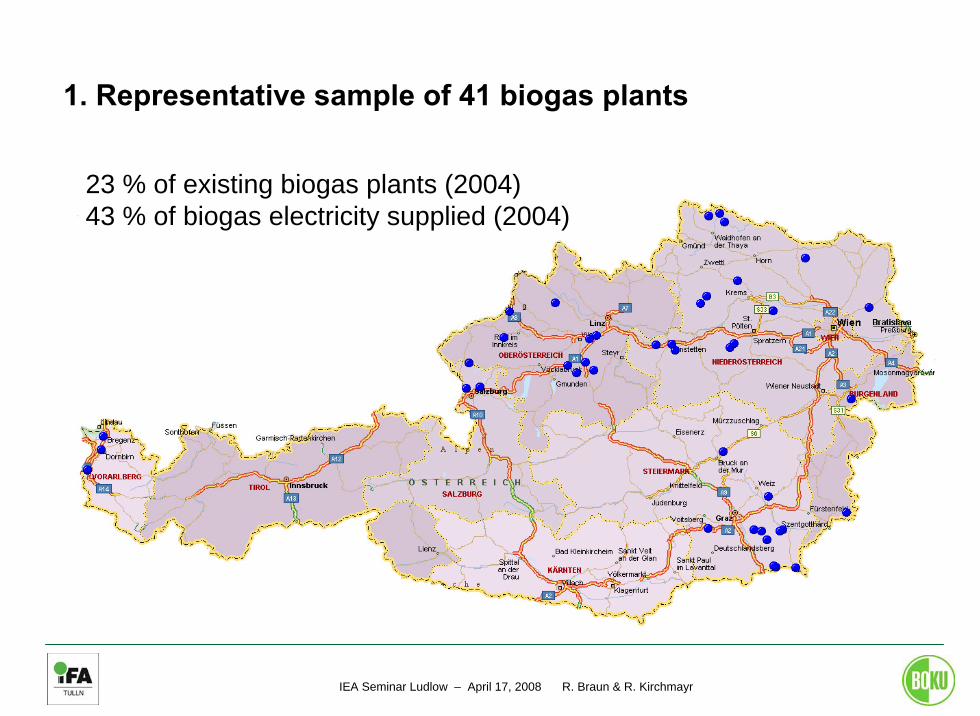
23 % of existing biogas plants (2004)43 % of biogas electricity supplied (2004)
1. Representative sample of 41 biogas plants
IEA Seminar Ludlow – April 17, 2008 R. Braun & R. Kirchmayr
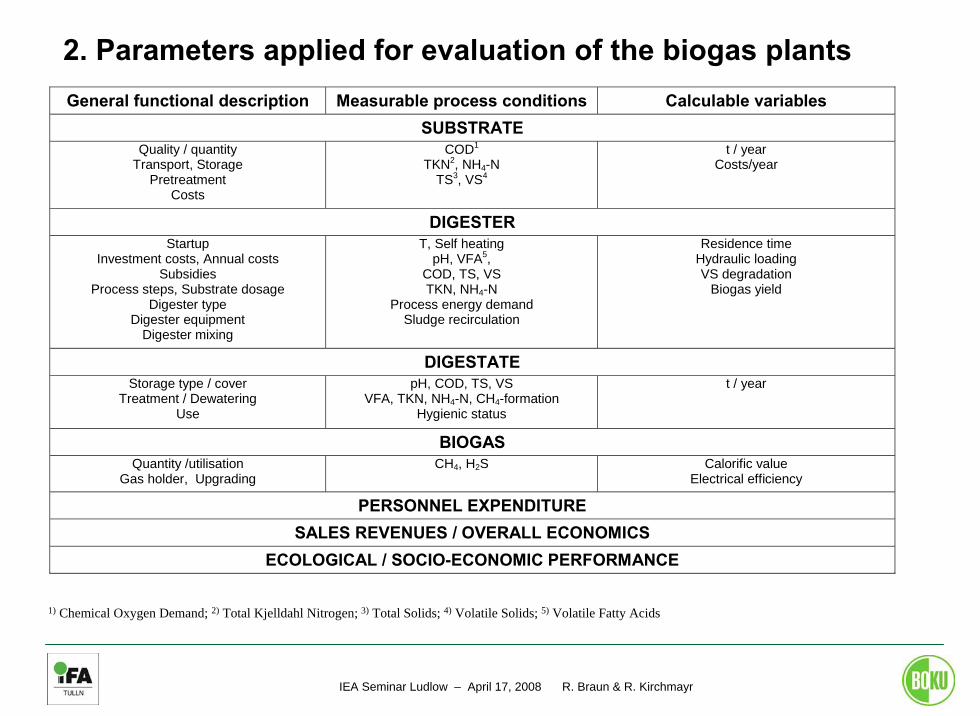
General functional description Measurable process conditions Calculable variables SUBSTRATE
Quality / quantity Transport, Storage
Pretreatment Costs
COD1
TKN2, NH4-N TS3, VS4
t / year Costs/year
DIGESTER Startup
Investment costs, Annual costs Subsidies
Process steps, Substrate dosage Digester type
Digester equipment Digester mixing
T, Self heating pH, VFA5,
COD, TS, VS TKN, NH4-N
Process energy demand Sludge recirculation
Residence time Hydraulic loading VS degradation
Biogas yield
DIGESTATE Storage type / cover
Treatment / Dewatering Use
pH, COD, TS, VS VFA, TKN, NH4-N, CH4-formation
Hygienic status
t / year
BIOGAS Quantity /utilisation
Gas holder, Upgrading CH4, H2S Calorific value
Electrical efficiency
PERSONNEL EXPENDITURE SALES REVENUES / OVERALL ECONOMICS
ECOLOGICAL / SOCIO-ECONOMIC PERFORMANCE
1) Chemical Oxygen Demand; 2) Total Kjelldahl Nitrogen; 3) Total Solids; 4) Volatile Solids; 5) Volatile Fatty Acids
2. Parameters applied for evaluation of the biogas plants

IEA Seminar Ludlow – April 17, 2008 R. Braun & R. Kirchmayr
Parameter Unit Median min. max.
Amount of processed substrate tSubstrate/d 13.2 0.8 58.9 Hydraulic retention time m³RV/(tSubstrate/d) 131 44 483 Organic load (dry substance) kgVS/(m³RV·d) 3.59 1.04 7.97 COD load kgCOD/(m³RV·d) 5.64 1.62 11.95 Amount of VS tVS/d 2.34 0.33 13.78 Biogas generation Nm³biogas/d 1,461 233 10.115 Biogas productivity Nm³biogas/(m³RV·d) 0.96 0.22 2.17 Carbon degradation % 82.8 61.5 96.8 Average biogas yield Nm³biogas/kgVS 0.662 0.511 0.878 Methane content in biogas % 54.8 49.7 67.0 Electrical efficiency % 31.3 20.7 39.2 Use of heat (related to total input energy Hu, biogas)
% 16.5 0.0 42.6
Annual use efficiency (related to total input energy Hu, biogas)
% 47.3 30.5 72.3
RV: Reactor volume; Hu, biogas: Net calorific value of biogas; VS: Organic matter
3. Performance figures of the technical monitoring and benchmarking

IEA Seminar Ludlow – April 17, 2008 R. Braun & R. Kirchmayr
Used substrates (% VS)
0%
20%
40%
60%
80%
100%
1 3 5 7 9 11 13 15 17 19 21 23 25 27 29 31 33 35 37 39 41
biogas-plant-number
used
sub
stra
tes
[% V
S]
energy crops % manure % co-substrates % bio-waste %

IEA Seminar Ludlow – April 17, 2008 R. Braun & R. Kirchmayr
Hydraulic retention time and organic load
2,92
4,614,15
3,473,18
0
7
14
21
28
35
42
49
< 30 30-60 60-90 90-120 120-150 > 150hydraulic retention time [d]
rel.
freq
uenc
y [%
]
0
1
2
3
4
5
6
7
orga
nic
load
[kg V
S/(m
³ RV.
d)]
hydraulic retention time organic load

IEA Seminar Ludlow – April 17, 2008 R. Braun & R. Kirchmayr
Plant size (kWel) and reactor volume (RV)
0
4
8
12
16
20
24
28
32
36
1672≤ 1000≤ 500≤ 250≤ 100≤ 50installed electrical power [kWel]
rel.
freq
uenc
y [%
]
0
2.000
4.000
6.000
8.000
10.000
12.000
14.000
16.000
18.000
tota
l RV
[m³]
el. power total RV

IEA Seminar Ludlow – April 17, 2008 R. Braun & R. Kirchmayr
Utilisation of fuel energy
0
10
20
30
40
50
60
70
80
1672≤ 1000≤ 500≤ 250≤ 100≤ 50installed el. power [kWhel]
Deg
ree
of u
tilis
atio
n of
fuel
-ene
rgy
[%]
Degree of electrical efficiency Thermal usage of fuel energy

IEA Seminar Ludlow – April 17, 2008 R. Braun & R. Kirchmayr
Methane-yield [VS]
0
5
10
15
20
25
30
35
40
> 500450-500400-450350-400300-350250-300CH4-yield [Nm³/tVS]
rel.
freq
uenc
y [%
]
carbohydrates proteins fats

IEA Seminar Ludlow – April 17, 2008 R. Braun & R. Kirchmayr
Investvestment costs
0
2.000
4.000
6.000
8.000
10.000
12.000
0 200 400 600 800 1000 1200 1400 1600Plant size [kWel]
Inve
stm
ent c
osts
[€in
v/kW
inst
]
bio-waste
energy crops

IEA Seminar Ludlow – April 17, 2008 R. Braun & R. Kirchmayr
• Best practise benchmarking model
• Non-parametric
linear programming
tool
• Comparative efficiency measurement
• Production efficiency frontier
investment costsrunning costs
personnel expenditureraw materials
fossil fuels
net energy production heat usesales revenuesmethane yieldemissions
Benchmarking by means of Data Envelopment Analysis (DEA)

IEA Seminar Ludlow – April 17, 2008 R. Braun & R. Kirchmayr
(inputs used: amount of organic dry substance, time effort; outputs used: net electricity production and total heat production)
0 0.1 0.2 0.3 0.4 0.5 0.6 0.7 0.8 0.9 1
30212
186
2036101922158
404
313
41169
12171
237
432414282933263234135
3542
Pla
nt N
o.
Efficiency Score
Relative efficiency
I

IEA Seminar Ludlow – April 17, 2008 R. Braun & R. Kirchmayr
0 0.1 0.2 0.3 0.4 0.5 0.6 0.7 0.8 0.9 1
30212
2018176
1512223610408
1941163
319
334
24287
231
431432293426135
4235
Pla
nt N
o.
Efficiency Score
Relative efficiency
II
(inputs used: organic dry substance and time effort; outputs used: electricity fed into the grid, total heat production)

IEA Seminar Ludlow – April 17, 2008 R. Braun & R. Kirchmayr
CONCLUSIONS
• A clearer picture of the technical performance of energy crop digestion could be drawn
• Reasons for specifically good or poor performing plants could be identified
• Experiences from best practice biogas plants can avoid poor technological development and implementation
IEA Seminar Ludlow – April 17, 2008 R. Braun & R. Kirchmayr
Acknowledgement
This project is accomplished within the framework of the research programme "Energy Systems of Tomorrow" - an initiative of the Austrian Federal Ministry for Transport, Innovation, and Technology (BMVIT).
Thank
you
for
your
attention!

IEA Seminar Ludlow – April 17, 2008 R. Braun & R. Kirchmayr
Contact
Rudolf Braun
BOKU -
University of Natural Resources and Applied Life Sciences, Vienna
Department for Agrobiotechnology, IFA-TullnInstitute for Environmental Biotechnology
Konrad Lorenz-Straße 20 A-3430 TullnTel.: +43 2272 / 66280 / 501Fax: +43 2272 / 66280 / 503 [email protected]://www.ifa-tulln.ac.athttp://www.boku.ac.at