![[151] 영상 인식을 통한 오프라인 고객분석 솔루션과 딥러닝](https://static.fdocuments.net/doc/165x107/587071961a28ab48378b7abd/151-587071961a28ab48378b7abd.jpg)
RUCK 2017 MxNet과 R을 연동한 딥러닝 소개
38
1 한재근 INTRODUCTION TO DEEP LEARNING WITH R AND MXNET NVIDIA Corporation R User Conference Korea DATE 28/03/2017
-
Upload
r-kor -
Category
Data & Analytics
-
view
958 -
download
10
Transcript of RUCK 2017 MxNet과 R을 연동한 딥러닝 소개

1
한재근
INTRODUCTION TO DEEP LEARNING WITH R AND MXNET
NVIDIA Corporation
R User Conference KoreaDATE 28/03/2017
22
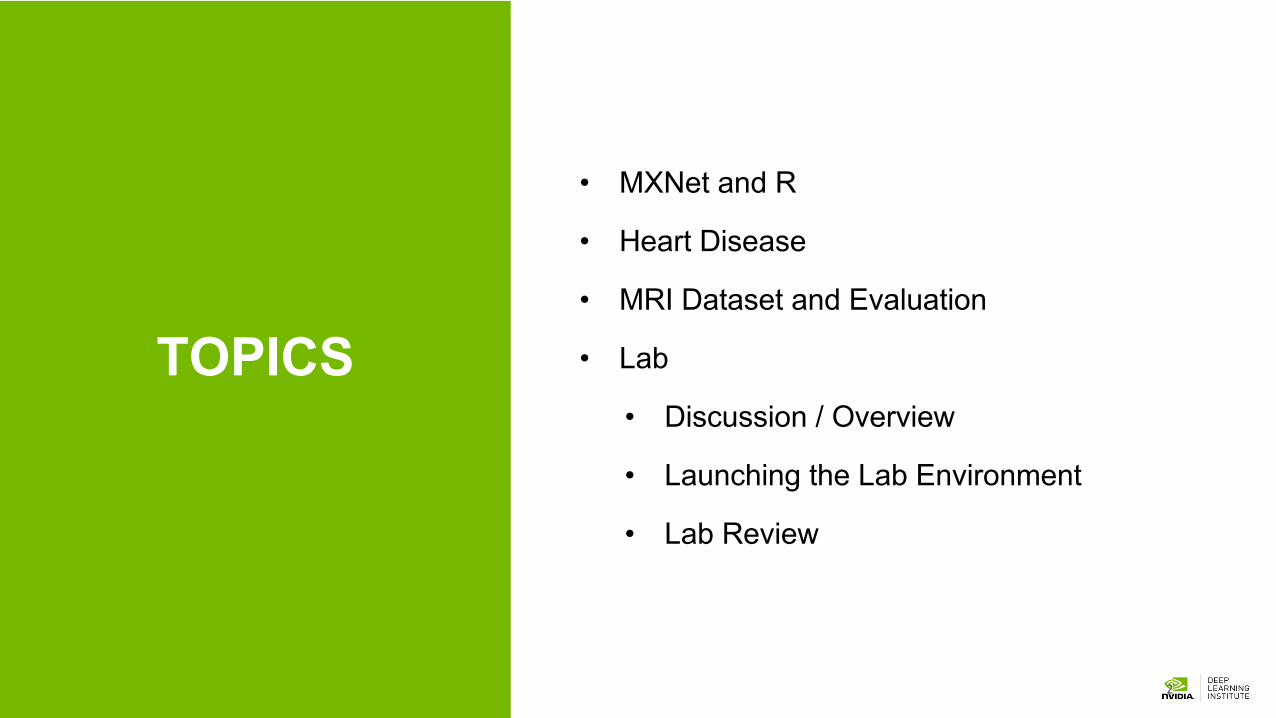
TOPICS
• MXNet and R
• Heart Disease
• MRI Dataset and Evaluation
• Lab
• Discussion / Overview
• Launching the Lab Environment
• Lab Review

3
MXNET (and R)

4
What is MXNET?mxnet.io / github.com/apache/incubator-mxnet
—“Open source software library for efficiency and flexibility”. Available on GitHub
—Scales up to multi GPUs and distributed setting with auto parallelism
—Cloud-friendly and directly compatible with S3, HDFS, and Azure
—Amazon’s main DL platform / Accepted to Apache Incubator on Jan, 2017

5
MXNET and R• MXNet library and read data into R structure from CSV
• Normalize data
train <- read.csv(“train.csv”, header=TRUE)test <- read.csv(“test.csv”, header=TRUE)train <- data.matrix(train)test <- data.matrix(test)
train.x <- train[,-1]train.y <- train[,1]train.x <- t(train.x/255)test <- t(test/255)

6
MXNET and R• MXNet library and read data into R structure from record file
data.shape <- c(args$data_shape, args$data_shape, 3)train = mx.io.ImageRecordIter(
path.imgrec = file.path(args$data_dir, args$train_dataset),
batch.size = args$batch_size,data.shape = data.shape,optimizer = "sgd",initializer = mx.init.Xavier(factor_type="in", magnitude=2),mean.r = 123.68,mean.g = 116.779,mean.b = 103.939,rand.crop = TRUE,rand.mirror = TRUE
)
data normalization
augmentation
※ rec file generation: ./bin/im2rec train.txt ${dataset} train.rec resize=256python im2rec.py --resize 256 --num-thread 16 train.rec ${dataset}

7
MXNET and R• Architect a network
library(mxnet)get_symbol <- function(num_classes = 1000) {
network <- lenet()data <- mx.symbol.Variable(“data”)
conv1 <- mx.symbol.Convolution(data = data, kernel = c(5, 5), num_filter = 20)tanh1 <- mx.symbol.Activation(data = conv1, act_type = "tanh")pool1 <- mx.symbol.Pooling(data = tanh1, pool_type = "max", kernel = c(2, 2), stride = c(2, 2))
conv2 <- mx.symbol.Convolution(data = pool1, kernel = c(5, 5), num_filter = 50)tanh2 <- mx.symbol.Activation(data = conv2, act_type = "tanh")
pool2 <- mx.symbol.Pooling(data = tanh2, pool_type = "max", kernel = c(2, 2), stride = c(2, 2))flatten <- mx.symbol.Flatten(data = pool2)fc1 <- mx.symbol.FullyConnected(data = flatten, num_hidden = 500)
tanh3 <- mx.symbol.Activation(data = fc1, act_type = "tanh")fc2 <- mx.symbol.FullyConnected(data = tanh3, num_hidden = num_classes)lenet <- mx.symbol.SoftmaxOutput(data = fc2, name = 'softmax')return(lenet)
}
1st convolution
2nd convolution
first full conn.
second full conn.
loss

8
MXNET and R• Train a network
mx.set.seed(0)model <- mx.model.FeedForward.create(
softmax, X=train.x, y=train.y,ctx=mx.gpu(0),num.round=10, array.batch.size=100, learning.rate=0.07,momentum=0.9,eval.metric=mx.metric.accuracy,initializer=mx.init.uniform(0.07),batch.end.callback = mx.callback.log.train.metric(100))
GPU select with index, array for multi-gpublank or mx.cpu() runs cpu only

9
Inference
Inference from trained parameter
predictions <- predict(model, data)

10
Model Weights Save & Load
Network snapshot
Load Pre-trained Network
mx.model.save(model, "model_snapshot", 5)
model <- mx.model.load("model_snapshot", 5)
parameter iterationsfile name

11
HEART DISEASE

12
HEART DISEASE
• Cardiovascular (Heart) disease
• Heart attack – blood flow to a part of the heart is blocked by a blood clot
• Stroke – blood to brain is blocked (ischemic) or blood vessel is blocked (hemorrhagic)
• Heart failure – heart is not pumping blood as well as the body needs
• Arrhythmia – abnormal rhythm of the heart
• About 610,000 Americans die from heart disease each year1
1 Mozzafarian D, Benjamin EJ, Go AS, et al. on behalf of the American Heart Association Statistics Committee and Stroke Statistics Subcommittee. Heart disease and stroke statistics—2016 update: a report from the American Heart Association. Circulation. 2016;133:e38-e360.

13
HEART DISEASE• Systole – contracts and
pumps blood from the chambers into the arteries
• Diastole – relaxation of the heart muscle allowing the chamber to fill with blood
Image from 2015 Data Science Bowl

14
HEART DISEASE• Ejection Fraction
• Percentage of blood leaving the heart each time it contracts
• VS = volume at systole
• VD = volume at diastole
Image from 2015 Data Science Bowl
100×𝑉& − 𝑉(𝑉&
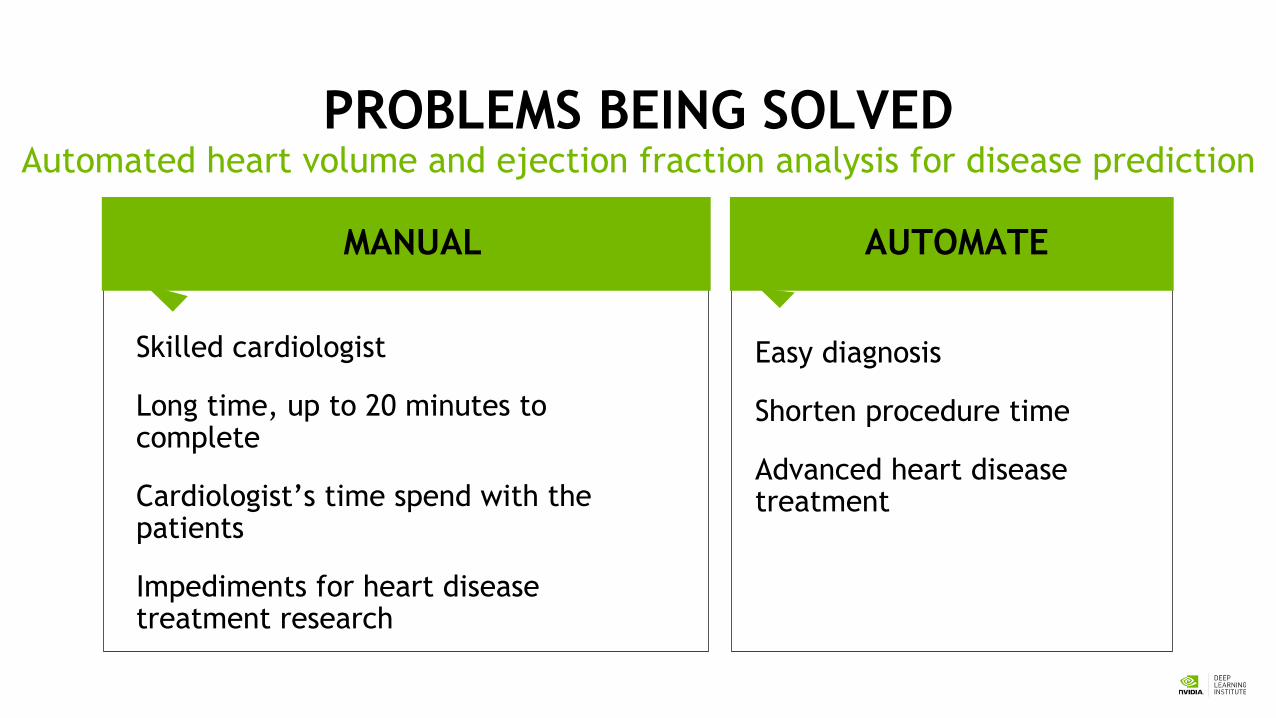
PROBLEMS BEING SOLVEDAutomated heart volume and ejection fraction analysis for disease prediction
AUTOMATEMANUAL
Skilled cardiologist
Long time, up to 20 minutes to complete
Cardiologist’s time spend with the patients
Impediments for heart disease treatment research
Easy diagnosis
Shorten procedure time
Advanced heart disease treatment

16
MRI DATASET AND EVALUATION

IMAGE EXAMPLEHeartbeat sample

18
MRI DATASET
• MRI images from more than 500 patients
• The National Heart, Lung, and Blood Institute (NHLBI) provided images for the 2015 Data Science Bowl1
• National Institutes of Health
• Children’s National Medical Center
1Data Science Bowl is a joint effort between Booz Allen Hamilton & Kaggle
19
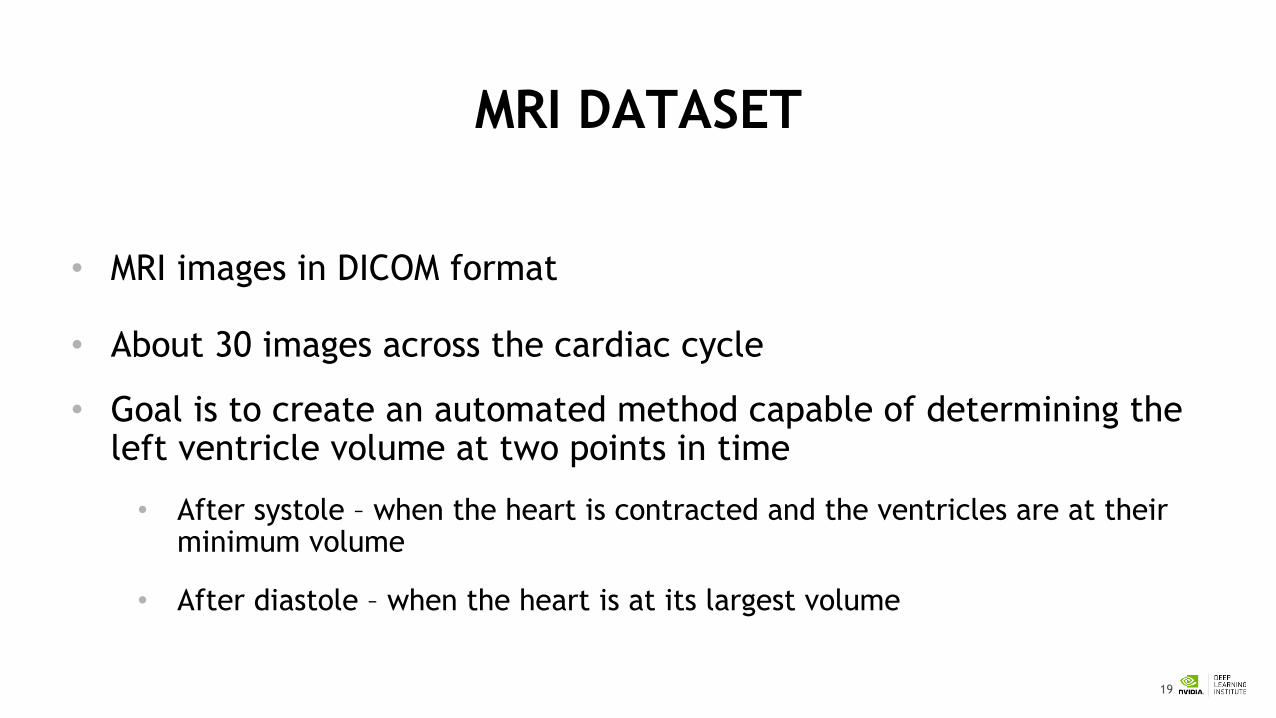
MRI DATASET
• MRI images in DICOM format
• About 30 images across the cardiac cycle
• Goal is to create an automated method capable of determining the left ventricle volume at two points in time
• After systole – when the heart is contracted and the ventricles are at their minimum volume
• After diastole – when the heart is at its largest volume

20
MRI DATASET• The main view for assessing
ventricle size is the short axis stack (PSAX)
• Contains images taken in a plane perpendicular to the long axis (PLAX) of the left ventricle
• These have the prefix "sax_" in the dataset
• Most cases also have alternative views

DATASETfrom Second Data Science Bowl MRI dataset
https://www.kaggle.com/c/second-annual-data-science-bowl/data
x500 training studies (systole & diastole)
x10 SAX observations (average, different view)
x30 DICOM images for 1 heart beat
64x64 pixel sized image
X 10 X 50030
64x64
Systole
Diastole

22
EVALUATION• Continuous Rank Probability Score
(CRPS)
• P = predicted distribution• N = number of rows in the test set
• Equal to twice the number of cases
• V = actual volume in (ml)• H(x) = Heavyside step function
• H(x < 0) = 0 and H(x > 0) = 1
𝐶𝑅𝑃𝑆 = 1
600𝑁 0 0(𝑃 𝑦 ≤ 𝑛 − 𝐻 𝑛 − 𝑉6 )89::
;<=
>
?<@

23
LAB OVERVIEW

24
LAB OVERVIEW• Build an end-to-end deep learning system to help diagnose heart
disease
• Dataset contains 500 training studies• Each study averages 10 unique SAX observations at various points along the
PLAX of the left ventricle• Each SAX observation of a study is the same heart
• Roughly 5000 observations in total
• Each SAX observation usually contain 30 DICOM images (“frames”) in a time sequence
• Captures an entire heartbeat (expansion and contraction)
• Pack each of the 30 image frames of an observation into a 64x64x30 tensor

25
LAB OVERVIEW• Same 64x64x30 deck of images used to predict systole and diastole
• Build a network for systole (code provided)
• Build a network for diastole (students create)
• Will use LeNet style CNN with batch normalization and dropout
• Predict a CDF value of 600 data-point
• This is a regression problem
• One predicted value for each of the 600 points in the CDF

26
LAB OVERVIEW1. Load MXNet and other libraries
2. Architect the network
3. Load the training data
4. Create loss (cost) function
5. Train the model (specify hyperparameters)
6. Save the trained model
7. Make inference using new data

27
LAB & CODE

28
LOAD MXNET
Load MXNet library using either library(mxnet) or require(mxnet)

29
LOAD TRAINING DATA
train-64x64-data.csv train-systole.csv
# of
sam
ples

30
ARCHITECT THE NETWORK
Convolution layer
Activation layer
Drop out layer
pre-process

31
CREATE LOSS FUNCTION
32
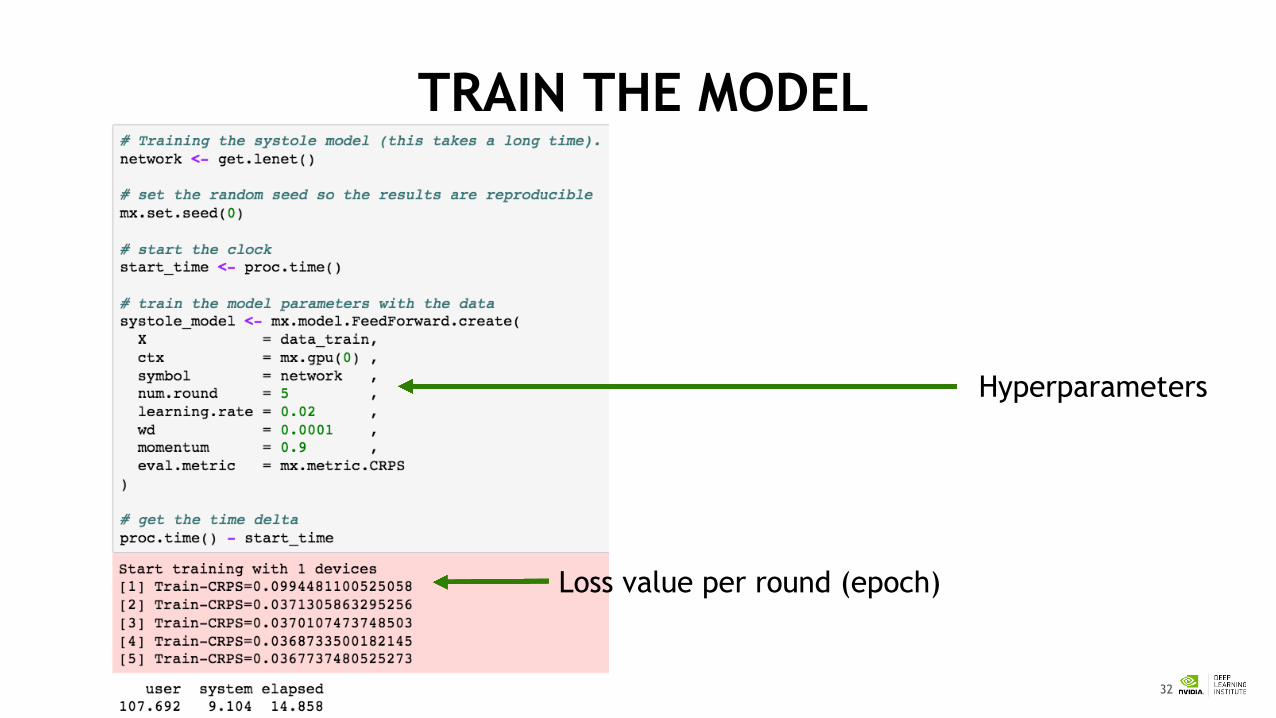
TRAIN THE MODEL
Hyperparameters
Loss value per round (epoch)

33
SAVE THE TRAINED MODEL

34
INFERENCES for SYSTOLE
Predicting systolic volume for one of the studies

35
INFERENCES for DIASTOLE
Predicting diastolic volume for one of the studies

36
Evaluation
Achieved CRPS score were 0.025 ~ 0.05 > 80th % in competition
CRPS score related to the predict resolution

37
WHAT ELSE?• Many ways to explore and improve model
• Try removing batch normalization layers [hint: modify get.lenet()]
• Try incr./decr. number of features in the convolution layer [hint: modify num.filter in get.lenet()]
• Modify the learning rate of the training phase [hint: learning.rate]
• CRPS function uses the residual squared [hint: try abs in costfun]
• Try using different activation function (i.e. other than relu)
• Try using different pooling functions (i.e. other than max)
• Try removing dropout layer or modifying the % dropout (i.e. default is 50%)

38
www.nvidia.com/dli
Thanks
![TV 드라마 비디오 스토리 분석 딥러닝 기술 · 2017년 1월 17 tv 드라마 비디오 스토리 분석 딥러닝 기술 17 생성 대립넷 )[10]이다. gan은 생성](https://static.fdocuments.net/doc/165x107/5d678f3188c9931a568bb0d4/tv-2017-1-17-tv.jpg)


![이준열연구소장 공학박사 - KOSMIAC-4].pdf · 검증된빅데이터분석및 딥러닝플랫폼활용 다양한기계학습/딥러닝 분석모델개발 대표제조업에적용가능한](https://static.fdocuments.net/doc/165x107/5e3a2d8700965c4eea253576/eoe-ee-c-4pdf-eeoeeeee-eeeoeeoe.jpg)