RTAVIS Annual Report 2008 Summary ENG - Amazon S3s3.amazonaws.com/zanran_storage/ · Cambodia Road...
20
Annual Report Annual Report Cambodia Road Crash and Victim Information System Developed by: Ministry of Interior Ministry of Health Ministry of Public Works Handicap International Belgium and Transport Notice: This report may be freely reviewed, abstracted, reproduced or translated in part or in whole, but not for the purposes of sale. Website: www.roadsafetycambodia.info © HIB
Transcript of RTAVIS Annual Report 2008 Summary ENG - Amazon S3s3.amazonaws.com/zanran_storage/ · Cambodia Road...

AnnualReportAnnualReport
Cambodia Road Crash and Victim Information System
Developed by:
Ministry of Interior Ministry of Health Ministry of Public Works Handicap International Belgiumand Transport
Notice: This report may be freely reviewed, abstracted, reproduced or translated in part or in whole, but not for the purposes of sale.
Website: www.roadsafetycambodia.info
© HIB
Cambodia Road Crash and Victim Information System Annual Report 2008-Summary
2
Table of Contents
List of Figures ......................................................................................................................................2 I. Introduction .......................................................................................................................................3 II. Executive Summary.........................................................................................................................4
Key figures ....................................................................................................................................4 Recommendations ........................................................................................................................8
III. Data Source ...................................................................................................................................11 IV. Evolution of data ..........................................................................................................................12 V. 2008 data analysis .........................................................................................................................15 Contacts .............................................................................................................................................19
List of Figures
Figure 1: RCVIS data collection flow...................................................................................................................... 3 Figure 2: Percentage of casualties reported to RCVIS – 2008 ............................................................................ 11 Figure 3: Evolution of road crashes and casualties in Cambodia, 1998 – 2008 (base 100 = 1998).................... 12 Figure 4: Fatality rates in Cambodia 1998 – 2008 and its target for 2010 and 2020 ........................................... 12 Figure 5: The evolution of the numbers of fatalities by month, 2006 – 2008 ....................................................... 13 Figure 6: The evolution of the numbers of fatalities by main holidays, 2006–2008 ............................................. 13 Figure 7: The evolution of the numbers of fatalities in Phnom Penh, 2006–2008 ............................................... 14 Figure 8: The numbers of fatalities by districts in Phnom Penh, 2006–2008....................................................... 14 Figure 9: Fatality rates – comparisons between selected countries in Asian – 2008 .......................................... 15 Figure 10: Number of fatalities on main national roads network, 2006–2008...................................................... 15 Figure 11: Percentage of population and fatalities – 2008................................................................................... 16 Figure 12: Breakdown of casualties by severity of injury, 2006–2008 ................................................................. 16 Figure 13: Breakdown of fatalities by age category, 2006–2008 ......................................................................... 17 Figure 14: Percentage of casualties by cause of crash – differences between age categories – 2008 .............. 17 Figure 15: Percentage of fatalities and casualties by occupation – 2008 ............................................................ 18 Figure 16: Number of road crash fatalities by type of road users and severity of injury, 2006–2008 .................. 18

Cambodia Road Crash and Victim Information System Annual Report 2008-Summary
3
I. Introduction
The Road Crash and Victim Information System (RCVIS) has been progressively developed since March 2004 by the Ministry of Public Works and Transport, the Ministry of Interior and the Ministry of Health, with the technical support of Handicap International Belgium (HIB). RCVIS is developed in the framework of Action 2 (Crash Data Systems) of the National Road Safety Action Plan of the Royal Government of Cambodia. The objective of the Road Crash and Victim Information System (RCVIS) is to provide government and development stakeholders in Cambodia with accurate, continuous and comprehensive information on road crashes and victims for the purposes of increased understanding of the current road safety situation, planning appropriate responses and policy, and evaluating impact of current and future initiatives. RCVIS collects, centralizes, analyses and disseminates information provided by three different sources:
- Traffic police. - Public health facilities; - Private clinics;
Figure 1: RCVIS data collection flow
This report analyses the information collected by RCVIS for the year 2008. It is a synthesis of all the monthly reports that were published throughout 2008. The previous annual reports (2004, 2005, 2006 and 2007), as well as all monthly reports and other information related to road safety, can be found on the following websites: www.roadsafetycambodia.info. By the end of 2006, RCVIS, through the traffic police and health facilities, collected crash data from all 24 Cambodian provinces/cities1. All trainings in the RCVIS data collection forms were completed for traffic police officers in 2005, and for hospital and private clinic staff in mid-2006. . In 2007, to identify road crash blackspots more precisely and to understand better the nature of crashes, Handicap International Belgium provided 215 GPS devices and training on their use to traffic police along main national roads to identify crash locations.
1 Although they have received training on data collection, health facilities from Koh Kong, Kratie, Pursat, and Ratanak Kiri did not report to RCVIS in 2008.
Cambodia Road Crash and Victim Information System Annual Report 2008-Summary
4
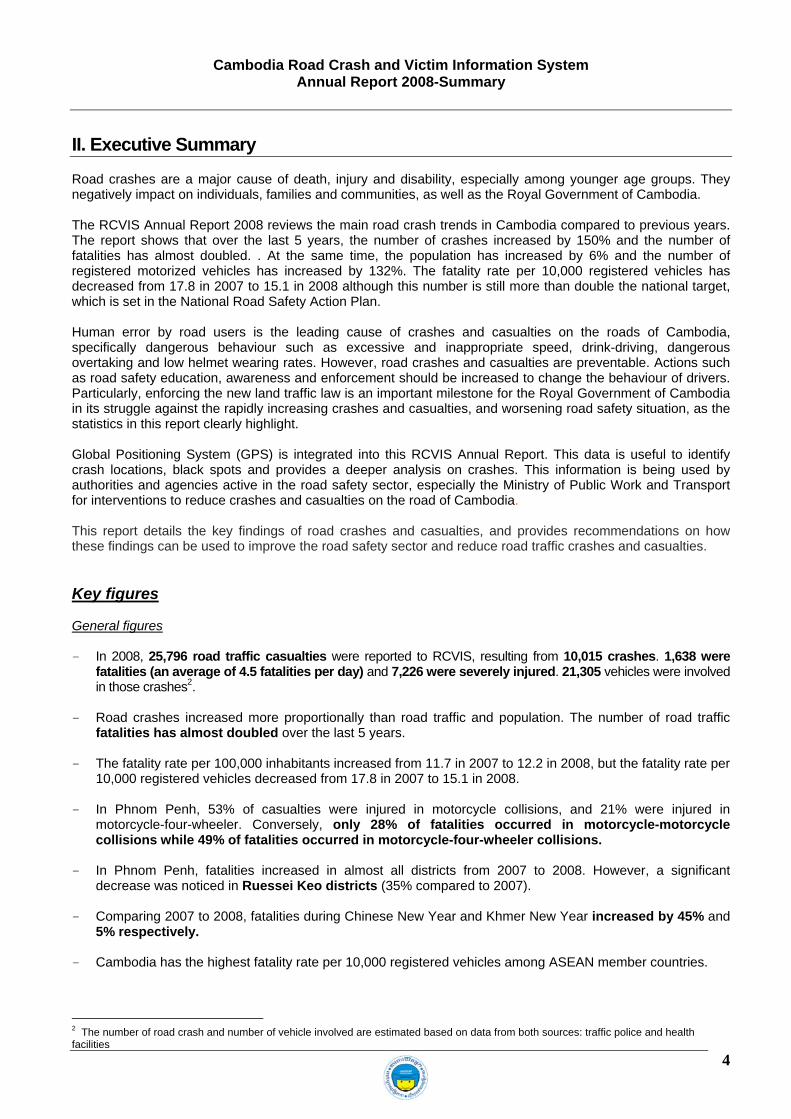
II. Executive Summary
Road crashes are a major cause of death, injury and disability, especially among younger age groups. They negatively impact on individuals, families and communities, as well as the Royal Government of Cambodia. The RCVIS Annual Report 2008 reviews the main road crash trends in Cambodia compared to previous years. The report shows that over the last 5 years, the number of crashes increased by 150% and the number of fatalities has almost doubled. . At the same time, the population has increased by 6% and the number of registered motorized vehicles has increased by 132%. The fatality rate per 10,000 registered vehicles has decreased from 17.8 in 2007 to 15.1 in 2008 although this number is still more than double the national target, which is set in the National Road Safety Action Plan. Human error by road users is the leading cause of crashes and casualties on the roads of Cambodia, specifically dangerous behaviour such as excessive and inappropriate speed, drink-driving, dangerous overtaking and low helmet wearing rates. However, road crashes and casualties are preventable. Actions such as road safety education, awareness and enforcement should be increased to change the behaviour of drivers. Particularly, enforcing the new land traffic law is an important milestone for the Royal Government of Cambodia in its struggle against the rapidly increasing crashes and casualties, and worsening road safety situation, as the statistics in this report clearly highlight. Global Positioning System (GPS) is integrated into this RCVIS Annual Report. This data is useful to identify crash locations, black spots and provides a deeper analysis on crashes. This information is being used by authorities and agencies active in the road safety sector, especially the Ministry of Public Work and Transport for interventions to reduce crashes and casualties on the road of Cambodia. This report details the key findings of road crashes and casualties, and provides recommendations on how these findings can be used to improve the road safety sector and reduce road traffic crashes and casualties. Key figures General figures - In 2008, 25,796 road traffic casualties were reported to RCVIS, resulting from 10,015 crashes. 1,638 were
fatalities (an average of 4.5 fatalities per day) and 7,226 were severely injured. 21,305 vehicles were involved in those crashes2.
- Road crashes increased more proportionally than road traffic and population. The number of road traffic
fatalities has almost doubled over the last 5 years. - The fatality rate per 100,000 inhabitants increased from 11.7 in 2007 to 12.2 in 2008, but the fatality rate per
10,000 registered vehicles decreased from 17.8 in 2007 to 15.1 in 2008. - In Phnom Penh, 53% of casualties were injured in motorcycle collisions, and 21% were injured in
motorcycle-four-wheeler. Conversely, only 28% of fatalities occurred in motorcycle-motorcycle collisions while 49% of fatalities occurred in motorcycle-four-wheeler collisions.
- In Phnom Penh, fatalities increased in almost all districts from 2007 to 2008. However, a significant
decrease was noticed in Ruessei Keo districts (35% compared to 2007). - Comparing 2007 to 2008, fatalities during Chinese New Year and Khmer New Year increased by 45% and
5% respectively. - Cambodia has the highest fatality rate per 10,000 registered vehicles among ASEAN member countries.
2 The number of road crash and number of vehicle involved are estimated based on data from both sources: traffic police and health facilities

Cambodia Road Crash and Victim Information System Annual Report 2008-Summary
5
- The fatality rate of two-wheelers per 10,000 registered two-wheelers decreased from 14.7 in 2007 to 12.6 in 2008.
- Compared to 2007, the number of fatalities on the Asian highway network increased (24% on NR4, 6% on
NR5), except on national road 6A and 7 which decreased by 34% and 18% respectively. - 47% of crashes were due to speeding and another 14% to alcohol abuse. Conversely, 51% of fatalities were due
to speeding, while another 18% were caused by alcohol abuse. - Motorcycles constituted the highest road user category, followed by pedestrians. - The majority of crashes occurred between 7 pm and 8 pm. Age of casualties - The average casualty age was 28. - People aged between 20 and 29 years old represented the highest percentage of fatalities and they have
significantly increased from year to year. - People aged between 25-29 years old accounted for 23% of fatalities although they represent only 9% of
the population. - The number of casualties aged more than 55 years old increased by 12% from 2007 to 2008. Among
casualties from this age group, 47% were motorcycle riders, 27% were pedestrian and 14% were bicycle riders - The proportion of young adults (age 20 to 29) affected by crashes was greater in Phnom Penh than in the
provinces (50% compared to 42%). Gender of casualties - Males accounted for 73% of casualties, although they accounted for 49% of the population. - On average, the male fatality rate per 100,000 inhabitants was almost 4 times higher than the female fatality rate
(23.2 compared to 5.6). - This over-representation of male casualties was important as most were of working age. - Males were more vulnerable as drivers, whereas females were more at risk as passengers.
Occupation of casualties - The economically active part of the population (students, workers and farmers) was the most affected by
road crashes. - Farmers represented the highest percentage, constituting the largest group of fatalities and casualties (30% of
fatalities, 25% of casualties). - 67% of casualties aged between 0 and 14 years old were students, followed by children (29%). Type of road user - Motorcycle users accounted for the largest majority of casualties and fatalities (77% and 68% respectively). - Children, 9 years old and under, were most at risk as pedestrians and passengers. - The percentage of motorcycle fatalities was higher in Phnom Penh than in the rest of the country and was much
higher among the 20 and 29 year old age group. - Children pedestrian fatalities aged between 0 and 14 years old decreased by 13% from 2007 to 2008. However,
30% of all pedestrian fatalities were children aged between 0 and 14 years old. Transfer to hospital - Only 27% of total casualties were transferred to the hospital or private clinic by ambulance. However,
more than 65% of fatalities and 50% of serious injuries were transported by Ambulance/samu. They played a bigger role than private transportation among fatalities and serious injuries.
- 40% of serious casualties arrived at hospital more than 2 hours after the crash. - 48% of casualties arrived at the hospital within a respectable 10 and 30 minutes after the crash in Phnom Penh,
compared to only 28% in the rest of the country.

Cambodia Road Crash and Victim Information System Annual Report 2008-Summary
6
Severity of injuries - 4% of casualties died immediately at the scene of the crash, 2% died at the hospital. - 28% of casualties were severely injured (requiring surgery or admission to intensive care). - 45% of casualties with serious injuries were transferred to a hospital by an ambulance. Nature of injuries - Head trauma accounted for 86% of motorcycle fatalities. - 27% of casualties suffered upper/lower wound/cuts and 18% suffered from upper/lower fracture accounts. - A higher percentage of head trauma resulting from motorcycle accidents was noticed in Phnom Penh
compared to the provinces (85% compare to 75%). - 46% of motorcycle casualties who suffered from head trauma were aged between 20 and 29 years old. Helmet wearing - 44% of motorcycle riders suffered from head trauma. - Number of motorcycle casualties wearing helmet has increased fourfold times in Phnom Penh from 2006 to
2008. Seatbelt Use - Only 14% of four-wheel vehicle drivers who were injured in a crash in 2008 wore a seatbelt at the time of
the crash. Among them, 82% were car drivers. Severity of crash - 50% of all road crashes resulted in serious injuries, followed by slight injuries (50%) and fatalities at 23%. - The Percentage of fatal crashes occurring at night (30%) was much higher than day time (20%). Day and month of crashes - A higher percentage of crashes were noticed during weekends (Saturday and Sunday). The highest number of
fatalities occurred on Saturdays. - Over the first four months of 2008, the number of crashes was noticeably higher than the remaining 8 months.
The most crashes occurred during April. Time of crash - The largest number of crashes occurred between 5 pm and 6 pm during week days, and between 7 pm and 8 pm
during the weekend. - In total, a higher proportion fatal crashes at night were noticed in Phnom Penh (60%) compared to the rest of the
country (35%). Causes of crash - Human error was responsible for 98% of all crashes. - More than 50% of fatalities were due to speeding, while another 18% were caused by alcohol abuse. - Crashes resulting from not respecting the right of way and dangerous overtaking occurred more during the day
time than night time, but crashes involving alcohol abuse were more of a problem during the night time than daytime.
Hit and run crashes - In 2008, hit and run crashes represented 23% of total crashes. Among those crashes, 39% were fatal crash, 43%
were serious crashes and 18% were slight crashes.
Cambodia Road Crash and Victim Information System Annual Report 2008-Summary
7
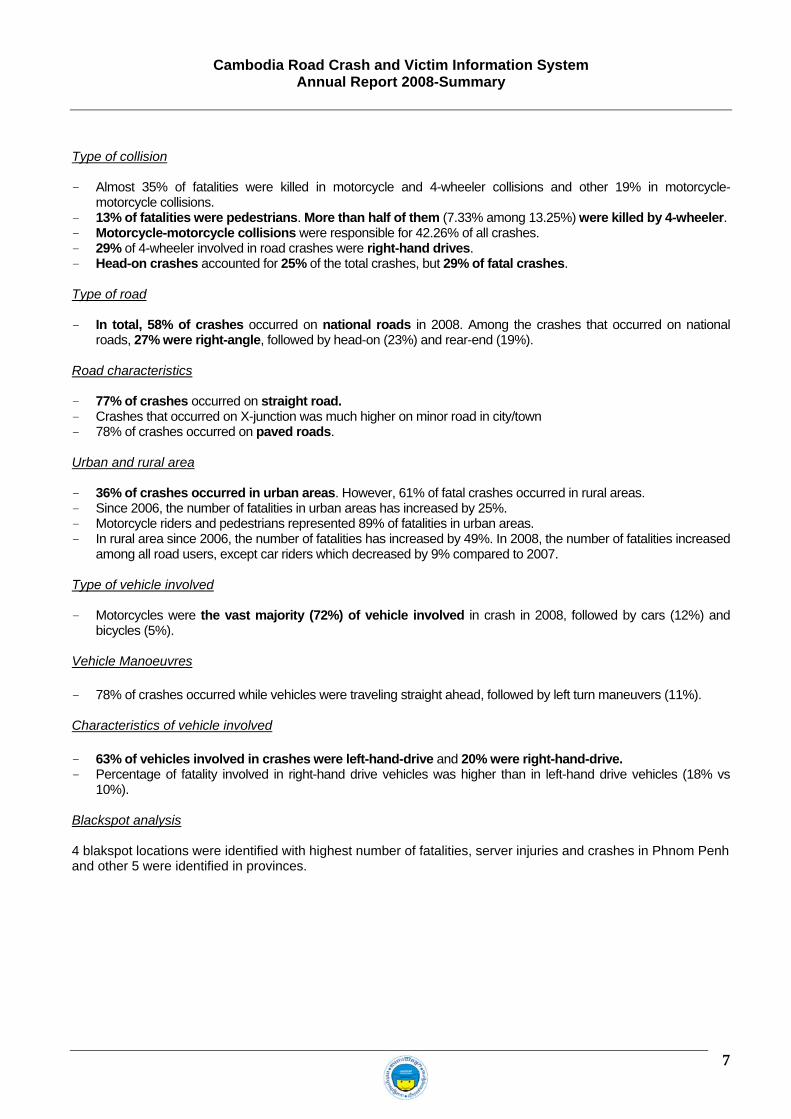
Type of collision - Almost 35% of fatalities were killed in motorcycle and 4-wheeler collisions and other 19% in motorcycle-
motorcycle collisions. - 13% of fatalities were pedestrians. More than half of them (7.33% among 13.25%) were killed by 4-wheeler. - Motorcycle-motorcycle collisions were responsible for 42.26% of all crashes. - 29% of 4-wheeler involved in road crashes were right-hand drives. - Head-on crashes accounted for 25% of the total crashes, but 29% of fatal crashes. Type of road - In total, 58% of crashes occurred on national roads in 2008. Among the crashes that occurred on national
roads, 27% were right-angle, followed by head-on (23%) and rear-end (19%). Road characteristics - 77% of crashes occurred on straight road. - Crashes that occurred on X-junction was much higher on minor road in city/town - 78% of crashes occurred on paved roads. Urban and rural area - 36% of crashes occurred in urban areas. However, 61% of fatal crashes occurred in rural areas. - Since 2006, the number of fatalities in urban areas has increased by 25%. - Motorcycle riders and pedestrians represented 89% of fatalities in urban areas. - In rural area since 2006, the number of fatalities has increased by 49%. In 2008, the number of fatalities increased
among all road users, except car riders which decreased by 9% compared to 2007. Type of vehicle involved - Motorcycles were the vast majority (72%) of vehicle involved in crash in 2008, followed by cars (12%) and
bicycles (5%). Vehicle Manoeuvres - 78% of crashes occurred while vehicles were traveling straight ahead, followed by left turn maneuvers (11%). Characteristics of vehicle involved - 63% of vehicles involved in crashes were left-hand-drive and 20% were right-hand-drive. - Percentage of fatality involved in right-hand drive vehicles was higher than in left-hand drive vehicles (18% vs
10%). Blackspot analysis 4 blakspot locations were identified with highest number of fatalities, server injuries and crashes in Phnom Penh and other 5 were identified in provinces.
Cambodia Road Crash and Victim Information System Annual Report 2008-Summary
8
Recommendations This year, for the first time, the Road Crash Victim and Information System will present its recommendations following the safe systems approach. This system is promoted by the World Health Organization as the most comprehensive way to deal with road safety and it is based on the understanding that the human body is vulnerable and that the risk of serious injury increases the greater the impact of the crash. Therefore, it involves identifying the potential areas of intervention based on the interactions between the road user, the vehicle and the road environment to reduce crashes, and the severity of injuries. To adopt a systems approach necessitates the involvement and collaboration of a number of sectors – transport, police, health, civil society, and special interest groups. Fundamentally, the implementation of this approach requires the collection of accurate data on the magnitude of road traffic crashes and their risk factors3. Priority recommendations for the Cambodian road safety sector are based on the statistics presented in this report and situational analysis of road safety in the country. They are presented below: Safer Road Users 1) Enforce speeding, drink-driving and helmet laws The top three causes of road traffic crashes, fatalities and injuries in Cambodia are caused by speeding, drink-driving and non-helmet wearing. It is highly recommended that traffic law enforcement prioritize and focus resources on these three risky behaviors, both in the urban areas and along National Roads. The traffic police recent actions to enforce helmet wearing nationally, and speeding and drink-driving in Phnom Penh, are encouraging signs. However, efforts must be sustained, consistent and expanded in order to deter the public from these dangerous behaviors on the road. A few specific recommendations are:
• Revise the traffic law to include mandatory helmet wearing for passengers and increase the existing fine
• Set up checkpoints at nighttime with particular focus on drinking and driving • Set up speed checkpoints on black spot locations, particularly those characterized high frequency of
speed-related crashes. • Regular trainings and appropriate equipment should be provided to traffic police to effectively
enforce these laws • Awareness and education on these three risk factors should be expanded, and directly linked to the
enforcement actions of the police. 2) Targeted Awareness Campaigns and Education Targeted road safety campaigns are more effective than campaigns that target the general population. Limited resources could be better used by focusing efforts on those groups or events exhibiting the highest frequency of crashes and casualties. Two main priorities are recommended:
• Young motorists: the most at-risk group on the roads of Cambodia is young people aged 15-29 accounting for 46% of all road traffic fatalities. Campaigns should target this vulnerable group, tailoring the messages to be relevant to their daily lives. Increased research into their attitudes and behaviors while driving would greatly assist the efforts in developing appropriate campaigns for this age group.
• Long national holidays: Crashes and casualties spike during national holidays in particular Khmer New Year, Chinese New Year and the Water Festival. It is recommended that government authorities and other organizations active in road safety focus awareness campaigns (and enforcement measures) on risky behavior, particularly speeding, drink-driving, helmet wearing, and overloading which are common during the holiday travel period.
3) Improve Driver Training Schools Driving schools are the training grounds for the future drivers of Cambodia. Therefore, it is essential that safe driving behavior is instilled in these learners. RCVIS recommends that a rigorous evaluation of the driving schools is conducted by the Department of Land Transport or an independent entity to assess the extent the trainers are teaching the correct road rules. Furthermore, the driver training curriculum should stress the key
3 World Health Organization. Global Status Report on Road Safety. 2009.
Cambodia Road Crash and Victim Information System Annual Report 2008-Summary
9
risky behaviors exhibited on the roads of Cambodia as a means of educating the new drivers on the importance of safe driving. Safer Road Environments 4) Black spot treatment in Phnom Penh and along National Roads RCVIS is able to locate, through its GPS data, black spot locations and zones with frequent crashes in Phnom Penh and along the National Road network. These locations are clearly highlighted within this report. It is recommended that this data is utilized by the relevant national and provincial transport and public work authorities to investigate these hazardous spots or zones and fund road engineering measures to improve their safety and reduce crashes. Educational campaigns informing the public of the location of these black spots should be adopted by the National Road Safety Committee and road safety organizations. Additionally, it is further recommended that the traffic police should target black spot locations by setting up checkpoints and strictly enforcing dangerous driving behavior. 5) Creating safer environments along roads for children and pedestrians The roads of Cambodian can be a dangerous place for pedestrians and young children. Pedestrians account for 13% of all fatalities, and 30% of those were children aged between 0 and 14 years old. It is recommended that specific simple measures are taken immediately to protect pedestrians and children such as:
Safe School Zones: Promote the safety of children when entering and exiting schools through the creation of safe school zones. These measures could include enforcing appropriate speed limits in those zones, and ensuring school cross-walks are respected and clearly-marked;
Pedestrian Infrastructure and access: Municipal transport and public work authorities, in particular, should ensure that proper facilities exist for pedestrians throughout urban areas which separate them from motorized traffic. There should be proper roadside facilities including footways on urban roads, footpaths on rural highways, and adequate crossing facilities (pedestrian refuges, medians, raised pedestrian crossings).
In both actions, the traffic police must play a role in enforcing violations. The NRSC and road safety NGOs can play the role of educating the public on the importance of respecting vulnerable road users. Safer Vehicles 6) Phase-out of right-hand drive vehicles 20% of all crashes involved right-hand drive vehicle. This type of vehicle is clearly a risk factor. Therefore, RCVIS recommends that the Royal Government of Cambodia increase its efforts at restricting the import of right-hand drive vehicles, and to encourage all citizens to who own this type of vehicles to convert them into left-hand drive through the vehicle inspection process under the Department of Land Transport. 7) Include a seatbelt check requirement in the vehicle inspection process RCVIS data shows conclusively that non-seatbelt wearing among Cambodian drivers is a risky behavior. 85% of car drivers and 93% of light and heavy truck drivers who suffered injuries in a crash were not wearing seatbelts. While education of drivers on the importance of wearing seatbelts and enforcement is critical, the vehicle inspection requirement at the Department of Land Transport should include a check on the presence of a seatbelt for the driver at a minimum, and preferably all seats. Like the other inspection requirement, the vehicle should not be able to pass the test if the seatbelt is not present. 8) Develop a motorcycle helmet standard Motorcycles constitute 75% of the motorized vehicle fleet in Cambodia. 86% of all fatal motorcycle crashes involving motorcycles were as a result of head injuries. The enforcement of the motorcycle helmet law on January 1st 2009 was a positive step towards raising the helmet-wearing rate and reducing head injuries. However, the Government must also ensure that a national motorcycle helmet standard is created to ensure that all helmets sold provide a minimum level of protection to all motorcycle riders. It is recommended that a motorcycle helmet standard is developed suitable for the Cambodian context under the leadership of the National Road Safety Committee and the Cambodian Institute of Standards. Safe Systems Management

Cambodia Road Crash and Victim Information System Annual Report 2008-Summary
10
9) Management, Coordination and Funding The National Road Safety Committee is the body tasked with overall management and coordination of road safety in Cambodia. However, this body lacks the necessary resources and skills to make a significant impact on reducing accidents, fatalities and injuries on the roads of Cambodia. To ensure sustainability of road safety action and that the issue becomes a greater priority for the Royal Government of Cambodia, the government and donors should prioritize and increase funding for the NRSC. Opportunities for the Committee’s decision-makers and staff should also be created to improve their management capacity of the road safety sector, as well as strengthening their ability to coordinate the diverse road safety actors and interventions. 10) Research To date, there is very little research on road safety being conducted in Cambodia. Yet, road safety research is critical in improving the knowledge and understanding about factors that contribute to road crashes. A good quality body of research can provide the framework against which effective policies can be developed, can help to securing funds and determine appropriate strategies and activities. Recommended areas research could include:
• Cost of crashes on household incomes and the national economy • Reasons for dangerous driver behavior in the context of Cambodia • The situation and risks posed for vulnerable road users in Cambodia (pedestrians, cyclists, children and
people’s with disabilities) To ensure that relevant research is conducted for the Cambodian context, focus should also be placed on developing local researchers with capabilities in road safety-related research. 11) Emergency Medical Services This annual report clearly highlights that over 40% of road traffic crash victims, particularly in rural areas, take over two hours to reach medical care. During this time, the severity of the injury is likely to worsen. However, transport to medical facilities is only one component of an efficient emergency medical response system. First response and first aid at the scene of the crash, transport services to the medical care, ensuring that the trauma centers and staff have adequate capacity to treat the victims, as well as the mechanisms to manage the system are all inadequate and result in road crash victims not receiving the emergency care required. This report therefore recommends that this important, but largely forgotten, component of reducing road traffic injuries is given more attention by the Royal Government of Cambodia, donors and road safety stakeholders through the development of an Emergency Medical Services strategy and action plan, coupled with a fundraising strategy, to begin addressing this critical gap in the road safety sector.
Cambodia Road Crash and Victim Information System Annual Report 2008-Summary
11
III. Data Source
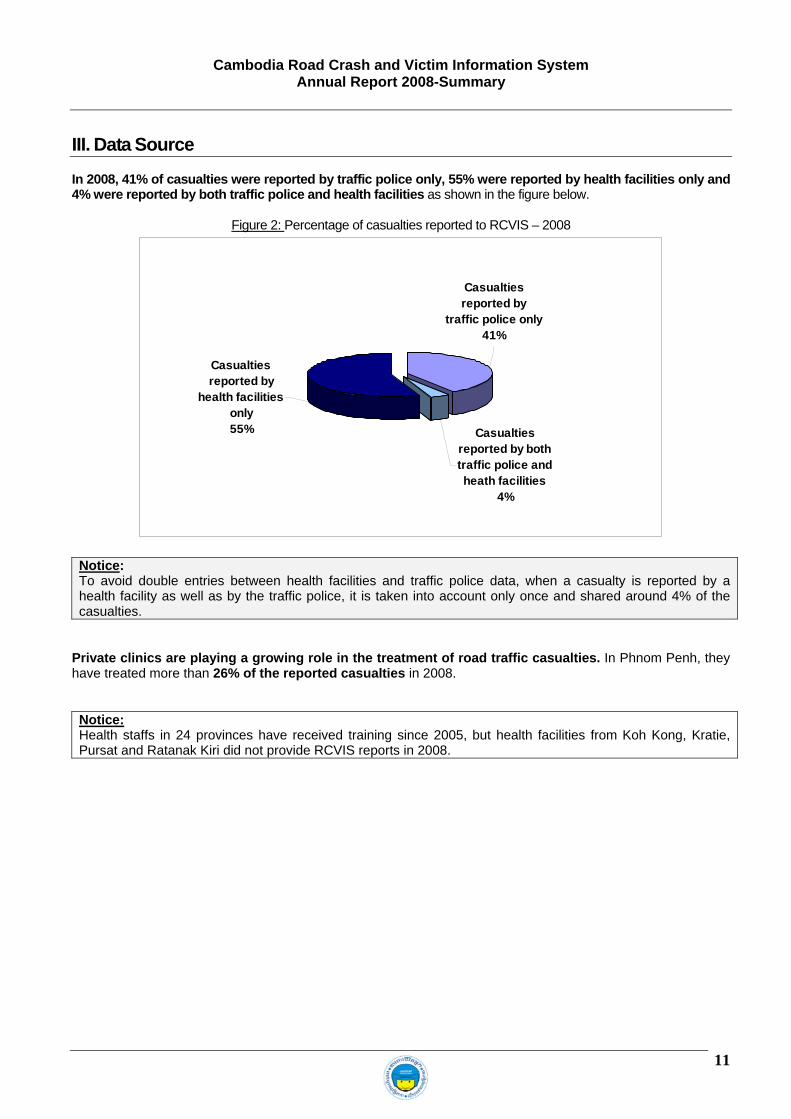
In 2008, 41% of casualties were reported by traffic police only, 55% were reported by health facilities only and 4% were reported by both traffic police and health facilities as shown in the figure below.
Figure 2: Percentage of casualties reported to RCVIS – 2008
Casualties reported by
health facilities only55% Casualties
reported by both traffic police and heath facilities
4%
Casualties reported by
traffic police only41%
Notice: To avoid double entries between health facilities and traffic police data, when a casualty is reported by a health facility as well as by the traffic police, it is taken into account only once and shared around 4% of the casualties.
Private clinics are playing a growing role in the treatment of road traffic casualties. In Phnom Penh, they have treated more than 26% of the reported casualties in 2008. Notice: Health staffs in 24 provinces have received training since 2005, but health facilities from Koh Kong, Kratie, Pursat and Ratanak Kiri did not provide RCVIS reports in 2008.

Cambodia Road Crash and Victim Information System Annual Report 2008-Summary
12
IV. Evolution of data
Road crashes, casualties and fatalities continue to increase more proportionally than road traffic and population. Over the last 5 years, the number of crashes increased by 135% and the number of fatalities has almost doubled. At the same time, the population has increased by 6% and the number of registered motorized vehicles has increased by 123%.
Figure 3: Evolution of road crashes and casualties in Cambodia4, 1998 – 2008 (base 100 = 1998)
1998 1999 2000 2001 2002 2003 2004 2005 2006 2007 2008
Population Registered Vehicles Number of crashes Fatalities
Based on the factors above, the fatality rate per 100,000 inhabitants has increased from 11.7 in 2007 to 12.2 in 2008, but the fatality rate per 10,000 registered vehicles decreased from 17.8 in 2007 to 15.1 in 2008 although this number is still more than double the target for 2010.
Figure 4: Fatality rates in Cambodia 1998 – 2008 and its target for 2010 and 20205
4 Sources: Population: General Population Census of Cambodia 2008, Provisional Population Totals, National Institute of Statistics, Ministry of
Planning, August 2008. Traffic and crash figures: from 1998 to 2005 based on traffic police only and 2006 to 2008 based on RCVIS.
5 Royal Government of Cambodia National Road Safety Action Plan 2006-2010
6.4
21.5
15.1
12.211.710.0
7.18.36.74.43.8
3.41.70.9
17.8
12.7
18.4
2.0
7.0
18.115.7
12.412.0
3.7
0
5
10
15
20
25
1998
1999
2000
2001
2002
2003
2004
2005
2006
2007
2008
Targ
et fo
r20
10
Targ
et fo
r20
20
Number of fatalities per 100,000 inhabitants Number of fatalities per 10,000 registered vehicles
Cambodia Road Crash and Victim Information System Annual Report 2008-Summary
13
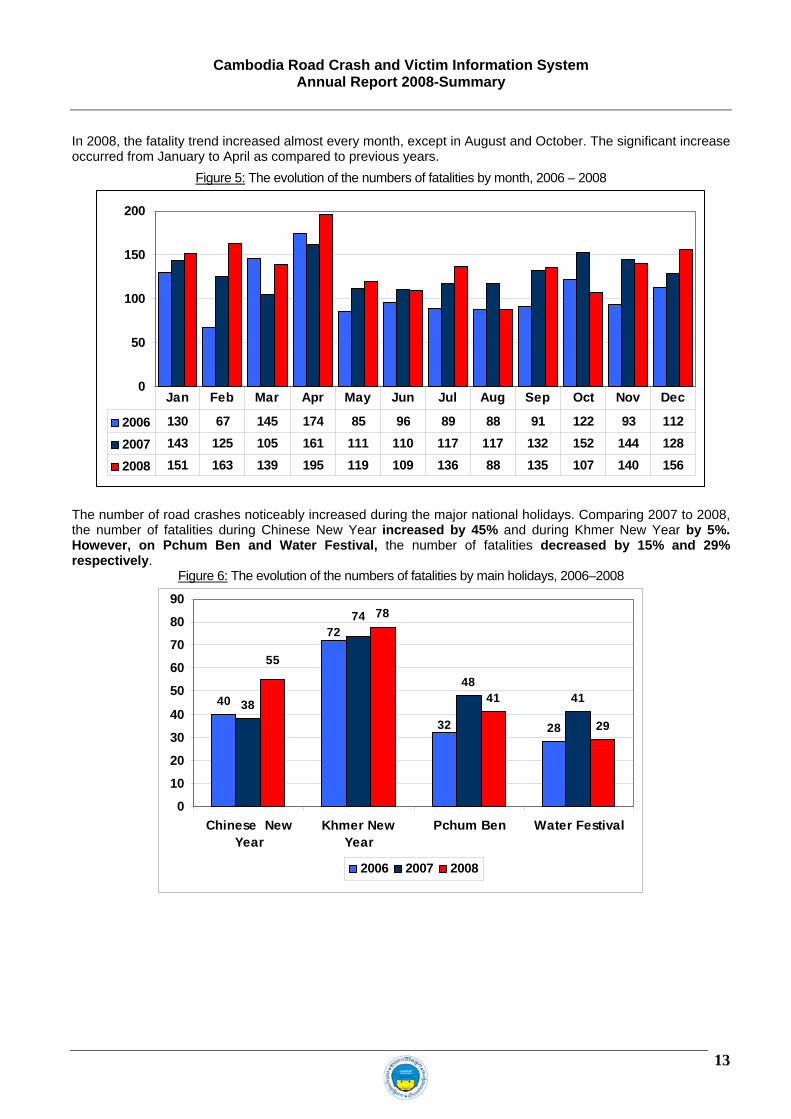
In 2008, the fatality trend increased almost every month, except in August and October. The significant increase occurred from January to April as compared to previous years.
Figure 5: The evolution of the numbers of fatalities by month, 2006 – 2008
0
50
100
150
200
2006 130 67 145 174 85 96 89 88 91 122 93 112
2007 143 125 105 161 111 110 117 117 132 152 144 128
2008 151 163 139 195 119 109 136 88 135 107 140 156
Jan Feb Mar Apr May Jun Jul Aug Sep Oct Nov Dec
The number of road crashes noticeably increased during the major national holidays. Comparing 2007 to 2008, the number of fatalities during Chinese New Year increased by 45% and during Khmer New Year by 5%. However, on Pchum Ben and Water Festival, the number of fatalities decreased by 15% and 29% respectively.
Figure 6: The evolution of the numbers of fatalities by main holidays, 2006–2008
40
28
38
4841
78
41
2932
7274
55
0
10
20
30
40
50
60
70
80
90
Chinese NewYear
Khmer NewYear
Pchum Ben Water Festival
2006 2007 2008

Cambodia Road Crash and Victim Information System Annual Report 2008-Summary
14
In Phnom Penh, the total number of fatalities remained stable from 2007 to 2008. However, the graph below depicts that the number of fatalities has significantly increased in February, April, June and November 2008 as compared to 2006 and 2007.
Figure 7: The evolution of the numbers of fatalities in Phnom Penh, 2006–2008
0
5
10
15
20
25
30
35
40
2006 18 12 22 17 15 19 18 13 13 19 9 19
2007 24 20 24 20 30 22 32 27 31 29 21 18
2008 20 32 20 36 26 34 33 13 20 16 32 15
Jan Feb Mar Apr May Jun Jul Aug Sep Oct Nov Dec
In Phnom Penh, the number of fatalities increased in almost all districts from 2007 to 2008. However, a significant decrease was noticed in Ruessei Keo districts (35% compared 2008 to 2007). There was a significant increase in Chamkar Mon district (21% compare 2008 to 2007). The number of fatalities in three districts (Dangkao, Mean Chey and Ruessei Keo) was higher than the other four districts due to those districts being crossed by the main national roads.
Figure 8: The numbers of fatalities by districts in Phnom Penh, 2006–2008
18 19 20
41
61
38
28
8
33
77
30
6
24
41
81
69
27
7
93
25
46
0
10
20
30
40
50
60
70
80
90
100
Chamkar Mon Doun Penh 7 Meakkakra Toul Kork Mean Chey Dangkao Ruessei Keo
2006 2007 2008
Cambodia Road Crash and Victim Information System Annual Report 2008-Summary
15
V. 2008 data analysis
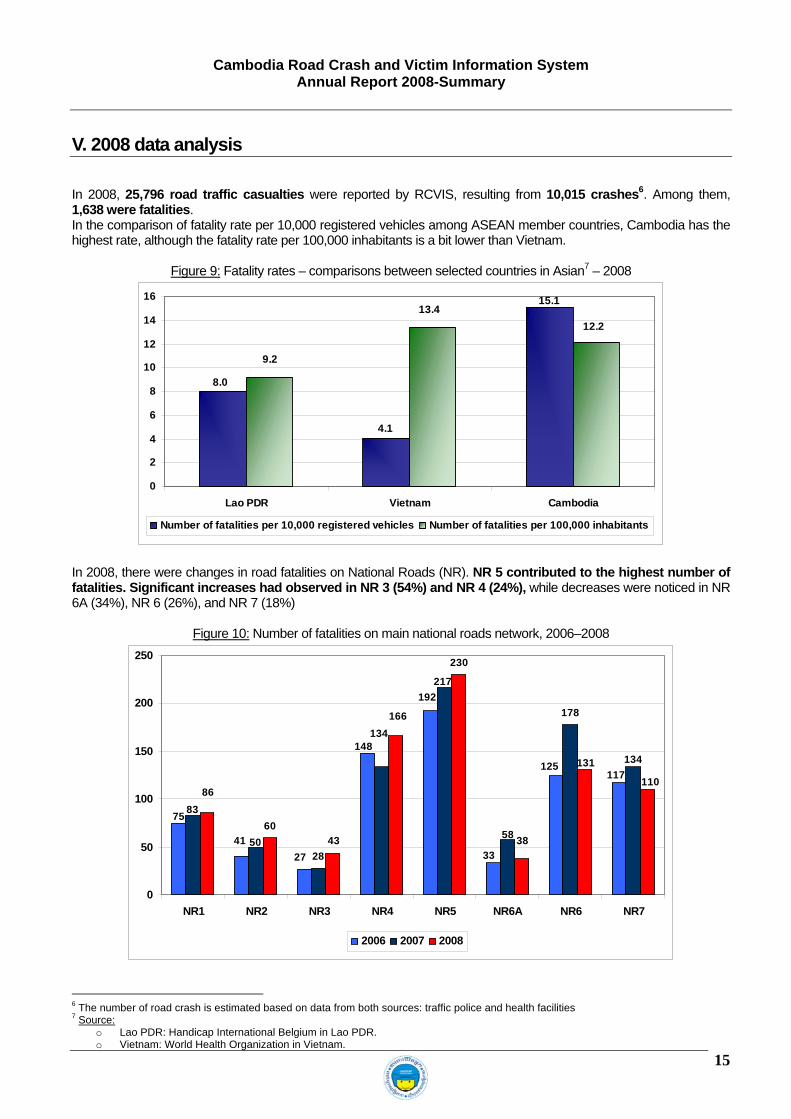
In 2008, 25,796 road traffic casualties were reported by RCVIS, resulting from 10,015 crashes6. Among them, 1,638 were fatalities. In the comparison of fatality rate per 10,000 registered vehicles among ASEAN member countries, Cambodia has the highest rate, although the fatality rate per 100,000 inhabitants is a bit lower than Vietnam.
Figure 9: Fatality rates – comparisons between selected countries in Asian7 – 2008
15.1
4.1
8.0
13.412.2
9.2
0
2
4
6
8
10
12
14
16
Lao PDR Vietnam Cambodia
Number of fatalities per 10,000 registered vehicles Number of fatalities per 100,000 inhabitants
In 2008, there were changes in road fatalities on National Roads (NR). NR 5 contributed to the highest number of fatalities. Significant increases had observed in NR 3 (54%) and NR 4 (24%), while decreases were noticed in NR 6A (34%), NR 6 (26%), and NR 7 (18%)
Figure 10: Number of fatalities on main national roads network, 2006–2008
28
178
60
230
41
117125
3327
148
192
75
134
217
5850
134
83
38
131
110
43
166
86
0
50
100
150
200
250
NR1 NR2 NR3 NR4 NR5 NR6A NR6 NR7
2006 2007 2008
6 The number of road crash is estimated based on data from both sources: traffic police and health facilities 7 Source:
o Lao PDR: Handicap International Belgium in Lao PDR. o Vietnam: World Health Organization in Vietnam.

Cambodia Road Crash and Victim Information System Annual Report 2008-Summary
16
Phnom Penh and Kandal province accounted for the highest of fatalities although they represented less than 10% of population.
Figure 11: Percentage of population8 and fatalities – 2008
0%2%4%6%8%
10%12%14%16%18%20%
Bantea
y Mea
n Chey
Battamban
g
Kampon
g Cham
Kampon
g Chhn
ang
Kampon
g Speu
Kampon
g Thom
Kampot
Kandal
Koh Kong
Kratie
Mondol K
iri
Phnom Pen
h
Preah
Vihear
Prey V
negPursa
t
Ratanak
Kiri
Siem Rea
p
Preah
Sihanou
k
Stung T
reng
Svay R
ieng
Takeo
Oddar
Meanch
ey KepPail
in
Percentage of pupulation Percentage of fatalities
In 2008, 25,796 of casualties were reported. Among them, 1,638 were fatalities and 7,226 were severely injured. Number of fatalities has increased by 6% every year, since 2006.
Figure 12: Breakdown of casualties by severity of injury, 2006–2008
Type of injuryKilled 1,292 5% 1,545 6% 1,638 6%Severe injuries 6,033 23% 7,150 26% 7,226 28%Slight injuries 17,836 68% 17,655 64% 15,985 62%Unknown 985 4% 1,053 4% 947 4%Total 26,146 100% 27,403 100% 25,796 100%
2006 2007 2008
8 Sources: RCVIS and General Population Census of Cambodia 2008, Provisional Population Totals, National Institute of Statistics, Ministry of Planning, August 2008.

Cambodia Road Crash and Victim Information System Annual Report 2008-Summary
17
- The average age of a casualty was 28 years old. - People aged between 20 and 29 years old represented the highest percentage of fatalities and they have
significantly increased from year to year. - The economically active population (20-54 years old) was the most affected representing 72% of fatalities. - Fatalities for those more than 55 years old increased by 12% from 2007 to 2008
Figure 13: Breakdown of fatalities by age category, 2006–2008
0
50
100
150
200
250
300
350
400
<5 5-9 10-14 15-19 20-24 25-29 30-34 35-39 40-44 45-49 50-54 >=55
2006 2007 2008
Human error alone was responsible for 93.60% of crashes. More than 50% of fatalities were due to speeding, while another 18% were caused by alcohol abuse. The percentages of fatalities for speed, alcohol abuse and dangerous overtaking were higher than percentages of crash, which demonstrates that a person has a higher risk of death in speed, alcohol abuse and dangerous overtaking than other kinds of human errors. Alcohol abuse was more prevalent for casualties 25-39 years.
Figure 14: Percentage of casualties by cause of crash – differences between age categories – 2008
N/AChange lane without due careOtherNot respect right of wayDangerous overtakingAlcohol abuseSpeed
Human Error
0 - 45 - 9
10 - 1415 - 19
20 - 2425 - 29
30 - 3435 - 39
40 - 4445 - 49
50 - 54>=55
Age category
0%
10%
20%
30%
40%
50%
60%
70%
80%
90%
Perc
enta
ge o
f cas
ualti
es
Cambodia Road Crash and Victim Information System Annual Report 2008-Summary
18
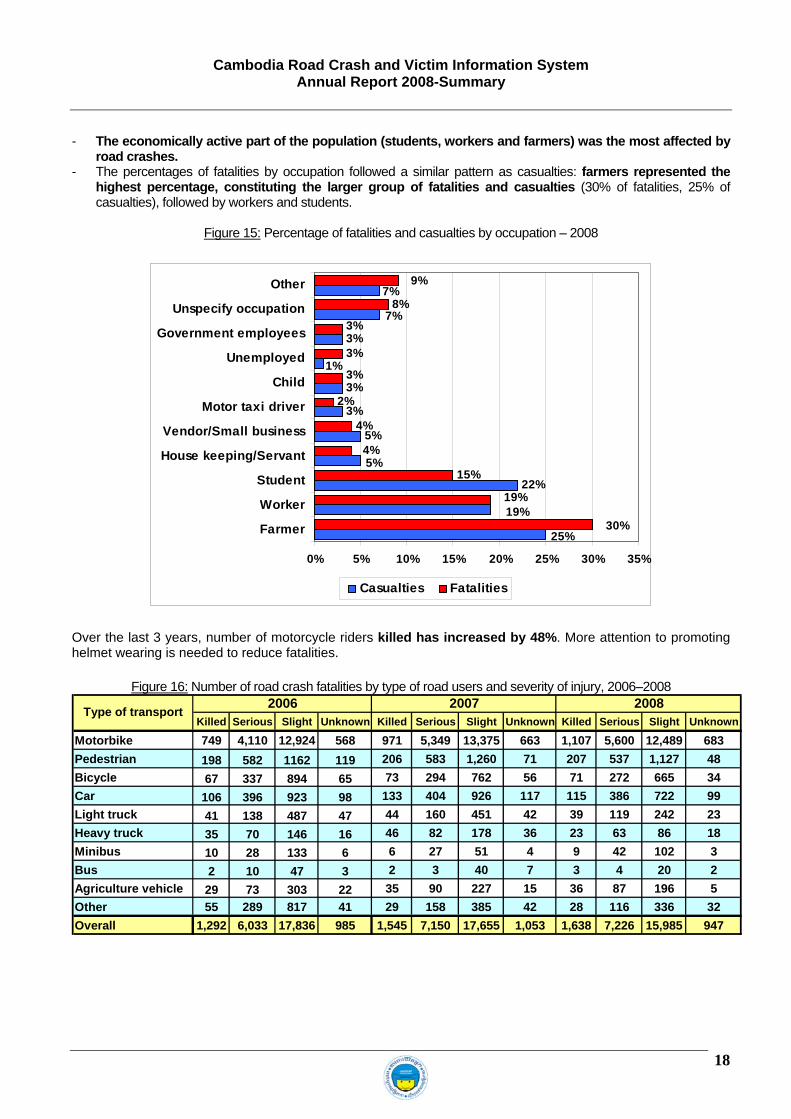
- The economically active part of the population (students, workers and farmers) was the most affected by road crashes.
- The percentages of fatalities by occupation followed a similar pattern as casualties: farmers represented the highest percentage, constituting the larger group of fatalities and casualties (30% of fatalities, 25% of casualties), followed by workers and students.
Figure 15: Percentage of fatalities and casualties by occupation – 2008
22%
5%
3%
3%
3%
15%
4%
2%
3%
8%
19%
25%
1%
7%
7%
5%
19%
30%
9%
3%
3%
4%
0% 5% 10% 15% 20% 25% 30% 35%
Farmer
Worker
Student
House keeping/Servant
Vendor/Small business
Motor taxi driver
Child
Unemployed
Government employees
Unspecify occupation
Other
Casualties Fatalities
Over the last 3 years, number of motorcycle riders killed has increased by 48%. More attention to promoting helmet wearing is needed to reduce fatalities.
Figure 16: Number of road crash fatalities by type of road users and severity of injury, 2006–2008
Killed Serious Slight Unknown Killed Serious Slight Unknown Killed Serious Slight Unknown
Motorbike 749 4,110 12,924 568 971 5,349 13,375 663 1,107 5,600 12,489 683Pedestrian 198 582 1162 119 206 583 1,260 71 207 537 1,127 48Bicycle 67 337 894 65 73 294 762 56 71 272 665 34Car 106 396 923 98 133 404 926 117 115 386 722 99Light truck 41 138 487 47 44 160 451 42 39 119 242 23Heavy truck 35 70 146 16 46 82 178 36 23 63 86 18Minibus 10 28 133 6 6 27 51 4 9 42 102 3Bus 2 10 47 3 2 3 40 7 3 4 20 2Agriculture vehicle 29 73 303 22 35 90 227 15 36 87 196 5Other 55 289 817 41 29 158 385 42 28 116 336 32Overall 1,292 6,033 17,836 985 1,545 7,150 17,655 1,053 1,638 7,226 15,985 947
Type of transport 2007 20082006

Cambodia Road Crash and Victim Information System Annual Report 2008-Summary
19
Contacts
Further analysis and additional information is available on request. Please do not hesitate to contact one of the following persons: For general road safety information and additional analysis/customized reports:
Ms. Socheata SANN Mr. Ryan DULY Road Safety Program Manager Road Safety Technical Adviser Handicap International Belgium Handicap International Belgium Mobile: 012 563 172 Mobile: 092 990 213 E mail: [email protected] E mail: [email protected] Mr. Panhavuth SEM Ms. Amra OU RCVIS Manager RCVIS Officer Handicap International Belgium Handicap International Belgium Mobile: 012 545 334 Mobile: 016 338 178 E mail: [email protected] E mail: [email protected]
For information regarding the National Road Safety Action Plan
HE. UNG Chun Hour Director General of Transports & Director of Land Transport Department Permanent Member of National Road Safety Committee
Secretary General of General Secretariat of National Road Safety Committee Ministry of Public Works and Transport Mobile: 012 818 835 Email: [email protected]
For information regarding the national traffic law enforcement
General PHOU Khon Director of Order Department General Commissariat of National Police Ministry of Interior Mobile: 012 611 456
For information regarding emergency assistance:
Dr. PRAK PISETH Raingsey Director Preventive Medicine Department Ministry of Health Mobile: 012 862 022 Email: [email protected]

Editor
RCVIS Handicap International Belgium # 18, Street 400, Phnom Penh
Kingdom of Cambodia Phone: +855 – 23 – 217 298
Email: [email protected] Website: www.roadsafetycambodia.info
Handicap International Belgium
With the support of:
European Union Belgian Cooperation World Health Organization