r.t.....lines has been resolved leading to nuclear spin values. Several asymmetric top...
63
UNIVERSITY OF SASKATCHEWAN This volume is the property of the University of Saskatchewan, and the literary rights of the author and of the University must be respected. If the reader ob- tains any assistance from this volume, he must give proper credit in his own work. This Thesis by r.t .. A .•.. JfQR$XAR . has been used by the following persons, whose signatures attest their accept- ance of the above restrictions. Name and Address Date
Transcript of r.t.....lines has been resolved leading to nuclear spin values. Several asymmetric top...

UNIVERSITY OF SASKATCHEWAN
This volume is the property of the University of Saskatchewan, and the literaryrights of the author and of the University must be respected. If the reader obtains any assistance from this volume, he must give proper credit in his ownwork.This Thesis by r.t.. A.•.. JfQR$XAR .has been used by the following persons, whose signatures attest their acceptance of the above restrictions.
Name and Address Date

THE ABSOHPTION OF MICROWAVES IN GASES
A ThesisSubmitted to the
Faculty of Graduate Studiesin Partial Fulfilnlent of the Requireme:nts
for the Degree of Master of Artsin the Department of PhysicsUniversity of Saskatehewan
by
Peter Allan Forsyth
Saskatoon, SaskatchewanJune, 1947

•
The writer wishes to acknowledge his indebtedness to
Dr. J.W.T. S~inks, of the Chemistry De~artment, and Dr. L.
Katz, of the Physics De~artment, for suggesting the ~roblem
and initiating the research, as well as obtaining much of
the equipment. Both of these gentlemen have been most
generous in their assistance and advice.
The research was made possible by assistance received
I'rom the National Research Council, in the form of a grant
oovering the cost of equipment as well as salaries for both
workers during the summer months. The National Research
Council also loaned several pieces of equipment to the project.
The writer has held a National Research Council Bursary,
covering the work done during the winter months.
Many thanks are also due Mr. A.H. Cox, the Physics
Department's instrument maker, for his tireleBs assistance
and advice during the construction of the various pieces
of apparatus.
In addition, the writer wishes to express his sincere
thanks to Mr. C.C. Costain, with whom the research was under
taken as a joint project. Since there has been the closest
c0 8 operation between the workers in all phases of the project,
the partition of the research into two divisions as indicated
in the corresponding theses, has been difficult and to some
extent, arbitra~.

TABLE OF CONTENTS
IllTRODUCTIOll....................................... 1
THEORY............................................. 4Rigid Rotator.................................... 4
Vibrating Rotator................................ 9
Diatomic ~etric Top••••••••••••••••••••••••••• 11
Polyatomic Symmetric Top••••••••••••••••••••••••• 13
Polyatomic Linear Molecules•••••••••••••••••••••• 14
Polyatomic Spherical Top Molecules••••••••••••••• 15
Polyatomie ASJ1IlE1etric Top Molecules•••••••••••••• 15
Dipole Moment•••••••••••••••••••••••••••••••••••• 15
Prediction of Absorption Lines••••••••••••••••••• 16
Inversion Spectra•••••••••••••••••••••••••••••••• 19
PREVIOUS WORK IN THE FIELD••••••••••••••••••••••••• 20
APPARATUS .AND TECHNIQ,UE............................ 24
General Discu.ssion of Apparatus•••••••••••••••••• 24
Technique•••••••••••••••••••••••••••••••••••••••• 28
Sweep Circuit•••••••••••••••••••••••••••••••••••• 29
Subtraction Circuit•••••••••••••••••••••••••••••• 36
Balanced Amplifier••••••••••••••••••••••••••••••• 43
1m~TS. • • • • • • • • • • • • • • • • • • • • • • • • • • • • • • • • • • • • •• •• • •• 44
C01ICLUSIONS. • • • • • • • • • • • • • • • • • • • • • • • • • • • • • • • • • • • • • •• 48

Fig. 7.
Fig. 8.
]lig. 9.
Fig. 1.
Fig. 2.
Fig. 3.
Fig. 4.
ILLUSTRATIONS
The Rigid Rotator
Vector Diagram of the ~etrie Top
Block Diagram of the Apparatus
Wavefo~ required for frequency modulation of
the klystron
Fig. 5. Sweep Generator Circuit Diagram
Fig. 6. Sweep Generator
(a) Various waveforms
(b) Photograph of output wavefoDn
(0) Photograph of the completed unit
Subtracti.on Cireui t Diagram
Amplifier Circuit D1agrwn
Photographs of Subtraction Circuit and Amplifier
Unit
Fig.10. (a) Photographs showing pressure broadening of
the 3,3 line in the Inversion Spectrum of
JmZ(b) Lines observed in NH3 spectrum
IITRODUCTIOIf
'!'he purpose of the present research has 'been aD
attempt to diacover individual absorption lines in the
rotation spectra of some of the heavier molecules, in
pa.rtioular those lines whioh lie in the region designated.
by the wa.velength limits, 3.15 em. to 3.3 em. IDvestigation
of this portion of the electromagnetic spectrum repre8ent.
a marked departure from staniard spectroscopic procedure,
Which, for this region, is largely replaced by the applica
tion of recently developed microwave techniques.
The advantages resulting from the investigation of
molecular spectra in the microwave region over 8~ilar
investigations in the optical region, are pr~rlly 4ue to
the v.~· great increase in resolving power available.- The
rotational constants of a number of molecules have been
dete~ine4~ means of a .tu~ of the fine structure of
rotation-vibration bands nODBally observed in the iafra-red.
While such studies have yiel4ed mueh InfoDBatlon relatiDC
to molecular structurel , the resolving power available haa
limitec1 the accuracy obtained. and in the case of some
molecules has proven completely 1naaequate. A few moleoules
-A recent paper22 has reported resolutlcn of lineaseparatedby' 140 kilocycles 11'1 the 24.~OO mef&CYOle regioncorresponding to a separation of 5xlO· em.-. !hem.ll1iJnum separation between lines whiih are opticallyreS01T&ole 1s approximately .02 CJIl.· •

have been studied ~ means of pure rotation spectra
observed in the far infra-red (for example, the work
of Wright and Randall2) ana. by means of the Raman spectra;
howeTer, this work has progressed. slowly aue to the inherent
difficulties of each of the methoG.s.
On the other hand, the use of microwaves lends itself
to high resolTing power and. extreme accuracy. Measurements
of frequency in this region oan be made, oy reference to
standaris of lower frequency, with an aDsolute accuracy of
the order of ome part ina million and a much higher relati.e
accuracy. In addition, the methods used in the micrewave
region are particularly suited to the direct oDservation of
11ne profiles and hence to the stu~ of natural line w14ths,
pressure broadening and. allie4 effects. Despite the fact
tllat practically all the worle in this field. has been .d.one
in the past year and a half, much information ha.s been
obtained. For example, the hyperfine structure of rotational
lines has been resolved leading to nuclear spin values.
Several asymmetric top molecule8:c·have alao been investigated.
Such molecules are more easily handled in the microwave
region, siDoe their spectra at these wavelengths are less
complicated than in the far infra-red.
There are some difficulties which attend investigation
in this region and they reSUlt, firstly, from the fact that
only a very narrow portion of the electromagnetic spectrum
can be observed, a.nd secondly, from tlle requirement for
high sensitivity. The existing apparatus for the generation
and propogation of centtmetre waves is capable of operation
only in specific narrow bands; for, example, one set of
apparatus is d.esigned for use very near 1.2 em. wavelength.
and another near 3.2 cm. wavelength. For this reason any
particular set of apparatus may be expected to cover a band
containing lines from the rota.tion spectra of relatively
few molecules, especially since the pure rotation lines are
rather widely spaced in this region.
With regard to the sensitivity requirement, most of
the rotational aDsorption lines located in the microwave
region are either fundamental lines or correspond to
transitions involving energy levels of low quantum number.
These levels haTe a low relative population at room temper8
ature ani, other things being equal, the corresponding
transition lines will be weak, requiring high sensitivity
to detect them. If the high resolving'power previously
mentioned is to be utilized, the gas under study must be
maintained at a low pressure (the width of the line at
atmospheric pressure ca.n easily be as wide as the bandwid.th
of the apparatus, due to pressure broadening), further
increasing the required sensitivity.
The present research makes use of a standard reflex
klystron oscillator, Which generates electromagnetic waves
of 3 em. W&Telength. The energy from this source 1s
introduced into a double-ended waveguide system, one a~

of whioh oontains the gas under test, the other branch
serving as the reference ann. The system is adjusted, wi th
the gas chamber evacuated, so that the energy passing through
the gas chamber is thessme as that passing down the reference
arm. Any dis~urbance of this balance upon introduction of
the gas, indicates absorption of the miorowave energy by the
gas. Frequenoy modulation of the source is used in con
junction with a cathode ray tube display to provide a
continuous graph of absorption versus frequency.
Eleven separate gases and one equilibrium mixture of
gases have been investigated with the apparatus but no
aDsorption lines have been found in the region designated
by the wavelength limits, 3.15 to 3.3 centimetres.
A similar waveguide system. was also constructed for
operation in the neighbourhood of A= 1.2 em. This system
was used to investigate the inversion spectrum of ammonia,
which bad previously been reported in detailS,9,lO,11,12,13.
Fourteen lines of this inversion spectrum were observed.
THEORY
In discussing the theory of rotation speotra, we will
first consider the simple diatomic rigid rotator and then
examine the modifications which are necesea~ in order that
these results may be applied to the more complex cases.
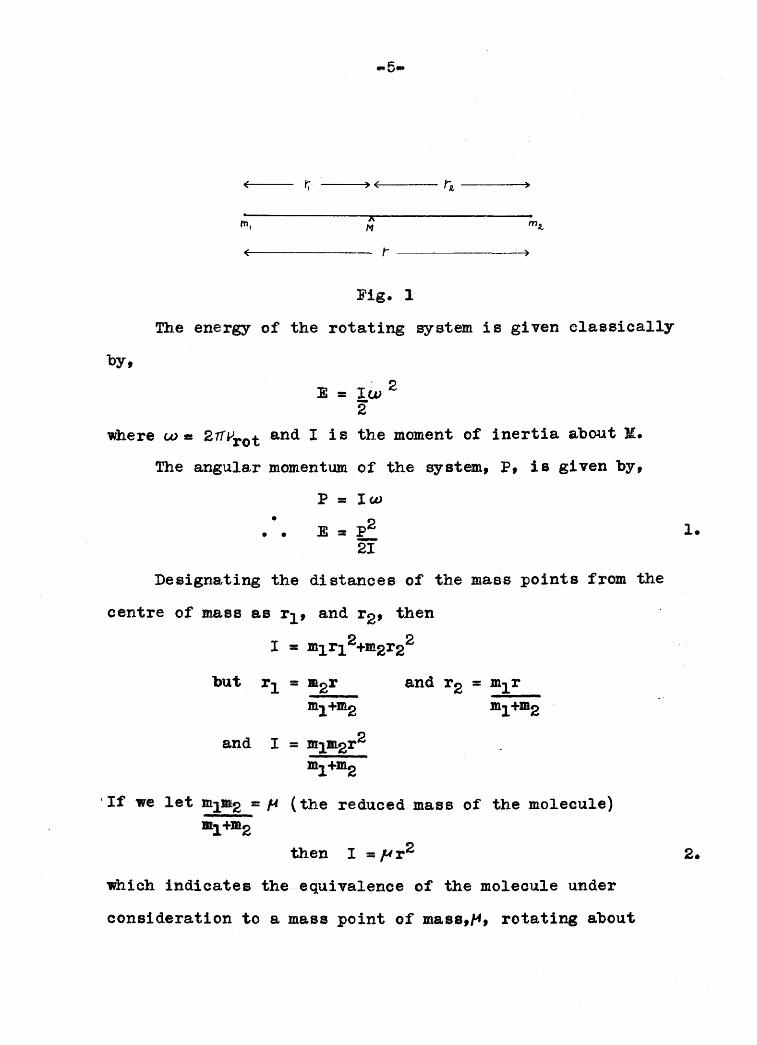
The Rigid Rotator -- The rigid rotator consists of two
mass points constrained to move with constant separation
and free to rotate about their centre of mass, U.
( r, ) ( I'i )
xm, M m~
( r )
Fig. 1
The energy of the rotating system i e given classically
by,
E = Iw 22"
where w == 27TJJrot and I is the moment of inertia about I.
The angular momentum. of the system, P, is given by,
p == Iw• 1'2• • E ::
2f
Designating the distances of the mass points from the
centre of mass as rl' and r2' then
I == mlrl2+m2r22
1.
but rl == -2r
ml+~
and I == mlJJl2r2ml+~
and r2 = mlrml+-2
. If we let mlJl12 ::,." (the reduced mass of the molecule)
-1+-2
then I = flr2
which indicates the equivalence of the moleoule under
consideration to a mass point of mass,~, rotating about
2.
a point at a fixed distance r from it. The energy states
of suoh a system are found by solving the Sehrodinger wave
equation of the form:
~~~+ t:~?~~8S(EwVW=C
setting V, the potential function, equal to zero for pure
rotation and a := 1", and solving for E, it is found that
solutions occur only for the eigen-values,
E =h 2J{J+IL := h 2j{J+l)8rr2~r2 Srr21
where J may have integral values 0, 1, 2, --~-, and 1s
oalled the rotational quantum number. Comparison of (3)
and (1) shows that J gives the approximate value of p, the
angular momentum, in terms of 1'1 •2rt
Equation (3) gives the energy levels of the ~stem.
The energy emitted or absorbed in a transition from one
level to another is given by,
E = ]it ~Ef t
:I: hY'
=ke-hevT
where E' is the energy of the upper state
and E" is the energy of the lc,.w"er state.
Vi := frequency
V = wave number•
• • V := E'-E' t
iiC he
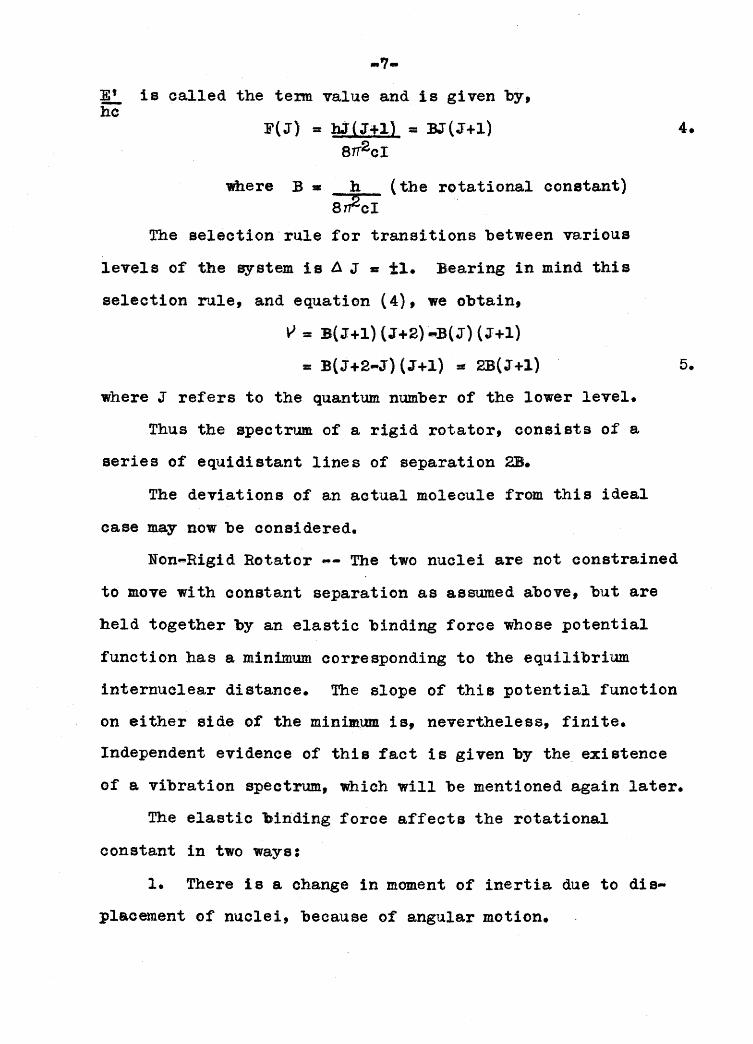
E' is oalled the tenn value and is given by,he
F(J) :: bJ(J+l) :: :BJ(J+l)8TT2c1
where :B. h (the rotational constant)8172c1
The selection"rule for transitions between various
levels of the system is A J • ti. Bearing in mind this
selection rule, and equation (4), we obtain,
v :: B(J+l) (J+2) -:B(J) (J+l)
:: B(J+2-J) (J+l) :: 2B(J+l)
where J refers to the quantum. number of the lower level.
Thus the spectrwa of a rigid rotator, consists of a
series of equidistant lines of separation 28.
The deviations of an actual molecule from this ideal
5.
case may now be considered.
Non-Rigid Rotator ..- The two nuclei are not constrained
to move wi th constant separation as assumed above, but are
held together by an elastic binding force whose ~otential
function has a minimum corresponding to the equilibrium
internuclear distance. The slope of this potential function
on either side of the minim~ is, nevertheless, finite.
Independent evidence of this fact 1s given by the. existence
of a vibration spectrum, which will be m.entioned aga.in later.
The elastic binding force affects the rotational
constant in two ways:
1. There 1s a change in mament of inertia due to dis
placement of nuclei, because of angular motion.

.8-
2. When vibration is present, the time average
separation of the nuolei does not correspond to the
equilibrium separation.
These two effects will be discussed in this and the
succeeding section.
Equating (1) and (3), we get,
Vrot = h/J(J+l) ~ h.T4({21 411"21
decrease in B, the rotational constant.
The expression of (4) above must therefore be modified
to allow for an effeotive decrease in B with increasing J.
A suitable relation for the energy levels of the non-rigid
rotator is given by,
F(J} = ~(J+l)-DJ2(J+l)2+ - 6.
where D is a constant, much smaller than B. '!'he value of
D depends upon the binding force between the two atoms
(Shape of the potential curve) as does the vibrational
frequency, Wvibratione D is given by,
D = 4B3-r
W vibration
In order to derive the spectrum resulting from the

8.
modified rotator, (6) is treated in preoisely the manner
previously used for (4), giving the equivalent equation to
(5), namely,
v 11: 2B(J"+I) -4D{J+l) 3 7.
Vibrating Rotator -- As ha.s already been indicated,
the molecule vibrates a.long the axis joining the two atoms
as well as rotating about an axis perpendioular to it. In
general, the frequency of vibration is muoh greater than
the frequenoy of rotation. This fact justifies the use of
a "mean B value" for the rotational energy levels. If the
vibrations of the molecule were harmonic; that is, if the
potential function were ~etrio about its minimum, this
mean B value would be just the one previously used, which
we Shall designate as Be (or B equilibrium). However,
since this is not the case, Bv (or B vibration) 1s a new
quanti ty which is slightly smaller than Be' due to the
larger value of the mean nuclear separation in the case of
vi'bration, and is given approximately by,
Bv = Be-~e(v+l/2) ----
whereOCe is a constant, whioh is much emaller than Be'
and v is the vibrational quantum number. It is worthy of
note from (8) that even in the lowest vibrational state
By is not equal to Be-
The constant D introduced in the previous section must
also be modified by the action of vibration. Since the mean
value of r in a particular vibrational state is larger
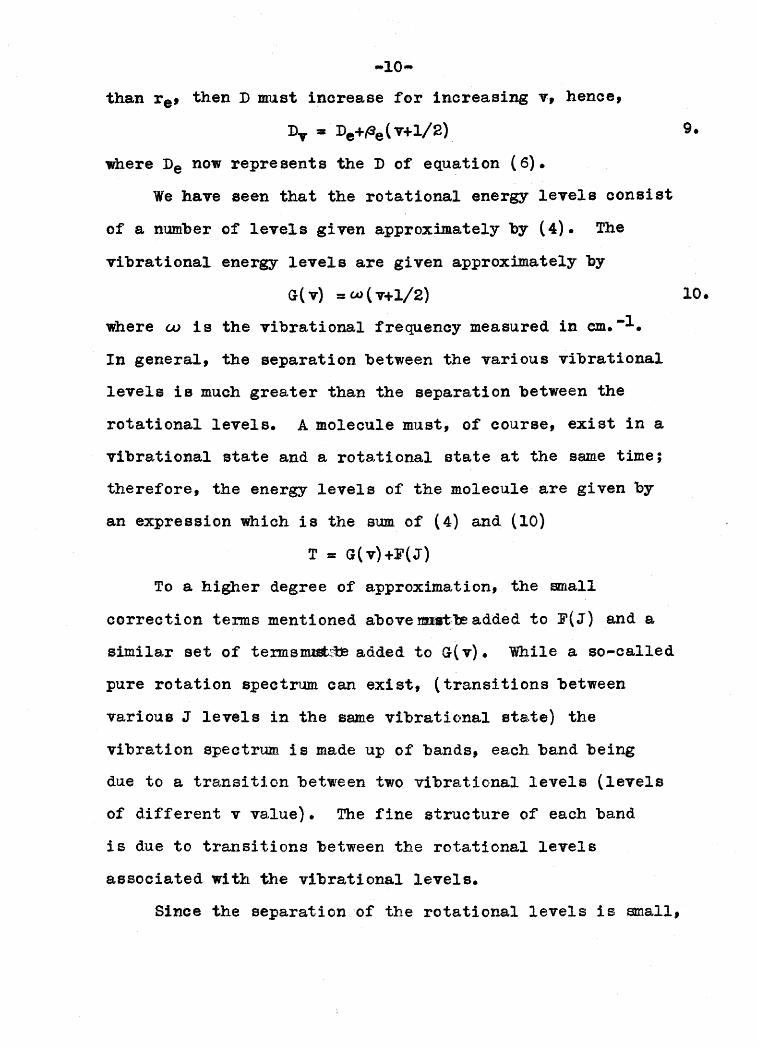
than r e , then D must increase for inoreasing v, hence,
Dy := De+f3e <v+l/2) 9.
where De now represents the D of equation (6).
We have seen that the rotational energy levels oonsist
of a number of levels given approximately by (4). The
vibrational energy levels are given approximately by
G( v) :: W ( v+l/2)
where cv is the vibrational frequency measured in ~.-l.
In general, the separation between the various vibrational
levels is much greater than the separation between the
rotational levels. A molecule must, of course, exist in a
vibrational state and a rotational state at the same time;
therefore, the energy levels of the molecule are given by
an expression which is the sum of (4) and (10)
T := G(v)+F(J)
10.
To a higher degree of approximation, the small
oorrection terms mentioned above mrJ.18't:re added to F(J) and a
similar set of terms~~ added to G(v). While a so-called
pure rotation spectrum can exist, (transitions between
various J levels in the same vibrational state) the
vibration spectrum is made up of bands, each band being
due to a transition between two vibrational levels (levels
of Q.ifferent v value). The fine structure of each band
1s due to transitions between the rotational levels
associated with the vibrational levels.
Since the separation of the rotational levels is small,

-11....
the pure rotation spectrum is found in the far infra-red,
extending, in the case of heavier molecules, to the micro ....
wave region. On the other hand, since the separation of
the vibrational levels is considerably greater, the rotation
vibration spectrum is found in the infra-red~
The Diatomic ~etrlc Top -- A synnnetric top is a
system having the moments of inertia about three mutually
perpendicular axes passing through the center of gravity
all different from zero, but having two of the moments of
inertia equal.
~---------
I .........I ,
I ""-
I ' "-I .......... ,I '~-- ,
Fig. 2.
It is seen from Fig. 2 that the total angular momentum
of such a SY$tem need. not be perpendicular to the inter-
nuclear axis. The angular momentum about the internuclear axis
and the angu.la,r morrrentum about an axi S l?erpendicular to the
internuclear axis are added vectorially to give a total angular
momentum. This total momentum is quantized and, for a j?artic,...,
ular quantum state 1s constant in magnitude and direction. The
angular momentum along the internuclear axis is also quantized,3
we have indicated the latter angular momentum in Fig. 2

-l:aby .JL whose magnitude is gi ven by
IA/:: A lL27T
where A is another quantum number.
In the case of the diatomic molecule, A is the angular
momentum due to the rotation of the electrons around each
of the nuclei and N is the angular momentum due to the
rotation of the atoms about an axis perpendicular to the
internuclear axis. The new total. angUlar momentum, J, is
the vectorial sum of N and A. The magnitude of J is given
by
IJI • Itl{J+l)h211
It may also be noted from Fig. 2 that the minimum
value of J occurs when N :z 0 and then J ==.A.; hence,
J = A ,-1\.+1,..1\.+2,---...
The rotational levels of the ~etric top are given by
12.
where
I A is the moment of inertia about the internuclear axis,
and IB has the significance indicated in (2).
The various values of the quantum number, JL, correspond
to various electronic states of the molecule and in general
have snall values. For a given electronic state..A... is,
of course, constant and the ter.ms of (12) are identical
with those of (4) except for a Shift of (A"B)Jl2. When

-13-
...I\- == 0, (12) reduces to (4) and we have exactly the same
case as was discussed earlier.
The selection rules for the rotational transitions
now depend on.A. For the electronic state,..J\...;: 0, the
selection rule for J is
h:f == ±las before.
For all other cases a new selection rule operates;
nemely,
liJ == O,tl 14.
The Poly-atomic Symmetric Top -- In the section above,
we discussed the case of the diatomic symmetric top where
IA was the moment of inertia due to the planetary electrons
and was therefore of small magnitude. Because of this, A
in (12) was much larger than:B. For the polyatomic symmetric
top the existence of I A depends on the fact that all nuclei
of the molecule do not lie on the figure axis (corresponding
to' the internuclear axis of the diatomic case) but are
nevertheless symmetrically disposed about it. The energy
levels of such a molecule are given by an equation Which
is analogous to (12); namely,
F(J,K) -BJ(J+l)+(A-B)K2 15.
where
:B == h/8TT2cI:s A == h/8TT 2CIA
IA Is the moment of inertia about the figure axis
and IB 1s the moment of inertia a.bout an axis passing

through the centre of mass and perpendicular to the
figure axis. In addition, it should be noted that (15)
is only accurately true for the case of a rigid ~etrie
top. For the non-rigid case, additional small tenms should
be added as in (6). The energy levels for this case are
given by
F(J ,Ir) = l3J (J+1) +(A-E) K2..,D;rJ2(J+l) 2-D~(J+1)K~¥4 16.
For the majority of cases the selection rules are.
L\J = 0,*1 AK = 0
Applying these rules first to (15), we get for the rotation
spectrum,
V:I 2:B(J+1)
exactly as for the diatomic molecule. Since the upper and
lower state for each transition must have the same K value,
the resulting spectrum is independent of K.
However, if (16) is used to derive the speotrum terms,
the result is,
v= 2B(J+l) -2I1o'K2(J+1) -4DJ (J+l) 3
It is seen that the lines are no longer s~etrieal
and there is now a small dependence upon K, causing a
"splitting" of the lines given by (17).
Polyatomic Linear Molecules -- This group includes
those molecules which have moments of inertia about two
of three mutually perpendicular axes equal, and the third.
~ to zero. As might be expected the treatment of this
type of molecule is essentially sUnilar to that of the
1 '1.
18.

-15-
diatomic molecule, and the same expressions hold for the
energy levels and resulting spectrum.
Polyatomic Spherical Top Molecules -- For these
molecules the moments of inertia about three mutually
perpendicular axes are equal. In this case, the expression
of (12) degenerates to that of (4) since A = B.
Polyatomic Asymmetric Top Molecules When all three
principal moments of inertia are different, the resulting
rotational motion of the molecule is ve~ complex indeed.
The energy levels for such a molecule can not be represented
by a fo~ula of the type previously given. It is usual
to treat this ease, qualitatively at least, in te~s of
deviations from the symmetric top; however, no attempt can
be made to treat this 'complex system in so brief a survey.
Dipole Moment -- While no mention has yet been made
of this quantity, the presence or absence of a dipole
moment is the determining factor in the transition prob
ability and hence the appearance of rotation absorption
spectra. The selection rules given above are derived on
the basis of the existence of an electrical dipole moment
associated wi th the transitiona examined. These ru.les are,
in general, quite rigid due to the fact that a transitio~
by electrical dipole radiation is far more probable than
transitions by means of either electrical quadrupole
radiation or magnetic dipole radiation. Nevertheless,
transitions due to the existence of an electrical quadrupole

moment or a magnetic dipole moment do on occasion become
~portantZt particularly when the transitions are forbidden
by the electrical dipole selection rules.
The appearance of pure rotation spectra (as dipole
radiation) depends primarily on the existence of a peDma
nent electrical dipole moment in the molecule. This
requirement rules out the possibility of investigating a
large group of molecules by this mea~s. Whenever the axis
of'~et~ of a molecule is also the axis of rotation,
the molecule possesses no large dipole moment in the plane
of rotation. Thus, such molecules a.s homonuclear diatomio
molecules, ~etrical linear molecules, and spherical top
molecules (With the exoeption of molecules whioh are
accidentally spherical tops) can not be investigated by
observation of pure rotation spectra.
Prediction of ADsorption Lines ~- It is occasionally
possible to make predictions of the occurrence of microwave
absorption lines from the fine structu~e of lines observed
in the far infra-red2• However, this is not l'0ssible for
lines of greater wavelength than those occurring in the
1.2 em. region, due to the fact that the corres];>onding fine
Zrne strong absorption line of 02 at A •• 5 em. is aninteresting example,of the appearance of a "forbidden" linedue to the existence of a magnetic dipole moment. Seepage 2f.

structure is rarely resolved. Accordingly, prediction of
the wavelengths at which rotation lines may be expected
must usually be made on the basis of calculated moments
of inertia.
As already stated the spectrum of a polyatomic linear
moleoule, and al'o;, to a moderate degree of aoouracy, of
a polyatomic symmetric top type of molecule is given by
y= 2B(J+l)
== 2h (J+l)81T2
CI]B
Substituting the values of the constants involved this
becomes,
V:= 2( 27. 99xlO·40) (J+1)
IB
where I B is expressed in gm.cm. 2•
It is more convenient to substitute the values of
mass for the atoms directly in mass units and the inter
nuclear distances directly in Angstrom units, accordingly,
IB= (lO"S) 2 ~JlR2
6. o2xlO23
where M is in mass units
and R is in Angstrom units
hence,
v == 2(27. 99} (6.02)10"40{J+l)
10-39 I)ffi2
== 33.70(J+1)
l'Jm2

If the values of the internuclear distances are known
approximately from electron diffraction data and the
general Shape of the molecule is known, it is possible to
substitute in this formula and obtain an idea of the
regions in which absorption lines may be expected.
As an example, the calculation~ are given below for
the linear molecule CICN. The internuclear distances
from electron diffraction data are:o
01 .. C 1.67 Ao
C - N 1.16 A
Using the method of moments to find the centre of
mass: if x represents the distance from the centre of
mass to the carbon nucleus,
35.5(1.67-x) := x(12)+(1.16+x)14o
hence x = .70 A
Accordingly the distances from the oentre of mass to the
various nuclei "are:o
01 .97 Ao
C .70 Ao
:N 1.86 A
hence,
LMR2 = 35. 5(.97) 2+12(.70) 2+14(1.86) 2
:= 81.71

-19-
A = 8?71 • 2.603 cm.33.70{J+l) J+l
It is seen that if J = 1 is substituted in this
expression, an absorption line could be expected in the
neighbourhood of A = 1.3 em. C.H. Townes, A.H. Holden
and F.R. Merritt have found this line for the J = 1 to
J = 2 transition of CICN at 23,885 megacycles, correspond-
ing to a wavelength of 1.256 4cm. •
Inversion Spectra -- In the case of non-planar
molecules there are, "SDnrfftim-e's., two possible stable con...
figurations of the molecule. For example, in the ease
of NH:;the nitrogen nucleus may be located on either side
of the plane of the hydrogen nuclei. This corresponds
to a potential function having two minima and a potential
barrier between them (in the plane of the H atoms). If
the potential barrier were infinitely high (or broad) the
vibrational energy levels on each side of the barrier would
be identical. However, since this is not the case, the two
sets of energy levels perturb each other and cause a
splitting of each level into a symmetric and a.ntisymmetric
pair. The amount of splitting is proportional to the
probability of transition between the two perturbing
levels and hence is inversely proportional to the height
and breadth of the barrier. For this reason, the splitting
increases for.higher vibrational levels. Since transitions
take place between eymmetriaand anti symmetric le:J-els

...20...
only (the symmetric level is always the lower of the pair),
the splitting for a rotational line involving a change in
J will be twice the separation of the pair of levels. A
so-called ·pure inversion spectrum" does exist, correspond
ing to the transition between levels having the ~e
quantum numbers but different symmetry. This spectrum in
the case of IH3 is of particular historical importance
in the development of microwave absorption measurements.
PREVIOUS WORK IN THE FIELD
In 193~, While investigating the pure rotation
spectrum of ammonia in the region from 60 tol25 mierons
Wright and Randal12 observed a splitting of the lines.
This splitting, which they found to be 1.33 cm.-l , was
explained on the basis of inversion doubling. The
discove~ of the actual magnitude of the splitting (this
splitting of the rotational levels takes place in the
vibrational ground state) allowed a prediction of the occur
rence of the pure inversion line at 0.66 cm.-l or A= 1.50 em.
Accordingly, this region was investigated by Cleeton and
Williams5• Their apparatus6 consisted of a magnetron
oscillator, capable of radiating energy in the 1-4 em.
wavelength region, a large echelette type of grating, a gas
'bag (containing the ammonia) and the usual sort of thermo
couple detector. They did, in fact, find a broad absorption
line at these wavelengths which was centered on A = 1.25 em. f
instead of the predicted 1.5 em. The existing equipment for

-21-
work at these frequencies was, however, scanty, unreliable
and not particularly well suited to spectroscopic application.
Later, several papers were publiShed predicting a fine
structure for this line, if measured at low pressure (see,
for ex~ple, 'Sheng, Barker and Dennison?).
The development of the reflex klystron, improve-
ments of the crystal detector, and advances in waveguide
techniques all brought about by war-t~e research,
provided the necessary tools for a closer examination of
the absorption line found by Cleeton and. Williams. Thus
at the close of the war several investigators turned their
attention to this problem and were rewarded by success
at very nearly the same time. C.H. Townes found twelve
lines8 , while JB\leaney and Penrose, working in England,
used an improved technique in which the gas was contained
in a cavity resonator rather than a waveguid.e, and resolved
at least twenty linea9 • Finally, Good found and measured
the frequency of thirty lines10 as well as noting what
appeared to be hyperfine structure associated with some
of them. These lines have already become so well known
that their use as frequency standards has been proposed.
Strandberg, Kyhl, Wentik and Hilger have measured the
frequencieeof the lines with high precision11,12. Good
and Coles have repeated this work (using as a basic
frequency the standard frequency transmission of the
National Bureau of Standarda Station WWV) and have resolved
-22-
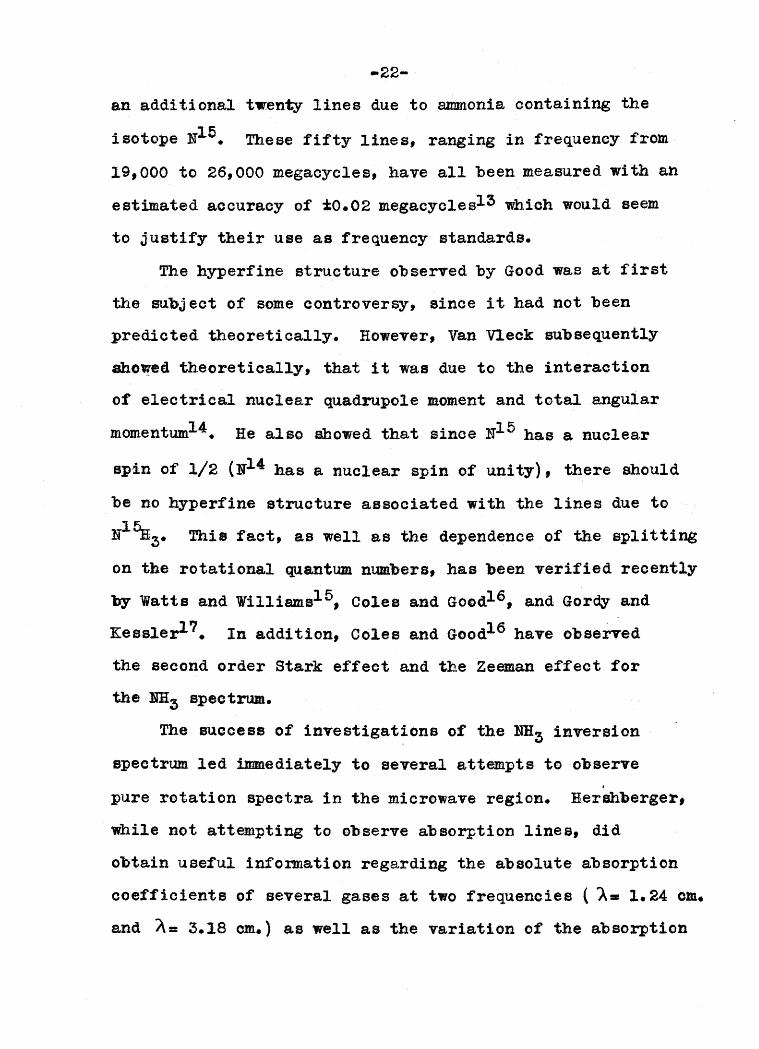
an additional twenty lines due to ammonia containing the
isotope N15• These fifty lines, ranging in frequency from
19,000 to 26,000 megacycles, have all been measured with an
estimated accuracy of iO.02 megacyoles13 which would seem
to justify their use as frequency standards.
The hyperfine structure observed by Good was at first
the subject of some controversy, since it had not been
predicted theoretically. However, Van Vleck subsequently
aholVl!d theoretically, that it was due to the interaction
of electrical nuclear quadrupole moment and total angular
momentum14• He also showed that since N15 has a nuclea.r
spin of 1/2 (1'14 has a nuclear spin of unity), there shoUld
be no hyperfine structure associated with the lines due to
~5:H3. ~is fact, as well as the dependence of the splitting
on the rotational ~antum numbers, has been verified recently
by Watts and Williamsl5, Coles and Goodl6, and Gordy and
Kessler17• In addition, Coles and Good16 have observed
the second order Stark effect and the Zeeman effect for
the 1m3 spectrum.
The success of investigations of the NHZ inversion
spectrum led immediately to several attempts to ob.serve
pure rotation spectra in the microwave region. Hershberger,
while not attempting to observe absorption lines, did
obtain useful information regarding the absolute absorption
coefficients of several gases at two frequencies ( A== 1.24 C1n.
and A= 3.18 em.) as well as the variation of the absorption


-24-
of absorption lines to be expec~ed in the microwave region
for the a~etric top molecules, H20, D20, HDO, H2S, and
H2Se, has been made by King, Hainer and Cross24• Townes
and Ieritt have found one of the predicted lines for H20
and another for lID025• Van Vleck has also studied the
absorption line for H20 at A= 1.35 em. (the eo-called
radar absorption line) in some detai126•
The strong absorption 'by 02 of m.icrowaves ( ).~ .5 cm.)
haa also received some attention. This line has been
observed by Beringer2'7, Lamont and watson28 and Van Vleck29•
The last named observer has also shown theoretically that,
al though the 02 molecule has no dipole moment, the absorp
tion can be explained as due to the interaction of the
eleotromagnetic field and the magnetic moment of the molecule.
APPARATUS AND TECHNIQUE
The apparatus used for the present research comprises
a balanced or bridge-type system. As indicated in Fig. 3,
the microwave energy is introdueed into two waveguide anns
in parallel, which may be considered to be two axms of a.
bridge circuit. The detected energy from these arms 1s then
applied to two 300 ohm resistors, whioh represent the other
two a.rme of the bridge. One arm' of the waveguide system
serves as a reference arm, while the other, which contains
the absorption chamber, serves a.s the variable a~. The
bridge is balanced by means of a variable attenuator in the
reference ann and the unbalance caused by the introduction.

723APower
fbt:A
Standin<j WoveDetector
GasSUfply
AbsorptionChamJur ----
"'-f'1ica WIndows
Variable ____Attenuators~
Balanced Subtroctl,'()1.------1r------1
\-------1 Aml"ifJpr CircUit
.JOO-O-SOO f' amfs
O-.5-{-2.S-S. milhamfs
BL OCK DIAGRAM
Fig. :3

-25-
of a gas into the absorption chamber is detected as a
voltage difference between the upper ends of the two 300
ohm resisto'rs.
The source of microwave energy is a reflex klystron
(723A or AlB) which operates over the range A= 3.15 to
3.3 cm. The operating potentials for this tube are supplied
by a voltage stabilized power supply- In addition, a
sawtooth waveform 1s supplied to the reflector electrode
of the klystron in order to produce frequency modulation.
This waveform i a generated in an auxiliary swee~p circui t
which also supplies a similar waveform to the horizontal
plates of the cathode ray tube.
The output of the klystron is fed through a variable
attenuator (used to control the power level in the system)
to a waveguide tee which serves to split the power, deliver
ing half to each waveguide arm. A fixed attenuator is
situated at the entrance to each arm to reduce the coupling
between them. The fixed attenuator in the reference arm
has a va1ue of about 4db, while that in the other arm has
a value of 6db. The reference arm also contains a variable
attenuator, ~sed for balanoing the s.ystem, a reaotion type
cavity wavemeter and the crystal detector, which converts
the microwave energy to direct current. The wavemeter is
joined to the reference arm by a waveguide tee. This type
of wavemeter absorbs power when tuned to the frequency of
the incident radiation but should absorb no power when

-26-
mistuned, thus producing a sharp vertical pip on the
oscillograph trace as the frequency of the'incident
radiation passes through resonance. However, some trouble
was experienced due to reflections in the arm which Joins
the wavemeter to the system so that a Shutter was
installed which effectively Short circuits the wavemeter,
except when a frequency measurement is being taken.
The gas arm. contains a. standing wave detector, the
absorption cham.ber,{2.8 metres in length) which is
isolated trom the rest of the system by mica windows, and
a crystal detector. The standing wave detector was intended
to facilitate matching of the waveguide system but it was
found that a much more sensitive indication of mismatch is
provided by the cathode ray tube display, and. hence the
standing wave detector was seldom used.
The gas Is introduced into the absorption chamber
thrOUgh a gas system which includes the gas container, a
liqUid air trap, the necessary facilities tor evacuating
the absorption chamber and a McLeod gauge for pressure
measurements.
Matching plungers are used to match the klystron and
the c~stal detectors to the waveguide, and in addition
the c~stal detectors are fitted with tuning screws. The
reference arm was made the same length as the gas arm
since it was found that this allowed a good match to be
obtained over a greater range of frequencies.

-27-
The meter arrangement (also shown in Fig. 3) was found
to reduce materially, the time required to match and balanoe
the system. The difference between the ourrents in the two
crystal detectors is measured by a centre-zero meter, while
a second meter measures the total current through both
detectors.
In operation, the frequency modulated output of the
klystron covers a band of frequencies approx~ately 60
megacycles wide. The deteoted outputs from the two arms
of the waveguide system are combined in the subtraction
circuit and the differenoe signal is amplified and appliea
to the vertical plates of the cathode ray tube. The output
of the klystron oscillator is by no means constant over the
60 megacycle band, but this variation is effectively
cancelled out by the bridge type cirouit; that is, if the
output signals from the two crystal deteotors are identical,
there is no' output from the subtraction circuit and a
straight line on the C.R.T. results. On the other hand, if
the gas in one arm of the bridge absorbs energy at one
frequency, then this disoontinuity is amplified and appears
on the C.R.T. ThuB the trace on the C.R.T. represents a
graph of attenuation versus frequency (since the horizontal
deflection is produced by the same waveform as is used to
produoe the frequenoy modulation of the source). The rate
of sweep is such that the 60 megacycle band is covered in
approx~ately 10.3 seconds.
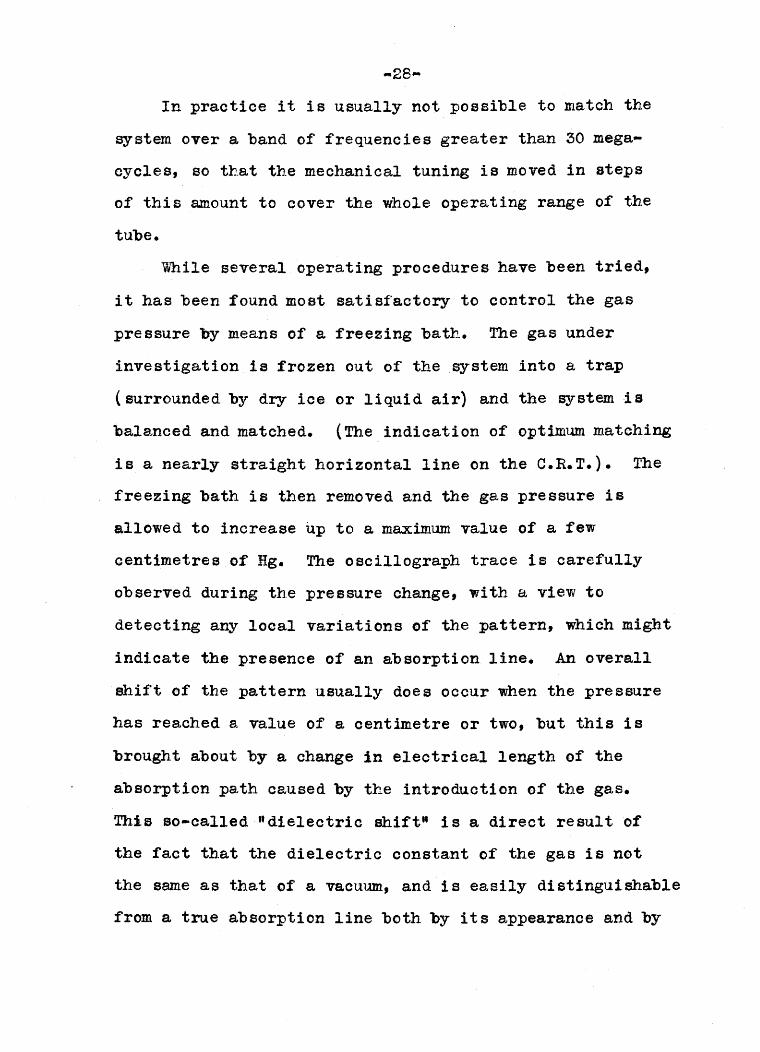
In practice it is usually not possible to match the
system over a band of frequencies greater than 30 mega
cycles, so that the mechanical tuning is moved in steps
of this amount to cover the whole operating range of the
tube.
While several operati.ng procedures have been tried,
it has been found most satisfacto~ to control the gas
pressure by means of a freezing bath.. The gas under
investigation is frozen out of the ,system into a trap
(surrounded by dry ice or liquid air) and the system is
balanced and matched. (The.indication of optimum matching
is a nearly straight horizontal line on the C.R.T.). The
freezing bath is then removed and the gas pressure is
allowed to increase up to a maximum value of a few
centimetres of Hg. The oscillograph trace Is carefully
observed during the pressure change, with a view to
detecting any local variations of the pattern, which might
indicate the presence of an absorption line. An overall
shift of the pattern usually does occur when the pressure
has reached a value of a centtmetre or two, but this is
brought about by a change in electrical length of the
absorption path caused by the introduction of the gas.
This so-called "dielectric shift" is a direct result of
the fact that the dielectric constant of the gas is not
the same as that of a vacuum, and is easily distinguishable
from a true a.bsorption line both by its appearance and by

-29-
the pressure reading at which it occurs. After observa-
tion of a given 30 megacycle band the klystron is mechanically
tuned to cover the next 30 megacycle band, the system is
matched and balanced and the procedure repeated.
Another system has also been constructed for operation
in the neighborhood of ,,:: 1.2 cm. This system is simila.r•
to that already described, utilizing a type 2K33A oscillator
tube and a double-ended waveguide system. The absorption
path is somewhat shorter than for the 3.2 cm. system, being
1.5 metres in length. No provision is made for matching
the crystal detectors to the waveguide nor are the two arms
the same length.
The theory a.nd technique involved in the construction
of the waveguide systems will be treated by Costain30 •
However, two circuits were developed for use in this research
project and since it 1s possible that they are capable of
wider application, they will be discussed in detail in the
following paragraphs.
Sweep Circuit_~- This circuit was designed to provide
an approximately linear sawtooth waveform of the shape Shown
in Fig. 4. Although one function of the circuit is to
produce a time base for the C.R.!. display, the prima~
purpose is to provide a suitable wavefonn for a.pplication
to the reflector electrode of the reflex klystron oscillator
in order to cause frequency modulation. The sharp rise at
the leading edge of the waveforrii. ensures that the klystron

-30!"Ol
oscillates only for the duration of the sweep cycle. The
D.C. reflector potential is set, initiall~ so that the
klystron is not oscillating
between the sweep cycles but is
brought i.nto oscillation by the
arrival of the leading edge of
the waveform. The oscillations
Fig. 4 are then frequency modQlated by
the waveform. At the end of the cycle the reflector electrode
returns ra~idly to its initial potential, causing oscillation
to cease. The frequency versus reflector potential character
istic of the klystron used (723 A/B) is approximately linear;
therefore, a linear modulation waveform is desirable. It
was also considered desirable to design the circuit so that
the amplitude and slope of the sweep waveform were independ
ently variable.
The circuit diagram of the sweep. waveform. generator,
which was finally constructed, is given in Fig. 5. The left
hand tube and its associated double diode produce the wave
form, the right hand tube serving only to reduce the output
im.pedance to a suitable value, and provide separate outputs
for the C.R.T. and the reflector electrode of the oscillator.
The action of the OJ? tube is similar to that which
would result if a conventional multivibrator circuit were
used to control a linear sweep device. The multivibrator
action and the generation of the sloping ViayefoI'm is obtained

,-.-------,------,,..--r----,...----------r-- +300 V(stabtl,zed)
(slope) 1M
2M.0003
, lOOK
6J7
SOOK 60J<
47K
6H6
SWEEP CIRCUIT
Fig. 5
SOOK
IS K
I----------l~ PositlYe1- Olllf"uf
.25
I-- ~~ Negative. 5 Output
21<
/5 K
6AC7

1I
in a one tube circuit by using each of the tube electrodes
for a. separate function.
The OJ? tube, connected as shown, has one stable mode
of operation and one metastable mode. These are character
ized respectively ~ the following conditions: (a) the
major portion of the tube current passing to the screen
grid, and (b) the major portion of the tube current passing
to the anode. Condition (a) exists when the anode current
is effectively cut off by the presence of a negative potential
(with respect to the cathode) on the suppressor grid. Con
dition (b) exists Wheuever this negative bias on the
suppressor grid is removed. The successive alternation of
the tube between these two conditions of operation provides
the necessary multivibrator action.
The sloping portion of the wavefor.m is generated while
the tube is in condition (0) by an exaggerated form of the
well known »iller effect. This action takes plaoe in any
oircuit which has large capaoity coupling between anode and
control grid, and in which the control grid is returned to
a high positive potential. The
treatment of this case, while not
original, is included below for
reference.
The simplified cirouit in the
aocompanying diagr~ represents
the general case. The potential

differences existing between the anode and cathode, and
between the control grid and cathode are designated by E
and e respectively. The total R.T. voltage is designated
by V.
The equation relating R,C,E and V is simply:
Ri + g, + E ::: VC
Differentiation with respect to time yields:
R&+!~+2!.=Odt C dt dt 1.
Designating the voltage amplification of the tube as m,
m. de :: dECit at 2.
but de::: R di(it at
SUbstituting this equation in (2) and then in (1) we obtain:
R !!.( l+m) +i !!9. ::: 0dt C dt
or R di(l+m)+i :: 0err cdi = -dtT (l+m}RC
Integration and substitution of the initial conditions;
namely, When t :: 0, e ::: 0 and i :: V yields,R
R di :: -de :: 1 dE ::dt dt mdt
~dE:: "",mV<it (l+m)RC
•• •
log i :: log V-. tIt {l+m)RC
or iR :: veet/(l+m)RC
-v e~t/(l+m)RC
tl+m)RC
e"",t/(l+m)RC

For m»l and t« mRC this expression reduces to:
A value'of m as high as 100 is easily achieved in practice.
The second condition,regarding t, is also fulfilled since
the action is te~inated before t reaches a value equal to
Re.It is seen from (3) that the deviation of the resultant
waveform from the ideal linear wavefoDm is approximately
equivalent to that which would result if the condenser were
allowed to charge through a resistor, returned to a potential
mY.
Returning to the circuit of Fig. 5, the action described
by (4) above continues until the anode potential falls to
the "knee" of its characteristic curve. At this point since
the anode potential has ceased to fall, the control grid
potential is allowed to rise, increasing the total current
through the tube, i.e., increasing the screen current.
This increase of current tends to make the cathode
potential more positive and the suppressor grid potential
more negative (by virtue of the capacitive coupling between
it and the screen grid). Since this action is cumulative,
due to the capacitive coupling between the anode and
control grid, the tube rapidly returns to condition (a).
The ehangeover from condition (a) to condition (b) is
effected by the action of the suppressor grid. The potential
on this electrode rises exponentially, according to the ttme

-34-
constant of the associated resistor and condenser, until it
reaches a point at which anode current is again allowed to
flow. The anode potential falls sharply for a few volts until
it is checked by the capacitive feed-back to the grid. The
action described by (4) above then takes control and the
waveform repeats itself. The sharp initial fall of the anode
potential gives the leading edge of the waveform the required
shape.
The potential waveforms existing on the tube electrodes
are plotted in Fig. 6a against a common time axis in order
to provide a clearer picture of the operation of the circuit.
The time axis in this figure is not linear, being greatly
expanded for condition (a).
Control of the slope of the waveform is provided as
shown in Fig. 5. The effect of variation of the grid return
resistor 1s indicated in equation (4) above. The am~litude
of the waveform is dependent upon the in!tial valu,e of the
anode potential~-its value when the tube is in condition
(a), since the lowest point reached by the anode potential
is fixed by the constants of the tube. Control of this
initial potential is provided by the right hand section of
the double diode which has its cathode returned to a variable
potential. The left hand section of the double diode is
merely used to prevent the potentia.l of the suppressor grid
from'rising too high when the screen potential rises.
The anode waveform of the 6J7 is applied through a


-35-
condenser to the grid of the right hand tube (type 6AC7)
which is triode connected and operates as a conventional
tlphase sp1ittertl • A photograph of the output waveform as
seen on a cathode ray oscilloscope is reproduced in Fig. 5b.
A photograph of the completed unit is Shown in Fig. 60.
Thepossi'ble application of some fom of this circuit
to the productien of tiae-ltase waveff)1'!llS 18 euggested. fhe
degree of linear!ty which ca.n be obtained without the use of;,·
very large supply Toltages, makes it preferable to the simple
types of thyratron time-base circuits. The independent
control of slope and amplitude (velocity and amplitude in the
case of a time base) 1s also an attractive feature. While
not possessing the versatility nor the stability associated
with mUltistage time-base circuits, it is probably suitable
for most functions required of a general purpose circuit.
In its present fo~ the upper limit to the rate of sweep
is set by the maximum, safe, control grid current which may
be a.llowed, and hence by the minimum valueo! the grid return
resistor which may be used. This difficulty however could
be overcome by the insertion of another diode in the grid
circuit with its anode connected to the grid and cathode
returned to a potential, chosen so as to limit the positive
potential ap~lied to the grid. Positive pulses may be applied
to the suppressor or negative pulses to the control grid in
order to provide ~nchronization.
One disadvantage of this circuit for time-base

..:;6-
application is the sharp leading edge on the wavefonn, but
it is largely offset by the presence on the screen grid of
a square positive pulse of the s~e duration as the anode
waveform., which may be used to brighten the primary trace,
thus el~inating the "fly-back" trace. The slightly rounded
leading edge on the screen waveform is quite sufficient to
render invisible the· initia.l rapid movement of the spot
corresponding to the leading edge of the wavefonn.
The only unusual consideration a.ffecting the choice of
a pentode for use in this type of circuit is that the
anode current Should be ~ite sensitive to variation in ~e
suppressor grid potential.
Subtraction Circuit - .. The signa.ls from the crystal
detectors in the reference and gas chamber arms of the
microwave ~stem could be amplified separately and applied
to the two opposite deflection plates of the C.R.T. This
procedure would result in a deflection of the trace propor
tional to the difference between the signals arising from
the two detectors. However, the difference between the two
signals represents a very small fraction of the total signal
voltage, and hence high sensitivity could only beobtalned
by producing very large A.C. voltages for a.pplication to the'
C.R.T. The inherent difficulties in designing such a systea
include the need for high stability in the two amplitiers,
and the requirement that the two amplifiers be identical
in operation. The large "anode swing" present in the last

-3?...
stage of amplification also makes a high voltage power
supply essential.
In order to overcome these difficulties, it was decided
to design a circuit which would react only to the difference
in potential between the signals arising from the two
deteetors. The difference signal developed by this circuit
could then be ~plified by a conventional amplifier and
applied in "push-pull" to the C.R.T. deflection plates.
The circuit diagram is shown 1n Fig. 7. The crystal
deteotor signals are applied acrOBS two 300 Qhm resistors
(which provide the D.C. return path for the crystals
themselves). These resistors are tapped at three polats
to, provide suitable attenuation ratios. A fifth position
on the attenuator selec~or switch applies identical signals
to the two input control grids for use when balancing the
circuit. A centre-zero meter is connected between the two
inputs in order that the crystal currents 1n the two
detectors may be kept at approximately the same value. A
second meter is connected between the 'common lower end of
the two 300 ohm resistors and earth to indicate the total
crystal current.
The sensitivity switching arrangements for these two
meters are not shown in the diagram.
In discussing the action of this circuit, we w111 first
consider the general case of two similar tubes, having
equal anode loads and a common cathode load. Arbi trary

.01
1------4 Output A
...-.---------+/50V(stabilized)
l...-__-.1_---L.. ~ - 200 V (5tQhiliz~d)
DC Bo/ance
.01
'--__-{ MA .5-0-.5
Output 8 +--------/
SUBTRACTION CIRCUIT
Fig. .,
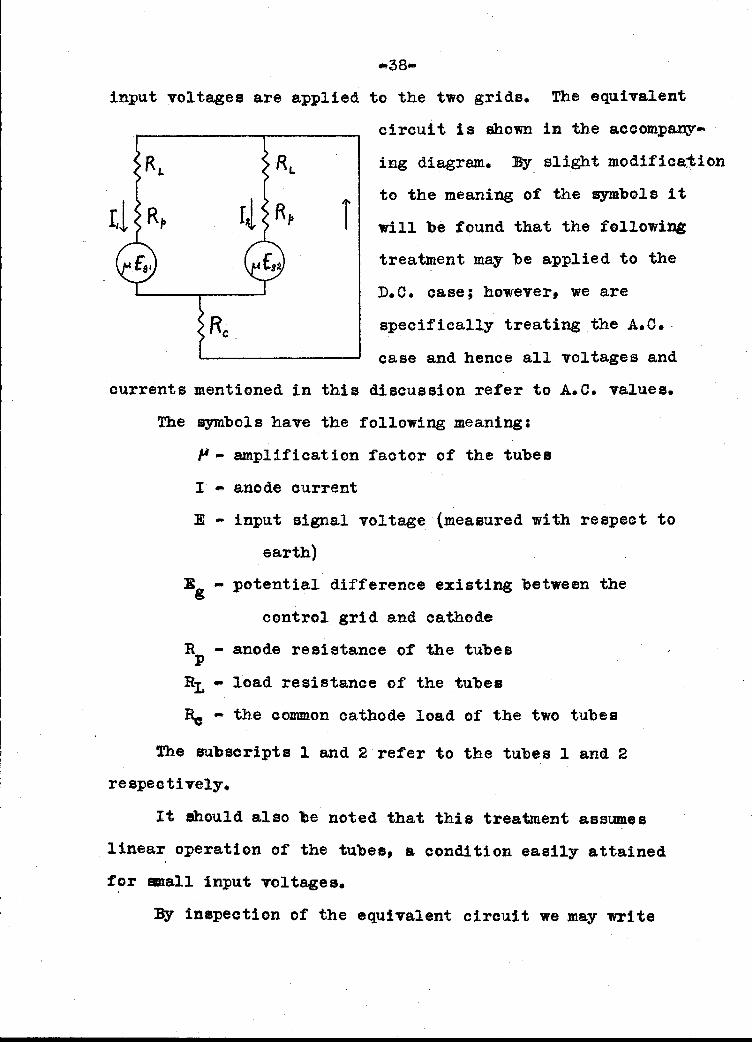
wIll be found that the following
treatment may be applied to the
D.C. case; however, we are
r
input voltages are applied to the two grids. The equivalent
circuit 1s Shown in the accompany
ing diagram. Ey slight modifiea~ion
to the meaning of the symbols it
specifically treating the A.C.
case and hence all voltages and
currents mentioned In this discussion refer to A.C. values.
The symbols have the following meaning:
~- amplification factor of the tubes
I ... anode current
E - input signal voltage (measured with respect to
earth)
Eg ... potential difference existing between the
control grid and cathode
Rp - anode resistance of the tubes
RL ... load resistance of the tubes
Be - the common cathode load of the two tubes
The subscripts 1 and 2 refer to the tubes 1 and 2
respectively.
It Should also be noted that this treatment assumes
linear operation of the tubes, a condition easily attained
for ..all input voltages.
~ inspection of the equivalent circuit we may write

down the circui t equationsas follows:
,tfEg1 == (B:L+~+Rc) I 1+Rc I 2
,lAEg2 = (Rr,+~+Rc) I 2+Rc I 1
In addition we have the conditions,
Eg1- E1"(I1+I2)Rcand Eg2- E2-(I1+I2}Rc
SUbstituting these two values into the circuit equations
we obtain:
j-(E1 • (~+Bp+(,u+l)Rc)Il +~+1)Be12
~E2 SIr (fC+l)RcIl+{RL+~,.... Vt+l)Rc)I2
Solving (2) for 12 and substituting in (1),
~ := ,ME2-V<+J.)Be I l
RL+~+(j.t+1)Rc
JU- E1 .(RL+~+{,tt+l}Re) 11+(,t.+l) Rc ,uE2-(,u+1) 2ac 211RL+Rp+\iA+1 ) Be
and solving this last expression for II'
11 == (RL+a,+Vt+l)Rc)fCEll'lJ(,t+l) Rc JAE 2
Rr,2+~2+~Rr,+2Vw+1)Rr,Rc+2{~1)~Rc
Similarly solving (2) for 11 and sUbs~; in (1),
1 2 :: -( (}-f+l)Rc}'tEl~ (R:I,+l\t+(j4+1)Rc ) ,1olE2 )
( RL2+Rp2+2RpRL+2~+1)RLRc+2~+l)~Rc)
A similar tYlle of circui t i B often used to produce two
voltages nearly equal in amplitude but opposite in phase
from a single input signal (pha.se inversion cireuit). For
1.

this type of operation the signal is applied to one grid
while the other grid is returned to a fixed potential. The
appropriate expressions for this circuit are obtained from
which may· be reduced to,
:II ,c.tEl (1+]')2lRp+RL)
where F = _~+RL
Rp+RL+~(}It+l)Rc
Similarly '(4) becomes:.. ,M El (1... Rp+RI. )
12 .. 2(~+~' (Rp+RL+2Vc+l)Rc )
e .MJb. (l-F)2{Bp+R1J
approximately one-half that which could be expected for the
/

same tube operating as a voltage amplifier. The increas
ing popularity of this type of circuit is probably due to
the ease with which the impedance of the two grids (with
respect, say, to earth) may be balanced, goiving uniform.
operation over a wide range of frequencies. An interest
ing application of thiscireuit as a time base amplifier
has been described by puek1e32•
Returning to the more general case described by
equations (3) and (4), we may divide the numerator and
denominator of ~ach of these expressions by (fA +J.)Rc • In
thi s case we obtain frnm :3:
1J. • Tii:,IA.+,'IL" -).\~--p 2+ ~~Rz,
~ ~+l)Rc
~l))
= fI (EI-E2)+:BIG)(RL+Rp) (2+G)
where G • t;:~Re
and similarly from (4)
12 1& .. fA «EI-E2) -E2G )(~+~r [2+G)
If G is made small then ('7) and (8) respect1vely,
reduoe to:
11 • ,., (El"-E2), 2(Rr,+Rp)
'7.
8.

and 12 • .. /A (Rl-E2)2"{RL + Rp)
For this ease it is seen that the output signals from
the two tubes are in paraphase and their amplitudes depend
10.
only on the difference between the input signals, El and
~2. The fact that paraphase voltages are already present
on the anodes of this circuit makes possible the further
~plification of the signal ~ a balanced "puSh-pull" circuit.
In amplifiers containing several stages of "push-pull"
amplification, it is desirable to maintain the value of the
paraphase ratio (the ratio of the amplitudes of signals
appearing on the two anodes of each stage) as near unity
as possible. It may be noted from (7) and (5) that the
presence of fairly large, common, cathode resistors in each
stage tends to maintain the value of the ratio near unity.
It is, of oourse, implicitly assumed in this treatment that
no by-pass condenser is connected across Ro
•
In the circuit of Fig. 7 a large value of Be 1s
obtained by making use of the constant current character
isticofa pentode; that is, the large anode resistance of
a pentode is used as the Re of the circuit. The approx~te
values of the constants of this circuit a.re:
6N7
R ... 104 ohmsp
J.4 -- 35
~-. 5xI03 ohms

SAC'?
l\> IlUlt 106 ohms
and. henoe G has the approximate value, 5%10.4 • The use
of a pentode as the cathode load in the circuit makes
possible this small value of G without using a source of
large negative potential which would be required if a
physical resistor were ueed.
The balancing potentiometer in the anode circuit of
the ON? tube provides a means of compensating for small
changes in the tube charaoteristics. A variable resistor
is placed in the cathode circui t of the 6AC7 in order to
provide control of the total D.C. ourrent passing through
the cirouit and hence acts as a gain control.
~lanced Amplifier -- The cirouit diagrsm of this
device is given in Fig 8. It consists of three stages of
puSb"pull amplification. The tubes used are twin triodes
(61f7 t s) •.- The grids are biassed positive with res:pect to
earth to allow the use of large cathode resistors in each
stage. This ensures balancing of the upush-pull tt signal
througllout. The R.i'. supply to each stage is se:parately
deeoupled. The output signals, developed at relatively low
impedanoe in the last stage, are applied to the two vertical
deflection plates of the C.R.T. The points marked A andB
in this diagram are conneoted to the points marked Output
A and Output B in Fig. ~.
The completed unit Which houses both the ~pllfier

/

-44....
and subtraction circuit is shown in Fig. 9. The measured
voltage gain of this unit is 104•
The overall sensitivity of the 3.2 em. ~stem was
measured by two methods, both of which were referred to the
calibrated attenuator in the reference aDm as a standard.
These measurements give .005 db/metre (5.5xlO"4 nepers/metre)
as the magnitude of the weakest absorption line which could
be detected with certainty. This figure is based on a
deflection of the C.R.T. trace through.05 inches.
RESULTS
Eleven gases and one equilibrium mixture of gases were
investigated using the ~.2 em. system. These gases are
listed below.
Calculated 1:e
C2]1~H
C~50C~5
DiethylketoneMethyl n-amyl Ketone1m3lID~
NlI3 WaD mID2 :RD3CH3CI
C~5I
C~~r
Ketene (C2B20)Broaobenzene (CsH5Br)
lOOxlO-40192xlO·401 57xlO...40
88x10-40696xlO..40
gm.gm.gm.gm.
sm·
em. 2
em. 2
em. 2
em. 2
em. 2
The actual region over which the gases were investigated
extended from A:III 3.15 to 3. ~ em. in all oases except that
of bromobenzene. Before investigation of this gas the
lower wavelength limi t 'Was ex/tended to approximately 3.1 em.

..45-
,by physical distortion of the cavity on a '23 A/B type tube.
The actual value of this lower limit is uncertain, due to
the fact that the wavemeter in use did not operate satis..
factorily in that region.
The more complex molecules were investigated in the
hope that some lines of their spectra (Which Should be
fairly extensive) would fall in the required region. ND3
and the mixture of NH3' WD3 were investigated in an effort
to find lines from the inversion spectrum. of one of the
ga.ses. In order that a rotational line may fall within the
region investigated the molecule would have to have a moment
of inertia within the approximate limits of 1'5 to
l85xlO·40 gm.em. 2 , or some multiple of values in this region.
However, the errors inTolved in calculation of the moments
of inertia are large enough to justify investigation of
molecules which appear to be close to this region.
No absorption lines were found for any of the above
mentioned gases with the apparatus covering the region,
A • 3.15 em. to 3.3 em.
This apparatus was designed primarily to detect the
presence of narrow absorption lines and not to measure
general attenuation. However, measurements of general
attenuation were made for the case of ammonia, which has
a relatively high absorption in this region. This
absorption is apparently due to a spreading over (due to
pressure broadening) of the inversion speotrum Whioh Is

located at higher frequencies. The results obtained
from these measurements are given below, along with those
of Hershbergerlt which bave been modified to take account
of the 2 metre equivalent absorption path length.
Pressure
55 em. lIs30 cm. Hg
Measured Attenuation
1.85 db.0.54 db.
HerBhberser
0.7 db.0.3 db.
The agreement 1s within the relatively large
expertmental error. The attenuation values given above
are the mean values of measurements at four different
wavelengths near A:= 3.1.8 em., which 1s the wavelength
used 'by Hershberger. The spread of the attenuation readings
was .5 db. for a pressure of 55 em. and .3 db. for a
pressure of 30 em.
Similar measurements made on CH3CI indicated that
any attenuation present was too small to be measured by
this a.pparatus.
The following table, which is included for reference,
gives the total absorption coefficients for a number of
gases, as measured by Hershberger at two different wave..
lengths. The listed coefficient represents the total
attenuation of the gas at atmospheric pressure and 1s ex
pressed in cm.~~ as indicated by the formUla,
0<.::: ... loge pipe
L

W aCH3:iCHaCICB3BrC~5Cl
OJm:12CBF2Cl
Cj1~12
H2S802COS(OBZ)20J
C_R 0;cr4· ,
CH3~
\CIIz) if'HC~5~
O<xl04( 'A. 3.18 elL)
15.57.65.5
4.2
8."5.2'1.20.30.0
1.1
--.-0.71.02.1
oexlo4( A III 1. 24 CDl.)
?S.G10.0
S.G6.2
15.0
10.6-12.0
3.10.3
5.0o.e3.96.8
10.5
7.0
10.2
As a result of the negative results obtained with
the 3.2 em. system, the 1.2 em. system was constructed
and although it is not as sensitive as the first,
lines from the inversion spectrum of SJmIlonia were observed.
The region cover.at-by this system extended from 22,500
megacycles to 24,600 megacycles. A total of 14 lines
were observed 1n this region in agreement with GoodlO•
These lines together with those reported by Good are
plotted 1n Fig. lOb. The numbers over·each line in this
figure give the J and K values assigned ~ Good. The relative
intensity measurements for the lines found are only
approximate due to the wide variation of sensitivity over
the band.

Pressure in mm. Hg.
·~.025
Fig. 10a
NH3 SPECTRUH(Pressure = .06 Mm. Hg)
Observed Lines
Lines reportedby Good
•
.2
db/m..1
23 24 x 109cycles/sec.
Fig, lOb
The variation of line width with pressure was also
observed and is Shown for the case of the 3,3 line in
Fig. lOa.
CONCLUSIONS
On the basis of the results obtained, it is not
possible to make any definite statements as to the
reasons for the failure to detect rotation spectra.
Unfortunately, since the numerous adjustments which must
be made to the apparatus during its operation are time
eonswming, relatively few gases have been tried. The
theoretical methods of predicting the location of absorp
tion lines in the microwave region are lacking in accura.cy
for all but the simplest molecules and, for the 3 em.
region, probably ha.ve' little advantage over the experi
mental method due to HerShbergerl8,19. As far as is
known, the latter method has not yet produce4 any results
applicable to the 3 em. band. In the absence of such
prediction~, the systematic investigation of a large number
of molecules 1s a logical a.pproach to the problem. However,
in order that confidence may be had in the success of
such an investigation, some consideration must be given
to the sensitiVity requirement of the apparatu8 used.
JUdging from published photographs, the intensities
of the aDsorption linea in the inversion spectrum of
ammonia would appear to be much greater than those of the
pure rotational lines which .have been observed in the one

centimetre band. Certainly the sensitivity of the' one
centimetre apparatus now being used by the various
investigators in this field is much greater than that
necessary to detect the ammonia lines. For example,
Townes and Merritt have reported25 a~ absorption line,
which, at the pressure used, gave an attenuation of about
5xlO·' dh(metre. The weakest observed line in the in
version spectrum of ammonia gives an attenuation of about
.01 db./metre.
The intensity of a rotational absorption line is
proportional to its frequency~: the population of the energy
levels concerned in the transition and is a function of the
dipole moment of the molecule. The first two factors
favour the investigation of molecules at the shorter wave
length ( A • 1.2 em.). Thus, (disregarding the possible
occurrence of a ve~ large dipole moment in a particular
molecule) a sensitivity requirement is indicated for the
3 em. region, at least as large as that required for the
1 cm. region.
The predicted line intensities for H2O and similar
molecules given 'by King, Hainer and Cross24 indicate that
for work on molecules of this type, in the microwave
region, a sensitivity at least a thollsand times as great
as that of the present apparatus is required.
In view of the consider~tionsmentioned above it is
felt that if rotation spectra in the 3 cm. region is to
-50-
be studied a substantial increase in sensitivity over
that of the present apparatus will be found desirable,
if not essential.
An increase in sensitivity could be obtained by
refinements to the present apparatus or by the use of
new methods of approaoh to the problem. An apparatus
Jiescr1bed by HUghes and Wilson33 Is in the latter category.
This apparatus applies a high frequenoy voltage to an
electrode placed in the centre of the waveguide. The
resulting Stark effect produces modulation of any absorption
lInes present. The output is then ~plified by meansof
a tuned amplifier.
The sensitivity of the present system is limited by
the frequency sensitivity of the various waveguide
components, which in turn limits the usable amplifier
gain. Careful study of the design characteristics of wide
band waveguide components might produce components whioh
would allow an amplifier ~f higher gain to be used. On
the other hand, Gordy and Kesslerl ? have mentioned a
single ended system of high sensitivity which makes use
of a very low rate of sweep and a high-pass filter,
between the detector and the amplifier, ..m.ioh discriminates
against both the variations of output power of the souroe
and variations in the detected output due to the frequency
sensitivity of components. The cut-off point of the filter
is thus fixed so as to allow only those components of the

-51..
detector output which are actually due to absorption
lines to pass to the am~lifier. While their claim, that
the system is inherently more sensitive than a double
ended system is open to criticism, it is possible that
a combination of a double~ended system and a high pass
filter would prove satisfactory. In this case, the
maximum frequency which the filter should not pass would
be twice that .for the single-ended case, but the amplitude
of the components to be attenuated would be greatly
reduced. In addition, the filter could be inserted
between the subtraction circuli t and the amplifier thuB
utilizing the gain of the subtraction c ircui t to offset
the insertion loss of th~ filter.

BIELIOGP.A:PHY
1.
5.
6.
7.8.9.
10.11.
12.
13.14.
15.
16.17.18.19.
20.
21.
22.
23.
24.
26.27.28.
29.30.
31.32.33.
Herzberg:" Molecular S:pectita and Molecular structure I(Diatomic ]1FolecUl~, p. 198 :ff.
~Wright and H.M. Randall, Phys. Rev., ~4. ~. 391, (1933).Hertbergi, op. cit., ~. 124.C. H. Townes, A. N. Holden and F. R. Merritt, Phys. Rev.,
11, ~. 64 (1947).C.E. Cleeton and H.H. Williams, Phys. Rev., ~ ~. 234,
(1934)C.E. Cleeton and N.H. Williams, Phye. Rev., 44, p. 421,
(1933)Sheng, Barker, Dennison, Fhys. Rey., 60, p. 786, (1941).C.H. Townes, Phys. Rev., 7p, p. 665, tr946).B. Bleaney and R.P. Penrose, Nature, 157, p. 339, (March
1946) •W.E. Good, Phys. Rev., 22"p. 213, (1946).M.W.P. Strandberg, R. Kyhl, T. Wentik Jr., and R.E.
Hilger, Phys. Rev., 21., p.326, (1947)M.W.P. Strandberg, R. KYhl, T. Wentik &r., and R.E.
Hilger, Phya. Rev., 71. p. 639, (1947) .W.E. Good and D.E. Coles, Phys. Rev., 11, p. 383, (1947).D.P. Bailey, R.L. Kyhl, M.W.P. Strandberg and J.R. Van
V1eck and B.B. W11son Jr., Phys. Rev., 22, p. 984,(1946).
R.J'. Watts and D. Williams, Phys. Rev., 21, p. 639,(1947)
D.K. Coles ·and W.E. Good, Phys. Rev., lQ., p. 979, (194G).W. Gordy and M. Kessler, Phys. Rev., 71, p. 640, (1947).W.:o. Hershberger, Jour. App. Phys., l!, p. 495, (1946).J' .E. Walter and W. D. Hershberger, J'our. App. Phys.,
17, p. 814, (1946).T.W. Dakin, W.E. Good, and D.E. Coles, Phys. Rev., ~,
p. 560, l1946).T.W. Dakin, W.E. Good, D.E. Coles, Phys. Rev., 11.,
p. 640, (1947)C.H. Townes, A.N. Holden, J. Bardeen, F.R. Merritt,
Phys. Rev., n., p. 644, (1947).W.D. Hershberger and J. Turkevich, Phys. Rev., n., p. 554,
(1947). .G.W. King, R.M. Bainer, and P.C. Cross, Phys. Rev., 71,
p. 433, (1947). --C.H. Townes and F.R. Merritt, Phys. Rev., 70, p. 558,
(1946). --J. H. Van Vleck, Phys. Rev., 21., p. 4-25,(1947).R. Beringer, Phys. Rev., '70, p. ISl,(1946)~H.R.L:.Lamont and A.G.D. Watson, Na.ture, 158, p. 943,
(194S).J. H. Van V1.eck, Phys. Rev., !*, p. 413, (1947).C.C. Costain, "Absorption of lhcrowaves in Gases" (A Thesis
to be presented to the FaCUlty of Graduate Studies,University of Saskatchewan).
Richter, Electronics, 16, p. 112, (Nov. 1943).O. S.Puckle, !!!!!. lJ!:ses, (Cha.pmanand Hall 1943), p. 118 ff.R.B. Hughes andE.B. Wilson J'r., Phys. m., 71. p. 562,
(1947).


![…MODEL ROLE STRESSOR… [R.T. HAMDANI, S.NG]](https://static.fdocuments.net/doc/165x107/6157d301ce5a9d02d46f7dcb/model-role-stressor-rt-hamdani-sng.jpg)