rsos.royalsocietypublishing.org N-dopedgraphene...
12
rsos.royalsocietypublishing.org Research Cite this article: Ben Aoun S. 2017 Nanostructured carbon electrode modified with N-doped graphene quantum dots–chitosan nanocomposite: a sensitive electrochemical dopamine sensor. R. Soc. open sci. 4: 171199. http://dx.doi.org/10.1098/rsos.171199 Received: 22 August 2017 Accepted: 11 October 2017 Subject Category: Chemistry Subject Areas: analytical chemistry/nanotechnology/physical chemistry Keywords: electrochemical sensor, graphene quantum dots, chitosan, screen printed carbon electrode, dopamine Author for correspondence: Sami Ben Aoun e-mail: [email protected] This article has been edited by the Royal Society of Chemistry, including the commissioning, peer review process and editorial aspects up to the point of acceptance. Nanostructured carbon electrode modified with N-doped graphene quantum dots–chitosan nanocomposite: a sensitive electrochemical dopamine sensor Sami Ben Aoun Department of Chemistry, Faculty of Science, Taibah University, PO Box 30002, Al-Madinah Al-Munawarah, Kingdom of Saudi Arabia SBA, 0000-0001-9026-4779 A highly selective and sensitive dopamine electrochemical sensor based on nitrogen-doped graphene quantum dots– chitosan nanocomposite-modified nanostructured screen printed carbon electrode is presented, for the first time. Graphene quantum dots were prepared via microwave- assisted hydrothermal reaction of glucose, and nitrogen doping was realized by introducing ammonia in the reaction mixture. Chitosan incorporation played a significant role towards the selectivity of the prepared sensor by hindering the ascorbic acid interference and enlarging the peak potential separation between dopamine and uric acid. The proposed sensor’s performance was shown to be superior to several recently reported investigations. The as-prepared CS/N,GQDs@SPCE exhibited a high sensitivity (i.e. ca. 418 μA mM cm −2 ), a wide linear range i.e. (1–100 μM) and (100–200 μM) with excellent correlations (i.e. R 2 = 0.999 and R 2 = 1.000, respectively) and very low limit of detection (LOD = 0.145 μM) and limit of quantification (LOQ = 0.482 μM) based on S/N = 3 and 10, respectively. The applicability of the prepared sensor for real sample analysis was tested by the determination of dopamine in human urine in pH 7.0 PBS showing an approximately 100% recovery with RSD < 2% inferring both the practicability and reliability of CS/N,GQDs@SPCE. The proposed sensor is endowed with high reproducibility (i.e. RSD = ca. 3.61%), 2017 The Authors. Published by the Royal Society under the terms of the Creative Commons Attribution License http://creativecommons.org/licenses/by/4.0/, which permits unrestricted use, provided the original author and source are credited. on June 2, 2018 http://rsos.royalsocietypublishing.org/ Downloaded from
Transcript of rsos.royalsocietypublishing.org N-dopedgraphene...

rsos.royalsocietypublishing.org
ResearchCite this article: Ben Aoun S. 2017Nanostructured carbon electrode modifiedwith N-doped graphene quantumdots–chitosan nanocomposite: a sensitiveelectrochemical dopamine sensor. R. Soc. opensci. 4: 171199.http://dx.doi.org/10.1098/rsos.171199
Received: 22 August 2017Accepted: 11 October 2017
Subject Category:Chemistry
Subject Areas:analytical chemistry/nanotechnology/physicalchemistry
Keywords:electrochemical sensor, graphene quantumdots, chitosan, screen printed carbonelectrode, dopamine
Author for correspondence:Sami Ben Aoune-mail: [email protected]
This article has beeneditedby theRoyal Societyof Chemistry, including the commissioning,peer review process and editorial aspects up tothe point of acceptance.
Nanostructured carbonelectrode modified withN-doped graphenequantum dots–chitosannanocomposite: a sensitiveelectrochemicaldopamine sensorSami Ben AounDepartment of Chemistry, Faculty of Science, Taibah University, PO Box 30002,Al-Madinah Al-Munawarah, Kingdom of Saudi Arabia
SBA, 0000-0001-9026-4779
A highly selective and sensitive dopamine electrochemicalsensor based on nitrogen-doped graphene quantum dots–chitosan nanocomposite-modified nanostructured screenprinted carbon electrode is presented, for the first time.Graphene quantum dots were prepared via microwave-assisted hydrothermal reaction of glucose, and nitrogen dopingwas realized by introducing ammonia in the reaction mixture.Chitosan incorporation played a significant role towards theselectivity of the prepared sensor by hindering the ascorbicacid interference and enlarging the peak potential separationbetween dopamine and uric acid. The proposed sensor’sperformance was shown to be superior to several recentlyreported investigations. The as-prepared CS/N,GQDs@SPCEexhibited a high sensitivity (i.e. ca. 418 µA mM cm−2), a widelinear range i.e. (1–100 µM) and (100–200 µM) with excellentcorrelations (i.e. R2 = 0.999 and R2 = 1.000, respectively) andvery low limit of detection (LOD = 0.145 µM) and limit ofquantification (LOQ = 0.482 µM) based on S/N = 3 and 10,respectively. The applicability of the prepared sensor for realsample analysis was tested by the determination of dopaminein human urine in pH 7.0 PBS showing an approximately100% recovery with RSD < 2% inferring both the practicabilityand reliability of CS/N,GQDs@SPCE. The proposed sensoris endowed with high reproducibility (i.e. RSD = ca. 3.61%),
2017 The Authors. Published by the Royal Society under the terms of the Creative CommonsAttribution License http://creativecommons.org/licenses/by/4.0/, which permits unrestricteduse, provided the original author and source are credited.
on June 2, 2018http://rsos.royalsocietypublishing.org/Downloaded from

2
rsos.royalsocietypublishing.orgR.Soc.opensci.4:171199
................................................excellent repeatability (i.e. ca. 0.91% current change) and a long-term stability (i.e. ca. 94.5%retained activity).
1. IntroductionDopamine is among the very important neurotransmitters ensuring inter-neuronal communicationin the human central nervous system [1]. It is vital to many neuronal functions like memory,learning, cognition, behaviour, attention, emotion and movement [2]. Abnormal response of dopaminemay cause several diseases like epilepsy, schizophrenia, Parkinson’s disease and senile dementia[2–4]. This explains the huge efforts deployed during the last three decades for the determination ofdopamine using a great deal of techniques including fluorescence spectrometry [5], high performanceliquid chromatography [6], capillary electrophoresis [7], UV-visible spectrophotometry [8], liquidchromatography-electrospray tandem mass spectrometry [9] and enzymatic methods [10]. Due toits fascinating electroactivity [11], dopamine determination has been extensively studied by variouselectrochemical methods [12]. Although the latter are sensitive, rapid, simple and cost-effective, theirmajor drawback lies in the interference of uric acid and ascorbic acid that always coexist withdopamine in biological fluids, with the oxidation potentials of all three being actually very similar[2,13]. Moreover, these interfering species might cause poor reproducibility and selectivity if theiroxidation products accumulate on the electrode surface resulting in its fouling [14]. Several attemptshave been made to overcome this problem through utilization of several materials like gold nanoparticles[15], gold nanoparticles–polyaniline [16], carbon nanotubes [17], graphene [18] and others. Despitethe successful sensing of dopamine using these materials overcoming the selectivity issue, otherconcerns pertain to sensitivity, lack of easy synthesis protocol and elevated cost. The real challengeis therefore to develop a sensor that is not only reliable, selective and sensitive, but also economicaland practical.
Graphene quantum dots (GQDs) emerged recently as a new class of carbon nanomaterial having‘hybrid’ characteristics of carbon and graphene [19]. They are zero-dimensional closely packedhoneycomb graphene nanosheets below 100 nm in size [3]. Additionally, GQDs are endowed withhigh water solubility, good biocompatibility, low toxicity and excellent electrical conductivity [20,21].Based on these outstanding properties, GQDs have been applied in various fields such as batteries andcapacitors [22], photovoltaics [23], bioimaging [24], drug delivery [25], photocatalysis [26], and chemical,electrochemical and biosensors [27–30]. Nevertheless, GQDs sensitivity and selectivity issues remain agreat challenge in the field of sensor applications [31].
Recent works reported that doping with heteroatoms was shown to be a very effective approach in thequest to improve GQDs intrinsic properties, for instance the chemical stability, electrical conductivity andelectrocatalytic activity [32,33]. The nitrogen atom, with its comparable number of valence electrons andsize with carbon, has been extensively used to prepare nitrogen-doped graphene quantum dots [34,35].Excellent electrocatalytic activities were obtained, such as in the case of oxygen reduction reaction [36]and H2O2 reduction [37].
Two main approaches were developed for the preparation on GQDs: top-down and bottom-up. Theformer involves a nanosize carving of carbon materials via chemical or physical routes [38,39], while thelatter is based on the carbonization of an organic precursor by means of a thermal treatment [40]. Byfar, the bottom-up approach is more advantageous as it allows precise control of size and morphology[41] in addition to the ease of operation, low cost, higher aqueous solubility and purity [42]. Recently,microwave-assisted pyrolysis has been introduced as a rapid, facile, energy-efficient and economicmethod for the nitrogen-doped graphene quantum dots preparation [43–45].
Screen printed electrodes emerged in the last few years as a new technology for the preparationof electrochemical detection electrodes with high reproducibility. Carbon screen printed electrodes, ascheap and easy to fabricate materials, constitute the major part of prepared and investigated electrodes,so far. Some very interesting results were obtained upon their surface modification, like noble metals,inorganic nanocomposites and enzymes [46–48].
In the present work, a nanocomposite made of chitosan and microwave-assisted nitrogen-dopedgraphene quantum dots will be used as a surface modifier of a screen printed nanostructured carbonelectrode. The synthesized nanocomposite is characterized by morphological and spectrophotometrytechniques. The prepared electrochemical platform will be investigated as a potential dopamine sensorusing cyclic and differential pulse voltammetries and the evaluated electrochemical sensor parameters
on June 2, 2018http://rsos.royalsocietypublishing.org/Downloaded from
3
rsos.royalsocietypublishing.orgR.Soc.opensci.4:171199
................................................will be assessed against previously reported works in the literature. Finally, real sample analysis will becarried out in order to judge the applicability of the presented sensor, and its repeatability, reproducibilityand stability characteristics will be investigated.
2. Material and methods2.1. Chemicals and materialsChitosan, dopamine (≥98%), ascorbic acid (≥99%) and uric acid (≥99%) were purchased from Sigma-Aldrich (www.sigmaaldrich.com). Potassium ferrocyanide (≥98%) and potassium ferricyanide (≥99%)were obtained from BDH Chemicals Ltd. (www.bdhme.com). Potassium chloride (≥99%), hydrochloricacid (37%) and ammonia (30%) were purchased from Panreac (www.panreac.com). Sulphuric acid(≥36%) was purchased from Tedia Inc. (www.tedia.com). Acetic acid glacial (≥99.5%) was obtained fromADWIC (www.nasrpharma.com). D-Glucose anhydrous was purchased from Techno Pharmchem (www.technopharmchem.com).
All solutions were prepared with ultrapure water (18.2 MΩ cm) from a Milli-Q water purificationsystem, Millipore (www.merckmillipore.com).
A screen printed three-electrode system (SPCE) from Orion High Technologies (www.orion-hitech.com) comprising a nanostructured carbon working electrode (φ = 4 mm), a Ag|AgCl reference electrodeand a carbon counter electrode was employed in all electrochemical measurements.
2.2. Quantum dots preparationIn a typical synthesis protocol, 2 g glucose was dissolved in 20 ml of a four times diluted ammoniasolution then transferred into a Discover SP microwave synthesizer, CEM Corp. (www.cem.com) andirradiated under 300 W for 5 min. The solution colour changes from colourless to light brown indicatingthe formation of nitrogen-doped graphene quantum dots which will be denoted as N,GQDs in thiswork. The same experiment was repeated in the absence of ammonia for comparison and the preparedgraphene quantum dots are denoted as GQDs in this case.
2.3. Graphene quantum dots–chitosan nanocomposite preparationAn adequate amount of chitosan (CS) was dissolved in 1% acetic acid solution in order to prepare a 0.5%CS solution in 1% acetic acid, which was subsequently stirred for 2 h until a clear solution was obtained.Then 1 ml of this CS solution was mixed with 1 ml of the as-prepared N,GQDs solution and stirred for afurther hour, resulting in the formation of CS/N,GQDs nanocomposite solution.
2.4. Electrochemical sensor preparationThe SPCE was rinsed with Milli-Q water, and then electrochemically cleaned by repetitive potentialcycling in a 0.5 M H2SO4 solution at 100 mV s−1 scan rate between −1 V and 1 V. The SCPE was thendried under high purity nitrogen atmosphere and 10 µl of the CS/N,GQDs nanocomposite was drop-casted onto the working electrode surface and dried for 1 h at 40°C. The obtained CS/N,GQDs@SPCEwas thoroughly washed with a copious amount of Milli-Q water then dried under high purity nitrogenatmosphere.
2.5. Electrochemical measurementsA computer-controlled Autolab PGSTAT 128N potentiostat/galvanostat (www.metrohm-autolab.com)was used in all electrochemical experiments that were conducted in a miniaturized 4 ml electrochemicalcell. All potentials are reported with respect to the Ag|AgCl reference electrode.
Cyclic voltammetry (CV) measurements were conducted in unstirred, air-saturated conditions andfurther specific experimental details will be given when appropriate. Electrochemical impedancespectroscopy (EIS) experiments were realized using the integrated FR32 frequency response analyseremploying a single sine wave with 10−2 V amplitude and a maximum integration time of 0.125 s whilemaintaining the potential at 200 mV and scanning the frequency in the interval 5 × 10⁻² Hz–105 Hz. Asfor differential pulse voltammetry (DPV) measurements, the potential was scanned at a rate of 50 mV s−1
with 50 mV modulation amplitude, 5 mV step potential and 50 ms modulation time.
on June 2, 2018http://rsos.royalsocietypublishing.org/Downloaded from

4
rsos.royalsocietypublishing.orgR.Soc.opensci.4:171199
................................................
3.7 nm
3.3 nm
100 nm
Figure 1. TEM image of the prepared N,GQDs.
2.6. Characterization techniquesMorphological characterization was conducted using a JEM-1400 transmission electron microscope(TEM), JEOL Co. (www.jeol.co.jp), operating at acceleration voltage of 98 kV. The spectroscopiccharacterization was done by recording the absorbance spectra with an Evolution 201 UV-visiblespectrophotometer, Thermofisher Scientific Inc. (www.thermofisher.com), and the photoluminescence(PL) spectra were measured by means of an RF-5301PC spectrofluorophotometer from ShimadzuScientific Instruments (www.ssi.shimadzu.com).
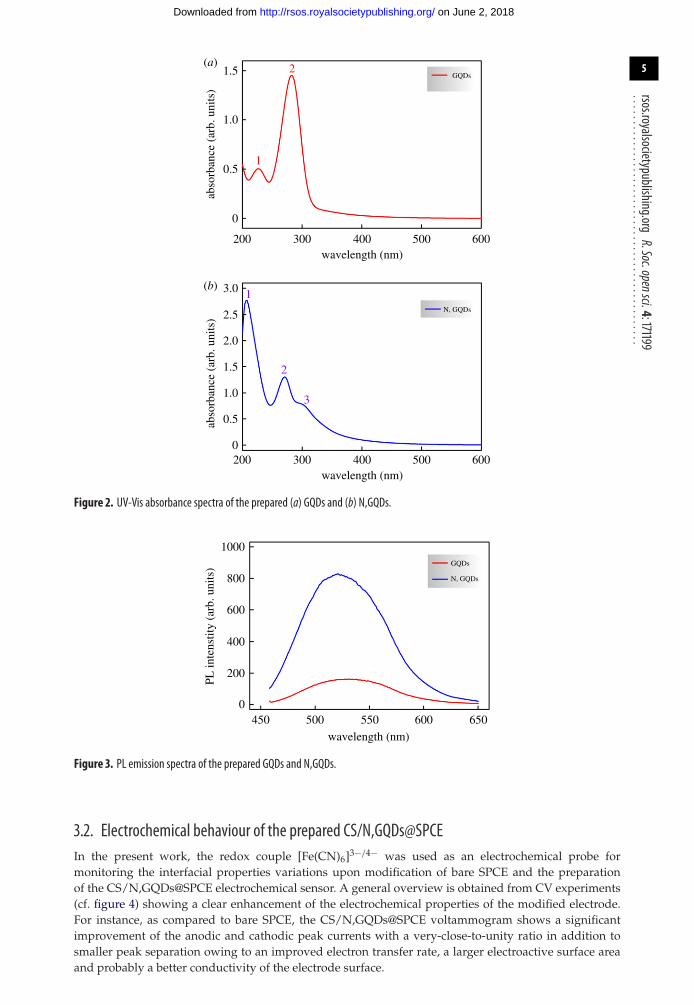
3. Results and discussion3.1. N,GQDs characterizationThe prepared quantum dots showed a monodispersed, spherical shape with a size ranging betweenapproximately 3 and 4 nm as revealed from the TEM image shown in figure 1 which is in the typicalrange of nitrogen-doped graphene quantum dots [49].
On the other hand, the formation of graphene quantum dots is further confirmed by UV-Vis spectra(cf. figure 2a) showing two absorbance peaks at 227 nm and 383 nm, typical of an aromatic system,associated to π → π* and n → π* electron transitions of C=C and C=O, respectively [50,51]. Moreover,the successful nitrogen incorporation into the graphene quantum dots matrix is also confirmed byinspection of the spectra shown in figure 2b, exhibiting three adsorption peaks. The first two situatedat 207 nm and 271 nm are respectively ascribed to π/n → π* electron transitions of C=C and C=O whilethe third one occurring at 302 nm corresponds to the C=N π → π* electron transition [52,53].
It is very well reported in the literature that an enhanced photoluminescence of nitrogen-dopedgraphene quantum dots is exhibited compared with their nitrogen-free counterparts [54,55], therefore theprepared GQDs and N,GQDs PL spectra were recorded and results are shown in figure 3. The presenteddata are for the maximum emission that was obtained with an excitation wavelength λex = 450 nm. Thedrastically increased photoluminescence (blue line) confirms again the successful nitrogen doping of theprepared quantum dots. It is noteworthy that figure 3 shows a PL emission’s 10 nm blue shift for theN,GQDs compared to GQDs (i.e. emission peak shift from 531 to 521 nm) attributable to the increasedelectron affinity upon incorporation of nitrogen atoms [56].
on June 2, 2018http://rsos.royalsocietypublishing.org/Downloaded from
5
rsos.royalsocietypublishing.orgR.Soc.opensci.4:171199
................................................1.5
(a)
(b)
1.0
0.5
0
0
0.5
1.0
1.5
2.0
2.5
3.0 1
1
2
2
3
200 300 400 500 600
abso
rban
ce (
arb.
uni
ts)
abso
rban
ce (
arb.
uni
ts)
wavelength (nm)
200 300 400 500 600wavelength (nm)
N, GQDs
GQDs
Figure 2. UV-Vis absorbance spectra of the prepared (a) GQDs and (b) N,GQDs.
0
200
400
600
800
1000
PL in
tens
tity
(arb
. uni
ts)
450 500 550
wavelength (nm)
600 650
N, GQDs
GQDs
Figure 3. PL emission spectra of the prepared GQDs and N,GQDs.
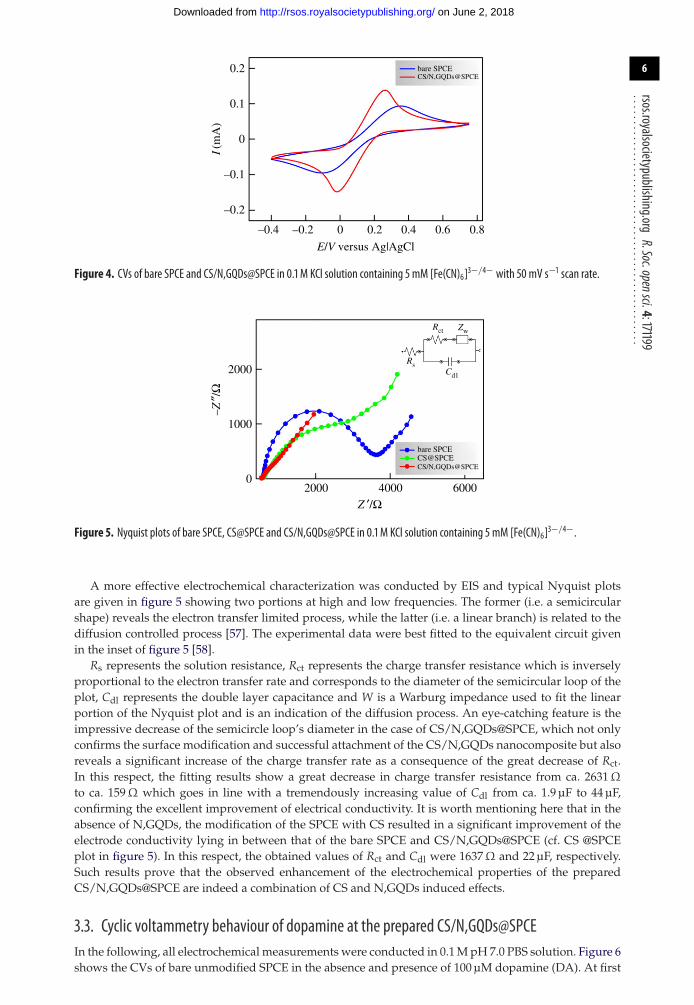
3.2. Electrochemical behaviour of the prepared CS/N,GQDs@SPCEIn the present work, the redox couple [Fe(CN)6]3−/4− was used as an electrochemical probe formonitoring the interfacial properties variations upon modification of bare SPCE and the preparationof the CS/N,GQDs@SPCE electrochemical sensor. A general overview is obtained from CV experiments(cf. figure 4) showing a clear enhancement of the electrochemical properties of the modified electrode.For instance, as compared to bare SPCE, the CS/N,GQDs@SPCE voltammogram shows a significantimprovement of the anodic and cathodic peak currents with a very-close-to-unity ratio in addition tosmaller peak separation owing to an improved electron transfer rate, a larger electroactive surface areaand probably a better conductivity of the electrode surface.
on June 2, 2018http://rsos.royalsocietypublishing.org/Downloaded from
6
rsos.royalsocietypublishing.orgR.Soc.opensci.4:171199
................................................0.2
–0.2
0.1
–0.1
0
–0.4 –0.2 0 0.2 0.4 0.6 0.8
E/V versus Ag|AgCl
I(m
A)
bare SPCECS/N,GQDs@SPCE
Figure 4. CVs of bare SPCE and CS/N,GQDs@SPCE in 0.1 M KCl solution containing 5 mM [Fe(CN)6]3−/4− with 50 mV s−1 scan rate.
0
2000
1000
2000
bare SPCECS@SPCECS/N,GQDs@SPCE
4000 6000
–Z≤/
W
Z ¢/W
Rct
Rs
Zw
Cd1
Figure 5. Nyquist plots of bare SPCE, CS@SPCE and CS/N,GQDs@SPCE in 0.1 M KCl solution containing 5 mM [Fe(CN)6]3−/4−.
A more effective electrochemical characterization was conducted by EIS and typical Nyquist plotsare given in figure 5 showing two portions at high and low frequencies. The former (i.e. a semicircularshape) reveals the electron transfer limited process, while the latter (i.e. a linear branch) is related to thediffusion controlled process [57]. The experimental data were best fitted to the equivalent circuit givenin the inset of figure 5 [58].
Rs represents the solution resistance, Rct represents the charge transfer resistance which is inverselyproportional to the electron transfer rate and corresponds to the diameter of the semicircular loop of theplot, Cdl represents the double layer capacitance and W is a Warburg impedance used to fit the linearportion of the Nyquist plot and is an indication of the diffusion process. An eye-catching feature is theimpressive decrease of the semicircle loop’s diameter in the case of CS/N,GQDs@SPCE, which not onlyconfirms the surface modification and successful attachment of the CS/N,GQDs nanocomposite but alsoreveals a significant increase of the charge transfer rate as a consequence of the great decrease of Rct.In this respect, the fitting results show a great decrease in charge transfer resistance from ca. 2631 Ω
to ca. 159 Ω which goes in line with a tremendously increasing value of Cdl from ca. 1.9 µF to 44 µF,confirming the excellent improvement of electrical conductivity. It is worth mentioning here that in theabsence of N,GQDs, the modification of the SPCE with CS resulted in a significant improvement of theelectrode conductivity lying in between that of the bare SPCE and CS/N,GQDs@SPCE (cf. CS @SPCEplot in figure 5). In this respect, the obtained values of Rct and Cdl were 1637 Ω and 22 µF, respectively.Such results prove that the observed enhancement of the electrochemical properties of the preparedCS/N,GQDs@SPCE are indeed a combination of CS and N,GQDs induced effects.
3.3. Cyclic voltammetry behaviour of dopamine at the prepared CS/N,GQDs@SPCEIn the following, all electrochemical measurements were conducted in 0.1 M pH 7.0 PBS solution. Figure 6shows the CVs of bare unmodified SPCE in the absence and presence of 100 µM dopamine (DA). At first
on June 2, 2018http://rsos.royalsocietypublishing.org/Downloaded from

7
rsos.royalsocietypublishing.orgR.Soc.opensci.4:171199
................................................4
–4
2
–2
0
–0.2 0
100 µM DAblank
100 µM UA100 µM (DA + AA + UA)
100 µM AA
0.2 0.4
E/V versus Ag|AgCl
I(µA
)
Figure 6. CVs of bare SPCE in 0.1 M PBS solution in the absence and presence of dopamine (DA), ascorbic acid (AA), uric acid (UA) and amixture of (DA+ AA+ UA), 100 µM each, with 100 mV s−1 scan rate.
Scheme 1. The redox reaction of dopamine to/from dopamine-o-quinone.
4
–4
2
–2
0
–0.2 0
100 µM DAblank
100 µM UA100 µM (DA + AA + UA)
100 µM AA
0.2 0.4
E/V versus Ag|AgCl
I(µA
)
E/V versus Ag|AgCl
I(µA
)
–0.2 –0.1 0 0.1 0.2 0.3 0.4
4
–4
2
–2
0
Figure 7. CVs with 100 mV s−1 scan rate of CS/N,GQDs@SPCE in 0.1 M PBS solution in the absence and presence of DA, AA, UA and amixture of (DA+ AA+ UA), 100 µM each, with an inset showing the comparison of CS@SPE (blue) and CS/N,GQDs@SPCE (red).
sight, this nanostructured electrode seems to perform quite well with the appearance of well-definedpeaks for the oxidation and reduction of DA as per the reaction equation outlined in scheme 1. Dopamineis oxidized during the positive going scan to dopamine-o-quinone and the latter is reduced back todopamine in the course of the negative going scan.
This nice-looking CV is completely altered upon addition of 100 µM uric acid (UA) and/or ascorbicacid (AA). Knowing that these are the most common species interfering with DA [59], this representsa serious drawback when it comes to DA sensing in body fluids. Although UA itself shows almost noredox behaviour in the present work conditions and AA shows insignificant oxidation current at the bareSPCE (cf. figure 6), their presence with DA results in a huge decrease of both oxidation and reductioncurrents which would lead to erroneous DA detection.
On the other hand, when SPCE was modified with the prepared CS/N,GQDs nanocomposite, a totallydifferent behaviour was observed as displayed in figure 7. In detail, AA redox reaction is completelyhindered against a clear improvement of DA both anodic and cathodic currents in addition to a nicepeak separation of DA and UA. The observed change in electrochemical activities can be explained
on June 2, 2018http://rsos.royalsocietypublishing.org/Downloaded from

8
rsos.royalsocietypublishing.orgR.Soc.opensci.4:171199
................................................
4
3
2
1
0
–0.2 0
100 µM DAblank
100 µM UA100 µM (DA + AA + UA)
100 µM AA
0.2 0.4 0.6
E/V versus Ag|AgCl
I(µA
)
Figure 8. DPVs of CS/N,GQDs@SPCE in 0.1 M PBS solution in the absence and presence of 100µM DA, 100 µM AA, 100µM UA and amixture of (DA+ AA+ UA), 100µM each.
by the following two synergistic phenomena brought about by the modification of the SPCE surfacewith the as-prepared CS/N,GQDs nanocomposite. (i) The electrostatic repulsion/attraction induced bychitosan. For instance, in pH 7.0 PBS, CS (pKa = 6.3), AA (pKa = 4.1) and UA (pKa = 5.8) are negativelycharged while DA (pKa = 8.9) is positively charged [60,61]. This would lead to a mutual electrostaticattraction between DA and CS in contrast to an electrostatic repulsion between CS-UA and CS-AA [61],the latter being perhaps stronger, most probably due to larger pKa values difference (i.e. 2.2 versus 0.5).(ii) A significantly different π–π interaction between the sp2 conjugated carbon–carbon bonds in GQDsand their counterparts in DA, UA and AA. Arranging these π–π interactions in an increasing order ofstrength would be GQDs-AA < GQDs-UA < GQDs-DA according to the respective structures of thesecompounds. For instance, the strongest π–π interaction in the case of GQDs-DA is due to the phenylmoiety of DA while the weakest is expected for GQDs-AA since AA structure comprises less π bondscompared to UA [62].
This synergy is supported by comparison of the CVs of CS@SPE and CS/N,GQDs@SPCE shownin the inset of figure 7. We can clearly notice the significant enhancement of DA redox peaks atCS/N,GQDs@SPCE that are otherwise hardly noticeable in the case of CS@SPE due to interfering UAand AA. This comes in addition to a distinguishable oxidation peak separation of DA and UA.
3.4. Dopamine electrochemical sensing performance at the prepared CS/N,GQDs@SPCEFurther investigations were carried out in the quest for a possible electrochemical sensing applicationof the as-prepared CS/N,GQDs@SPCE. For this, DPV was used as a fast, effective and a more sensitiveelectrochemical technique compared to CV [63].
Figure 8 shows the DPV results of the as-prepared CS/N,GQDs@SPCE for the same electrolyticcomposition as in the previous section with a narrow focusing on the oxidative voltammograms onlyas per the discussed CV data. One can clearly notice the complete hindrance of AA oxidation current(i.e. nearly identical to the blank) and the very well defined peaks for both DA and UA oxidation thatare clearly separated (i.e. �Ep = ca. 171 mV). Interestingly, when all three analytes are present together,DA peak current retained its original value (i.e. ca. 0.4% change) while the peak potential shifted to lessanodic values against an opposite shift of UA peak resulting in ca. 46 mV enlargement of the peak-to-peak separation (i.e. reaching ca. 217 mV). On the other hand, the peak current for UA oxidationdecreased noticeably (i.e. ca. 12%) in the presence of interfering DA and AA. The obtained results revealthe high selectivity of the prepared system to DA, which is of prime importance for electrochemicalsensing.
The second wing of the sensor is the sensitivity, which is evaluated through determining therelationship between the DA concentration and the DPV peak current in an extended concentrationrange. The obtained data are shown in figure 9 in the concentration range 1–200 µM, exhibiting a steadypeak current increase with increasing DA concentrations.
Plotting the extracted values of peak current as a function of DA concentration gives straight linesin the ranges 1–100 µM and 100–200 µM with excellent correlations (i.e. R2 = 0.999 and R2 = 1.000,respectively) as shown in figure 10. From the slope of the first linear branch, the sensitivity (S) was
on June 2, 2018http://rsos.royalsocietypublishing.org/Downloaded from

9
rsos.royalsocietypublishing.orgR.Soc.opensci.4:171199
................................................8
6
4
2
0–0.2 0
200 µM
1 µM
0.2 0.4 0.6
E/V versus Ag|AgCl
I(µA
)
Figure 9. DPVs of CS/N,GQDs@SPCE in 0.1 M PBS solution in the presence of increasing concentrations of DA.
8
6
4
2
0 50 100
DA (µM)
I(µA
)
150 200
Figure 10. Variations of DPV peak currents with DA concentrations as extracted from figure 9.
Table 1. Comparison of the prepared DA electrochemical sensor’s performance to recent literature.
electrode linear range (μM) detection limit (μM) reference
GN/PANI/Au/GCE 0.07–1.05 and 1.47–5.24 0.024 [64]. . . . . . . . . . . . . . . . . . . . . . . . . . . . . . . . . . . . . . . . . . . . . . . . . . . . . . . . . . . . . . . . . . . . . . . . . . . . . . . . . . . . . . . . . . . . . . . . . . . . . . . . . . . . . . . . . . . . . . . . . . . . . . . . . . . . . . . . . . . . . . . . . . . . . . . . . . . . . . . . . . . . . . . . . . . . . . . . . . . . . . . . . . . . . . . . . . . . . . . . . . . . . . . . . . . . . . . . .
AgNP/SiO2/GO/GCE 2–80 0.26 [65]. . . . . . . . . . . . . . . . . . . . . . . . . . . . . . . . . . . . . . . . . . . . . . . . . . . . . . . . . . . . . . . . . . . . . . . . . . . . . . . . . . . . . . . . . . . . . . . . . . . . . . . . . . . . . . . . . . . . . . . . . . . . . . . . . . . . . . . . . . . . . . . . . . . . . . . . . . . . . . . . . . . . . . . . . . . . . . . . . . . . . . . . . . . . . . . . . . . . . . . . . . . . . . . . . . . . . . . . .
F-CuInS2 QDs 0.5–40 0.2 [66]. . . . . . . . . . . . . . . . . . . . . . . . . . . . . . . . . . . . . . . . . . . . . . . . . . . . . . . . . . . . . . . . . . . . . . . . . . . . . . . . . . . . . . . . . . . . . . . . . . . . . . . . . . . . . . . . . . . . . . . . . . . . . . . . . . . . . . . . . . . . . . . . . . . . . . . . . . . . . . . . . . . . . . . . . . . . . . . . . . . . . . . . . . . . . . . . . . . . . . . . . . . . . . . . . . . . . . . . .
TC8A/Au 1–100 0.5 [67]. . . . . . . . . . . . . . . . . . . . . . . . . . . . . . . . . . . . . . . . . . . . . . . . . . . . . . . . . . . . . . . . . . . . . . . . . . . . . . . . . . . . . . . . . . . . . . . . . . . . . . . . . . . . . . . . . . . . . . . . . . . . . . . . . . . . . . . . . . . . . . . . . . . . . . . . . . . . . . . . . . . . . . . . . . . . . . . . . . . . . . . . . . . . . . . . . . . . . . . . . . . . . . . . . . . . . . . . .
AuNS/GCE 2–298 0.28 [68]. . . . . . . . . . . . . . . . . . . . . . . . . . . . . . . . . . . . . . . . . . . . . . . . . . . . . . . . . . . . . . . . . . . . . . . . . . . . . . . . . . . . . . . . . . . . . . . . . . . . . . . . . . . . . . . . . . . . . . . . . . . . . . . . . . . . . . . . . . . . . . . . . . . . . . . . . . . . . . . . . . . . . . . . . . . . . . . . . . . . . . . . . . . . . . . . . . . . . . . . . . . . . . . . . . . . . . . . .
Laccase/SiO2-PA/GCE 1–103 0.26 [69]. . . . . . . . . . . . . . . . . . . . . . . . . . . . . . . . . . . . . . . . . . . . . . . . . . . . . . . . . . . . . . . . . . . . . . . . . . . . . . . . . . . . . . . . . . . . . . . . . . . . . . . . . . . . . . . . . . . . . . . . . . . . . . . . . . . . . . . . . . . . . . . . . . . . . . . . . . . . . . . . . . . . . . . . . . . . . . . . . . . . . . . . . . . . . . . . . . . . . . . . . . . . . . . . . . . . . . . . .
CS/N,GQDs@SPCE 1–100 and 100–200 0.145 the present work. . . . . . . . . . . . . . . . . . . . . . . . . . . . . . . . . . . . . . . . . . . . . . . . . . . . . . . . . . . . . . . . . . . . . . . . . . . . . . . . . . . . . . . . . . . . . . . . . . . . . . . . . . . . . . . . . . . . . . . . . . . . . . . . . . . . . . . . . . . . . . . . . . . . . . . . . . . . . . . . . . . . . . . . . . . . . . . . . . . . . . . . . . . . . . . . . . . . . . . . . . . . . . . . . . . . . . . . .
evaluated to be S = ca. 418 µA mM−1 cm−2. On the basis of signal-to-noise ratios of 3 and 10, the limit ofdetection (LOD) and the limit of quantification (LOQ) were evaluated, respectively. The estimated valuesare LOD = 0.145 µM and LOQ = 0.482 µM.
The current electrochemical sensor performance was compared to other very recently reported results,as summarized in table 1, showing the great competitiveness of the proposed sensor.
3.5. Application to real sample analysisThe practicability of the prepared electrochemical sensor for the detection of DA in real samples wastested using urine samples from a healthy individuals. The collected samples were hundred-times
on June 2, 2018http://rsos.royalsocietypublishing.org/Downloaded from

10
rsos.royalsocietypublishing.orgR.Soc.opensci.4:171199
................................................Table 2. DA determination in urine samples at CS/N,GQDs@SPCE.
sample initial [DA] (I) added [DA] (A) found [DA] (F)recovery %(R= 100×[I+ A/F])
RSD%(3 runs)
1 not detected 30 µM 29.7 µM 99.14 0.64. . . . . . . . . . . . . . . . . . . . . . . . . . . . . . . . . . . . . . . . . . . . . . . . . . . . . . . . . . . . . . . . . . . . . . . . . . . . . . . . . . . . . . . . . . . . . . . . . . . . . . . . . . . . . . . . . . . . . . . . . . . . . . . . . . . . . . . . . . . . . . . . . . . . . . . . . . . . . . . . . . . . . . . . . . . . . . . . . . . . . . . . . . . . . . . . . . . . . . . . . . . . . . . . . . . . . . . . .
2 not detected 50 µM 50.2 µM 100.47 1.60. . . . . . . . . . . . . . . . . . . . . . . . . . . . . . . . . . . . . . . . . . . . . . . . . . . . . . . . . . . . . . . . . . . . . . . . . . . . . . . . . . . . . . . . . . . . . . . . . . . . . . . . . . . . . . . . . . . . . . . . . . . . . . . . . . . . . . . . . . . . . . . . . . . . . . . . . . . . . . . . . . . . . . . . . . . . . . . . . . . . . . . . . . . . . . . . . . . . . . . . . . . . . . . . . . . . . . . . .
diluted in PBS solution to overcome the urine matrix effect interferences [12]. Initially, no DA wasdetected, then consecutive DA additions were performed and recovery percentages were calculatedbased on the determined DA concentrations. The results are summarized in table 2. The displayedresults show very good recovery (i.e. approx. 100%) and very reasonable relative standard deviations(i.e. less than 2%), indicating a promising applicability with a good reliability of the prepared sensor forthe determination of DA in real samples.
3.6. Reproducibility, repeatability and stability of the prepared CS/N,GQDs@SPCE sensorUsing six different CS/N,GQDs@SPCE sensors revealed highly reproducible results with veryreasonable relative standard deviation (i.e. RSD = ca. 3.61%).
The prepared electrochemical sensor showed an excellent repeatability with only ca. 0.91% currentchange after twelve consecutive electrochemical runs, proving the reliability of the current signal.
We also investigated the stability and long-term reusability of the proposed dopamine sensor bymonitoring its electrochemical activity over a one-month period. The results were very impressive aswe found that the sensor retained ca. 94.5% of its peak current intensity.
4. ConclusionIn the present work, a highly selective dopamine electrochemical sensor was developed based onthe modification of a nanostructured carbon screen printed electrode with a chitosan/nitrogen-dopedgraphene quantum dots nanocomposite. The successful preparation of N,GQDs was confirmed by TEMsurface analysis and UV-Vis spectrophotometry and supported by the shown high photoluminescencecompared to N-free GQDs. Chitosan addition showed a significant impact in avoiding the commonlyreported interferences with ascorbic acid and uric acid. EIS confirmed the superior electrochemicalproperties of the prepared CS/N,GQDs@SPCE in comparison to bare SPCE. For instance there was amarked decrease of charge transfer resistance (i.e. from ca. 2631 Ω to ca. 159 Ω) and by consequence apromoted electron transfer kinetics. The high sensitivity (S = ca. 418 µA mM−1 cm−2) of the proposedsensor in addition to its low detection limit (LOD = 0.145 µM) and large dynamic range (1–200 µM) putsit in the forefront of the very recently developed dopamine sensors. In addition, real samples analysisshowed very promising results based on DA detection in urine samples with high recovery and lowrelative standard deviation percentages (i.e. approximately 100% and less than 2%, respectively).
Data accessibility. All data relevant to this work are presented throughout the paper.Competing interests. The author has no competing interests.Funding. The author received no funding for this study.Acknowledgements. The author thanks Prof. Noureddine RAOUAFI, Tunis El-Manar University, for supplying the SPCEelectrodes and some of the chemicals used in this work.
References1. Li Y, Jiang Y, Mo T, Zhou H, Li Y, Li S. 2016 Highly
selective dopamine sensor based on graphenequantum dots self-assembled monolayers modifiedelectrode. J. Electroanal. Chem. 767, 84–90.(doi:10.1016/j.jelechem.2016.02.016)
2. Wang H, Zhang J, Yuan Y, Chai Y, Yuan R. 2015 Anelectrochemiluminescence biosensor for dopaminebased on the recognition of fullerene-derivativeand the quenching of cuprous oxide nanocrystals.RSC Adv. 5, 58 019–58 023. (doi:10.1039/c5ra08555a)
3. Zhou X, Ma P, Wang A, Yu C, Qian T, Wu S,Shen J. 2014 Dopamine fluorescent sensors basedon polypyrrole/graphene quantum dotscore/shell hybrids. Biosens. Bioelectron.64, 404–410. (doi:10.1016/j.bios.2014.09.038)
4. Bi H, Li Y, Liu S, Guo P, Wei Z, Lv C, Zhang J, Zhao XS.2012 Carbon-nanotube-modified glassy carbonelectrode for simultaneous determination ofdopamine, ascorbic acid and uric acid: The effect of
functional groups. Sens. Actuators B, Chem.171–172, 1132–1140. (doi:10.1016/j.snb.2012.06.044)
5. Khattar R, Mathur P. 2013 1-(Pyridin-2-ylmethyl)-2-(3-(1-(pyridin-2-ylmethyl)benzimidazol-2-yl)propyl) benzimidazole and its copper(II) complex asa new fluorescent sensor for dopamine(4-(2-aminoethyl)benzene-1,2-diol). Inorg. Chem.Commun. 31, 37–43. (doi:10.1016/j.inoche.2013.02.015)
on June 2, 2018http://rsos.royalsocietypublishing.org/Downloaded from

11
rsos.royalsocietypublishing.orgR.Soc.opensci.4:171199
................................................6. Syslová K, Rambousek L, Kuzma M, Najmanová V,
Bubeníková-Valešová V, Šlamberová R, Kačer P. 2011Monitoring of dopamine and its metabolites inbrain microdialysates: method combiningfreeze-drying with liquid chromatography-tandemmass spectrometry. J. Chromatogr. A 1218,3382–3391. (doi:10.1016/j.chroma.2011.02.006)
7. Bouri M, Lerma-García MJ, Salghi R, Zougagh M,Ríos A. 2012 Selective extraction and determinationof catecholamines in urine samples by using adopamine magnetic molecularly imprinted polymerand capillary electrophoresis. Talanta 99, 897–903.(doi:10.1016/j.talanta.2012.07.053)
8. Feng X, Zhang Y, Yan Z, Chen N, Ma Y, Liu X, Yang X,HouW. 2013 Self-degradable template synthesis ofpolyaniline nanotubes and their high performancein the detection of dopamine. J. Mater. Chem. A 1,9775–9780. (doi:10.1039/c3ta11856h)
9. El-Beqqali A, Kussak A, Abdel-RehimM. 2007Determination of dopamine and serotonin inhuman urine samples utilizing microextractiononline with liquid chromatography/electrospraytandemmass spectrometry. J. Sep. Sci. 30, 421–424.(doi:10.1002/jssc.200600369)
10. Fritzen-Garcia MB, Monteiro FF, Cristofolini T, AcuñaJJS, Zanetti-Ramos BG, Oliveira IRWZ, Soldi V, PasaAA, Creczynski-Pasa TB. 2013 Characterization ofhorseradish peroxidase immobilized on PEGylatedpolyurethane nanoparticles and its application fordopamine detection. Sens. Actuators B, Chem. 182,264–272. (doi:10.1016/j.snb.2013.02.107)
11. Ge B, Tan Y, Xie Q, Ma M, Yao S. 2009 Preparation ofchitosan–dopamine-multiwalled carbonnanotubes nanocomposite for electrocatalyticoxidation and sensitive electroanalysis of NADH.Sens. Actuators B, Chem. 137, 547–554.(doi:10.1016/j.snb.2009.01.030)
12. Hammami A, Sahli R, Raouafi N. 2016 Indirectamperometric sensing of dopamine using aredox-switchable naphthoquinone-terminatedself-assembled monolayer on gold electrode.Microchim. Acta 183, 1137–1144. (doi:10.1007/s00604-015-1739-6)
13. Liu M, Chen Q, Lai C, Zhang Y, Deng J, Li H, Yao S.2013 A double signal amplification platform forultrasensitive and simultaneous detection ofascorbic acid, dopamine, uric acid andacetaminophen based on a nanocomposite offerrocene thiolate stabilized Fe3O4@Aunanoparticles with graphene sheet. Biosens.Bioelectron. 48, 75–81. (doi:10.1016/j.bios.2013.03.070)
14. Gonon F, Buda M, Cespuglio R, Jouvet M, Pujol JF.1980 In vivo electrochemical detection of catecholsin the neostriatum of anaesthetized rats: dopamineor DOPAC? Nature 286, 902–904. (doi:10.1038/286902a0)
15. Raj CR, Okajima T, Ohsaka T. 2003 Gold nanoparticlearrays for the voltammetric sensing of dopamine.J. Electroanal. Chem. 543, 127–133. (doi:10.1016/S0022-0728(02)01481-X)
16. Stoyanova A, Ivanov S, Tsakova V, Bund A. 2011 Aunanoparticle-polyaniline nanocomposite layersobtained through layer-by-layer adsorption for thesimultaneous determination of dopamine and uricacid. Electrochim. Acta 56, 3693–3699. (doi:10.1016/j.electacta.2010.09.054)
17. Alothman ZA, Bukhari N, Wabaidur SM, Haider S.2010 Simultaneous electrochemical determination
of dopamine and acetaminophen using multiwallcarbon nanotubes modified glassy carbonelectrode. Sens. Actuators B, Chem. 146, 314–320.(doi:10.1016/j.snb.2010.02.024)
18. Zhang F, Li Y, Gu YE, Wang Z, Wang C. 2011 One-potsolvothermal synthesis of a Cu2O/graphenenanocomposite and its application in anelectrochemical sensor for dopamine.Microchim.Acta 173, 103–109. (doi:10.1007/s00604-010-0535-6)
19. Li L, Wu G, Yang G, Peng J, Zhao J, Zhu JJ. 2013Focusing on luminescent graphene quantum dots:current status and future perspectives. Nanoscale 5,4015–4039. (doi:10.1039/c3nr33849e)
20. Zhou Y, Qu ZB, Zeng Y, Zhou T, Shi G. 2014 A novelcomposite of graphene quantum dots andmolecularly imprinted polymer for fluorescentdetection of paranitrophenol. Biosens. Bioelectron.52, 317–323. (doi:10.1016/j.bios.2013.09.022)
21. Dong Y, Pang H, Yang HB, Guo C, Shao J, Chi Y, LiCM, Yu T. 2013 Carbon-based dots co-doped withnitrogen and sulfur for high quantum yield andexcitation-independent emission. Angew. Chem.Int. Ed. 52, 7800–7804. (doi:10.1002/anie.201301114)
22. Chao D et al. 2014 Graphene quantum dots coatedVO2 arrays for highly durable electrodes for Li andNa ion batteries. Nano Lett. 15, 565–573.(doi:10.1021/nl504038s)
23. Li Y, Hu Y, Zhao Y, Shi G, Deng L, Hou Y, Qu L. 2011An electrochemical avenue to green-luminescentgraphene quantum dots as potentialelectron-acceptors for photovoltaics. Adv. Mater. 23,776–780. (doi:10.1002/adma.201003819)
24. Lu W, Qin X, Liu S, Chang G, Zhang Y, Luo Y, AsiriAM, Al-Youbi AO, Sun X. 2012 Economical, greensynthesis of fluorescent carbon nanoparticles andtheir use as probes for sensitive and selectivedetection of mercury (II) ions. Anal. Chem. 84,5351–5357. (doi:10.1021/ac3007939)
25. Ran X, Sun H, Pu F, Ren J, Qu X. 2013 Agnanoparticle-decorated graphene quantum dots forlabel-free, rapid and sensitive detection of Ag+ andbiothiols. Chem. Commun. 49, 1079–1081.(doi:10.1039/c2cc38403e)
26. Liu J et al. 2015 Metal-free efficient photocatalyst forstable visible water splitting via a two-electronpathway. Science 347, 970–974. (doi:10.1126/science.aaa3145)
27. Shi J, Chan C, Pang Y, Ye W, Tian F, Lyu J, Zhang Y,Yang M. 2015 A fluorescence resonance energytransfer (FRET) biosensor based on graphenequantum dots (GQDs) and gold nanoparticles(AuNPs) for the detection of mecA gene sequence ofStaphylococcus aureus. Biosens. Bioelectron. 67,595–600. (doi:10.1016/j.bios.2014.09.059)
28. Jiang H. 2011 Chemical preparation ofgraphene-based nanomaterials and theirapplications in chemical and biological sensors.Small 7, 2413–2427. (https://doi.org/10.1002/smll.201002352)
29. Zhao J, Chen G, Zhu L, Li G. 2011 Graphene quantumdots-based platform for the fabrication ofelectrochemical biosensors. Electrochem. Commun.13, 31–33. (doi:10.1016/j.elecom.2010.11.005)
30. Gan T, Hu S. 2011 Electrochemical sensors based ongraphene materials.Microchim. Acta 175, 1–19.(doi:10.1007/s00604-011-0639-7)
31. Dong Y, Wang R, Li H, Shao J, Chi Y, Lin X, Chen G.2012 Polyamine-functionalized carbon quantum
dots for chemical sensing. Carbon 50, 2810–2815.(doi:10.1016/j.carbon.2012.02.046)
32. Ananthanarayanan A et al. 2015 Nitrogen andphosphorus co-doped graphene quantum dots:synthesis from adenosine triphosphate, opticalproperties, and cellular imaging. Nanoscale 7,8159–8165. (doi:10.1039/c5nr01519g)
33. Fei H, Ye R, Ye G, Gong Y, Peng Z, Fan X, Samuel ELG,Ajayan PM, Tour JM. 2014 Boron- andnitrogen-doped graphene quantum dots/graphenehybrid nanoplatelets as efficient electrocatalysts foroxygen reduction. ACS Nano 8, 10 837–10 843.(doi:10.1021/nn504637y)
34. Chen P, Xiao TY, Qian YH, Li SS, Yu SH. 2013 Anitrogen-doped graphene/carbon nanotubenanocomposite with synergistically enhancedelectrochemical activity. Adv. Mater. 25, 3192–3196.(doi:10.1002/adma.201300515)
35. Wei W, Liang H, Parvez K, Zhuang X, Feng X, MüllenK. 2014 Nitrogen-doped carbon nanosheets withsize-defined mesopores as highly efficientmetal-free catalyst for the oxygen reductionreaction. Angew. Chem. 126, 1596–1600.(doi:10.1002/ange.201307319)
36. Li Y, Zhao Y, Cheng H, Hu Y, Shi G, Dai L, Qu L. 2012Nitrogen-doped graphene quantum dots withoxygen-rich functional groups. J. Am. Chem. Soc.134, 15–18. (doi:10.1021/ja206030c)
37. Wu P, Du P, Zhang H, Cai C. 2013 Microscopic effectsof the bonding configuration of nitrogen-dopedgraphene on its reactivity toward hydrogenperoxide reduction reaction. Phys. Chem. Chem.Phys. 15, 6920–6928. (doi:10.1039/c3cp50900a)
38. Zhang L et al. 2013 Porous 3D graphene-based bulkmaterials with exceptional high surface area andexcellent conductivity for supercapacitors. Sci. Rep.3, 1408. (doi:10.1038/srep01408)
39. Chuang C-H, Su C-Y, Hsu K-T, Chen C-H, Huang C-H,Chu C-W, Liu W-R. 2015 A green, simple andcost-effective approach to synthesize high qualitygraphene by electrochemical exfoliation via processoptimization. RSC Adv. 5, 54 762–54 768.(doi:10.1039/C5RA07710A)
40. Dong Y, Shao J, Chen C, Li H, Wang R, Chi Y, Lin X,Chen G. 2012 Blue luminescent graphene quantumdots and graphene oxide prepared by tuning thecarbonization degree of citric acid. Carbon 50,4738–4743. (doi:10.1016/j.carbon.2012.06.002)
41. Qu D et al. 2013 Highly luminescent S, N co-dopedgraphene quantum dots with broad visibleabsorption bands for visible light photocatalysts.Nanoscale 5, 12 272–12 277. (doi:10.1039/c3nr04402e)
42. Jian X, Liu X, Yang HM, Guo MM, Song XL, Dai HY,Liang ZH. 2016 Graphene quantum dots modifiedglassy carbon electrode via electrostaticself-assembly strategy and its application.Electrochim. Acta 190, 455–462. (doi:10.1016/j.electacta.2016.01.045)
43. Hou X, Li Y, Zhao C. 2016 Microwave-assistedsynthesis of nitrogen-doped multi-layer graphenequantum dots with oxygen-rich functional groups.Aust. J. Chem. 69, 357–360. (doi:10.1071/CH15431)
44. Zheng B, Chen Y, Li P, Wang Z, Cao B, Qi F, Liu J, QiuZ, ZhangW. 2017 Ultrafast ammonia-driven,microwave-assisted synthesis of nitrogen-dopedgraphene quantum dots and their opticalproperties. Nanophotonics 6, 259–267.(doi:10.1515/nanoph-2016-0102)
on June 2, 2018http://rsos.royalsocietypublishing.org/Downloaded from

12
rsos.royalsocietypublishing.orgR.Soc.opensci.4:171199
................................................45. Roshni V, Divya O. 2017 One-step
microwave-assisted green synthesis ofluminescent N-doped carbon dots from sesameseeds for selective sensing of Fe (III). Curr. Sci. 112,385. (doi:10.18520/cs/v112/i02/385-390)
46. Dago A, Navarro J, Ariño C, Díaz-Cruz JM, Esteban M.2015 Carbon nanotubes and graphene modifiedscreen-printed carbon electrodes as sensitivesensors for the determination of phytochelatins inplants using liquid chromatography withamperometric detection. J. Chromatogr. A1409, 210–217. (doi:10.1016/j.chroma.2015.07.057)
47. Noyrod P, Chailapakul O, Wonsawat W,Chuanuwatanakul S. 2014 The simultaneousdetermination of isoproturon and carbendazimpesticides by single drop analysis using agraphene-based electrochemical sensor.J. Electroanal. Chem. 719, 54–59. (doi:10.1016/j.jelechem.2014.02.001)
48. Palanisamy S, Thirumalraj B, Chen SM, Ali MA,Al-Hemaid FMA. 2015 Palladium nanoparticlesdecorated on activated fullerene modified screenprinted carbon electrode for enhancedelectrochemical sensing of dopamine. J. ColloidInterface Sci. 448, 251–256. (doi:10.1016/j.jcis.2015.02.013)
49. Zhang B, Xiao C, Xiang Y, Dong B, Ding S, Tang Y.2016 Nitrogen-doped graphene quantum dotsanchored on thermally reduced graphene oxide asan electrocatalyst for the oxygen reductionreaction. ChemElectroChem. 3, 864–870.(doi:10.1002/celc.201600123)
50. Lai SK, Tang L, Hui YY, Luk CM, Lau SP. 2014 A deepultraviolet to near-infrared photoresponse fromglucose-derived graphene oxide. J. Mater. Chem. C2, 6971–6977. (doi:10.1039/C4TC01175A)
51. Luo Z, Lu Y, Somers LA, Johnson AC. 2009 High yieldpreparation of macroscopic graphene oxidemembranes. J. Am. Chem. Soc. 131, 898–899.(doi:10.1021/ja807934n)
52. Tang L et al. 2014 Deep ultraviolet to near-infraredemission and photoresponse in layered N-dopedgraphene quantum dots. ACS Nano 8, 6312–6320.(doi:10.1021/nn501796r)
53. Tang L, Ji R, Li X, Teng KS, Lau SP. 2013 Energy-levelstructure of nitrogen-doped graphene quantumdots. J. Mater. Chem. C 1, 4908–4915. (doi:10.1039/c3tc30877d)
54. Jiang K, Sun S, Zhang L, Lu Y, Wu A, Cai C, Lin H.2015 Red, green, and blue luminescence by carbondots: full-color emission tuning and multicolorcellular imaging. Angew. Chem. Int. Ed. 54,5360–5363. (doi:10.1002/anie.201501193)
55. Zhu X, Zuo X, Hu R, Xiao X, Liang Y, Nan J. 2014Hydrothermal synthesis of two photoluminescentnitrogen-doped graphene quantum dots emittedgreen and khaki luminescence.Mater. Chem. Phys.147, 963–967. (doi:10.1016/j.matchemphys.2014.06.043)
56. Ju J, Chen W. 2014 Synthesis of highly fluorescentnitrogen-doped graphene quantum dots forsensitive, label-free detection of Fe (III) in aqueousmedia. Biosens. Bioelectron. 58, 219–225.(doi:10.1016/j.bios.2014.02.061)
57. Xu H, Dai H, Chen G. 2010 Direct electrochemistryand electrocatalysis of hemoglobin proteinentrapped in graphene and chitosan compositefilm. Talanta 81, 334–338. (doi:10.1016/j.talanta.2009.12.006)
58. Sanghavi BJ, Wolfbeis OS, Hirsch T, Swami NS. 2015Nanomaterial-based electrochemical sensing ofneurological drugs and neurotransmitters.Microchim. Acta 182, 1–41. (doi:10.1007/s00604-014-1308-4)
59. Liu L, Li S, Liu L, Deng D, Xia N. 2012 Simple,sensitive and selective detection of dopamine usingdithiobis(succinimidylpropionate)-modified goldnanoparticles as colorimetric probes. Analyst 137,3794–3799. (doi:10.1039/c2an35734h)
60. Huang Q et al. 2014 A sensitive and reliabledopamine biosensor was developed based on theAu@ carbon dots–chitosan composite film. Biosens.Bioelectron. 52, 277–280. (doi:10.1016/j.bios.2013.09.003)
61. Fernandes SC, Vieira IC, Peralta RA, Neves A. 2010Development of a biomimetic chitosan film-coatedgold electrode for determination of dopamine inthe presence of ascorbic acid and uric acid.Electrochim. Acta 55, 7152–7157. (doi:10.1016/j.electacta.2010.06.062)
62. Wang Y, Li Y, Tang L, Lu J, Li J. 2009 Application ofgraphene-modified electrode for selectivedetection of dopamine. Electrochem. Commun. 11,889–892. (doi:10.1016/j.elecom.2009.02.013)
63. Wang G, Shi G, Chen X, Yao R, Chen F. 2015 A glassycarbon electrode modified with graphene quantumdots and silver nanoparticles for simultaneousdetermination of guanine and adenine.Microchim.Acta 182, 315–322. (doi:10.1007/s00604-014-1335-1)
64. Shi L, Wang Z, Gou G, Chen X, Yang G, Liu W. 2017Simultaneous determination of ascorbic acid,dopamine and uric acid based ongraphene/polyaniline/gold nanohybrids. Int. J.Electrochem. Sci. 12, 2540–2551. (doi:10.20964/2017.03.42)
65. Cincotto FH, Canevari TC, Campos AM, Landers R,Machado SA. 2014 Simultaneous determination ofepinephrine and dopamine by electrochemicalreduction on the hybrid material SiO2/grapheneoxide decorated with Ag nanoparticles.Analyst 139, 4634–4640. (doi:10.1039/C4AN00580E)
66. Liu S, Shi F, Zhao X, Chen L, Su X. 20133-Aminophenyl boronic acid-functionalized CuInS2quantum dots as a near-infrared fluorescence probefor the determination of dopamine. Biosens.Bioelectron. 47, 379–384.(doi:10.1016/j.bios.2013.03.055)
67. Zheng G, Chen M, Liu X, Zhou J, Xie J, Diao G. 2014Self-assembled thiolated calix [n] arene (n= 4, 6,8) films on gold electrodes and application forelectrochemical determination dopamine.Electrochim. Acta 136, 301–309. (doi:10.1016/j.electacta.2014.05.086)
68. Zhang Q-L, Feng J-X, Wang A-J, Wei J, Lv Z-Y, FengJ-J. 2015 A glassy carbon electrode modified withporous gold nanosheets for simultaneousdetermination of dopamine and acetaminophen.Microchim. Acta 182, 589–595. (doi:10.1007/s00604-014-1363-x)
69. Wang K, Liu P, Ye Y, Li J, Zhao W, Huang X. 2014Fabrication of a novel laccase biosensor based onsilica nanoparticles modified with phytic acid forsensitive detection of dopamine. Sens. Actuators B,Chem. 197, 292–299. (doi:10.1016/j.snb.2014.03.002)
on June 2, 2018http://rsos.royalsocietypublishing.org/Downloaded from