r’s Greeting - eprints.binadarma.ac.ideprints.binadarma.ac.id/3018/1/ICIBA Ahmad Kurniawan, Yesi,...
14
The Rector’s Greeting Greetings and a warm welcome to the all academic researchers, practitioners, industry and business person as well as policy makers. Thank you for attended this 4 rd international conference on Information Technology and Engineering Application 2016 (ICIBA 2016). ICIBA is an annual event focusing on state of the art technologies pertaining to digital information and communications and its application in business and industry as well as government. The applications of advanced information technology to such domains as networking, security, engineering, education, finance, geosciences, health, transportation, supply chain management and logistics are among topics of relevance to ICIBA. The conference features keynote speakers, the best student award, poster award, technical open panel, and workshops/exhibits from industry, government and academia as well postgraduate student colloquium. All papers for the ICIBA 2016 on this Conference Proceeding (ISBN) was indexed by EBSCO, Google Scholar, and sent to be reviewed by EiCompendex and ISI Proceedings. Our gratitude to all the participants who has take a part in this conference, I hope we can take the advantage of academic research findings, to have better insight about the importance of IT and business application, to the country’s economic development Sincerely yours, Prof. Ir. H. Bochari Rahman, M.Sc RECTOR of BINA DARMA UNIVERSITY
Transcript of r’s Greeting - eprints.binadarma.ac.ideprints.binadarma.ac.id/3018/1/ICIBA Ahmad Kurniawan, Yesi,...

The Rector’s Greeting
Greetings and a warm welcome to the all academic researchers, practitioners,industry and business person as well as policy makers. Thank you for attended this
4rd international conference on Information Technology and EngineeringApplication 2016 (ICIBA 2016).
ICIBA is an annual event focusing on state of the art technologies pertaining todigital information and communications and its application in business and industryas well as government. The applications of advanced information technology tosuch domains as networking, security, engineering, education, finance, geosciences,health, transportation, supply chain management and logistics are among topicsof relevance to ICIBA. The conference features keynote speakers, the best studentaward, poster award, technical open panel, and workshops/exhibits from industry,government and academia as well postgraduate student colloquium.
All papers for the ICIBA 2016 on this Conference Proceeding (ISBN) was indexedby EBSCO, Google Scholar, and sent to be reviewed by EiCompendex and ISIProceedings.
Our gratitude to all the participants who has take a part in this conference,I hope we can take the advantage of academic research findings, to have betterinsight about the importance of IT and business application, to the country’seconomic development
Sincerely yours,Prof. Ir. H. Bochari Rahman, M.Sc
RECTOR of BINA DARMA UNIVERSITY
PROCEEDINGINTERNATIONAL CONFERENCE ON INFORMATION TECHNOLOGY AND
ENGINEERING APPLICATION 2015
IT and Engineering for Better life
Published by:Pusat Penerbitan dan Percetakan Universitas Bina Darma Press (PPP-UBD Press) Palembang
Proceeding International Conference on Information Technology andEngineering Application
Published by:
CONFERENCE COMMITTEE
Muhammad Izman Herdiansyah, PhD, Universitas Bina Darma, IndonesiaErna Yuliwati, PhD, Universitas Bina Darma, IndonesiaDr. Sunda Ariana, M.Pd., M.M. Universitas Bina Darma, IndonesiaDr. Ahmad Syarifuddin, M.T., Universitas Bina Darma, IndonesiaProf. Dr. Aizaini Maarof, Universiti Teknology Malaysia.Prof. Dr. Wan Nasir, Universiti Teknology Malaysia.Prof Dr. Eko Indrajit, Higher Education Association Information AndComputer Science (APTIKOM), IndonesiaProf Zainal A Hasibuan, PhD, Higher Education Association InformationAnd Computer Science (APTIKOM), IndonesiaDr. Paulus Sukapto, Ir., MBA, Universitas Katolik Parahyangan, IndonesiaDr. Ir. T. Ari Samadhi, Institut Teknologi Bandung, Indonesia.
REVIEWER & EDITOR
Leon Andretti AbdillahDarius AntoniM. Izman HerdiansyahDedy SyamsuarEdi Surya Negara
Support by. Bina Darma University
Steering Committee ICIBA
Cover Design by. Deni Erlansyah
Printed in Palembang, Indonesia, Febuari 2016
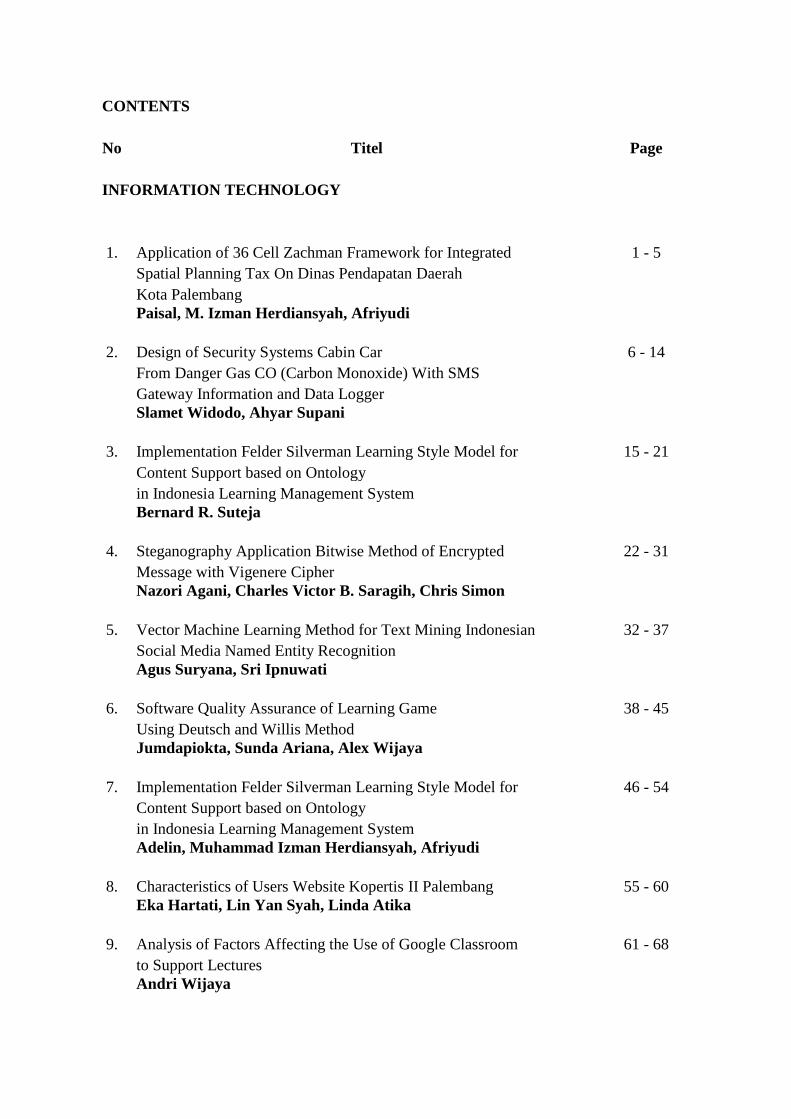
CONTENTS
No Titel Page
INFORMATION TECHNOLOGY
1. Application of 36 Cell Zachman Framework for Integrated 1 - 5Spatial Planning Tax On Dinas Pendapatan DaerahKota PalembangPaisal, M. Izman Herdiansyah, Afriyudi
2. Design of Security Systems Cabin Car 6 - 14From Danger Gas CO (Carbon Monoxide) With SMSGateway Information and Data LoggerSlamet Widodo, Ahyar Supani
3. Implementation Felder Silverman Learning Style Model for 15 - 21Content Support based on Ontologyin Indonesia Learning Management SystemBernard R. Suteja
4. Steganography Application Bitwise Method of Encrypted 22 - 31Message with Vigenere CipherNazori Agani, Charles Victor B. Saragih, Chris Simon
5. Vector Machine Learning Method for Text Mining Indonesian 32 - 37Social Media Named Entity RecognitionAgus Suryana, Sri Ipnuwati
6. Software Quality Assurance of Learning Game 38 - 45Using Deutsch and Willis MethodJumdapiokta, Sunda Ariana, Alex Wijaya
7. Implementation Felder Silverman Learning Style Model for 46 - 54Content Support based on Ontologyin Indonesia Learning Management SystemAdelin, Muhammad Izman Herdiansyah, Afriyudi
8. Characteristics of Users Website Kopertis II Palembang 55 - 60Eka Hartati, Lin Yan Syah, Linda Atika
9. Analysis of Factors Affecting the Use of Google Classroom 61 - 68to Support LecturesAndri Wijaya

10. Enterprise Architecture Planning Design of Information 69 - 73Systems Technology at PT Kreasi Utama Mandiri UsingZachman FrameworkSurahmat, Bochari Rahman, Yesi Novaria Kunang
11. Determining The Quality of Lecturer using Fuzzy 74 - 79Simple Additive Weighting (SAW)Satria Abadi, Sri Hartati, A. Humaidi
12. Application Location Based Service (LBS) Location Search 80 - 85Palembang Nature-Based AndroidIntan Okta Sari, Leon Andretti Abdillah, Kiky Rizky NovaWardhani
13. Extracted Social Network Mining 86 - 91Mahyuddin K. M. Nasution
14. Information Systems Architecture Online Learning in School 92 - 98with the Zachman FrameworkHatta Wijaya, M. Izman Herdiansyah, A. Haidar Mirza
15. Improved Models of Wireless Pricing Scheme in Multiple 99 - 104Class QoS Networks by Determining the Base Price ValueFitri Maya Puspita, Irmeilyana, Iffah Husniah
16. Diabetic Retinopathy Stages Classiffcation Using 3D-GLCM 105 - 112Rocky Yefrenes Dillak, Sri Andayani
17. Comparison Route Redistribution on Dynamic Routing 113 - 119Protocol (EIGRP into OSPF and EIGRP into IS-IS)Chairul Mukmin, Darius Antoni, Edi Surya Negara
18. Nonlinear Programming Problem of Bandwidth Based and 120 - 126VolumeBased Call Pricing Scheme in Wireless NetworksFitri Maya Puspita, Kamaruzzaman Seman, Bachok M. Taib,Ismail Abdullah
19. Survey Application for Telkomsel Customer Satisfaction 127 - 134Lukman Sunardi, Nta Rosa Damayanti
20. Genetic Algorithms Method On Street Lighting Energy Saving 135 - 140Jefri Lianda, Hikmatul Amri
21. The Implementation of Knowledge Management Systems 141 - 147in Assets ReconciliationMeiliya Fitriyani, Leon Andretti Abdillah, Andri
22. Performance Analysis for Migration Method IPv4 to IPv6 148 - 154
Using Dual-Stack TechniqueAan Restu Mukti, Zainuddin Ismail, Edi Surya Negara
23. Implementation of Business Intelligence Dashboard 155 - 161
In Research, Service / Dedication To Society And CooperationAhmad Kurniawan, Yesi Novaria Kunang, Susan DianPurnamasari
24. Web Application Content News Aggregator on 162 - 167Communication Devices Based On AndroidMerry Agustina, Usman Ependi
25. Design and Development of a CAD Tool With Real Time 168 - 174
Analysis for Dreadful DiseasesDr.S.Asif Hussain, S.Jakeer Hussain, Edi Surya Negara
26.Evaluation of Governance Maturity Level SistemPembelajaran Online Dan Interaktif by Using Cobit 5 Framework 175 - 181Okti Firnawati, Darius Antoni, Diana
27. Personal Financial Management Application Design 182 - 189Rusdiyanto
28. Link Aggregation Analysis on MikroTik to Increase Throughput 190 - 197
Bandwidth of Point to point NetworkM. Agus Syamsul Arifin
29. Analysis of Transfer Rate Node Addition on 198 - 204Mobile Ad Hoc Network (MANET) Infrastructure for File ServerRudi Kurniawan
30.Analysis of Effects of Application of E -learning activeness AgainstStudents In Learning Activity Using teaching Technology Acceptance 205 - 209Model (TAM)( Studi Kasus : Sekolah Tinggi Teknologi Pagar Alam )Sasmita
31. Conceptual Framework Evaluation of Information Systems 210 - 216
Badan Penyelenggara Jaminan Sosial (BPJS) Health In PalembangFebriyanti Darnis, Darius Antoni, Linda Atika
32. Efektivitas Penerapan Penerimaan Peserta Didik Baru (PPDB) 217 - 221Online Pada Dinas Pendidikan Pemuda Dan Olahraga Kota PalembangAhmad Rivai
33. Development of Strategy Plan IS/IT In Urban Planning And 222 - 228Development Board of Palembang City : Literature ReviewSerry Davizan, Zainuddin Ismail, Yesi Kunang
34. Identifying The Influencial Success Factors of 229 - 234E-Government in Indonesia by Using Systematic ReviewAlan Saputro, Darius Antoni, Muhamad Akbar
35.Relationship Between The Application of Information Technology (IT)And Its Effect On The Implementation 235 - 241of National Exam Success Computer-Based (UNBK)(A Conceptual Framework)Supriyadi, Darius Antoni, A. Haidar Mirza
36. Evaluation of Application Of Information Technology 242 - 251Using Cobit Framework Model (Case Study Pt Bni Life Palembang)Fahmi Ajismanto, Zainuddin Ismail, Widya Cholil
37. Implementing IT Balanced Scorecard in Measuring 252 - 257System Performance : PT. Indah Logistic Cargo
Mardiana, Lin Yan Syah, Yesi Novaria Kunang
ENGINEERING APPLICATION
23. Design of Plastic Mulch Hole Maker to Decrease Work Load 258 - 263and Increase Work Speed Strawberry Farmer in BaliM. Yusuf, Nyoman Adiputra, I Dewa Putu Sutjana, KetutTirtayasa
24.Design of Baby Walking Assistant (AB3) by Using Axiomatic DesignMethod 264 - 272Dian Janari
25. Design Push Up DetectorUsing Quality Function Deployment 273 - 278Method and AnthropometryCh Desi Kusmindari, Yanti Pasmawati, Ari Muzakir
279 - 28326. Flow Pattern in the Estuary of Musi River Using MIKE-21 Flow Model
Achmad Syarifudin, Eka Puji Agustini
The 5th ICIBA 2016, International Conference onInformation Technology and Engineering Application
Palembang-Indonesia, 19-20 February 2016
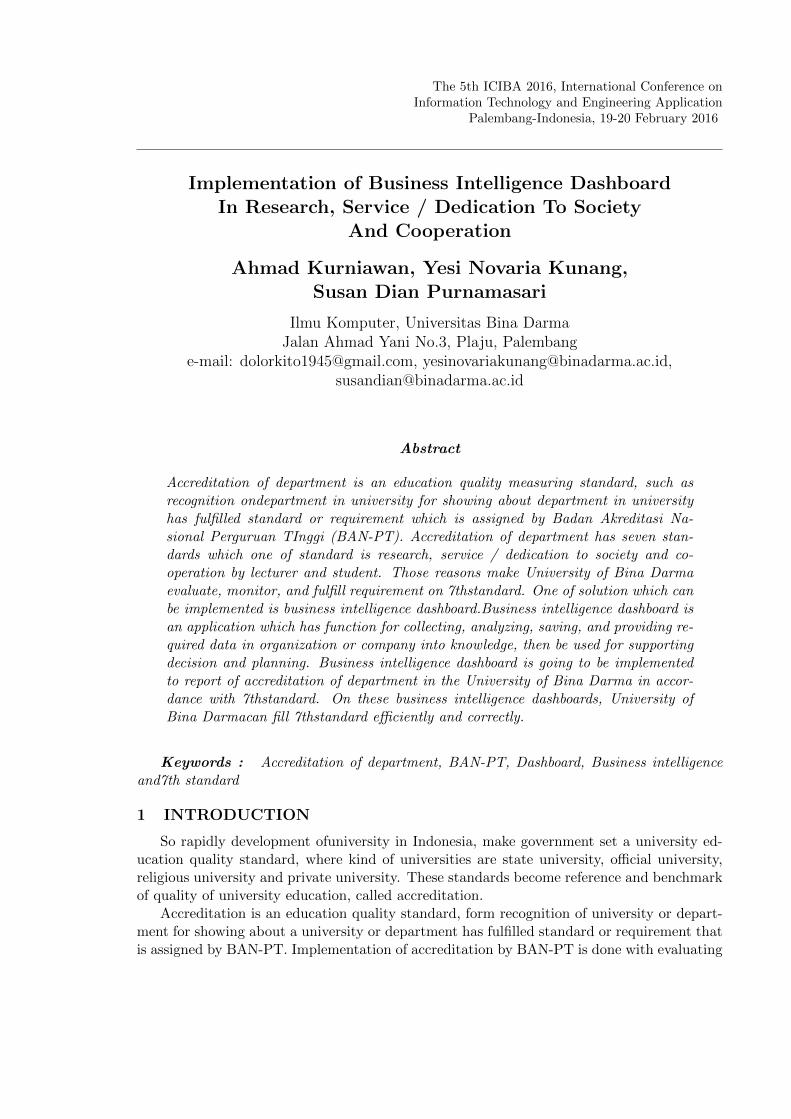
Implementation of Business Intelligence DashboardIn Research, Service / Dedication To Society
And Cooperation
Ahmad Kurniawan, Yesi Novaria Kunang,Susan Dian Purnamasari
Ilmu Komputer, Universitas Bina DarmaJalan Ahmad Yani No.3, Plaju, Palembang
e-mail: [email protected], [email protected],[email protected]
Abstract
Accreditation of department is an education quality measuring standard, such asrecognition ondepartment in university for showing about department in universityhas fulfilled standard or requirement which is assigned by Badan Akreditasi Na-sional Perguruan TInggi (BAN-PT). Accreditation of department has seven stan-dards which one of standard is research, service / dedication to society and co-operation by lecturer and student. Those reasons make University of Bina Darmaevaluate, monitor, and fulfill requirement on 7thstandard. One of solution which canbe implemented is business intelligence dashboard.Business intelligence dashboard isan application which has function for collecting, analyzing, saving, and providing re-quired data in organization or company into knowledge, then be used for supportingdecision and planning. Business intelligence dashboard is going to be implementedto report of accreditation of department in the University of Bina Darma in accor-dance with 7thstandard. On these business intelligence dashboards, University ofBina Darmacan fill 7thstandard efficiently and correctly.
Keywords : Accreditation of department, BAN-PT, Dashboard, Business intelligenceand7th standard
1 INTRODUCTION
So rapidly development ofuniversity in Indonesia, make government set a university ed-ucation quality standard, where kind of universities are state university, official university,religious university and private university. These standards become reference and benchmarkof quality of university education, called accreditation.
Accreditation is an education quality standard, form recognition of university or depart-ment for showing about a university or department has fulfilled standard or requirement thatis assigned by BAN-PT. Implementation of accreditation by BAN-PT is done with evaluating

156
a process,performance and correlation with goal, input, process and output from universityor department, that are responsible with each university and department. That accreditationis accreditation of department that always do every 5 years.
Research and service / dedication to society, and cooperation is seventh item that isevaluated by BAN-PT. This standard is a reference of education quality, service / dedicationto society and cooperation that is organized and related to develop department. Universityof Bina Darma has borang team that has job for fulfilling criteria that is set on 7thstandard.Items that are evaluated on 7thstandard are department, lecturer, source of research fundand dedication fund, research and dedication of lecturer in the last three years.
After all of items were getting, team started to do data collecting process. Those data arecollected in excel form. Team started to do selecting process, evaluating, and calculating thatbased onstandard 7th and is set on BAN-PT. Amount of big data that are processed, canbe able error in arranging 7thstandard. This condition always held up performance of team.Whereas those activities are carried out periodically every five years. Therefore, it neededa technology that can help team correctly and efficiently, then reduce error in arrangingaccreditation.
One of technology can be used for helping those problems is business intelligence. Businessintelligence is a system that has function for collecting, analyzing, saving and facilitating datathat are needed an organization or company in knowledge form, then are used for supportingdecision and planning. With those power, business intelligence can help borang team.
2 RESEARCH METHODOLOGY
Methods are used in this research is business intelligence roadmap[3]. According to LarisaT.Mosss book, business intelligence is divided into analysis method and design method [3].
2.1 Analysis Method
Analysis method that is used consist of seven steps, among others
1. Justification
Business Case Assessment For designing a business intelligence application, first stepthat must be done is determine, check or evaluate and collect needed information, suchas goal, strategic and aim an organization.
2. Planning
This step has two main activities that are done, they are enterprise infrastructureevaluation and project planning.
(a) Enterprise Infrastructure
Evaluation Infrastructure Design that is done is for BI application can run well.This step consists of Technical Infrastructure and non-technical infrastructure.
(b) Project Planning
This step is created for design of application that can finish on time.
3. Business Analysis
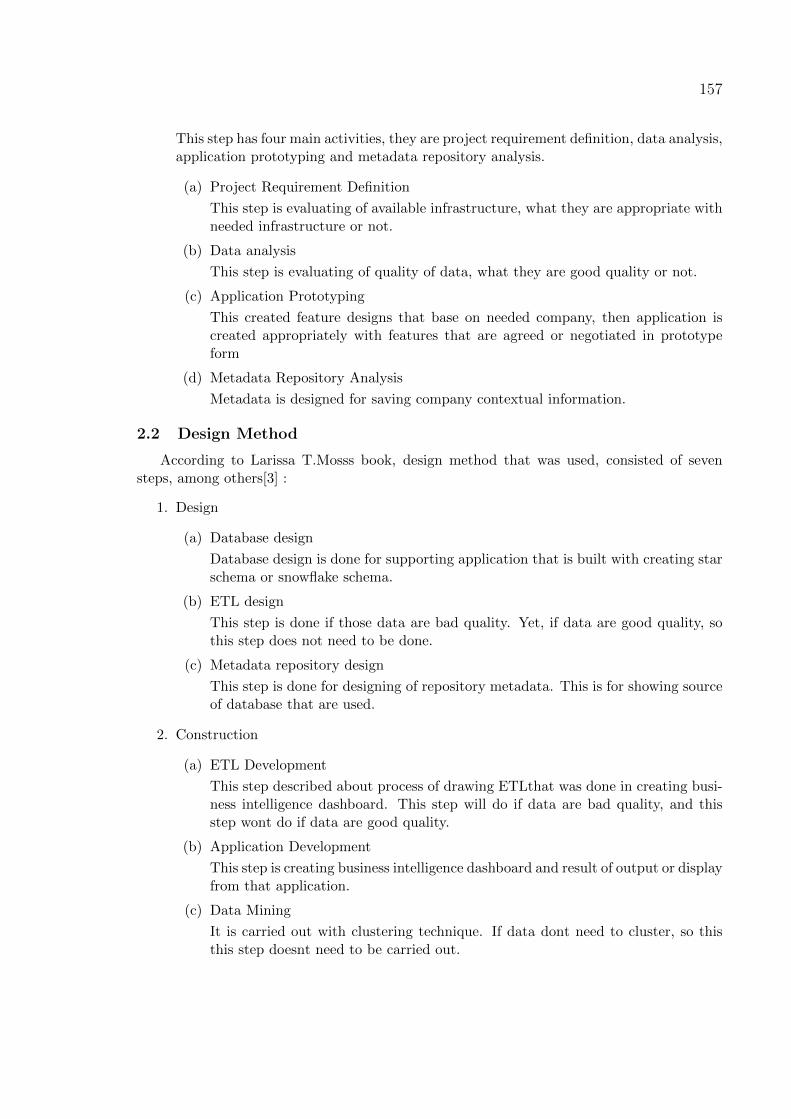
157
This step has four main activities, they are project requirement definition, data analysis,application prototyping and metadata repository analysis.
(a) Project Requirement Definition
This step is evaluating of available infrastructure, what they are appropriate withneeded infrastructure or not.
(b) Data analysis
This step is evaluating of quality of data, what they are good quality or not.
(c) Application Prototyping
This created feature designs that base on needed company, then application iscreated appropriately with features that are agreed or negotiated in prototypeform
(d) Metadata Repository Analysis
Metadata is designed for saving company contextual information.
2.2 Design Method
According to Larissa T.Mosss book, design method that was used, consisted of sevensteps, among others[3] :
1. Design
(a) Database design
Database design is done for supporting application that is built with creating starschema or snowflake schema.
(b) ETL design
This step is done if those data are bad quality. Yet, if data are good quality, sothis step does not need to be done.
(c) Metadata repository design
This step is done for designing of repository metadata. This is for showing sourceof database that are used.
2. Construction
(a) ETL Development
This step described about process of drawing ETLthat was done in creating busi-ness intelligence dashboard. This step will do if data are bad quality, and thisstep wont do if data are good quality.
(b) Application Development
This step is creating business intelligence dashboard and result of output or displayfrom that application.
(c) Data Mining
It is carried out with clustering technique. If data dont need to cluster, so thisthis step doesnt need to be carried out.
158
(d) Metadata Repository Development This step showed display from each metadatarepository that were created before in project that based on result of information.Metadata repository consists of OLAPs data.
3 THEORETICAL BASIC
3.1 Dashboard
There are several kind of dashboard, according to Rasmussen, Bansal and Chen putforward three types of dashboard[4], among others :
1. Strategic Dashboard
Strategic dashboard is used for supporting management of strategic level that give in-formation and make business decision, predict chance and give guidance of achievementof strategic goal.
2. Tactical Dashboard
This dashboard focus on analysis process for determining factor that caused a conditionor event.
3. Operational Dashboard
Operational dashboard has function as supporting and monitoring activities of specificbusiness process.This focus on monitoring activities.
4 RESULT
Explainning from result of dashboards that are created, among others:
1. Data were taken from sources where data were saved in MySQL database. Those dataconsisted of 3 tables, factPenelitian table, factPengabdian table and dimSDM table.FactPenelitian table consisted of 1662 data, factPengabdian consisted of 1321 dataand dimSDM table consisted of 275 data. Those tables were imported to SQL Serverdatabase with using SQL Server Integration Service (SSIS). In SSIS, this also createddimAsalBiaya table from factPenelitian or factPengabdian table, and dimProgramStuditable was from dimSDM. dimAsalBiaya consisted of 8 data and dimProgramStudi con-sist of 19 data.
2. Those tables were cleaned in SQL Server Integration Service (SSIS).
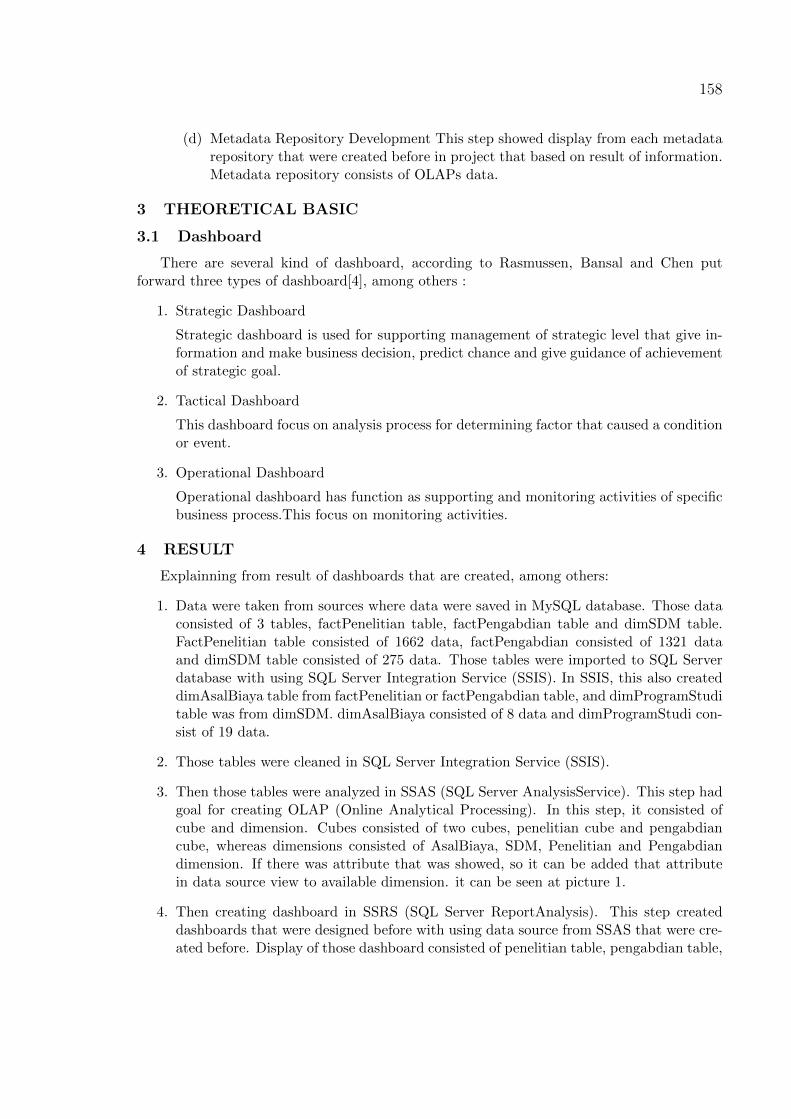
3. Then those tables were analyzed in SSAS (SQL Server AnalysisService). This step hadgoal for creating OLAP (Online Analytical Processing). In this step, it consisted ofcube and dimension. Cubes consisted of two cubes, penelitian cube and pengabdiancube, whereas dimensions consisted of AsalBiaya, SDM, Penelitian and Pengabdiandimension. If there was attribute that was showed, so it can be added that attributein data source view to available dimension. it can be seen at picture 1.
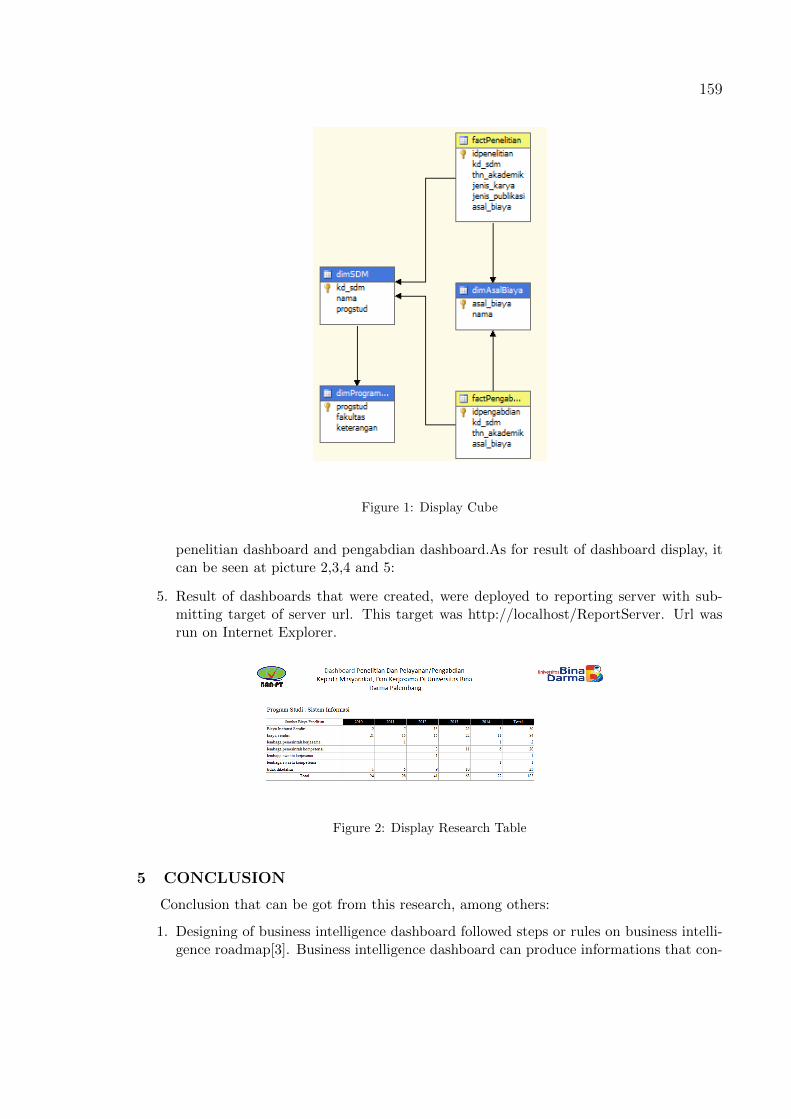
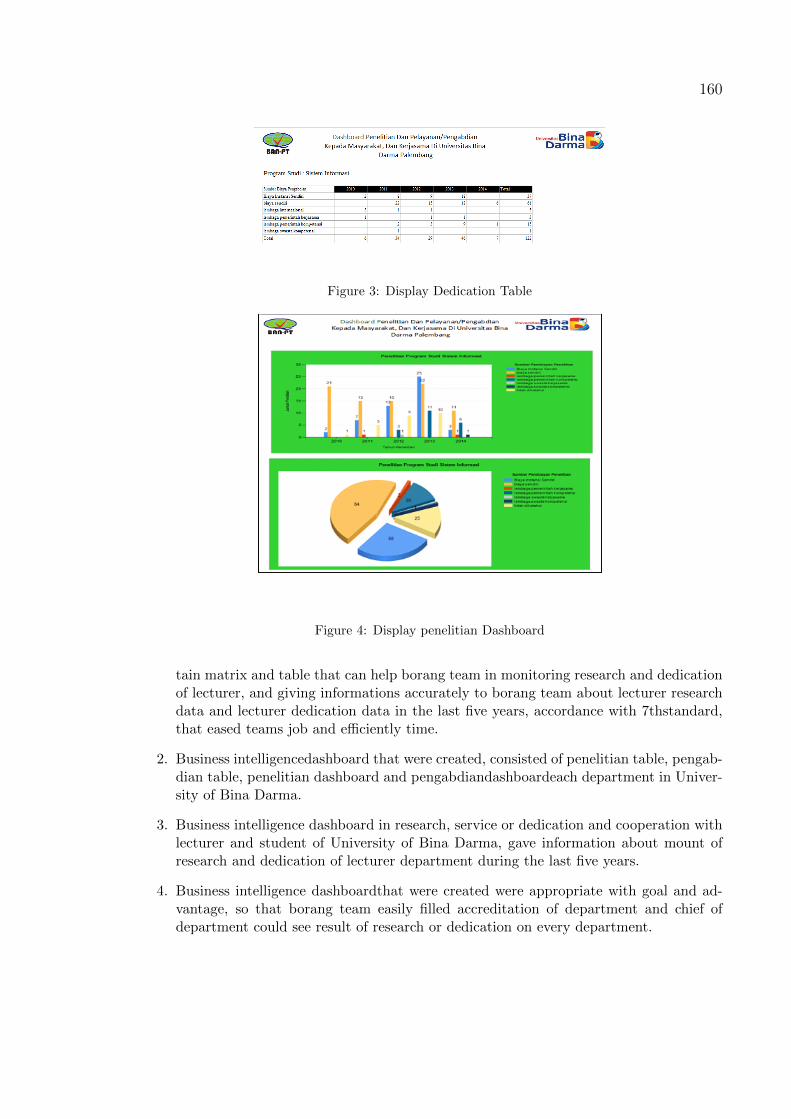
4. Then creating dashboard in SSRS (SQL Server ReportAnalysis). This step createddashboards that were designed before with using data source from SSAS that were cre-ated before. Display of those dashboard consisted of penelitian table, pengabdian table,
159
Figure 1: Display Cube
penelitian dashboard and pengabdian dashboard.As for result of dashboard display, itcan be seen at picture 2,3,4 and 5:
5. Result of dashboards that were created, were deployed to reporting server with sub-mitting target of server url. This target was http://localhost/ReportServer. Url wasrun on Internet Explorer.
Figure 2: Display Research Table
5 CONCLUSION
Conclusion that can be got from this research, among others:
1. Designing of business intelligence dashboard followed steps or rules on business intelli-gence roadmap[3]. Business intelligence dashboard can produce informations that con-
160
Figure 3: Display Dedication Table
Figure 4: Display penelitian Dashboard
tain matrix and table that can help borang team in monitoring research and dedicationof lecturer, and giving informations accurately to borang team about lecturer researchdata and lecturer dedication data in the last five years, accordance with 7thstandard,that eased teams job and efficiently time.
2. Business intelligencedashboard that were created, consisted of penelitian table, pengab-dian table, penelitian dashboard and pengabdiandashboardeach department in Univer-sity of Bina Darma.
3. Business intelligence dashboard in research, service or dedication and cooperation withlecturer and student of University of Bina Darma, gave information about mount ofresearch and dedication of lecturer department during the last five years.
4. Business intelligence dashboardthat were created were appropriate with goal and ad-vantage, so that borang team easily filled accreditation of department and chief ofdepartment could see result of research or dedication on every department.
161
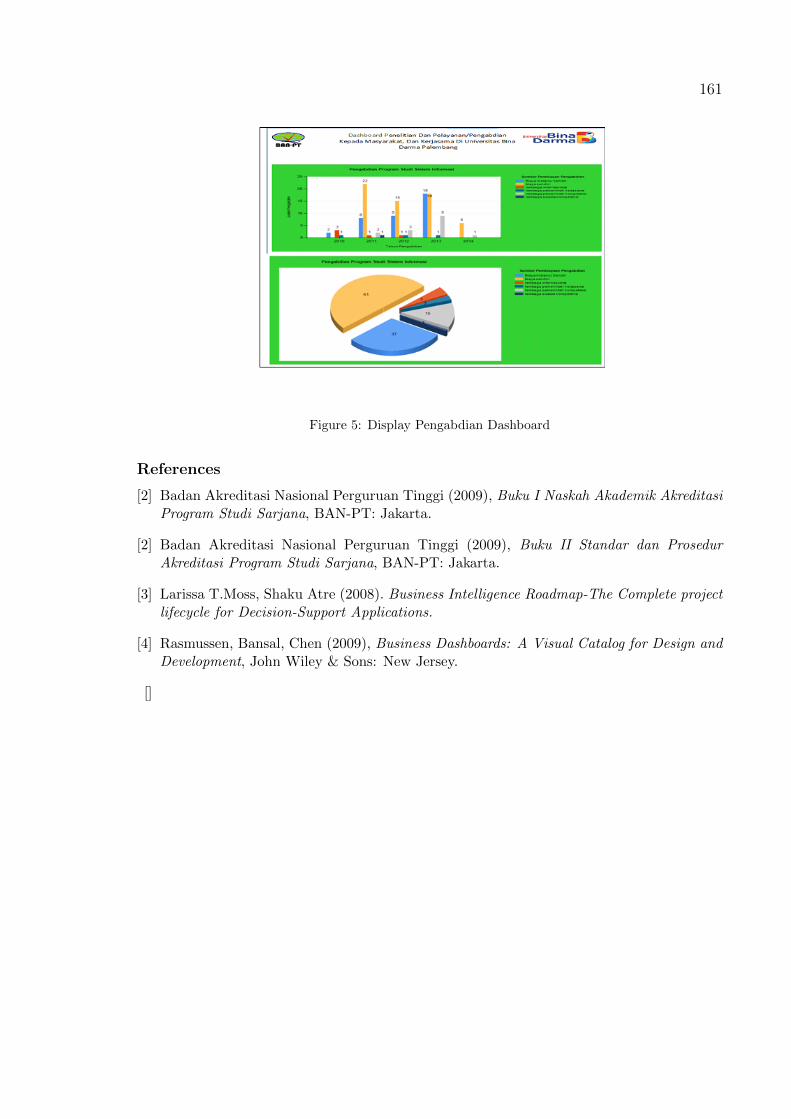
Figure 5: Display Pengabdian Dashboard
References
[2] Badan Akreditasi Nasional Perguruan Tinggi (2009), Buku I Naskah Akademik AkreditasiProgram Studi Sarjana, BAN-PT: Jakarta.
[2] Badan Akreditasi Nasional Perguruan Tinggi (2009), Buku II Standar dan ProsedurAkreditasi Program Studi Sarjana, BAN-PT: Jakarta.
[3] Larissa T.Moss, Shaku Atre (2008). Business Intelligence Roadmap-The Complete projectlifecycle for Decision-Support Applications.
[4] Rasmussen, Bansal, Chen (2009), Business Dashboards: A Visual Catalog for Design andDevelopment, John Wiley & Sons: New Jersey.
[]