rr625 Noise emission from fastener driving tools · Noise emission from fastener driving tools ......
58
Executive Health and Safety Noise emission from fastener driving tools Prepared by the Health and Safety Laboratory for the Health and Safety Executive 2008 RR625 Research Report
-
Upload
truongtuong -
Category
Documents
-
view
219 -
download
0
Transcript of rr625 Noise emission from fastener driving tools · Noise emission from fastener driving tools ......

Executive Health and Safety
Noise emission from fastener driving tools
Prepared by the Health and Safety Laboratoryfor the Health and Safety Executive 2008
RR625 Research Report
Executive Health and Safety
Noise emission from fastener driving tools
Emma Shanks BSc(Hons) MIOA Health and Safety Laboratory Harpur Hill Buxton SK17 9JN
The Supply of Machinery (Safety) Regulations 1992 as amended place duties on machine manufacturers and suppliers to design and construct machinery in such a way that noise emissions are reduced to the lowest level taking account of technical progress and the availability of techniques for reducing noise, particularly at source. There is also a requirement that manufacturers and suppliers provide information on the airborne noise emissions of their products. The Control of Noise at Work Regulations 2005, which came into force in April 2006 implementing the EU Physical Agents (Noise) Directive (2003/10/EC), state that employers may use manufacturers’ tool data to assess the risk to their employees from exposure to noise.
The aims of the work reported here were to:
n Measure the noise emission of the tools supplied by the manufacturers and compare to the manufacturers’ declared emission, if stated.
n Determine whether tools with a declared noise emission have been tested in accordance with the most appropriate test code.
n Comment on the suitability of the noise test methods for the family of tools under test.
n Investigate the link between the manufacturers’ declared emission and the in real use emission.
This project was carried out in conjunction with HSL project JR45.086, an investigation into the correlation between vibration emission and vibration during real use on fastener driving tools as reported in RR591.
This report and the work it describes were funded by the Health and Safety Executive (HSE). Its contents, including any opinions and/or conclusions expressed, are those of the author alone and do not necessarily reflect HSE policy.
HSE Books
© Crown copyright 2008
First published 2008
All rights reserved. No part of this publication may be reproduced, stored in a retrieval system, or transmitted in any form or by any means (electronic, mechanical, photocopying, recording or otherwise) without the prior written permission of the copyright owner.
Applications for reproduction should be made in writing to:Licensing Division, Her Majesty’s Stationery Office,St Clements House, 2-16 Colegate, Norwich NR3 1BQor by e-mail to [email protected]
ii

ACKNOWLEDGEMENTS The author gratefully acknowledges those who assisted in this project, in particular the Power Fasteners Association, the tool manufacturers who supplied the tools, and the sites who generously provided us with their time and staff for the field measurements.
iii

iv
CONTENTS
1 INTRODUCTION......................................................................................... 11.1 Declaration of noise emission.................................................................. 11.2 Outline of work......................................................................................... 11.3 Terminology for emission data................................................................. 11.4 Acoustic parameters ................................................................................ 2
2 TOOLS TESTED......................................................................................... 32.1 Declared emissions ................................................................................. 32.2 Actuation modes ...................................................................................... 4
3 LABORATORY TESTING OF NOISE EMISSION...................................... 63.1 Safety standards / Noise test codes ........................................................ 63.2 Laboratory measurement procedure ....................................................... 63.3 Data acquisition and analysis .................................................................. 83.4 Measured emission results ...................................................................... 8
4 ADDITIONAL LABORATORY TESTS ..................................................... 104.1 Sequential actuation versus ‘bump’ action............................................. 104.2 Tool K auto firing ................................................................................... 11
5 IN REAL USE / FIELD MEASUREMENTS............................................... 145.1 Measurement protocol ........................................................................... 145.2 Data aqusition & analysis ...................................................................... 145.3 Site details ............................................................................................. 145.4 In real use / field results......................................................................... 17
6 DISCUSSION............................................................................................ 196.1 Verification of manufacturers’ declared emission .................................. 196.2 Analysis of HSL measured emission ..................................................... 20
7 CONCLUSIONS........................................................................................ 21
8 APPENDIX A - EQUIPMENT.................................................................... 22
9 APPENDIX B – MEASURED EMISSION RESULTS................................ 23
10 APPENDIX C – ADDITIONAL LABORATORY TEST RESULTS......... 35
11 APPENDIX D – IN REAL USE / FIELD RESULTS ............................... 42
12 REFERENCES ...................................................................................... 47
v

vi
EXECUTIVE SUMMARY
Objectives
The Supply of Machinery (Safety) Regulations 1992 as amended place duties on machine manufacturers and suppliers to design and construct machinery in such a way that noise emissions are reduced to the lowest level taking account of technical progress and the availability of techniques for reducing noise, particularly at source. There is also a requirement that manufacturers and suppliers provide information on the airborne noise emissions of their products. The Control of Noise at Work Regulations 2005, which came into force in April 2006 implementing the EU Physical Agents (Noise) Directive (2003/10/EC), state that employers may use manufacturers’ tool data to assess the risk to their employees from exposure to noise.
The aims of the work reported here were to: • Measure the noise emission of the tools supplied by the manufacturers and compare to the
manufacturers’ declared emission, if stated • Determine whether tools with a declared noise emission have been tested in accordance
with the most appropriate test code • Comment on the suitability of the noise test methods for the family of tools under test • Investigate the link between the manufacturers’ declared emission and the in real use
emission
This project was carried out in conjunction with HSL project JR45.086, an investigation into the correlation between vibration emission and vibration during real use on fastener driving tools as reported in NV/06/24.
Main Findings
Where
LpA,1s: A-weighted single-event emission sound pressure level at the workstation (dB)
LWA,1s: A-weighted single-event sound power level (dB)
• The quality of declared airborne noise emission data varied between manufacturers. Two out of the 11 tools used in this project were supplied with inappropriate or clearly erroneous data (Tools C and K respectively). While the Supply of Machinery (Safety) Regulations 1992 as amended, and related transposed standards for the family of tools under consideration, are clear about declaration requirements, the information available with tools is not always consistent or transparent.
• HSL was able to verify the manufacturers’ declared emissions for five of the 11 tools tested for the LWA,1s parameter. A sixth tool (Tool D) verified for the LpA,1s parameter. The two parameters are derived from independent measurements, although they may be made at the same time during the same operation. This could be a flaw in the test method with limited measurement positions not accurately capturing a highly directional noise source.
• Provided all conditions are maintained, the standard laboratory test is repeatable, though not necessarily reproducible for the determination of LpA,1s. If a variable is introduced, for
vii
example, a change in operator, the uncertainty of measurement can increase beyond the uncertainty value attached to the noise descriptor.
• For the determination of LWA,1s, the standard laboratory test is not sufficiently repeatable or reproducible.
• The actuation mode of the tool (contact, single sequential or full sequential) does not affect the noise emitted from the tool beyond the uncertainty value attached to the noise descriptor.
• The test method described in BS EN 12549:1999 has the potential to distinguish between low and high noise tools even though the tool types covered by the standard are very different. Significantly more field data is required to determine whether users can reliably make use of emission data to identify low or high noise tools in practice. The relationship between the declared emission, laboratory measured emission and the field data could not be determined.
• Field measurements showed that in real use noise emissions may vary by up to 15 dB on a single tool dependent on the process, workpiece and the working environment. Noise from fastener driving tools is likely to be a significant contributor to risk of hearing damage if a person is exposed to more than about 500 events per day (an LpA,1s value in the region of 98 to 100 dB giving an equivalent eight-hour daily personal exposure, LEP,d, of approximately 81 dB). For other tools the risk could be significant after only 100 events per day (an LpA,1s value of 105 dB giving an equivalent LEP,d of approximately 80 dB).
Recommendations
• Alert tool manufacturers to their duties under SM(S)R with regards to provision of airborne noise emission data.
• Advise standards bodies and tool manufacturers that repeatability and reproducibility of declared emissions is not sufficiently high.
• Alert end-users of tools that the declared noise emissions may not sufficiently indicate the risk to the worker.
viii

1 INTRODUCTION
1.1 DECLARATION OF NOISE EMISSION
The Supply of Machinery (Safety) Regulations 1992 as amended place duties on machine manufacturers and suppliers to design and construct machinery in such a way that noise emissions are reduced to the lowest level taking account of technical progress and the availability of techniques for reducing noise, particularly at source. There is also a requirement that manufacturers and suppliers provide information on the airborne noise emissions of their products. The purpose of declaring such information allows verification of a low noise tool design. Additionally, purchasers and users of machinery are able to make informed choices regarding the safety of a potential purchase. The Control of Noise at Work Regulations 2005, which came into force in April 2006 implementing the EU Physical Agents (Noise) Directive (2003/10/EC), state that employers may use manufacturers’ tool data to assess the risk to their employees from exposure to noise.
Standards have been developed in support of the Machinery Directive that define how noise emission values should be obtained for different machine types. Ideally these standard tests should provide noise emission data that is representative of the expected noise exposure in real use, allow tools of the same type to be compared, and identify low-noise tools, thereby highlighting successful low-noise designs. However in practice it can be difficult to design a standard test that is both based on a realistic operation and which gives repeatable and reproducible results. It is therefore common for standard tests to be based on artificial operations. However in these situations, there is concern that the resultant standard noise emission data may not reflect the noise generated by the tool during normal use. There is therefore a need to evaluate these noise emission standards.
It should be noted that manufacturers are free to follow all, part or none of the safety standards and noise test codes. If such an approach is used, compliance with the regulations is still required with regard to using an appropriate test method, so long as operating conditions etc. are described, and information indicating risk during conditions of intended use is provided.
1.2 OUTLINE OF WORK
The aims of the work reported here were to: • Measure the noise emission of the tools supplied by the manufacturers and compare to the
manufacturers’ declared emission, if stated • Determine whether tools with a declared noise emission have been tested in accordance
with the most appropriate test code • Comment on the suitability of the noise test methods for the family of tool under test • Investigate the link between the manufacturers’ declared emission and the in real use
emission
This project was carried out in conjunction with HSL project JR45.086, an investigation into the correlation between vibration emission and vibration during real use on fastener driving tools as reported in NV/06/24.
1.3 TERMINOLOGY FOR EMISSION DATA
The noise emission data declared by the manufacturer and supplied with the fastener driving tool (where available) is referred to as the “declared emission”.
1
1.4
The noise emission measured by HSL in accordance with the requirements of the relevant standard is referred to as the “measured emission”.
ACOUSTIC PARAMETERS
The acoustic parameters used to characterise the noise emissions from fastener driving tools are:
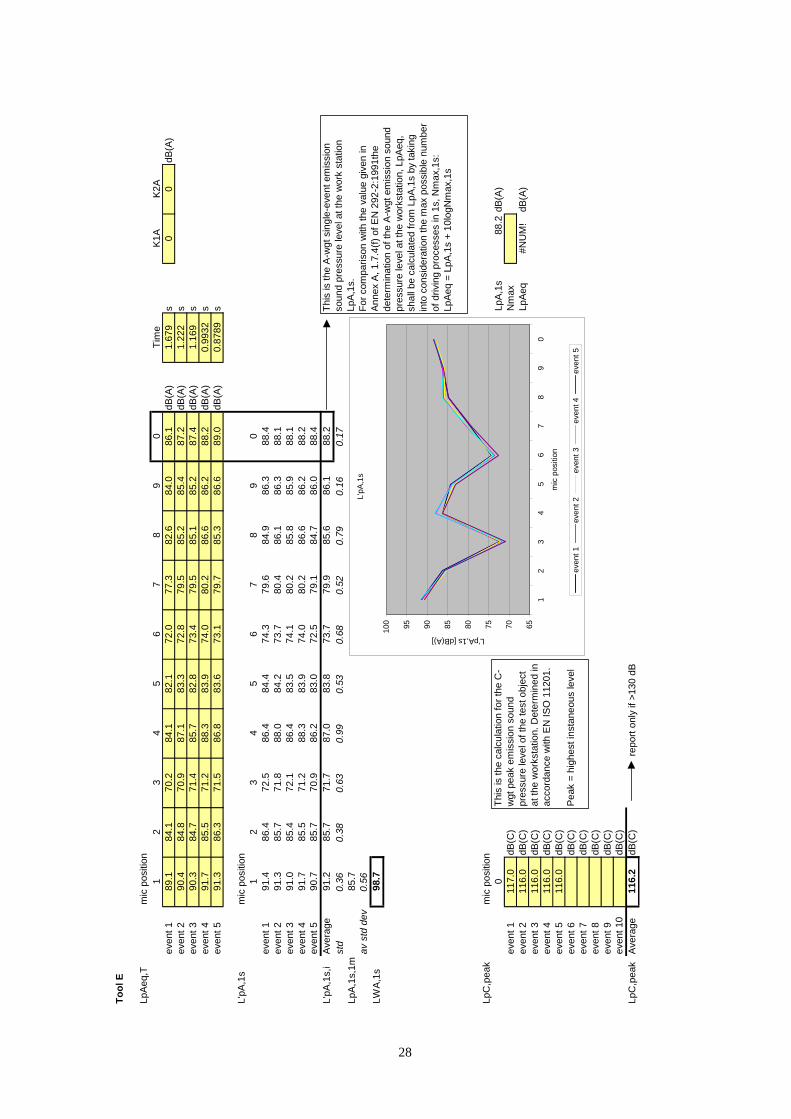
LpA,1s, A-weighted single-event emission sound pressure level in dB: A-weighted and time-integrated emission sound pressure level of an isolated single sound event of specified duration T (or specified measurement time T), related to the reference time of T0 of 1s.
For example: A shot is fired from a fastener driving tool. The duration of the measurement, T, is 5.5 seconds and the sound pressure level over the measurement period, LAeq,T, is 92.6dB. A second shot is fired from the tool. This time the measurement duration is 2.3 seconds and the sound pressure level 96.4dB. It is possible to compare the noise levels of the two shots by normalising the measurement period to 1 second, i.e. calculating the LpA,1s.
LpA,1s = LAeq,T + 10 log (T/T0) dB
For shot 1: LpA,1s = 92.6 +10 log (5.5/1) = 100dB
For shot 2: LpA,1s = 96.4 + 10 log (2.3/1) = 100dB
The LpA,1s from the example fastener driving tool is 100dB.
When only the LpA,1s is known and the number of shots per day or shift can be estimated it is possible to estimate the personal daily exposure level, LEP,d as defined in the Control of Noise at Work Regulations 2005. For the example fastener driving tool, firing 900 shots, over an 8 hour day (28,800 seconds):
LEP,d = LpA,1s + 10 log (number of shots ÷ 28,800) = 85dB
This works because the sound pressure level from the fastener driving tool has been normalised to a 1-second measurement period.
LWA,1s, A-weighted single-event sound power level in dB: A-weighted sound power level determined from measurements of the single-event emission sound pressure level normalised to 1 second.
LpC,peak, C-weighted peak emission sound pressure level in dB: C-weighted peak emission sound pressure level of a test object, determined in accordance with EN ISO 11201 at the work station.
2
2.1
2 TOOLS TESTED
Fastener driving tools can be used for a wide range of applications from pallet making to upholstery and picture framing. Tools are available in a wide range of sizes and specifications. The frequency of the driving processes with a fastener driving tool varies in time according to the operation purpose e.g. 500 driving operations per day with a large tool or 20 operations per second with a small tool. The tools used for this project were chosen based on information from the Power Fastenings Association (PFA) regarding the best selling tools of individual manufacturers. The sample of chosen tools is intended to reflect the range of machines encompassed by the standard test, within the limitations of the project, so that resultant information will be useful to as many manufacturers and employers as possible.
DECLARED EMISSIONS
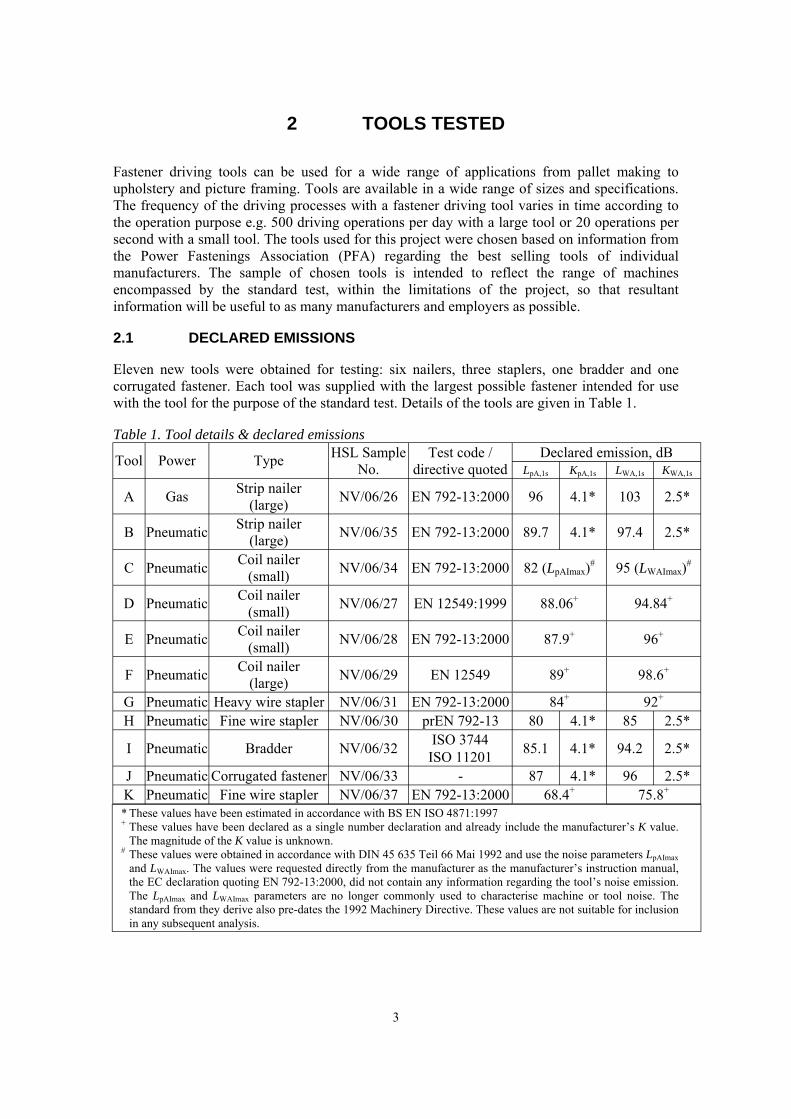
Eleven new tools were obtained for testing: six nailers, three staplers, one bradder and one corrugated fastener. Each tool was supplied with the largest possible fastener intended for use with the tool for the purpose of the standard test. Details of the tools are given in Table 1.
Table 1. Tool details & declared emissions
Tool Power Type HSL Sample No.
Test code / directive quoted
Declared emission, dB LpA,1s KpA,1s LWA,1s KWA,1s
A Gas Strip nailer (large) NV/06/26 EN 792-13:2000 96 4.1* 103 2.5*
B Pneumatic Strip nailer (large) NV/06/35 EN 792-13:2000 89.7 4.1* 97.4 2.5*
C Pneumatic Coil nailer (small) NV/06/34 EN 792-13:2000 82 (LpAImax)# 95 (LWAImax)#
D Pneumatic Coil nailer (small) NV/06/27 EN 12549:1999 88.06+ 94.84+
E Pneumatic Coil nailer (small) NV/06/28 EN 792-13:2000 87.9+ 96+
F Pneumatic Coil nailer (large) NV/06/29 EN 12549 89+ 98.6+
G Pneumatic Heavy wire stapler NV/06/31 EN 792-13:2000 84+ 92+
H Pneumatic Fine wire stapler NV/06/30 prEN 792-13 80 4.1* 85 2.5*
I Pneumatic Bradder NV/06/32 ISO 3744 ISO 11201 85.1 4.1* 94.2 2.5*
J Pneumatic Corrugated fastener NV/06/33 - 87 4.1* 96 2.5* K Pneumatic Fine wire stapler NV/06/37 EN 792-13:2000 68.4+ 75.8+
* These values have been estimated in accordance with BS EN ISO 4871:1997 + These values have been declared as a single number declaration and already include the manufacturer’s K value.
The magnitude of the K value is unknown. # These values were obtained in accordance with DIN 45 635 Teil 66 Mai 1992 and use the noise parameters LpAImax
and LWAImax. The values were requested directly from the manufacturer as the manufacturer’s instruction manual, the EC declaration quoting EN 792-13:2000, did not contain any information regarding the tool’s noise emission. The LpAImax and LWAImax parameters are no longer commonly used to characterise machine or tool noise. The standard from they derive also pre-dates the 1992 Machinery Directive. These values are not suitable for inclusion in any subsequent analysis.
3
2.2 ACTUATION MODES
A fastener driving tool may have several modes of operation; this is dependent on the type of trigger fitted to the tool. For the purposes of the laboratory emission testing, tools were operated using sequential actuation. The exceptions were tools H and K. These do not have a safety contact element. The colour of the trigger usually defines the actuation mode in use, although this can be dependent on the individual manufacturer’s colour coding protocol. The most commonly used tool actuation systems with a safety contact element are:
• Contact actuation (also known as ‘bump action’) The safety contact trip and the trigger both have to be actuated but with no order of sequence. The trigger can be depressed and the safety contact element ‘bumped’ against the work piece to cycle the tool. Alternatively, for more precise nail placement, the safety contact element can be placed against the work piece and the trigger pressed.
• Single sequential actuation A system in which the tool may only be operated by observing a sequence of operations. The safety contact element is depressed to the work piece, and the tool is then cycled by depressing the trigger. Repeat cycling can be obtained provided the safety contact element is not removed from the work piece. When the safety element is removed from the work piece, the sequence has to be repeated.
• Full sequential actuation A system in which the safety contact element has to be depressed against the work piece and thereafter the trigger pressed. To drive the next fastener, the safety element has to be removed from the work piece, so that it defaults back to the starting position, and the process repeated for every driving operation.
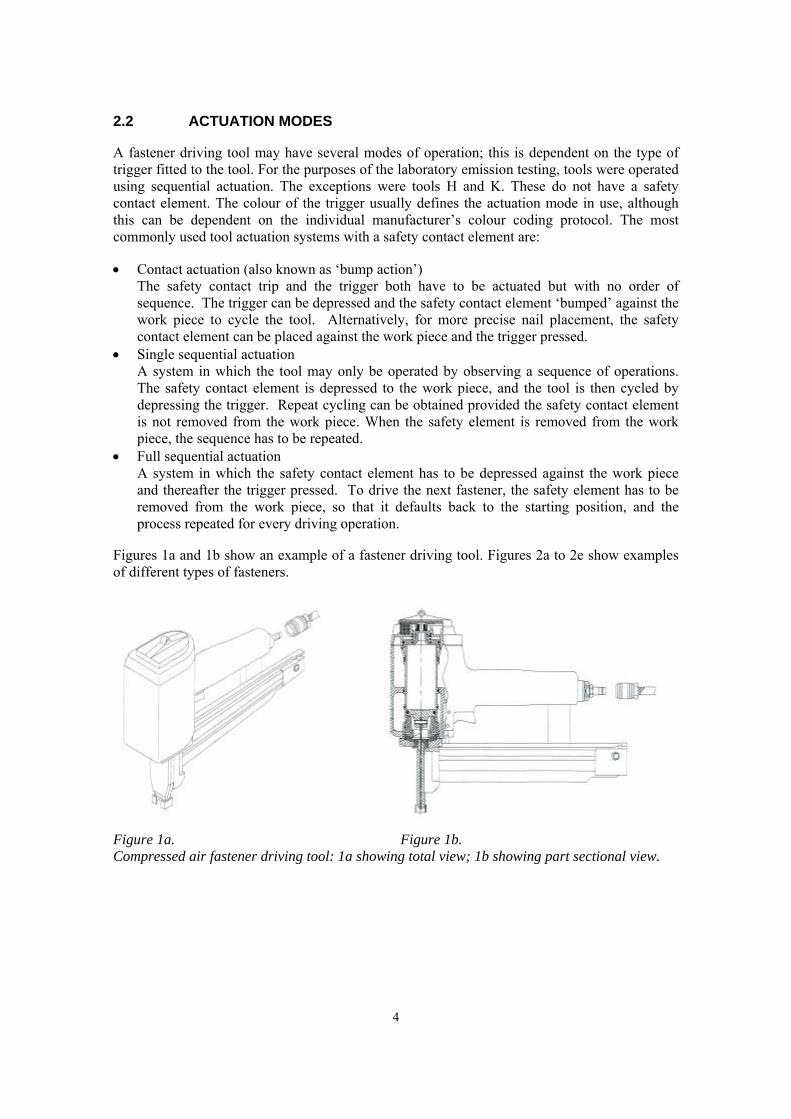
Figures 1a and 1b show an example of a fastener driving tool. Figures 2a to 2e show examples of different types of fasteners.
Figure 1a. Figure 1b. Compressed air fastener driving tool: 1a showing total view; 1b showing part sectional view.
4
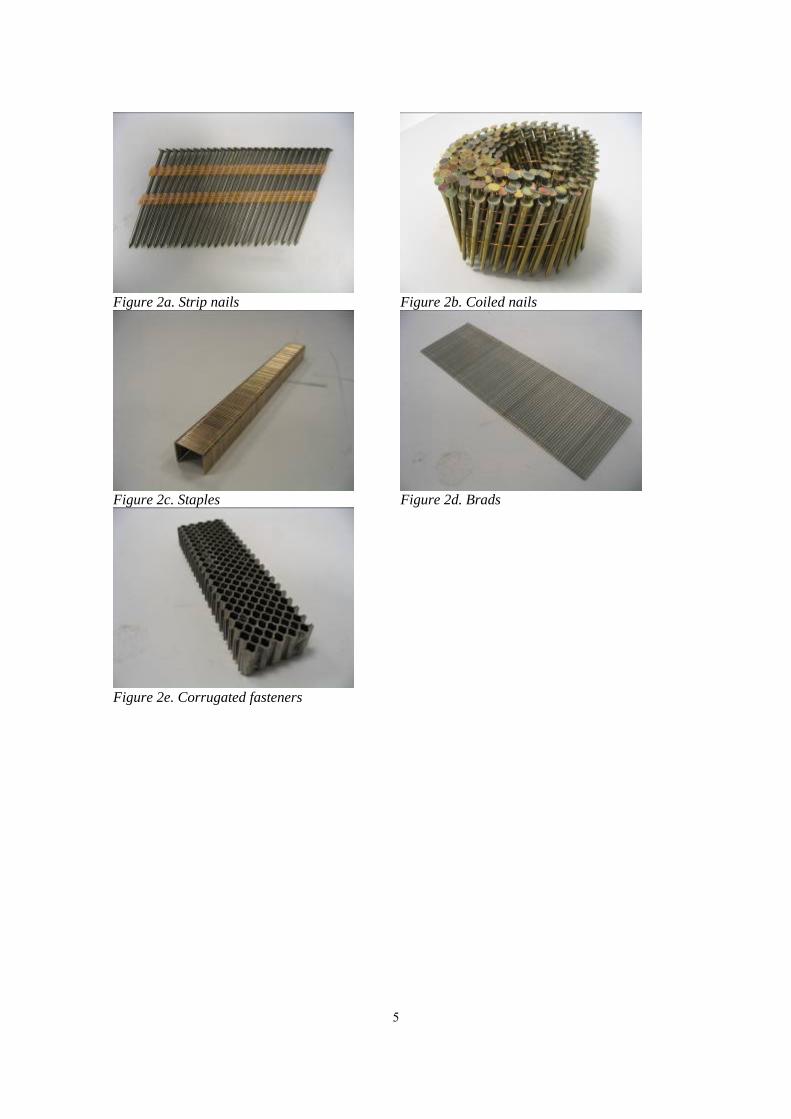
Figure 2a. Strip nails Figure 2b. Coiled nails
Figure 2c. Staples Figure 2d. Brads
Figure 2e. Corrugated fasteners
5
3 LABORATORY TESTING OF NOISE EMISSION
3.1 SAFETY STANDARDS / NOISE TEST CODES
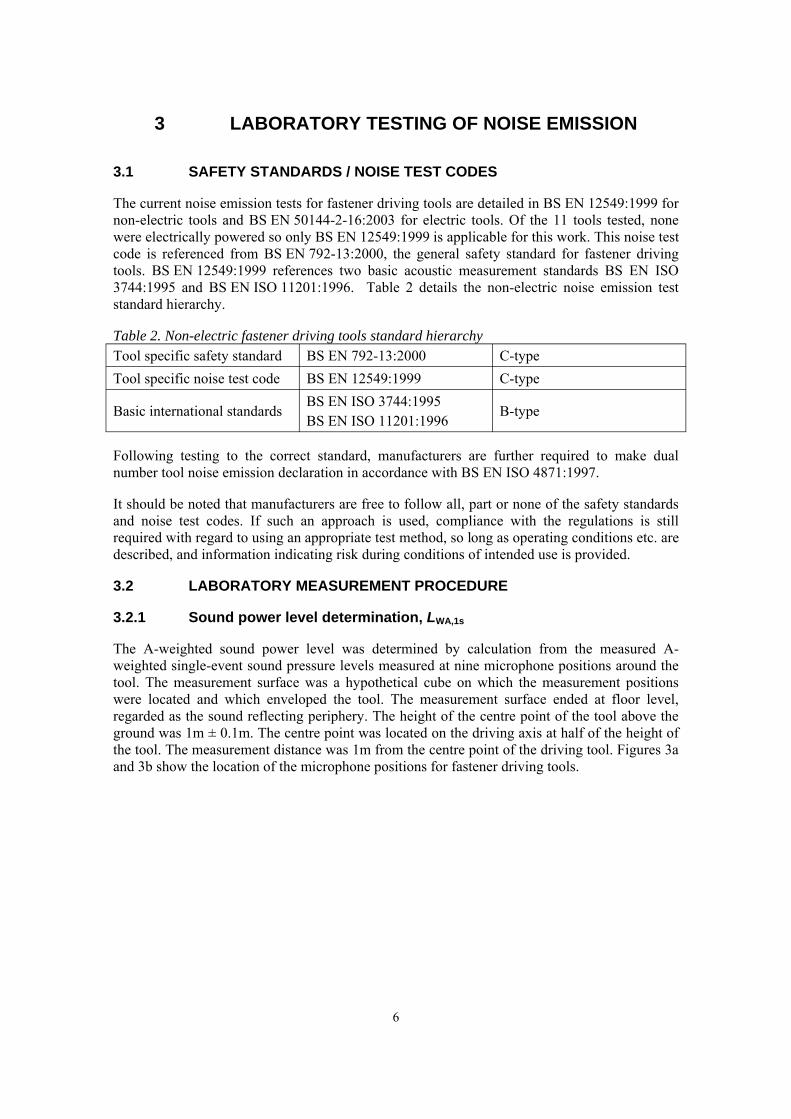
The current noise emission tests for fastener driving tools are detailed in BS EN 12549:1999 for non-electric tools and BS EN 50144-2-16:2003 for electric tools. Of the 11 tools tested, none were electrically powered so only BS EN 12549:1999 is applicable for this work. This noise test code is referenced from BS EN 792-13:2000, the general safety standard for fastener driving tools. BS EN 12549:1999 references two basic acoustic measurement standards BS EN ISO 3744:1995 and BS EN ISO 11201:1996. Table 2 details the non-electric noise emission test standard hierarchy.
Table 2. Non-electric fastener driving tools standard hierarchy Tool specific safety standard BS EN 792-13:2000 C-type Tool specific noise test code BS EN 12549:1999 C-type
Basic international standards BS EN ISO 3744:1995 BS EN ISO 11201:1996
B-type
Following testing to the correct standard, manufacturers are further required to make dual number tool noise emission declaration in accordance with BS EN ISO 4871:1997.
It should be noted that manufacturers are free to follow all, part or none of the safety standards and noise test codes. If such an approach is used, compliance with the regulations is still required with regard to using an appropriate test method, so long as operating conditions etc. are described, and information indicating risk during conditions of intended use is provided.
3.2 LABORATORY MEASUREMENT PROCEDURE
3.2.1 Sound power level determination, LWA,1s
The A-weighted sound power level was determined by calculation from the measured A-weighted single-event sound pressure levels measured at nine microphone positions around the tool. The measurement surface was a hypothetical cube on which the measurement positions were located and which enveloped the tool. The measurement surface ended at floor level, regarded as the sound reflecting periphery. The height of the centre point of the tool above the ground was 1m ± 0.1m. The centre point was located on the driving axis at half of the height of the tool. The measurement distance was 1m from the centre point of the driving tool. Figures 3a and 3b show the location of the microphone positions for fastener driving tools.
6
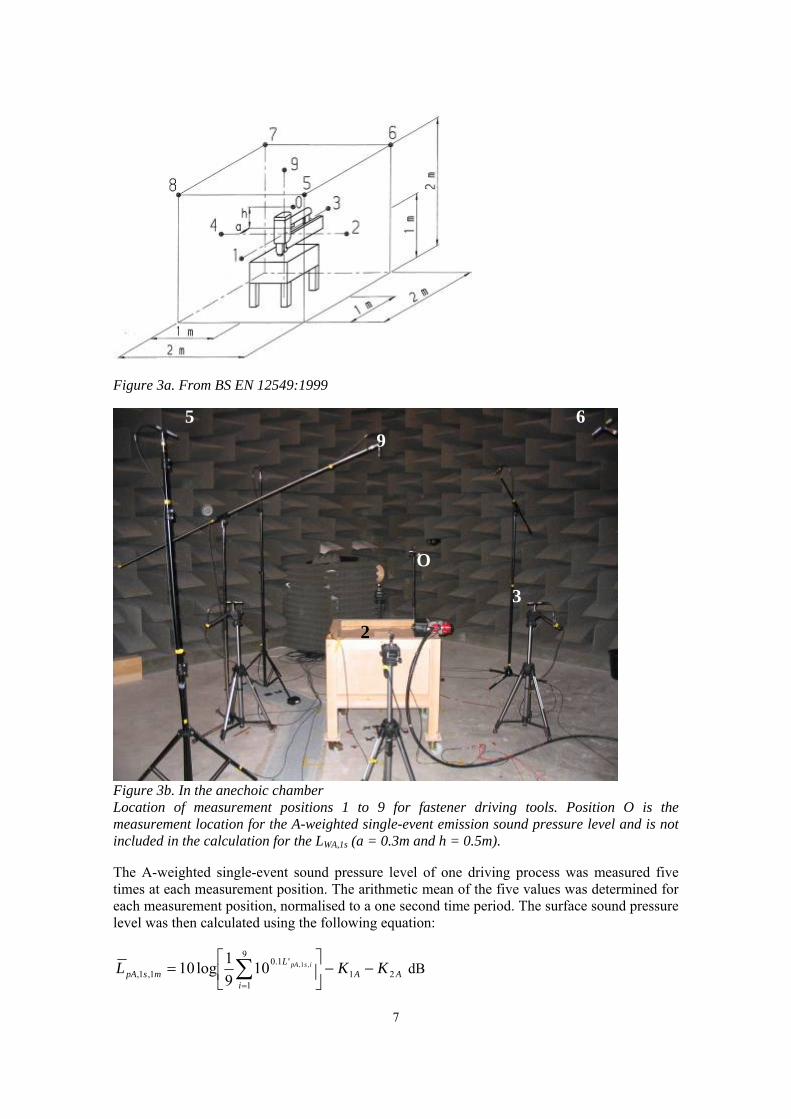
Figure 3a. From BS EN 12549:1999
5 9
6
O
3
2
Figure 3b. In the anechoic chamber Location of measurement positions 1 to 9 for fastener driving tools. Position O is the measurement location for the A-weighted single-event emission sound pressure level and is not included in the calculation for the LWA,1s (a = 0.3m and h = 0.5m).
The A-weighted single-event sound pressure level of one driving process was measured five times at each measurement position. The arithmetic mean of the five values was determined for each measurement position, normalised to a one second time period. The surface sound pressure level was then calculated using the following equation:
L 9
pA 1, 1, m = log 10 ⎡⎢ 1 ∑ 10 1.0 L ' pA 1 , i s ⎤ ,
⎥ − K1A − K 2 A dBs⎣ 9 i=1 ⎦
7

The background noise correction K1A and environmental correction K2A were negligible because testing was carried out in an anechoic test chamber over a reflecting plane.
The A-weighted sound power level was finally calculated using:
LWA 1, s = LpA 1, 1, m + 13 dBs
3.2.2 Emission sound pressure level determination, LpA,1s
The A-weighted single-event emission sound pressure level at the workstation was calculated from the arithmetic mean of five corresponding measurements at microphone position O, each for one driving process, normalised to a one second time period. The location of position O is shown in Figures 3a and 3b.
3.2.3 Workpiece and workpiece support
The workpiece was sawn pinewood, free of knots and with a straight grain. The average bulk density was in the range of 0.42gcm-3 to 0.48gcm-3 and the average wood humidity was 12% ± 3%. For all tools, the thickness of the wood was at least 1.2 times the length of the longest fastener used. The insertion position was at least 50mm from the lateral surfaces of the workpiece.
The workpiece was supported on a bed of dry sand with the grain of the wood in a horizontal direction such that the surface of the workpiece was flush with the top of the sand. The sand bed was 600m (L) x 600m (W) x 400mm (H). The workpiece was surrounded on all lateral surfaces by a sand layer at least 120mm wide.
3.3 DATA ACQUISITION AND ANALYSIS
The measured broadband A-weighted single-event sound pressure levels and the broadband A-weighted single-event emission sound pressure levels were recorded and analysed using a Brüel & Kjær (B&K) Pulse multi-channel real time frequency analyser. This meant that up to 11 channels could be measured simultaneously, allowing the workstation levels at microphone position O to be recorded at the same time as the nine microphone positions on the cuboid measurement surface. Full details of the equipment used are given in Appendix A. Throughout the laboratory emission testing the tool operator for a given tool remained the same for each of the five shots fired for that tool. Where applicable, the compressed air pressure was adjusted for each tool such that the head of the fastener was just below the surface of the workpiece.
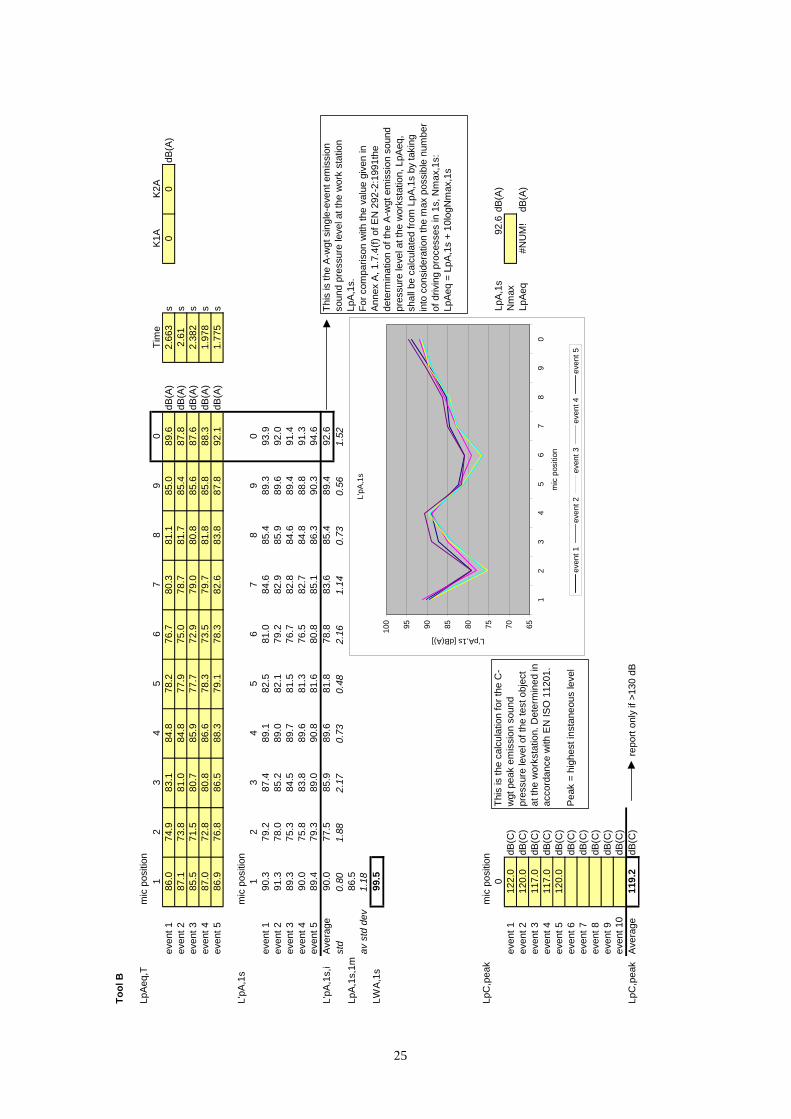
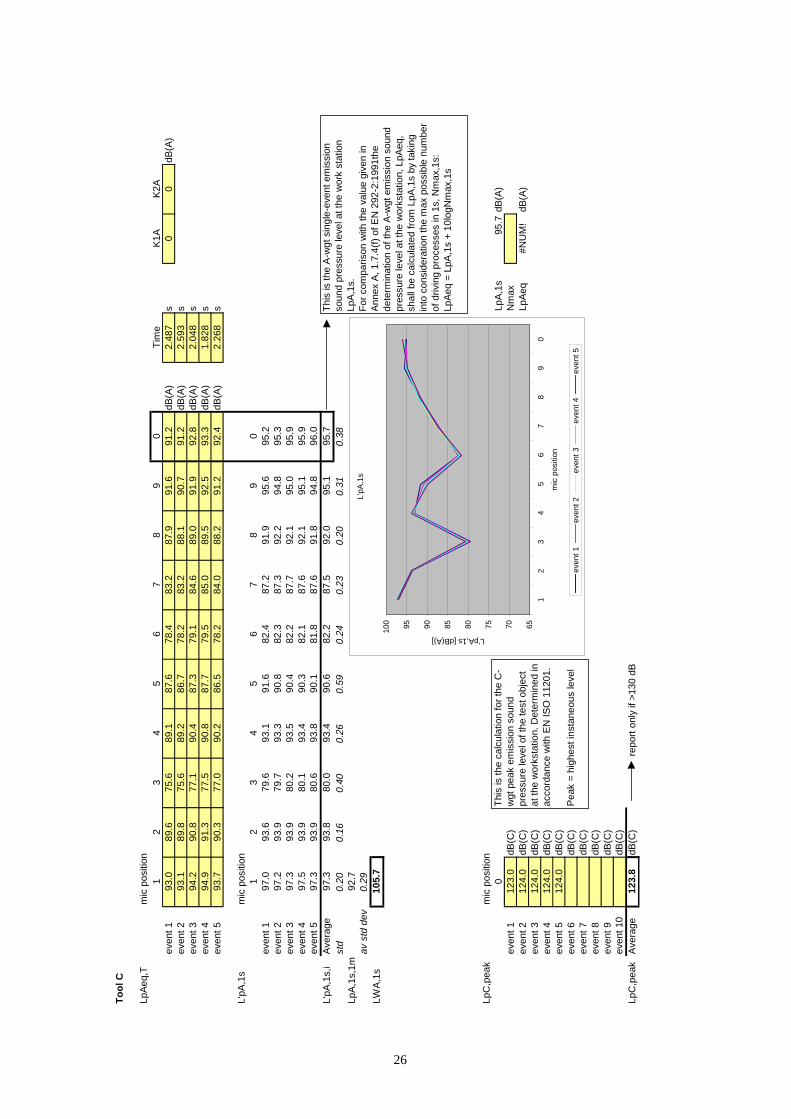
3.4 MEASURED EMISSION RESULTS
Table 3 details the measured emission results for each tool tested. All tools were tested in accordance with BS EN 12549:1999 and the results are presented in accordance with BS EN 4871:1997. Full details can be found in Appendix B.
8
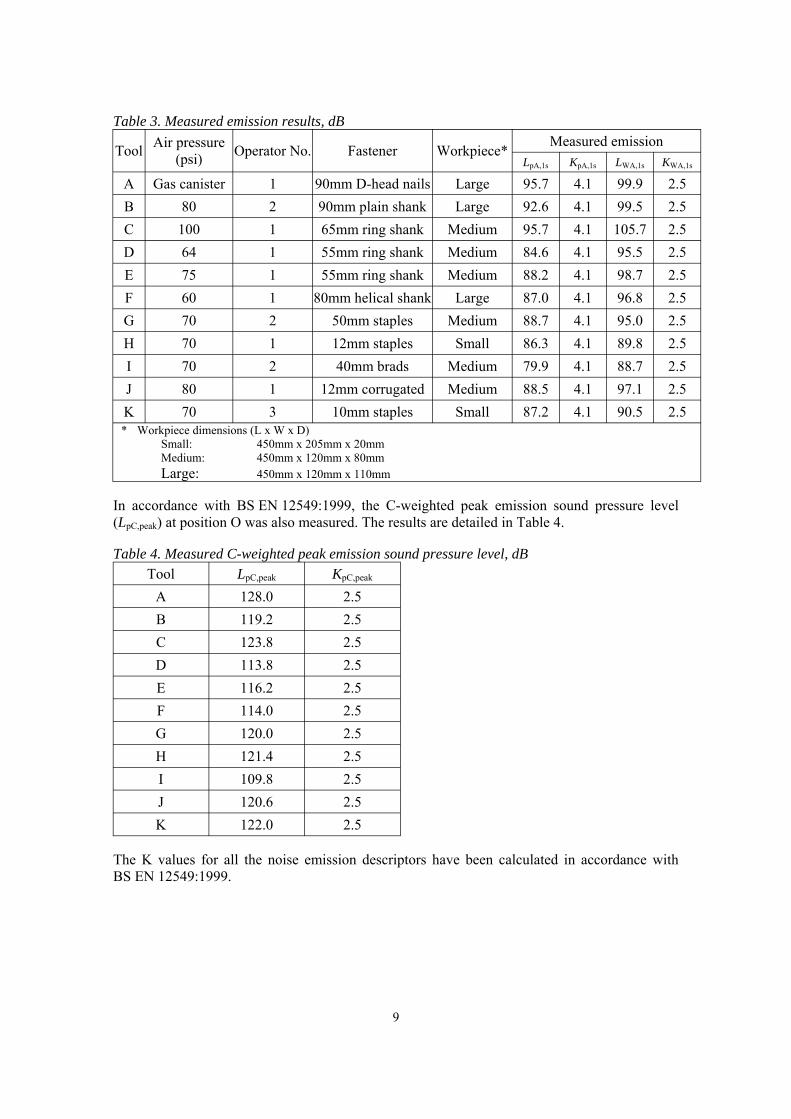
Table 3. Measured emission results, dB
Tool Air pressure (psi) Operator No. Fastener Workpiece* Measured emission
LpA,1s KpA,1s LWA,1s KWA,1s
A Gas canister 1 90mm D-head nails Large 95.7 4.1 99.9 2.5 B 80 2 90mm plain shank Large 92.6 4.1 99.5 2.5 C 100 1 65mm ring shank Medium 95.7 4.1 105.7 2.5 D 64 1 55mm ring shank Medium 84.6 4.1 95.5 2.5 E 75 1 55mm ring shank Medium 88.2 4.1 98.7 2.5 F 60 1 80mm helical shank Large 87.0 4.1 96.8 2.5 G 70 2 50mm staples Medium 88.7 4.1 95.0 2.5 H 70 1 12mm staples Small 86.3 4.1 89.8 2.5 I 70 2 40mm brads Medium 79.9 4.1 88.7 2.5 J 80 1 12mm corrugated Medium 88.5 4.1 97.1 2.5 K 70 3 10mm staples Small 87.2 4.1 90.5 2.5 * Workpiece dimensions (L x W x D)
Small: 450mm x 205mm x 20mm Medium: 450mm x 120mm x 80mm Large: 450mm x 120mm x 110mm
In accordance with BS EN 12549:1999, the C-weighted peak emission sound pressure level (LpC,peak) at position O was also measured. The results are detailed in Table 4.
Table 4. Measured C-weighted peak emission sound pressure level, dB Tool LpC,peak KpC,peak
A 128.0 2.5 B 119.2 2.5 C 123.8 2.5 D 113.8 2.5 E 116.2 2.5 F 114.0 2.5 G 120.0 2.5 H 121.4 2.5 I 109.8 2.5 J 120.6 2.5 K 122.0 2.5
The K values for all the noise emission descriptors have been calculated in accordance with BS EN 12549:1999.
9
4 ADDITIONAL LABORATORY TESTS
4.1 SEQUENTIAL ACTUATION VERSUS ‘BUMP’ ACTION
4.1.1 Measurement method
Tools C, D, E, F and J were capable of ‘bump action’ actuation. The laboratory emission test for these tools was repeated as described in Section 3.2 using first the sequential actuation mode followed by the ‘bump action’ actuation. Repeating the standard emission test gives an indication of the repeatability of the test.
4.1.2 Results
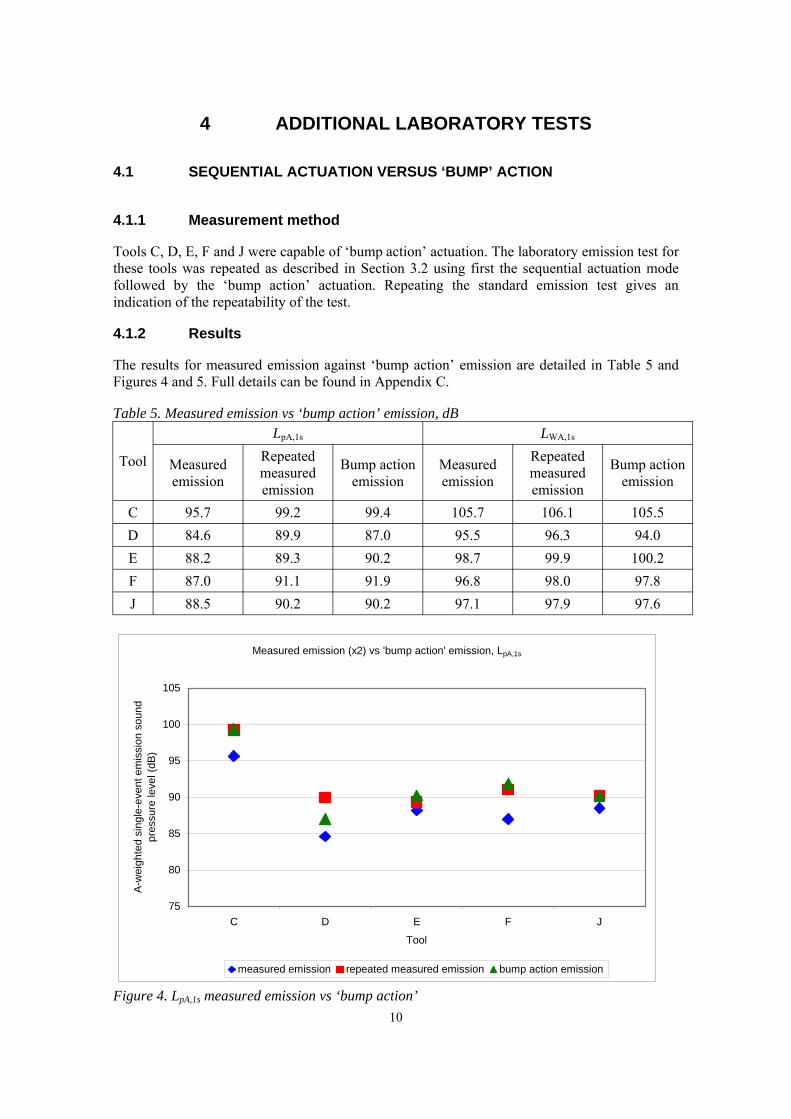
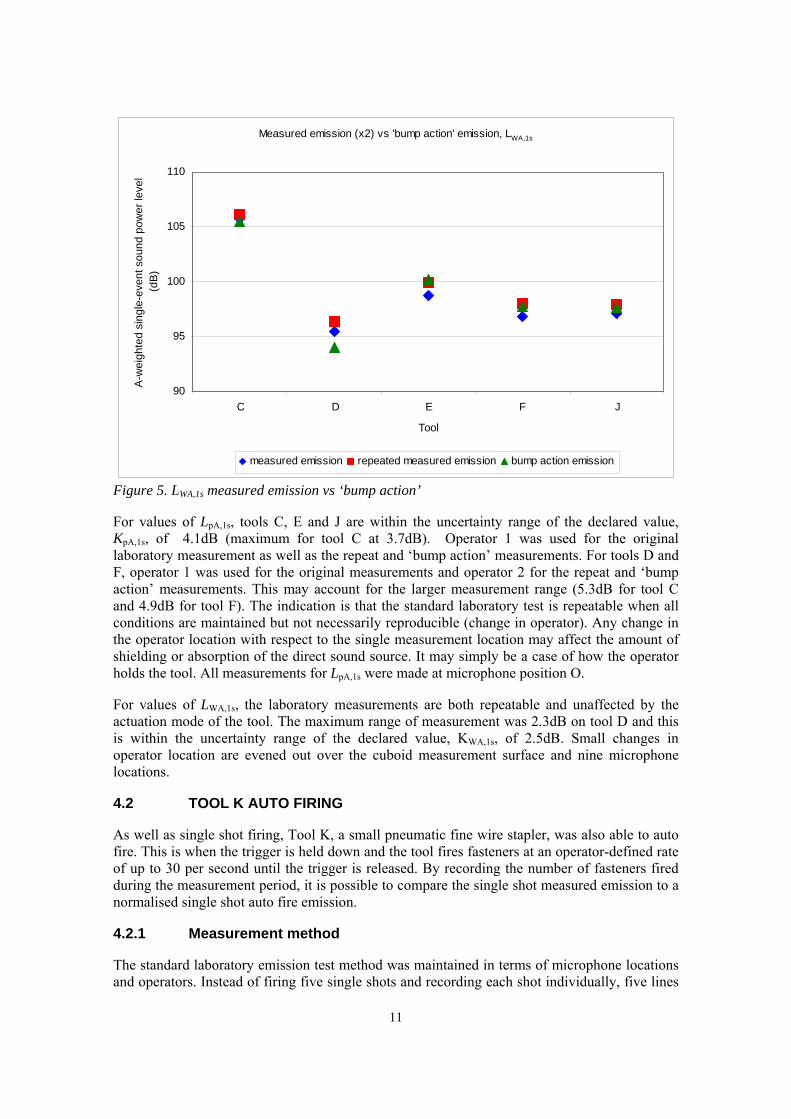
The results for measured emission against ‘bump action’ emission are detailed in Table 5 and Figures 4 and 5. Full details can be found in Appendix C.
Table 5. Measured emission vs ‘bump action’ emission, dB
Tool
LpA,1s LWA,1s
Measured emission
Repeated measured emission
Bump action emission
Measured emission
Repeated measured emission
Bump action emission
C 95.7 99.2 99.4 105.7 106.1 105.5 D 84.6 89.9 87.0 95.5 96.3 94.0 E 88.2 89.3 90.2 98.7 99.9 100.2 F 87.0 91.1 91.9 96.8 98.0 97.8 J 88.5 90.2 90.2 97.1 97.9 97.6
Measured emission (x2) vs 'bump action' emission, LpA,1s
75
80
85
90
95
100
105
pres
sure
leve
l (dB
)A-
wei
ghte
d si
ngle
-eve
nt e
mis
sion
sou
nd
C D E F J
Tool
i ion i ion ion emi ionmeasured em ss repeated measured em ss bump act ss
Figure 4. LpA,1s measured emission vs ‘bump action’ 10
i ion ( i ion, L
90
95
100
105
110
C D E F J
(dB
)
i ion i ion ion emi ion
Measured emss x2) vs 'bump action' emss WA,1s
Tool
A-w
eigh
ted
sing
le-e
vent
sou
nd p
ower
leve
l
measured emss repeated measured emss bump act ss
Figure 5. LWA,1s measured emission vs ‘bump action’
For values of LpA,1s, tools C, E and J are within the uncertainty range of the declared value, KpA,1s, of 4.1dB (maximum for tool C at 3.7dB). Operator 1 was used for the original laboratory measurement as well as the repeat and ‘bump action’ measurements. For tools D and F, operator 1 was used for the original measurements and operator 2 for the repeat and ‘bump action’ measurements. This may account for the larger measurement range (5.3dB for tool C and 4.9dB for tool F). The indication is that the standard laboratory test is repeatable when all conditions are maintained but not necessarily reproducible (change in operator). Any change in the operator location with respect to the single measurement location may affect the amount of shielding or absorption of the direct sound source. It may simply be a case of how the operator holds the tool. All measurements for LpA,1s were made at microphone position O.
For values of LWA,1s, the laboratory measurements are both repeatable and unaffected by the actuation mode of the tool. The maximum range of measurement was 2.3dB on tool D and this is within the uncertainty range of the declared value, KWA,1s, of 2.5dB. Small changes in operator location are evened out over the cuboid measurement surface and nine microphone locations.
4.2 TOOL K AUTO FIRING
As well as single shot firing, Tool K, a small pneumatic fine wire stapler, was also able to auto fire. This is when the trigger is held down and the tool fires fasteners at an operator-defined rate of up to 30 per second until the trigger is released. By recording the number of fasteners fired during the measurement period, it is possible to compare the single shot measured emission to a normalised single shot auto fire emission.
4.2.1 Measurement method
The standard laboratory emission test method was maintained in terms of microphone locations and operators. Instead of firing five single shots and recording each shot individually, five lines
11
L
L
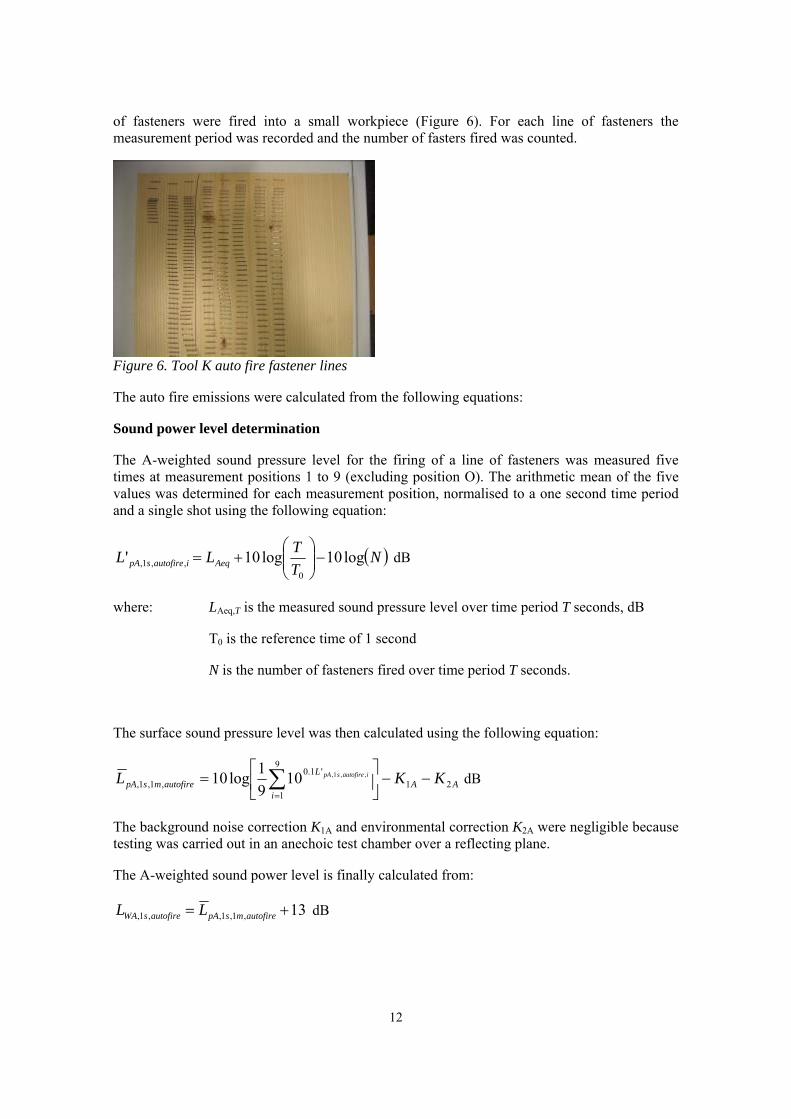
of fasteners were fired into a small workpiece (Figure 6). For each line of fasteners the measurement period was recorded and the number of fasters fired was counted.
Figure 6. Tool K auto fire fastener lines
The auto fire emissions were calculated from the following equations:
Sound power level determination
The A-weighted sound pressure level for the firing of a line of fasteners was measured five times at measurement positions 1 to 9 (excluding position O). The arithmetic mean of the five values was determined for each measurement position, normalised to a one second time period and a single shot using the following equation:
⎛⎜⎜
⎞⎟⎟
T − log 10 ( )N dB' i autofire s pA , 1, , =LAeq + log 10
T0⎝ ⎠
where: LAeq,T is the measured sound pressure level over time period T seconds, dB
T0 is the reference time of 1 second
N is the number of fasteners fired over time period T seconds.
The surface sound pressure level was then calculated using the following equation:
9⎡1 ⎤10 1.0 L ' pA 1 , i autofire s , ,∑pA 1, 1, autofire m s , = log 10 −K −K dB⎢⎣
⎥⎦
1A 2 A9 =1
The background noise correction K1A and environmental correction K2A were negligible because testing was carried out in an anechoic test chamber over a reflecting plane.
The A-weighted sound power level is finally calculated from:
i
LWA , 1, autofire s =LpA 1, 1, autofire m s , +13 dB
12
Emission sound pressure level
For each line of fasteners: LpA , 1, , Ni autofire s = LAeq + log 10 ⎛⎜⎜ T ⎞
⎟⎟ − log 10 ( ) dB ⎝ T0 ⎠
The arithmetic mean of the results for the five lines is taken as the measured auto fire emission sound pressure level.
4.2.2 Results
Table 6 details the results for the measured emission against the auto fire emission for tool K. Full details may be found in Appendix C.
Table 6. Tool K measured emission vs auto fire emission
Tool LpA,1s LWA,1s
Measured Auto fire Measured Auto fire K 87.2 88.4 90.5 91.4
For both LpA,1s and LWA,1s, the difference between the measured emissions and the auto fire emissions is well within the expected uncertainties in the declared emission values of 4.1dB (KpA,1s) and 2.5dB (KWA,1s).
13
5 IN REAL USE / FIELD MEASUREMENTS
5.1 MEASUREMENT PROTOCOL
Following the laboratory emission test stage of the project, the intention was to take the tools to a number of industrial locations where fastener drivers are used for various applications. Finding sites capable of accommodating multiple tools was very difficult as nearly every tool is very application specific. To help overcome this, simulated real data was also obtained in the laboratory. Table 7 details which tools were applicable to which site.
Table 7. Site details Site no. Process Tools
1 Pallet repair B, C, D, E, F 2 Furniture manufacturing including upholstery G, H, K 3 HSL simulated real tacking and fixing A, I, J 4 Pallet manufacturer C, D, E, F
Due to the difficulty in finding sites able to accommodate multiple tools there is a lack of repeated data for tools A, G, H, I, J and K. Tools C, D, E and F were used at two sites. Consequently, results obtained during this stage of the project are presented for information only and will not be used in further analysis, as meaningful conclusions cannot be drawn. Where applicable, background corrections have been applied to the measured values but no further corrections have been made e.g. for environmental conditions. This allows a range of working conditions and resultant levels to be shown.
At each site, the measurement conditions were kept as close as possible to a real work situation with the tools supplied by HSL being substituted for a short period of time for the tools which were normally used in the workplace.
5.2 DATA AQUSITION & ANALYSIS
BS EN ISO 11202:1996 was used as the test method for obtaining in real use emission values. A B&K type 2260 sound level meter was used to record the A-weighted sound pressure level and the C-weighted peak sound pressure level at the operator’s ear. The levels, measurement duration and number of driving processes were noted. From this information it was possible to calculate the field A-weighted single-event emission sound pressure level, LpA,1s,field.
5.3 SITE DETAILS
Table 8 summarises the measurement conditions at each site and whether background corrections were applied to the measured levels. A more detailed explanation follows.
Table 8. Summary of measurement conditions and applied background corrections
Site no. Background correction required Notes on measurement conditions
1 Yes 2m from operator; semi-enclosed workstation. 2 No Open warehouse. 3 No Small room. 4 Yes Close to façade; possible influence from second worker.
14
Site #1 – pallet repair (tools B, C, D, E and F)
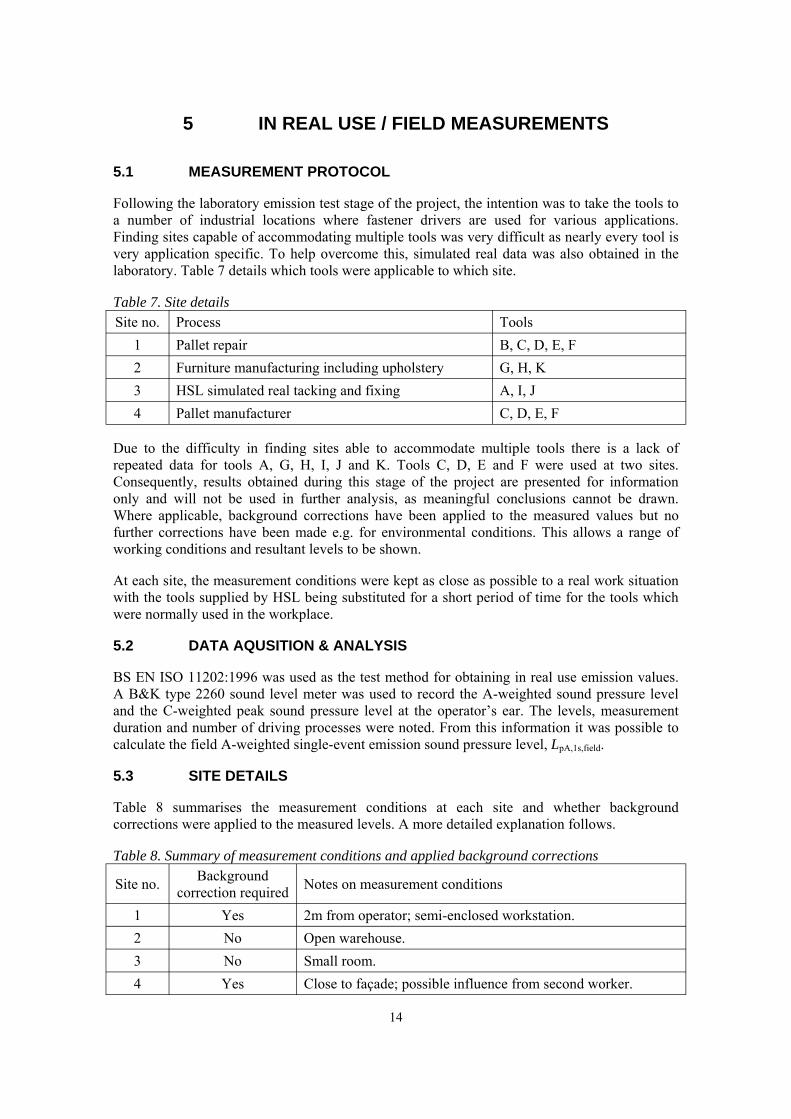
At site 1, it was not possible to measure the noise level at the operator’s ear due to on site health and safety restrictions. The sound level meter was set up at a distance of 2m from the operator’s location and at a height of 1.55m. Figure 7 shows the measurement set up.
Operator location
B&K 2260 sound level meter
Figure 7. Site #1 measurement set up
The background noise levels were high relative to the noise level from the tool. The values obtained at this site were corrected for background noise. Of 50 measurements made, 17 could be corrected for background noise. The remaining 33 measurements were discarded. Further corrections have not been made.
Site #2 – furniture manufacture including upholstery (tools G, H and K)
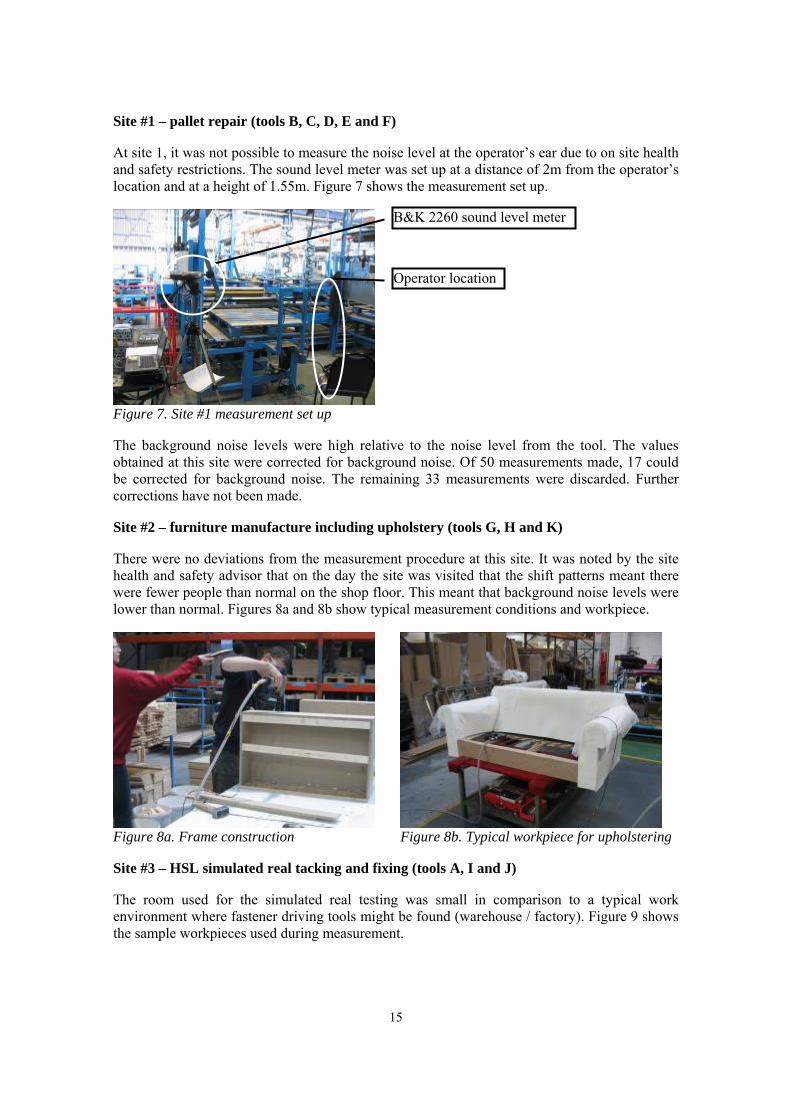
There were no deviations from the measurement procedure at this site. It was noted by the site health and safety advisor that on the day the site was visited that the shift patterns meant there were fewer people than normal on the shop floor. This meant that background noise levels were lower than normal. Figures 8a and 8b show typical measurement conditions and workpiece.
Figure 8a. Frame construction Figure 8b. Typical workpiece for upholstering
Site #3 – HSL simulated real tacking and fixing (tools A, I and J)
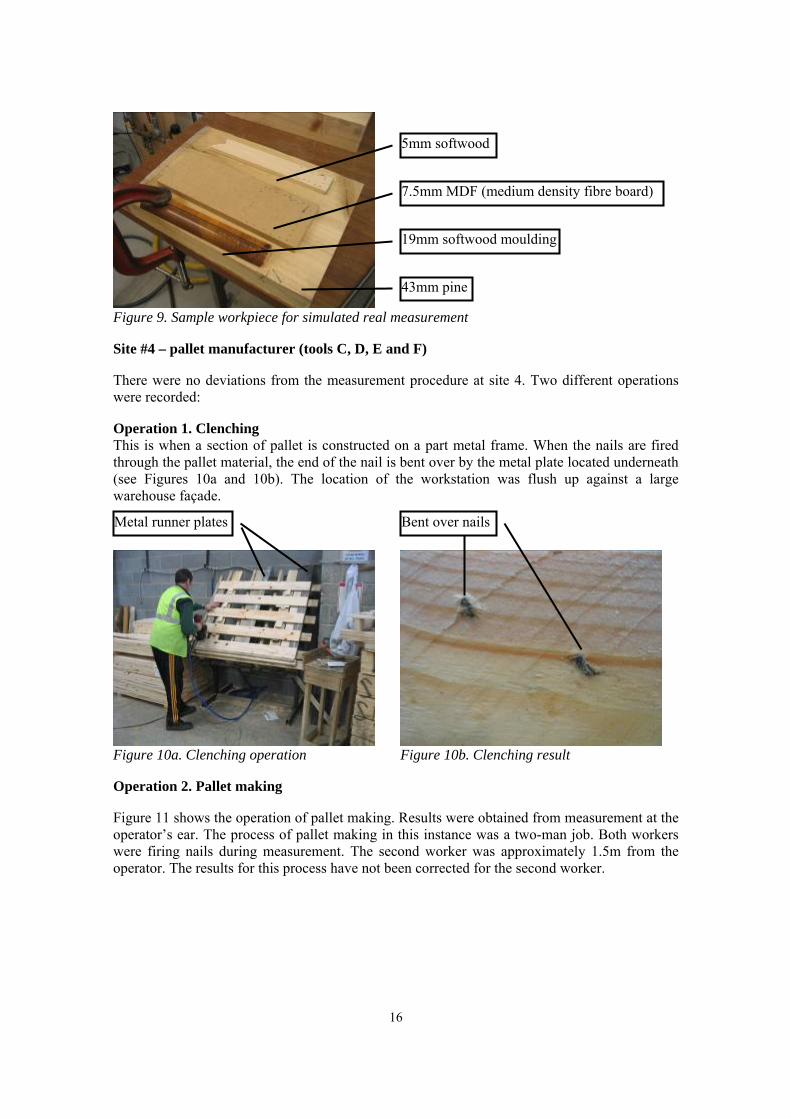
The room used for the simulated real testing was small in comparison to a typical work environment where fastener driving tools might be found (warehouse / factory). Figure 9 shows the sample workpieces used during measurement.
15
5mm softwood
19mm softwood moulding
7.5mm MDF (medium density fibre board)
43mm pine
Figure 9. Sample workpiece for simulated real measurement
Site #4 – pallet manufacturer (tools C, D, E and F)
There were no deviations from the measurement procedure at site 4. Two different operations were recorded:
Operation 1. Clenching This is when a section of pallet is constructed on a part metal frame. When the nails are fired through the pallet material, the end of the nail is bent over by the metal plate located underneath (see Figures 10a and 10b). The location of the workstation was flush up against a large warehouse façade.
Bent over nailsMetal runner plates
Figure 10a. Clenching operation Figure 10b. Clenching result
Operation 2. Pallet making
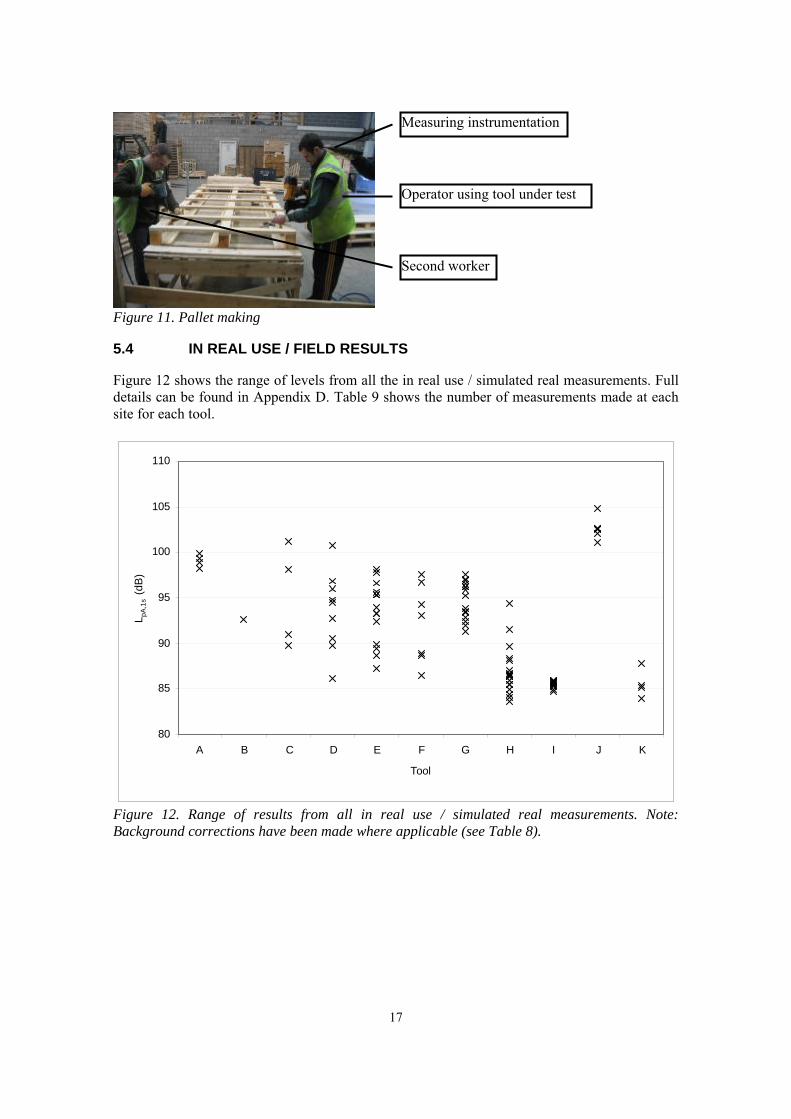
Figure 11 shows the operation of pallet making. Results were obtained from measurement at the operator’s ear. The process of pallet making in this instance was a two-man job. Both workers were firing nails during measurement. The second worker was approximately 1.5m from the operator. The results for this process have not been corrected for the second worker.
16
5.4
Measuring instrumentation
Operator using tool under test
Second worker
Figure 11. Pallet making
IN REAL USE / FIELD RESULTS
Figure 12 shows the range of levels from all the in real use / simulated real measurements. Full details can be found in Appendix D. Table 9 shows the number of measurements made at each site for each tool.
80
85
90
95
100
105
110
L (d
B)
pA,1
s
A B C D E F G H I J K
Tool
Figure 12. Range of results from all in real use / simulated real measurements. Note: Background corrections have been made where applicable (see Table 8).
17
L
L
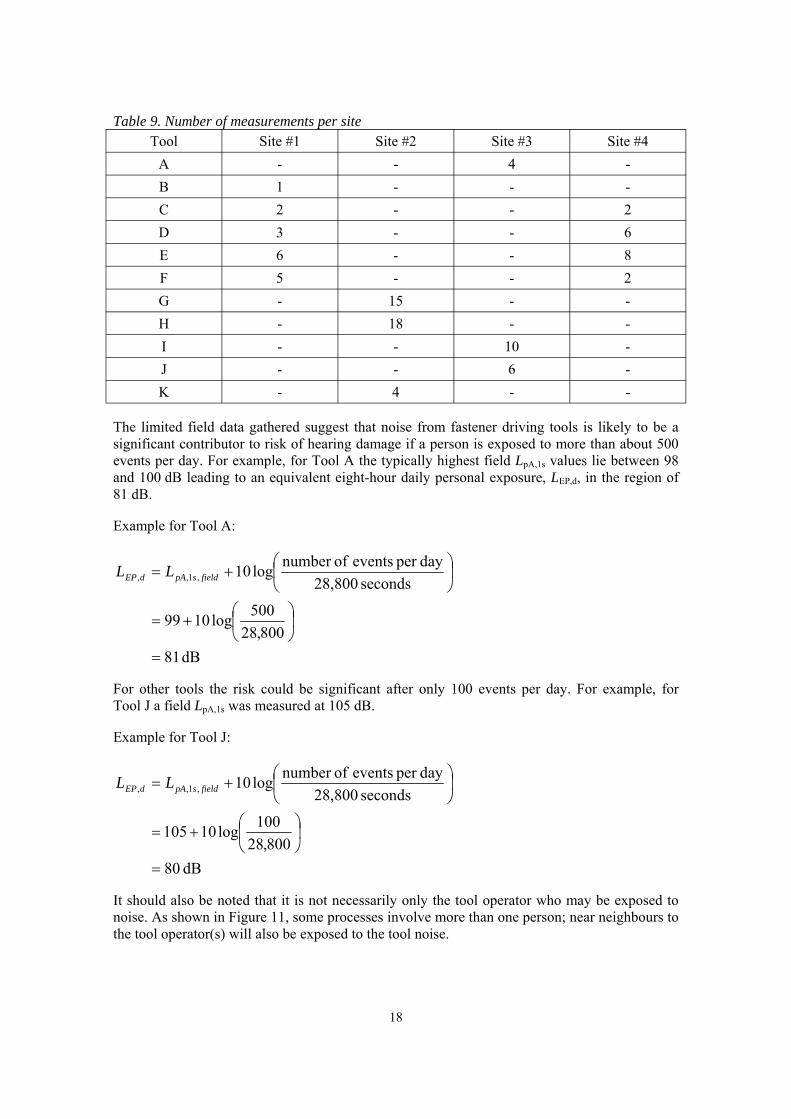
Table 9. Number of measurements per site Tool Site #1 Site #2 Site #3 Site #4
A - - 4 -B 1 - - -C 2 - - 2 D 3 - - 6 E 6 - - 8 F 5 - - 2 G - 15 - -H - 18 - -I - - 10 -J - - 6 -K - 4 - -
The limited field data gathered suggest that noise from fastener driving tools is likely to be a significant contributor to risk of hearing damage if a person is exposed to more than about 500 events per day. For example, for Tool A the typically highest field LpA,1s values lie between 98 and 100 dB leading to an equivalent eight-hour daily personal exposure, LEP,d, in the region of 81 dB.
Example for Tool A:
⎜⎝
⎛+ log 10 day per events of number
seconds 28,800 ⎞⎟⎠
L=,d EP pA , 1, fields
⎛⎜⎝
500
800,28⎞⎟⎠
99+ log 10 =
= dB 81
For other tools the risk could be significant after only 100 events per day. For example, for Tool J a field LpA,1s was measured at 105 dB.
Example for Tool J:
⎛⎜⎝
log 10 day per events of number seconds 28,800
⎞⎟⎠
L += ,d EP pA , 1, fields
⎛⎜⎝
100
800,28⎞⎟⎠
105+ log 10 =
= dB 80
It should also be noted that it is not necessarily only the tool operator who may be exposed to noise. As shown in Figure 11, some processes involve more than one person; near neighbours to the tool operator(s) will also be exposed to the tool noise.
18
6.1
6 DISCUSSION
VERIFICATION OF MANUFACTURERS’ DECLARED EMISSION
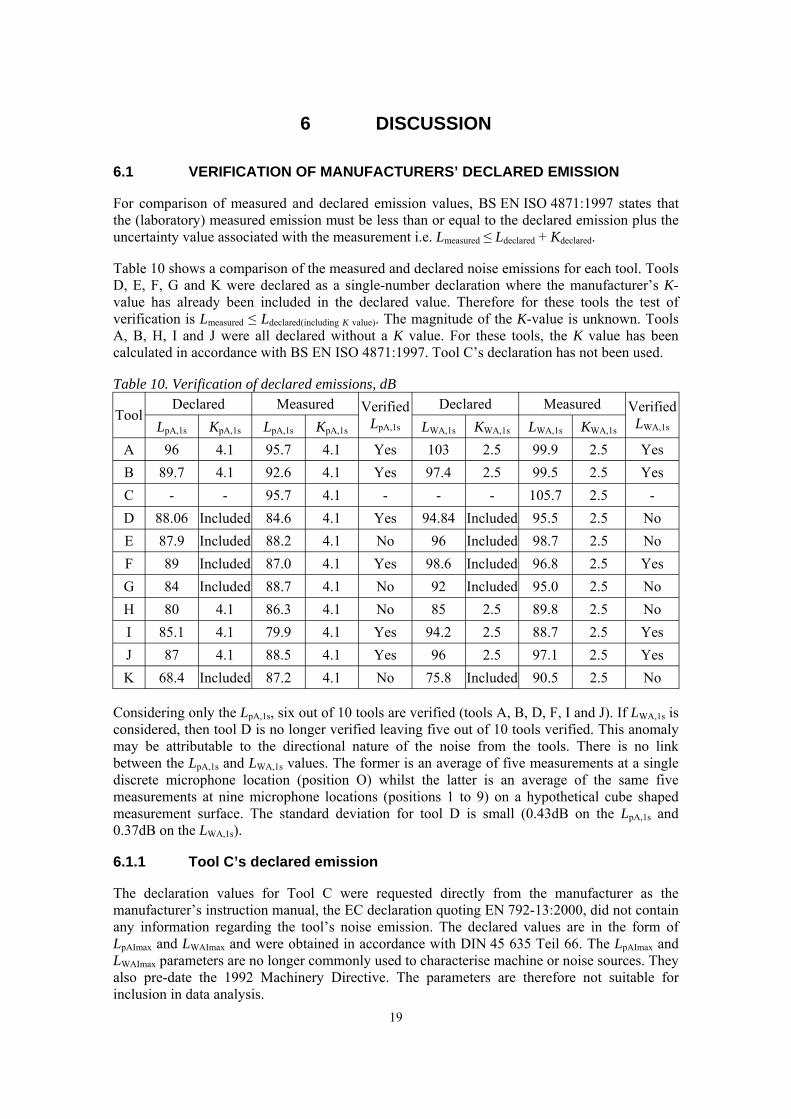
For comparison of measured and declared emission values, BS EN ISO 4871:1997 states that the (laboratory) measured emission must be less than or equal to the declared emission plus the uncertainty value associated with the measurement i.e. Lmeasured ≤ Ldeclared + Kdeclared.
Table 10 shows a comparison of the measured and declared noise emissions for each tool. Tools D, E, F, G and K were declared as a single-number declaration where the manufacturer’s K-value has already been included in the declared value. Therefore for these tools the test of verification is Lmeasured ≤ Ldeclared(including K value). The magnitude of the K-value is unknown. Tools A, B, H, I and J were all declared without a K value. For these tools, the K value has been calculated in accordance with BS EN ISO 4871:1997. Tool C’s declaration has not been used.
Table 10. Verification of declared emissions, dB
Tool Declared Measured Verified
LpA,1s
Declared Measured Verified LWA,1s LpA,1s KpA,1s LpA,1s KpA,1s LWA,1s KWA,1s LWA,1s KWA,1s
A 96 4.1 95.7 4.1 Yes 103 2.5 99.9 2.5 Yes B 89.7 4.1 92.6 4.1 Yes 97.4 2.5 99.5 2.5 Yes C - - 95.7 4.1 - - - 105.7 2.5 -D 88.06 Included 84.6 4.1 Yes 94.84 Included 95.5 2.5 No E 87.9 Included 88.2 4.1 No 96 Included 98.7 2.5 No F 89 Included 87.0 4.1 Yes 98.6 Included 96.8 2.5 Yes G 84 Included 88.7 4.1 No 92 Included 95.0 2.5 No H 80 4.1 86.3 4.1 No 85 2.5 89.8 2.5 No I 85.1 4.1 79.9 4.1 Yes 94.2 2.5 88.7 2.5 Yes J 87 4.1 88.5 4.1 Yes 96 2.5 97.1 2.5 Yes K 68.4 Included 87.2 4.1 No 75.8 Included 90.5 2.5 No
Considering only the LpA,1s, six out of 10 tools are verified (tools A, B, D, F, I and J). If LWA,1s is considered, then tool D is no longer verified leaving five out of 10 tools verified. This anomaly may be attributable to the directional nature of the noise from the tools. There is no link between the LpA,1s and LWA,1s values. The former is an average of five measurements at a single discrete microphone location (position O) whilst the latter is an average of the same five measurements at nine microphone locations (positions 1 to 9) on a hypothetical cube shaped measurement surface. The standard deviation for tool D is small (0.43dB on the LpA,1s and 0.37dB on the LWA,1s).
6.1.1 Tool C’s declared emission
The declaration values for Tool C were requested directly from the manufacturer as the manufacturer’s instruction manual, the EC declaration quoting EN 792-13:2000, did not contain any information regarding the tool’s noise emission. The declared values are in the form of LpAImax and LWAImax and were obtained in accordance with DIN 45 635 Teil 66. The LpAImax and LWAImax parameters are no longer commonly used to characterise machine or noise sources. They also pre-date the 1992 Machinery Directive. The parameters are therefore not suitable for inclusion in data analysis.
19
6.2 ANALYSIS OF HSL MEASURED EMISSION
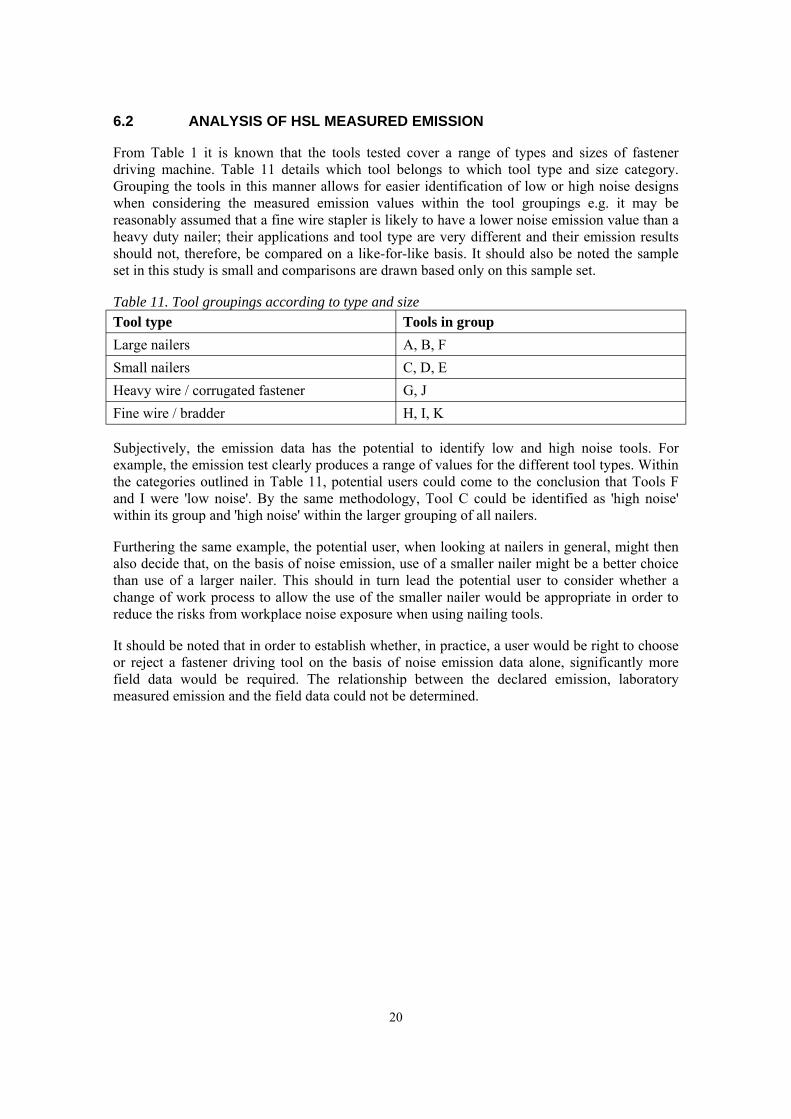
From Table 1 it is known that the tools tested cover a range of types and sizes of fastener driving machine. Table 11 details which tool belongs to which tool type and size category. Grouping the tools in this manner allows for easier identification of low or high noise designs when considering the measured emission values within the tool groupings e.g. it may be reasonably assumed that a fine wire stapler is likely to have a lower noise emission value than a heavy duty nailer; their applications and tool type are very different and their emission results should not, therefore, be compared on a like-for-like basis. It should also be noted the sample set in this study is small and comparisons are drawn based only on this sample set.
Table 11. Tool groupings according to type and size Tool type Tools in group Large nailers A, B, F Small nailers C, D, E Heavy wire / corrugated fastener G, J Fine wire / bradder H, I, K
Subjectively, the emission data has the potential to identify low and high noise tools. For example, the emission test clearly produces a range of values for the different tool types. Within the categories outlined in Table 11, potential users could come to the conclusion that Tools F and I were 'low noise'. By the same methodology, Tool C could be identified as 'high noise' within its group and 'high noise' within the larger grouping of all nailers.
Furthering the same example, the potential user, when looking at nailers in general, might then also decide that, on the basis of noise emission, use of a smaller nailer might be a better choice than use of a larger nailer. This should in turn lead the potential user to consider whether a change of work process to allow the use of the smaller nailer would be appropriate in order to reduce the risks from workplace noise exposure when using nailing tools.
It should be noted that in order to establish whether, in practice, a user would be right to choose or reject a fastener driving tool on the basis of noise emission data alone, significantly more field data would be required. The relationship between the declared emission, laboratory measured emission and the field data could not be determined.
20
7 CONCLUSIONS
Where
LpA,1s: A-weighted single-event emission sound pressure level at the workstation (dB)
LWA,1s: A-weighted single-event sound power level (dB)
• The quality of declared airborne noise emission data varied between manufacturers. Two out of the 11 tools used in this project were supplied with inappropriate or clearly erroneous data (Tools C and K respectively). While the Supply of Machinery (Safety) Regulations 1992 as amended, and related transposed standards for the family of tools under consideration, are clear about declaration requirements, the information available with tools is not always consistent or transparent.
• HSL was able to verify the manufacturers’ declared emissions for five of the 11 tools tested for the LWA,1s parameter. A sixth tool (Tool D) verified for the LpA,1s parameter. The two parameters are derived from independent measurements, although they may be made at the same time during the same operation. This could be a flaw in the test method with limited measurement positions not accurately capturing a highly directional noise source.
• Provided all conditions are maintained, the standard laboratory test is repeatable, though not necessarily reproducible for the determination of LpA,1s. If a variable is introduced, for example, a change in operator, the uncertainty of measurement can increase beyond the uncertainty value attached to the noise descriptor.
• For the determination of LWA,1s, the standard laboratory test is not sufficiently repeatable or reproducible.
• The actuation mode of the tool (contact, single sequential or full sequential) does not affect the noise emitted from the tool beyond the uncertainty value attached to the noise descriptor.
• The test method described in BS EN 12549:1999 has the potential to distinguish between low and high noise tools even though the tool types covered by the standard are very different. Significantly more field data is required to determine whether users can reliably make use of emission data to identify low or high noise tools in practice. The relationship between the declared emission, laboratory measured emission and the field data could not be determined.
• Field measurements showed that in real use noise emissions may vary by up to 15 dB on a single tool dependent on the process, workpiece and the working environment. Noise from fastener driving tools is likely to be a significant contributor to risk of hearing damage if a person is exposed to more than about 500 events per day (an LpA,1s value in the region of 98 to 100 dB giving an equivalent eight-hour daily personal exposure, LEP,d, of approximately 81 dB). For other tools the risk could be significant after only 100 events per day (an LpA,1s value of 105 dB giving an equivalent LEP,d of approximately 80 dB).
21
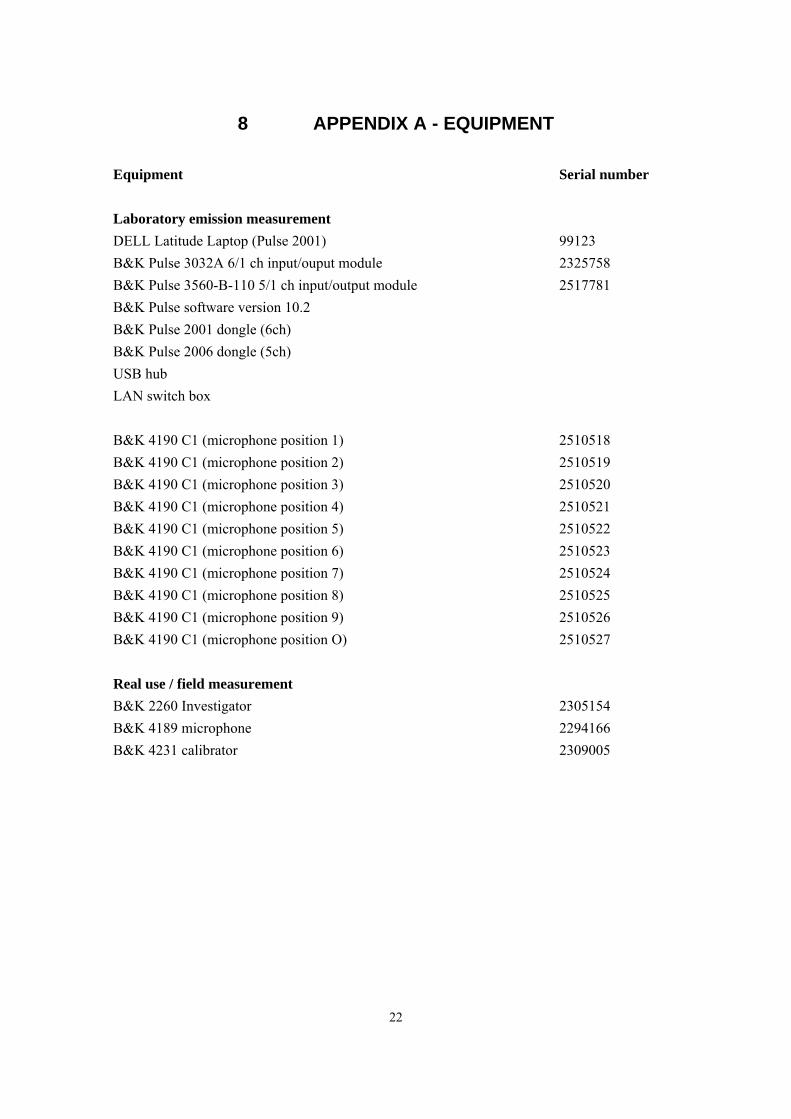
8 APPENDIX A - EQUIPMENT
Equipment Serial number
Laboratory emission measurement DELL Latitude Laptop (Pulse 2001) 99123 B&K Pulse 3032A 6/1 ch input/ouput module 2325758 B&K Pulse 3560-B-110 5/1 ch input/output module 2517781 B&K Pulse software version 10.2 B&K Pulse 2001 dongle (6ch) B&K Pulse 2006 dongle (5ch) USB hub LAN switch box
B&K 4190 C1 (microphone position 1) 2510518 B&K 4190 C1 (microphone position 2) 2510519 B&K 4190 C1 (microphone position 3) 2510520 B&K 4190 C1 (microphone position 4) 2510521 B&K 4190 C1 (microphone position 5) 2510522 B&K 4190 C1 (microphone position 6) 2510523 B&K 4190 C1 (microphone position 7) 2510524 B&K 4190 C1 (microphone position 8) 2510525 B&K 4190 C1 (microphone position 9) 2510526 B&K 4190 C1 (microphone position O) 2510527
Real use / field measurement B&K 2260 Investigator 2305154 B&K 4189 microphone 2294166 B&K 4231 calibrator 2309005
22
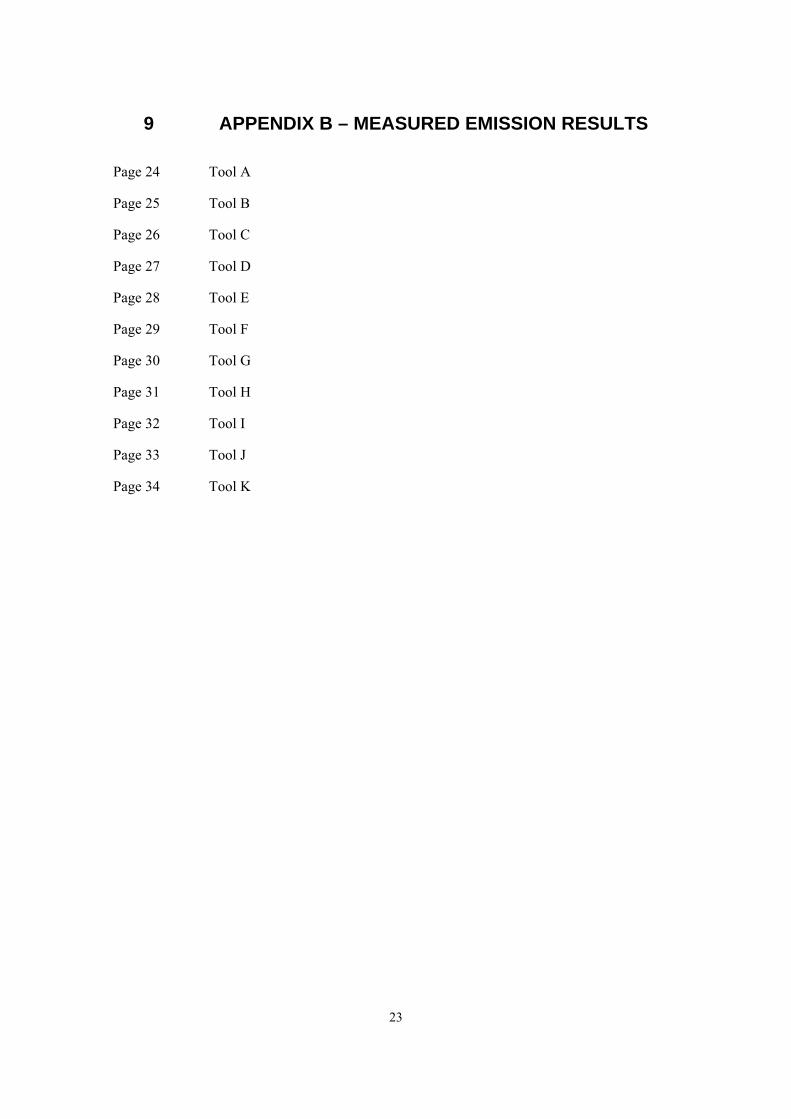
9 APPENDIX B – MEASURED EMISSION RESULTS
Page 24 Tool A
Page 25 Tool B
Page 26 Tool C
Page 27 Tool D
Page 28 Tool E
Page 29 Tool F
Page 30 Tool G
Page 31 Tool H
Page 32 Tool I
Page 33 Tool J
Page 34 Tool K
23

This
is th
eA-
wgt
sin
gle-
even
t em
issi
on
soun
d pr
essu
rele
vel a
t the
wor
k st
atio
n Lp
A,1s
.Fo
rcom
paris
on w
ith th
e va
lue
give
n in
Ann
ex A
, 1.7
.4(f)
of E
N29
2-2:
1991
the
dete
rmin
atio
n of
the
A-w
gtem
issi
onso
und
pres
sure
leve
l at t
he w
orks
tatio
n,Lp
Aeq,
shal
l be
calc
ulat
ed fr
om L
pA,1
s by
taki
ng
into
con
side
ratio
n th
e m
axpo
ssib
le n
umbe
rof
driv
ing
proc
esse
s in
1s,
Nm
ax,1
s:Lp
Aeq
= Lp
A,1s
+ 1
0log
Nm
ax,1
s
This
isth
eca
lcul
atio
n fo
r the
C-
wgt
pea
kem
issi
on s
ound
pr
essu
re le
vel o
f the
test
obje
ct
at th
e w
orks
tatio
n.D
eter
min
edin
ac
cord
ance
with
EN IS
O 1
1201
.
Peak
= h
ighe
st in
stan
eous
leve
l
Tool
A
LpAe
q,T
24
1 2
3 4
5 6
7 8
9 0
Ti(A
) s
0 0
(A)
(A)
s (A
) s
(A)
s (A
) s
1 2
3 4
5 6
7 8
9 0
mi
0 ) )
LpAe
q ) ) ) ) ) ) )
(C)
(C)
iio
n
ii
A(f)
i
ll
il
ing
i
ij
i
65707580859095
1 2
3 4
5 6
7 8
9 0
i
]
mic
pos
ition
m
e
K1A
K
2A
even
t 1 81
.4 81
.7 75
.9 85
.1 78
.4 76
.6 82
.6 81
.6 81
.2 90
.1
dB2.
435
dB
even
t 2 83
.9 83
.8 77
.9 87
.6 79
.9 77
.9 85
.0 83
.7 82
.7 92
.1
dB2.
61
even
t 3 82
.6 82
.5 76
.9 87
.1 79
.2 77
.9 83
.7 82
.5 82
.0 91
.5
dB2.
373
ev
ent 4
85.7
85.5
78.6
88.4
80.9
79.5
85.7
84.7
84.1
93.2
dB
2.21
5
even
t 5 84
.8 83
.9 78
.2 87
.9 80
.7 79
.1 85
.4 84
.0 83
.3 92
.9
dB2.
109
mic
pos
ition
even
t 1 85
.3 85
.6 79
.8 89
.0 82
.3 80
.5 86
.5 85
.5 85
.1 94
.0
even
t 2 88
.1 88
.0 82
.1 91
.8 84
.1 82
.1 89
.2 87
.9 86
.9 96
.3
even
t 3 86
.4 86
.3 80
.7 90
.9 83
.0 81
.7 87
.5 86
.3 85
.8 95
.3
even
t 4 89
.2 89
.0 82
.1 91
.9 84
.4 83
.0 89
.2 88
.2 87
.6 96
.7
even
t 5 88
.0 87
.1 81
.4 91
.1 83
.9 82
.3 88
.6 87
.2 86
.5 96
.1
Ave
rage
87
.4
87.2
81
.2
90.9
83
.5
81.9
88
.2
87.0
86
.4
95.7
st
d de
v 1.
55
1.34
0.
99
1.17
0.
88
0.93
1.
18
1.12
0.
97
1.08
86
.9
av s
td d
ev
1.13
99
.9
c po
sitio
n Lp
A,1s
95
.7 d
B(A)
ev
ent 1
12
6.0
dB(C
Nm
ax
even
t 2
128.
0 dB
(C#N
UM
! dB
(A)
even
t 3
128.
0 dB
(Cev
ent 4
12
9.0
dB(C
even
t 5
129.
0 dB
(Cev
ent 6
dB
(Cev
ent 7
dB
(Cev
ent 8
dB
(Cev
ent 9
dB
(Cev
ent 1
0 dB
LpC
,pea
k Av
erag
e 12
8.0
dBre
port
only
if >
130
dB
This
is th
e A-
wgt
sng
le-e
vent
em
iss
soun
d pr
essu
re le
vel a
t the
wor
k st
atio
n Lp
A,1s
. Fo
r com
paris
on w
th th
e va
lue
gve
n in
nn
ex A
, 1.7
.4of
EN
292
-2:1
991t
he
dete
rmin
atio
n of
the
A-w
gt e
mis
son
sou
nd
pres
sure
eve
at t
he w
orks
tato
n, L
pAeq
, sh
all b
e ca
lcu
ated
from
LpA
,1s
by ta
kin
to c
onsi
dera
tion
the
max
pos
sbl
e nu
mbe
r of
driv
ing
proc
esse
s in
1s,
Nm
ax,1
s:
LpAe
q =
LpA,
1s +
10l
ogN
max
,1s
This
is th
e ca
lcul
atio
n fo
r the
C
wgt
pea
k em
iss
on s
ound
pr
essu
re le
vel o
f the
test
ob
ect
at th
e w
orks
tatio
n. D
eter
min
ed in
ac
cord
ance
wth
EN
ISO
112
01.
Peak
= h
ighe
st in
stan
eous
leve
l
L'pA
,1s
100
mic
pos
iton
L'pA,1s [d B(A)
even
t 1
even
t 2
even
t 3
even
t 4
even
t 5
L'pA
,1s
L'pA
,1s,
i
LpA,
1s,1
m
LWA
,1s
LpC
,pea
k
Tool
B
LpA
eq,T
m
ic p
ositi
on
L'pA
,1s
L'pA
,1s,
i
LpA
,1s,
1m
LWA
,1s
LpC
,pea
k
1 2
3 4
5 6
7 8
9 0
Ti86
.0
74.9
83
.1
84.8
78
.2
76.7
80
.3
81.1
85
.0
89.6
s
0 0
87.1
73
.8
81.0
84
.8
77.9
75
.0
78.7
81
.7
85.4
87
.8
2.61
s
85.5
71
.5
80.7
85
.9
77.7
72
.9
79.0
80
.8
85.6
87
.6
s 87
.0
72.8
80
.8
86.6
78
.3
73.5
79
.7
81.8
85
.8
88.3
s
86.9
76
.8
86.5
88
.3
79.1
78
.3
82.6
83
.8
87.8
92
.1
s
i1
2 3
4 5
6 7
8 9
0 90
.3
79.2
87
.4
89.1
82
.5
81.0
84
.6
85.4
89
.3
93.9
91
.3
78.0
85
.2
89.0
82
.1
79.2
82
.9
85.9
89
.6
92.0
89
.3
75.3
84
.5
89.7
81
.5
76.7
82
.8
84.6
89
.4
91.4
90
.0
75.8
83
.8
89.6
81
.3
76.5
82
.7
84.8
88
.8
91.3
89
.4
79.3
89
.0
90.8
81
.6
80.8
85
.1
86.3
90
.3
94.6
90
.0
77.5
85
.9
89.6
81
.8
78.8
83
.6
85.4
89
.4
92.6
86.5
v
99.5
i0
LpA,
1s
122.
012
0.0
LpAe
q 11
7.0
117.
012
0.0
(C)
119.
2 (C
)
ii
ii
iA
)i
ii
i
ing
i
ii
ll
65707580859095
1 2
3 4
5 6
7 8
9 0
mi
me
K1
A
K2A
ev
ent 1
dB
(A)
2.66
3 dB
(A)
even
t 2
dB(A
) ev
ent 3
dB
(A)
2.38
2 ev
ent 4
dB
(A)
1.97
8 ev
ent 5
dB
(A)
1.77
5
mic
pos
tion
even
t 1
even
t 2
even
t 3
even
t 4
even
t 5
Aver
age
std
0.80
1.
88
2.17
0.
73
0.48
2.
16
1.14
0.
73
0.56
1.
52
av s
td d
e1.
18
mic
pos
tion
92.6
dB(
A)
even
t 1
dB(C
) N
max
ev
ent 2
dB
(C)
#NU
M!
dB(A
) ev
ent 3
dB
(C)
even
t 4
dB(C
) ev
ent 5
dB
(C)
even
t 6
dB(C
) ev
ent 7
dB
(C)
even
t 8
dB(C
) ev
ent 9
dB
(C)
even
t 10
dBLp
C,p
eak
Aver
age
dBre
port
only
if >
130
dB
This
s th
e A
-wgt
sng
le-e
vent
em
sson
so
und
pres
sure
leve
l at t
he w
ork
stat
ion
LpA
,1s.
Fo
r com
paris
on w
th th
e va
lue
give
n in
nn
ex A
, 1.7
.4(f
of E
N 2
92-2
:199
1the
de
term
nato
n of
the
A-w
gt e
mss
on s
ound
pr
essu
re le
vel a
t the
wor
ksta
tion,
LpA
eq,
shal
l be
calc
ulat
ed fr
om L
pA,1
s by
tak
into
con
side
ratio
n th
e m
ax p
ossi
ble
num
ber
of d
rivin
g pr
oces
ses
in 1
s, N
max
,1s:
Lp
Aeq
= L
pA,1
s +
10lo
gNm
ax,1
s
This
s th
e ca
lcul
atio
n fo
r the
C-
wgt
pea
k em
issi
on s
ound
pr
essu
re le
vel o
f the
test
obj
ect
at th
e w
orks
tatio
n. D
eter
mne
d in
ac
cord
ance
wth
EN
ISO
112
01.
Pea
k =
high
est i
nsta
neou
s ev
e
L'pA
,1s
100
c po
sitio
n
L'pA,1s [d B(A)]
even
t 1
even
t 2
even
t 3
even
t 4
even
t 5
25
Tool
C
LpA
eq,T
m
ic p
ositi
on
L'pA
,1s
L'pA
,1s,
i
LpA
,1s,
1m
LWA
,1s
LpC
,pea
k
1 2
3 4
5 6
7 8
9 0
Ti93
.0
89.6
75
.6
89.1
87
.6
78.4
83
.2
87.9
91
.6
91.2
s
0 0
93.1
89
.8
75.6
89
.2
86.7
78
.2
83.2
88
.1
90.7
91
.2
s 94
.2
90.8
77
.1
90.4
87
.3
79.1
84
.6
89.0
91
.9
92.8
s
94.9
91
.3
77.5
90
.8
87.7
79
.5
85.0
89
.5
92.5
93
.3
s 93
.7
90.3
77
.0
90.2
86
.5
78.2
84
.0
88.2
91
.2
92.4
s
i1
2 3
4 5
6 7
8 9
0 97
.0
93.6
79
.6
93.1
91
.6
82.4
87
.2
91.9
95
.6
95.2
97
.2
93.9
79
.7
93.3
90
.8
82.3
87
.3
92.2
94
.8
95.3
97
.3
93.9
80
.2
93.5
90
.4
82.2
87
.7
92.1
95
.0
95.9
97
.5
93.9
80
.1
93.4
90
.3
82.1
87
.6
92.1
95
.1
95.9
97
.3
93.9
80
.6
93.8
90
.1
81.8
87
.6
91.8
94
.8
96.0
97
.3
93.8
80
.0
93.4
90
.6
82.2
87
.5
92.0
95
.1
95.7
92.7
v
105.
7 i0
LpA,
1s
123.
012
4.0
LpAe
q 12
4.0
124.
012
4.0
(C)
123.
8 (C
)
ii
ii
iA
)i
ii
i
ing
i
ii
ll
65707580859095
1 2
3 4
5 6
7 8
9 0
mi
me
K1
A
K2A
ev
ent 1
dB
(A)
2.48
7 dB
(A)
even
t 2
dB(A
) 2.
593
even
t 3
dB(A
) 2.
048
even
t 4
dB(A
) 1.
828
even
t 5
dB(A
) 2.
268
mic
pos
tion
even
t 1
even
t 2
even
t 3
even
t 4
even
t 5
Aver
age
std
0.20
0.
16
0.40
0.
26
0.59
0.
24
0.23
0.
20
0.31
0.
38
av s
td d
e0.
29
mic
pos
tion
95.7
dB(
A)
even
t 1
dB(C
) N
max
ev
ent 2
dB
(C)
#NU
M!
dB(A
) ev
ent 3
dB
(C)
even
t 4
dB(C
) ev
ent 5
dB
(C)
even
t 6
dB(C
) ev
ent 7
dB
(C)
even
t 8
dB(C
) ev
ent 9
dB
(C)
even
t 10
dBLp
C,p
eak
Aver
age
dBre
port
only
if >
130
dB
This
s th
e A
-wgt
sng
le-e
vent
em
sson
so
und
pres
sure
leve
l at t
he w
ork
stat
ion
LpA
,1s.
Fo
r com
paris
on w
th th
e va
lue
give
n in
nn
ex A
, 1.7
.4(f
of E
N 2
92-2
:199
1the
de
term
nato
n of
the
A-w
gt e
mss
on s
ound
pr
essu
re le
vel a
t the
wor
ksta
tion,
LpA
eq,
shal
l be
calc
ulat
ed fr
om L
pA,1
s by
tak
into
con
side
ratio
n th
e m
ax p
ossi
ble
num
ber
of d
rivin
g pr
oces
ses
in 1
s, N
max
,1s:
Lp
Aeq
= L
pA,1
s +
10lo
gNm
ax,1
s
This
s th
e ca
lcul
atio
n fo
r the
C-
wgt
pea
k em
issi
on s
ound
pr
essu
re le
vel o
f the
test
obj
ect
at th
e w
orks
tatio
n. D
eter
mne
d in
ac
cord
ance
wth
EN
ISO
112
01.
Pea
k =
high
est i
nsta
neou
s ev
e
L'pA
,1s
100
c po
sitio
n
L'pA,1s [d B(A)]
even
t 1
even
t 2
even
t 3
even
t 4
even
t 5
26

Tool
D
LpA
eq,T
m
ic p
ositi
on
L'pA
,1s
L'pA
,1s,
i
LpA
,1s,
1m
LWA
,1s
LpC
,pea
k
1 2
3 4
5 6
7 8
9 0
Ti81
.6
79.9
66
.8
79.0
76
.8
69.4
74
.1
76.6
80
.7
80.2
2.
61
s 0
0 83
.8
82.2
68
.8
80.7
78
.4
71.2
75
.2
78.2
82
.0
81.9
s
84.4
82
.2
68.7
81
.4
78.2
70
.7
75.6
78
.3
82.6
82
.2
s 83
.8
82.7
69
.3
80.9
77
.6
70.6
75
.9
78.4
82
.5
82.7
s
83.0
80
.9
67.7
79
.9
77.4
68
.8
74.0
77
.0
81.0
80
.7
s
i1
2 3
4 5
6 7
8 9
0 85
.8
84.1
71
.0
83.2
81
.0
73.6
78
.3
80.8
84
.9
84.4
86
.3
84.7
71
.3
83.2
80
.9
73.7
77
.7
80.7
84
.5
84.4
87
.0
84.8
71
.3
84.0
80
.8
73.3
78
.2
80.9
85
.2
84.8
86
.4
85.3
71
.9
83.5
80
.2
73.2
78
.5
81.0
85
.1
85.3
86
.6
84.5
71
.3
83.5
81
.0
72.4
77
.6
80.6
84
.6
84.3
86
.4
84.7
71
.3
83.5
80
.8
73.2
78
.0
80.8
84
.8
84.6
82.5
v
95.5
i0
LpA,
1s
114.
011
2.0
LpAe
q 11
5.0
114.
011
4.0
(C)
113.
8 (C
)
ii
ii
iA
)i
ii
i
ing
i
ii
ll
65707580859095
1 2
3 4
5 6
7 8
9 0
mi
me
K1
A
K2A
ev
ent 1
dB
(A)
dB(A
) ev
ent 2
dB
(A)
1.75
8 ev
ent 3
dB
(A)
1.82
8 ev
ent 4
dB
(A)
1.81
1 ev
ent 5
dB
(A)
2.26
8
mic
pos
tion
even
t 1
even
t 2
even
t 3
even
t 4
even
t 5
Aver
age
std
0.46
0.
45
0.33
0.
35
0.33
0.
52
0.41
0.
18
0.33
0.
43
av s
td d
e0.
37
mic
pos
tion
84.6
dB(
A)
even
t 1
dB(C
) N
max
ev
ent 2
dB
(C)
#NU
M!
dB(A
) ev
ent 3
dB
(C)
even
t 4
dB(C
) ev
ent 5
dB
(C)
even
t 6
dB(C
) ev
ent 7
dB
(C)
even
t 8
dB(C
) ev
ent 9
dB
(C)
even
t 10
dBLp
C,p
eak
Aver
age
dBre
port
only
if >
130
dB
This
s th
e A
-wgt
sng
le-e
vent
em
sson
so
und
pres
sure
leve
l at t
he w
ork
stat
ion
LpA
,1s.
Fo
r com
paris
on w
th th
e va
lue
give
n in
nn
ex A
, 1.7
.4(f
of E
N 2
92-2
:199
1the
de
term
nato
n of
the
A-w
gt e
mss
on s
ound
pr
essu
re le
vel a
t the
wor
ksta
tion,
LpA
eq,
shal
l be
calc
ulat
ed fr
om L
pA,1
s by
tak
into
con
side
ratio
n th
e m
ax p
ossi
ble
num
ber
of d
rivin
g pr
oces
ses
in 1
s, N
max
,1s:
Lp
Aeq
= L
pA,1
s +
10lo
gNm
ax,1
s
This
s th
e ca
lcul
atio
n fo
r the
C-
wgt
pea
k em
issi
on s
ound
pr
essu
re le
vel o
f the
test
obj
ect
at th
e w
orks
tatio
n. D
eter
mne
d in
ac
cord
ance
wth
EN
ISO
112
01.
Pea
k =
high
est i
nsta
neou
s ev
e
L'pA
,1s
100
c po
sitio
n
L'pA,1s [d B(A)]
even
t 1
even
t 2
even
t 3
even
t 4
even
t 5
27
Tool
E
LpA
eq,T
m
ic p
ositi
on
L'pA
,1s
L'pA
,1s,
i
LpA
,1s,
1m
LWA
,1s
LpC
,pea
k
1 2
3 4
5 6
7 8
9 0
Ti89
.1
84.1
70
.2
84.1
82
.1
72.0
77
.3
82.6
84
.0
86.1
s
0 0
90.4
84
.8
70.9
87
.1
83.3
72
.8
79.5
85
.2
85.4
87
.2
s 90
.3
84.7
71
.4
85.7
82
.8
73.4
79
.5
85.1
85
.2
87.4
s
91.7
85
.5
71.2
88
.3
83.9
74
.0
80.2
86
.6
86.2
88
.2
s 91
.3
86.3
71
.5
86.8
83
.6
73.1
79
.7
85.3
86
.6
89.0
s
i1
2 3
4 5
6 7
8 9
0 91
.4
86.4
72
.5
86.4
84
.4
74.3
79
.6
84.9
86
.3
88.4
91
.3
85.7
71
.8
88.0
84
.2
73.7
80
.4
86.1
86
.3
88.1
91
.0
85.4
72
.1
86.4
83
.5
74.1
80
.2
85.8
85
.9
88.1
91
.7
85.5
71
.2
88.3
83
.9
74.0
80
.2
86.6
86
.2
88.2
90
.7
85.7
70
.9
86.2
83
.0
72.5
79
.1
84.7
86
.0
88.4
91
.2
85.7
71
.7
87.0
83
.8
73.7
79
.9
85.6
86
.1
88.2
85.7
v
98.7
i0
LpA,
1s
117.
011
6.0
LpAe
q 11
6.0
116.
011
6.0
(C)
116.
2 (C
)
ii
ii
iA
)i
ii
i
ing
i
ii
ll
65707580859095
1 2
3 4
5 6
7 8
9 0
mi
me
K1
A
K2A
ev
ent 1
dB
(A)
1.67
9 dB
(A)
even
t 2
dB(A
) 1.
222
even
t 3
dB(A
) 1.
169
even
t 4
dB(A
) 0.
9932
ev
ent 5
dB
(A)
0.87
89
mic
pos
tion
even
t 1
even
t 2
even
t 3
even
t 4
even
t 5
Aver
age
std
0.36
0.
38
0.63
0.
99
0.53
0.
68
0.52
0.
79
0.16
0.
17
av s
td d
e0.
56
mic
pos
tion
88.2
dB(
A)
even
t 1
dB(C
) N
max
ev
ent 2
dB
(C)
#NU
M!
dB(A
) ev
ent 3
dB
(C)
even
t 4
dB(C
) ev
ent 5
dB
(C)
even
t 6
dB(C
) ev
ent 7
dB
(C)
even
t 8
dB(C
) ev
ent 9
dB
(C)
even
t 10
dBLp
C,p
eak
Aver
age
dBre
port
only
if >
130
dB
This
s th
e A
-wgt
sng
le-e
vent
em
sson
so
und
pres
sure
leve
l at t
he w
ork
stat
ion
LpA
,1s.
Fo
r com
paris
on w
th th
e va
lue
give
n in
nn
ex A
, 1.7
.4(f
of E
N 2
92-2
:199
1the
de
term
nato
n of
the
A-w
gt e
mss
on s
ound
pr
essu
re le
vel a
t the
wor
ksta
tion,
LpA
eq,
shal
l be
calc
ulat
ed fr
om L
pA,1
s by
tak
into
con
side
ratio
n th
e m
ax p
ossi
ble
num
ber
of d
rivin
g pr
oces
ses
in 1
s, N
max
,1s:
Lp
Aeq
= L
pA,1
s +
10lo
gNm
ax,1
s
This
s th
e ca
lcul
atio
n fo
r the
C-
wgt
pea
k em
issi
on s
ound
pr
essu
re le
vel o
f the
test
obj
ect
at th
e w
orks
tatio
n. D
eter
mne
d in
ac
cord
ance
wth
EN
ISO
112
01.
Pea
k =
high
est i
nsta
neou
s ev
e
L'pA
,1s
100
c po
sitio
n
L'pA,1s [d B(A)]
even
t 1
even
t 2
even
t 3
even
t 4
even
t 5
28
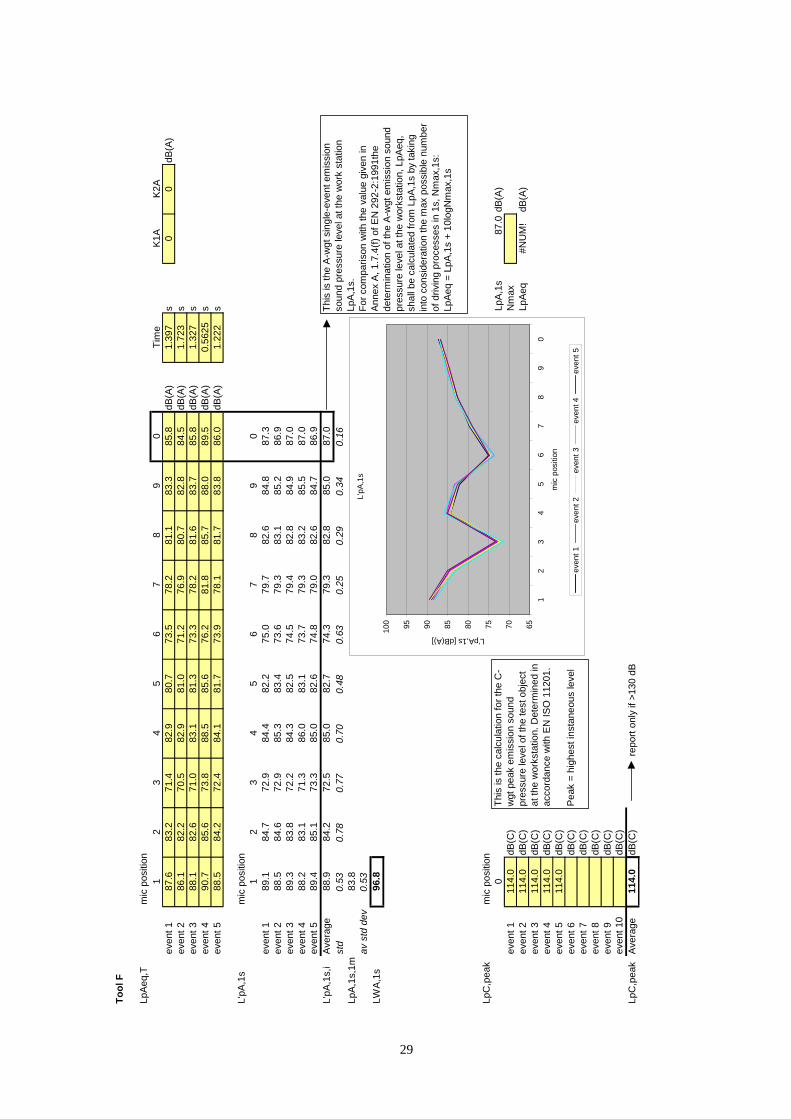
Tool
F
LpA
eq,T
m
ic p
ositi
on
L'pA
,1s
L'pA
,1s,
i
LpA
,1s,
1m
LWA
,1s
LpC
,pea
k
1 2
3 4
5 6
7 8
9 0
Ti87
.6
83.2
71
.4
82.9
80
.7
73.5
78
.2
81.1
83
.3
85.8
s
0 0
86.1
82
.2
70.5
82
.9
81.0
71
.2
76.9
80
.7
82.8
84
.5
s 88
.1
82.6
71
.0
83.1
81
.3
73.3
78
.2
81.6
83
.7
85.8
s
90.7
85
.6
73.8
88
.5
85.6
76
.2
81.8
85
.7
88.0
89
.5
s 88
.5
84.2
72
.4
84.1
81
.7
73.9
78
.1
81.7
83
.8
86.0
s
i1
2 3
4 5
6 7
8 9
0 89
.1
84.7
72
.9
84.4
82
.2
75.0
79
.7
82.6
84
.8
87.3
88
.5
84.6
72
.9
85.3
83
.4
73.6
79
.3
83.1
85
.2
86.9
89
.3
83.8
72
.2
84.3
82
.5
74.5
79
.4
82.8
84
.9
87.0
88
.2
83.1
71
.3
86.0
83
.1
73.7
79
.3
83.2
85
.5
87.0
89
.4
85.1
73
.3
85.0
82
.6
74.8
79
.0
82.6
84
.7
86.9
88
.9
84.2
72
.5
85.0
82
.7
74.3
79
.3
82.8
85
.0
87.0
83.8
v
96.8
i0
LpA,
1s
114.
011
4.0
LpAe
q 11
4.0
114.
011
4.0
(C)
114.
0 (C
)
ii
ii
iA
)i
ii
i
ing
i
ii
ll
65707580859095
1 2
3 4
5 6
7 8
9 0
mi
me
K1
A
K2A
ev
ent 1
dB
(A)
1.39
7 dB
(A)
even
t 2
dB(A
) 1.
723
even
t 3
dB(A
) 1.
327
even
t 4
dB(A
) 0.
5625
ev
ent 5
dB
(A)
1.22
2
mic
pos
tion
even
t 1
even
t 2
even
t 3
even
t 4
even
t 5
Aver
age
std
0.53
0.
78
0.77
0.
70
0.48
0.
63
0.25
0.
29
0.34
0.
16
av s
td d
e0.
53
mic
pos
tion
87.0
dB(
A)
even
t 1
dB(C
) N
max
ev
ent 2
dB
(C)
#NU
M!
dB(A
) ev
ent 3
dB
(C)
even
t 4
dB(C
) ev
ent 5
dB
(C)
even
t 6
dB(C
) ev
ent 7
dB
(C)
even
t 8
dB(C
) ev
ent 9
dB
(C)
even
t 10
dBLp
C,p
eak
Aver
age
dBre
port
only
if >
130
dB
This
s th
e A
-wgt
sng
le-e
vent
em
sson
so
und
pres
sure
leve
l at t
he w
ork
stat
ion
LpA
,1s.
Fo
r com
paris
on w
th th
e va
lue
give
n in
nn
ex A
, 1.7
.4(f
of E
N 2
92-2
:199
1the
de
term
nato
n of
the
A-w
gt e
mss
on s
ound
pr
essu
re le
vel a
t the
wor
ksta
tion,
LpA
eq,
shal
l be
calc
ulat
ed fr
om L
pA,1
s by
tak
into
con
side
ratio
n th
e m
ax p
ossi
ble
num
ber
of d
rivin
g pr
oces
ses
in 1
s, N
max
,1s:
Lp
Aeq
= L
pA,1
s +
10lo
gNm
ax,1
s
This
s th
e ca
lcul
atio
n fo
r the
C-
wgt
pea
k em
issi
on s
ound
pr
essu
re le
vel o
f the
test
obj
ect
at th
e w
orks
tatio
n. D
eter
mne
d in
ac
cord
ance
wth
EN
ISO
112
01.
Pea
k =
high
est i
nsta
neou
s ev
e
L'pA
,1s
100
c po
sitio
n
L'pA,1s [d B(A)]
even
t 1
even
t 2
even
t 3
even
t 4
even
t 5
29
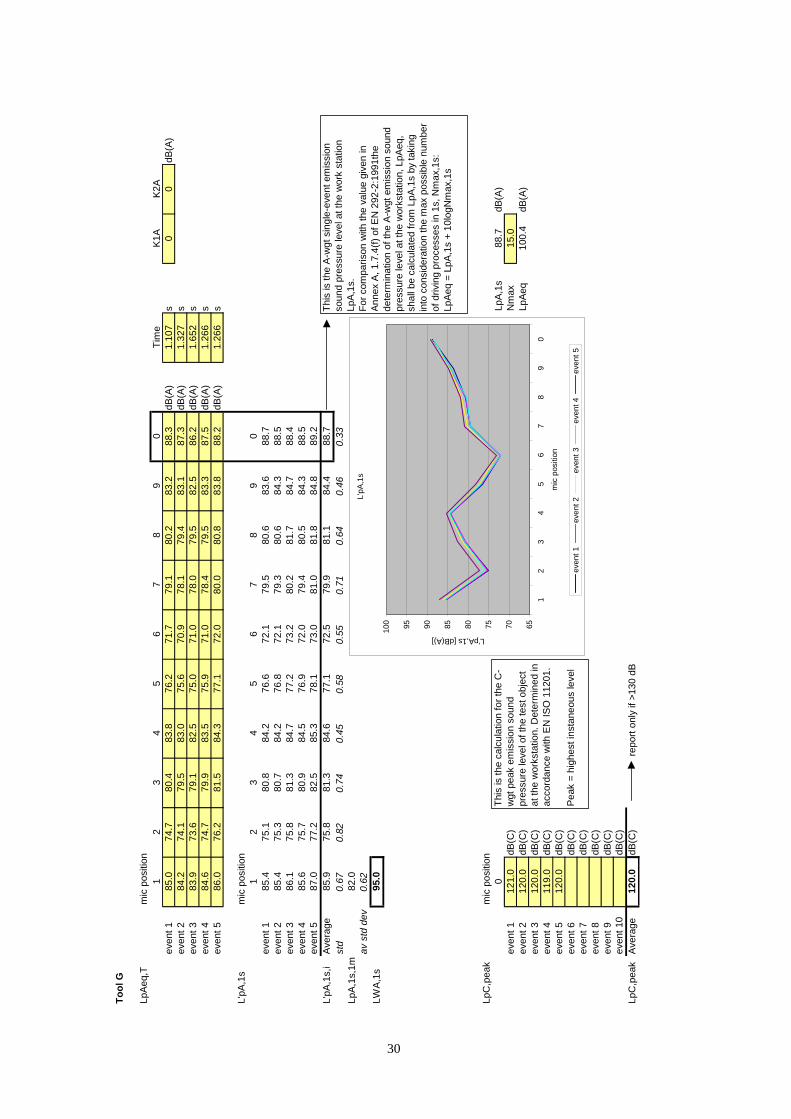
Tool
G
LpA
eq,T
m
ic p
ositi
on
L'pA
,1s
L'pA
,1s,
i
LpA
,1s,
1m
LWA
,1s
LpC
,pea
k
1 2
3 4
5 6
7 8
9 0
Ti85
.0
74.7
80
.4
83.8
76
.2
71.7
79
.1
80.2
83
.2
88.3
s
0 0
84.2
74
.1
79.5
83
.0
75.6
70
.9
78.1
79
.4
83.1
87
.3
s 83
.9
73.6
79
.1
82.5
75
.0
71.0
78
.0
79.5
82
.5
86.2
s
84.6
74
.7
79.9
83
.5
75.9
71
.0
78.4
79
.5
83.3
87
.5
s 86
.0
76.2
81
.5
84.3
77
.1
72.0
80
.0
80.8
83
.8
88.2
s
i1
2 3
4 5
6 7
8 9
0 85
.4
75.1
80
.8
84.2
76
.6
72.1
79
.5
80.6
83
.6
88.7
85
.4
75.3
80
.7
84.2
76
.8
72.1
79
.3
80.6
84
.3
88.5
86
.1
75.8
81
.3
84.7
77
.2
73.2
80
.2
81.7
84
.7
88.4
85
.6
75.7
80
.9
84.5
76
.9
72.0
79
.4
80.5
84
.3
88.5
87
.0
77.2
82
.5
85.3
78
.1
73.0
81
.0
81.8
84
.8
89.2
85
.9
75.8
81
.3
84.6
77
.1
72.5
79
.9
81.1
84
.4
88.7
82.0
v
95.0
i0
LpA,
1s
88.7
12
1.0
15.0
12
0.0
LpAe
q 12
0.0
119.
012
0.0
(C)
120.
0 (C
)
ii
ii
iA
)i
ii
i
ing
i
ii
ll
65707580859095
1 2
3 4
5 6
7 8
9 0
mi
me
K1
A
K2A
ev
ent 1
dB
(A)
1.10
7 dB
(A)
even
t 2
dB(A
) 1.
327
even
t 3
dB(A
) 1.
652
even
t 4
dB(A
) 1.
266
even
t 5
dB(A
) 1.
266
mic
pos
tion
even
t 1
even
t 2
even
t 3
even
t 4
even
t 5
Aver
age
std
0.67
0.
82
0.74
0.
45
0.58
0.
55
0.71
0.
64
0.46
0.
33
av s
td d
e0.
62
mic
pos
tion
dB(A
) ev
ent 1
dB
(C)
Nm
ax
even
t 2
dB(C
) 10
0.4
dB(A
) ev
ent 3
dB
(C)
even
t 4
dB(C
) ev
ent 5
dB
(C)
even
t 6
dB(C
) ev
ent 7
dB
(C)
even
t 8
dB(C
) ev
ent 9
dB
(C)
even
t 10
dBLp
C,p
eak
Aver
age
dBre
port
only
if >
130
dB
This
s th
e A
-wgt
sng
le-e
vent
em
sson
so
und
pres
sure
leve
l at t
he w
ork
stat
ion
LpA
,1s.
Fo
r com
paris
on w
th th
e va
lue
give
n in
nn
ex A
, 1.7
.4(f
of E
N 2
92-2
:199
1the
de
term
nato
n of
the
A-w
gt e
mss
on s
ound
pr
essu
re le
vel a
t the
wor
ksta
tion,
LpA
eq,
shal
l be
calc
ulat
ed fr
om L
pA,1
s by
tak
into
con
side
ratio
n th
e m
ax p
ossi
ble
num
ber
of d
rivin
g pr
oces
ses
in 1
s, N
max
,1s:
Lp
Aeq
= L
pA,1
s +
10lo
gNm
ax,1
s
This
s th
e ca
lcul
atio
n fo
r the
C-
wgt
pea
k em
issi
on s
ound
pr
essu
re le
vel o
f the
test
obj
ect
at th
e w
orks
tatio
n. D
eter
mne
d in
ac
cord
ance
wth
EN
ISO
112
01.
Pea
k =
high
est i
nsta
neou
s ev
e
L'pA
,1s
100
c po
sitio
n
L'pA,1s [d B(A)]
even
t 1
even
t 2
even
t 3
even
t 4
even
t 5
30
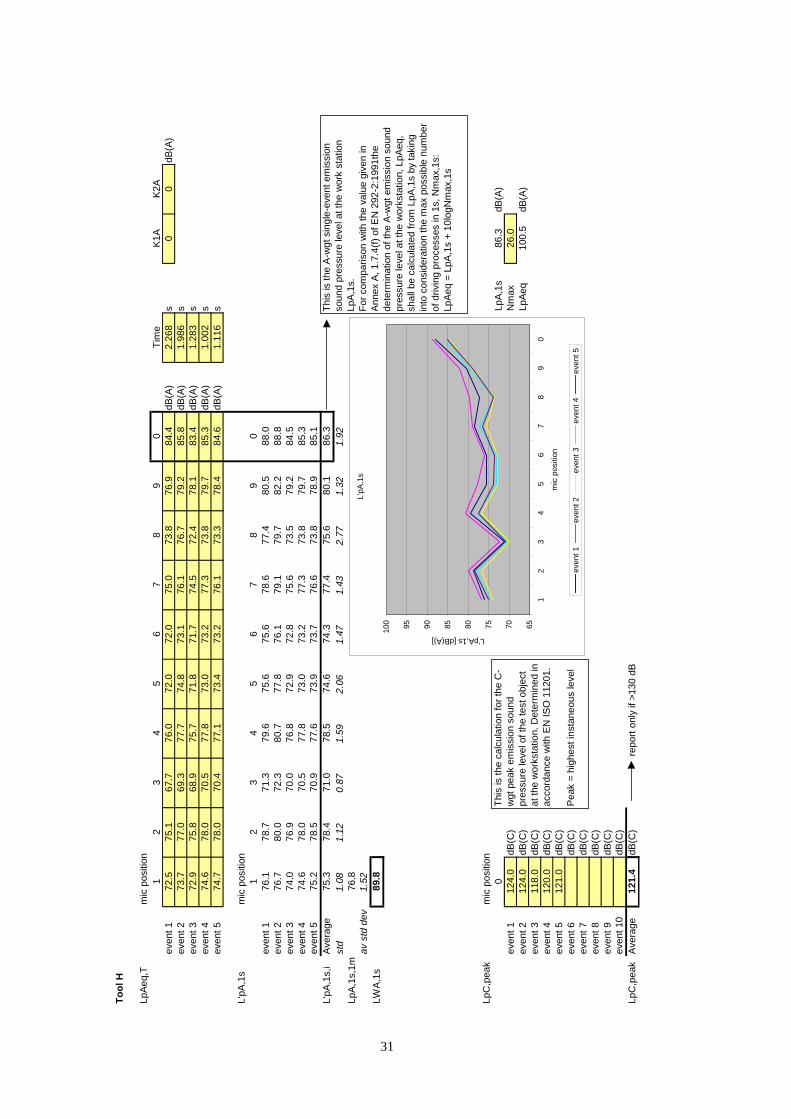
Tool
H
LpA
eq,T
m
ic p
ositi
on
L'pA
,1s
L'pA
,1s,
i
LpA
,1s,
1m
LWA
,1s
LpC
,pea
k
1 2
3 4
5 6
7 8
9 0
Ti72
.5
75.1
67
.7
76.0
72
.0
72.0
75
.0
73.8
76
.9
84.4
s
0 0
73.7
77
.0
69.3
77
.7
74.8
73
.1
76.1
76
.7
79.2
85
.8
s 72
.9
75.8
68
.9
75.7
71
.8
71.7
74
.5
72.4
78
.1
83.4
s
74.6
78
.0
70.5
77
.8
73.0
73
.2
77.3
73
.8
79.7
85
.3
s 74
.7
78.0
70
.4
77.1
73
.4
73.2
76
.1
73.3
78
.4
84.6
s
i1
2 3
4 5
6 7
8 9
0 76
.1
78.7
71
.3
79.6
75
.6
75.6
78
.6
77.4
80
.5
88.0
76
.7
80.0
72
.3
80.7
77
.8
76.1
79
.1
79.7
82
.2
88.8
74
.0
76.9
70
.0
76.8
72
.9
72.8
75
.6
73.5
79
.2
84.5
74
.6
78.0
70
.5
77.8
73
.0
73.2
77
.3
73.8
79
.7
85.3
75
.2
78.5
70
.9
77.6
73
.9
73.7
76
.6
73.8
78
.9
85.1
75
.3
78.4
71
.0
78.5
74
.6
74.3
77
.4
75.6
80
.1
86.3
76.8
v
89.8
i0
LpA,
1s
86.3
12
4.0
26.0
12
4.0
LpAe
q 11
8.0
120.
012
1.0
(C)
121.
4 (C
)
ii
ii
iA
)i
ii
i
ing
i
ii
ll
65707580859095
1 2
3 4
5 6
7 8
9 0
mi
me
K1
A
K2A
ev
ent 1
dB
(A)
2.26
8 dB
(A)
even
t 2
dB(A
) 1.
986
even
t 3
dB(A
) 1.
283
even
t 4
dB(A
) 1.
002
even
t 5
dB(A
) 1.
116
mic
pos
tion
even
t 1
even
t 2
even
t 3
even
t 4
even
t 5
Aver
age
std
1.08
1.
12
0.87
1.
59
2.06
1.
47
1.43
2.
77
1.32
1.
92
av s
td d
e1.
52
mic
pos
tion
dB(A
) ev
ent 1
dB
(C)
Nm
ax
even
t 2
dB(C
) 10
0.5
dB(A
) ev
ent 3
dB
(C)
even
t 4
dB(C
) ev
ent 5
dB
(C)
even
t 6
dB(C
) ev
ent 7
dB
(C)
even
t 8
dB(C
) ev
ent 9
dB
(C)
even
t 10
dBLp
C,p
eak
Aver
age
dBre
port
only
if >
130
dB
This
s th
e A
-wgt
sng
le-e
vent
em
sson
so
und
pres
sure
leve
l at t
he w
ork
stat
ion
LpA
,1s.
Fo
r com
paris
on w
th th
e va
lue
give
n in
nn
ex A
, 1.7
.4(f
of E
N 2
92-2
:199
1the
de
term
nato
n of
the
A-w
gt e
mss
on s
ound
pr
essu
re le
vel a
t the
wor
ksta
tion,
LpA
eq,
shal
l be
calc
ulat
ed fr
om L
pA,1
s by
tak
into
con
side
ratio
n th
e m
ax p
ossi
ble
num
ber
of d
rivin
g pr
oces
ses
in 1
s, N
max
,1s:
Lp
Aeq
= L
pA,1
s +
10lo
gNm
ax,1
s
This
s th
e ca
lcul
atio
n fo
r the
C-
wgt
pea
k em
issi
on s
ound
pr
essu
re le
vel o
f the
test
obj
ect
at th
e w
orks
tatio
n. D
eter
mne
d in
ac
cord
ance
wth
EN
ISO
112
01.
Pea
k =
high
est i
nsta
neou
s ev
e
L'pA
,1s
100
c po
sitio
n
L'pA,1s [d B(A)]
even
t 1
even
t 2
even
t 3
even
t 4
even
t 5
31

Tool
I
LpA
eq,T
m
ic p
ositi
on
L'pA
,1s
L'pA
,1s,
i
LpA
,1s,
1m
LWA
,1s
LpC
,pea
k
1 2
3 4
5 6
7 8
9 0
Ti78
.4
68.2
72
.3
74.6
70
.4
70.3
71
.2
72.9
76
.1
77.8
s
0 0
78.0
68
.1
72.4
74
.8
70.7
70
.4
71.5
72
.6
76.0
78
.2
s 79
.2
69.3
73
.3
75.7
72
.0
71.0
72
.1
74.1
77
.5
79.4
s
79.1
69
.2
73.5
76
.0
72.0
71
.2
72.1
73
.6
77.3
78
.7
s 79
.0
68.8
72
.7
75.7
71
.9
71.0
71
.8
73.6
77
.1
78.5
s
i1
2 3
4 5
6 7
8 9
0 80
.6
70.4
74
.5
76.8
72
.6
72.5
73
.4
75.1
78
.3
80.0
79
.8
69.9
74
.2
76.6
72
.5
72.2
73
.3
74.4
77
.8
80.0
79
.6
69.7
73
.7
76.1
72
.4
71.4
72
.5
74.5
77
.9
79.8
80
.3
70.4
74
.7
77.2
73
.2
72.4
73
.3
74.8
78
.5
79.9
80
.3
70.1
74
.0
77.0
73
.2
72.3
73
.1
74.9
78
.4
79.8
80
.1
70.1
74
.2
76.7
72
.8
72.2
73
.1
74.7
78
.2
79.9
75.7
v
88.7
i0
LpA,
1s
110.
011
0.0
LpAe
q 11
0.0
109.
011
0.0
(C)
109.
8 (C
)
ii
ii
iA
)i
ii
i
ing
i
ii
ll
65707580859095
1 2
3 4
5 6
7 8
9 0
mi
me
K1
A
K2A
ev
ent 1
dB
(A)
1.66
1 dB
(A)
even
t 2
dB(A
) 1.
503
even
t 3
dB(A
) 1.
107
even
t 4
dB(A
) 1.
327
even
t 5
dB(A
) 1.
336
mic
pos
tion
even
t 1
even
t 2
even
t 3
even
t 4
even
t 5
Aver
age
std
0.40
0.
31
0.40
0.
41
0.38
0.
42
0.35
0.
29
0.31
0.
10
av s
td d
e0.
36
mic
pos
tion
79.9
dB(
A)
even
t 1
dB(C
) N
max
ev
ent 2
dB
(C)
#NU
M!
dB(A
) ev
ent 3
dB
(C)
even
t 4
dB(C
) ev
ent 5
dB
(C)
even
t 6
dB(C
) ev
ent 7
dB
(C)
even
t 8
dB(C
) ev
ent 9
dB
(C)
even
t 10
dBLp
C,p
eak
Aver
age
dBre
port
only
if >
130
dB
This
s th
e A
-wgt
sng
le-e
vent
em
sson
so
und
pres
sure
leve
l at t
he w
ork
stat
ion
LpA
,1s.
Fo
r com
paris
on w
th th
e va
lue
give
n in
nn
ex A
, 1.7
.4(f
of E
N 2
92-2
:199
1the
de
term
nato
n of
the
A-w
gt e
mss
on s
ound
pr
essu
re le
vel a
t the
wor
ksta
tion,
LpA
eq,
shal
l be
calc
ulat
ed fr
om L
pA,1
s by
tak
into
con
side
ratio
n th
e m
ax p
ossi
ble
num
ber
of d
rivin
g pr
oces
ses
in 1
s, N
max
,1s:
Lp
Aeq
= L
pA,1
s +
10lo
gNm
ax,1
s
This
s th
e ca
lcul
atio
n fo
r the
C-
wgt
pea
k em
issi
on s
ound
pr
essu
re le
vel o
f the
test
obj
ect
at th
e w
orks
tatio
n. D
eter
mne
d in
ac
cord
ance
wth
EN
ISO
112
01.
Pea
k =
high
est i
nsta
neou
s ev
e
L'pA
,1s
100
c po
sitio
n
L'pA,1s [d B(A)]
even
t 1
even
t 2
even
t 3
even
t 4
even
t 5
32
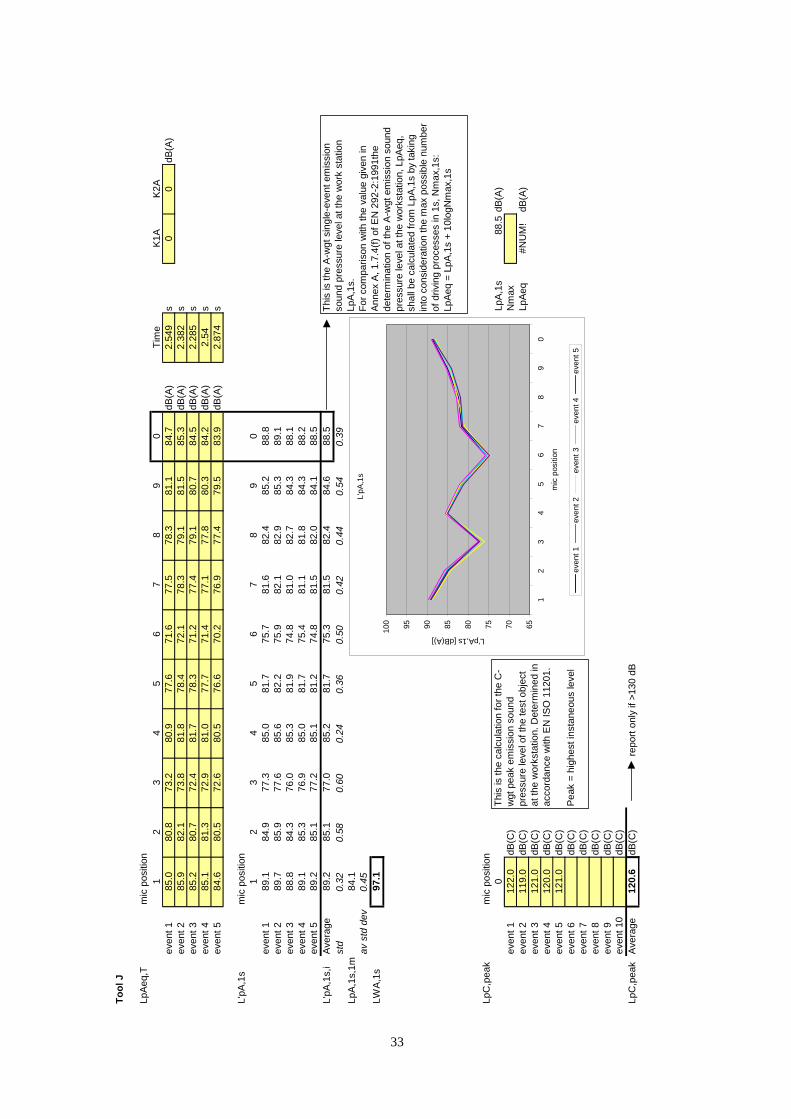
Tool
J
LpA
eq,T
m
ic p
ositi
on
L'pA
,1s
L'pA
,1s,
i
LpA
,1s,
1m
LWA
,1s
LpC
,pea
k
1 2
3 4
5 6
7 8
9 0
Ti85
.0
80.8
73
.2
80.9
77
.6
71.6
77
.5
78.3
81
.1
84.7
s
0 0
85.9
82
.1
73.8
81
.8
78.4
72
.1
78.3
79
.1
81.5
85
.3
s 85
.2
80.7
72
.4
81.7
78
.3
71.2
77
.4
79.1
80
.7
84.5
s
85.1
81
.3
72.9
81
.0
77.7
71
.4
77.1
77
.8
80.3
84
.2
2.54
s
84.6
80
.5
72.6
80
.5
76.6
70
.2
76.9
77
.4
79.5
83
.9
s
i1
2 3
4 5
6 7
8 9
0 89
.1
84.9
77
.3
85.0
81
.7
75.7
81
.6
82.4
85
.2
88.8
89
.7
85.9
77
.6
85.6
82
.2
75.9
82
.1
82.9
85
.3
89.1
88
.8
84.3
76
.0
85.3
81
.9
74.8
81
.0
82.7
84
.3
88.1
89
.1
85.3
76
.9
85.0
81
.7
75.4
81
.1
81.8
84
.3
88.2
89
.2
85.1
77
.2
85.1
81
.2
74.8
81
.5
82.0
84
.1
88.5
89
.2
85.1
77
.0
85.2
81
.7
75.3
81
.5
82.4
84
.6
88.5
84.1
v
97.1
i0
LpA,
1s
122.
011
9.0
LpAe
q 12
1.0
120.
012
1.0
(C)
120.
6 (C
)
ii
ii
iA
)i
ii
i
ing
i
ii
ll
65707580859095
1 2
3 4
5 6
7 8
9 0
mi
me
K1
A
K2A
ev
ent 1
dB
(A)
2.54
9 dB
(A)
even
t 2
dB(A
) 2.
382
even
t 3
dB(A
) 2.
285
even
t 4
dB(A
) ev
ent 5
dB
(A)
2.87
4
mic
pos
tion
even
t 1
even
t 2
even
t 3
even
t 4
even
t 5
Aver
age
std
0.32
0.
58
0.60
0.
24
0.36
0.
50
0.42
0.
44
0.54
0.
39
av s
td d
e0.
45
mic
pos
tion
88.5
dB(
A)
even
t 1
dB(C
) N
max
ev
ent 2
dB
(C)
#NU
M!
dB(A
) ev
ent 3
dB
(C)
even
t 4
dB(C
) ev
ent 5
dB
(C)
even
t 6
dB(C
) ev
ent 7
dB
(C)
even
t 8
dB(C
) ev
ent 9
dB
(C)
even
t 10
dBLp
C,p
eak
Aver
age
dBre
port
only
if >
130
dB
This
s th
e A
-wgt
sng
le-e
vent
em
sson
so
und
pres
sure
leve
l at t
he w
ork
stat
ion
LpA
,1s.
Fo
r com
paris
on w
th th
e va
lue
give
n in
nn
ex A
, 1.7
.4(f
of E
N 2
92-2
:199
1the
de
term
nato
n of
the
A-w
gt e
mss
on s
ound
pr
essu
re le
vel a
t the
wor
ksta
tion,
LpA
eq,
shal
l be
calc
ulat
ed fr
om L
pA,1
s by
tak
into
con
side
ratio
n th
e m
ax p
ossi
ble
num
ber
of d
rivin
g pr
oces
ses
in 1
s, N
max
,1s:
Lp
Aeq
= L
pA,1
s +
10lo
gNm
ax,1
s
This
s th
e ca
lcul
atio
n fo
r the
C-
wgt
pea
k em
issi
on s
ound
pr
essu
re le
vel o
f the
test
obj
ect
at th
e w
orks
tatio
n. D
eter
mne
d in
ac
cord
ance
wth
EN
ISO
112
01.
Pea
k =
high
est i
nsta
neou
s ev
e
L'pA
,1s
100
c po
sitio
n
L'pA,1s [d B(A)]
even
t 1
even
t 2
even
t 3
even
t 4
even
t 5
33
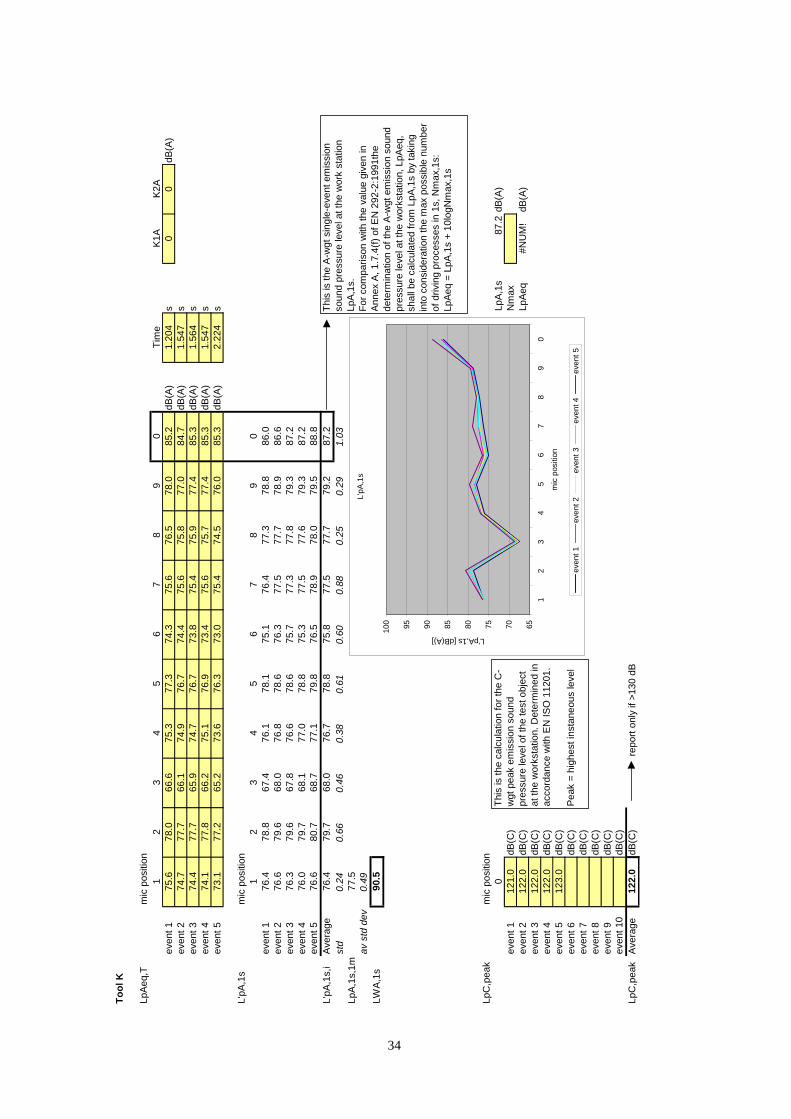
Tool
K
LpA
eq,T
m
ic p
ositi
on
L'pA
,1s
L'pA
,1s,
i
LpA
,1s,
1m
LWA
,1s
LpC
,pea
k
1 2
3 4
5 6
7 8
9 0
Ti75
.6
78.0
66
.6
75.3
77
.3
74.3
75
.6
76.5
78
.0
85.2
s
0 0
74.7
77
.7
66.1
74
.9
76.7
74
.4
75.6
75
.8
77.0
84
.7
s 74
.4
77.7
65
.9
74.7
76
.7
73.8
75
.4
75.9
77
.4
85.3
s
74.1
77
.8
66.2
75
.1
76.9
73
.4
75.6
75
.7
77.4
85
.3
s 73
.1
77.2
65
.2
73.6
76
.3
73.0
75
.4
74.5
76
.0
85.3
s
i1
2 3
4 5
6 7
8 9
0 76
.4
78.8
67
.4
76.1
78
.1
75.1
76
.4
77.3
78
.8
86.0
76
.6
79.6
68
.0
76.8
78
.6
76.3
77
.5
77.7
78
.9
86.6
76
.3
79.6
67
.8
76.6
78
.6
75.7
77
.3
77.8
79
.3
87.2
76
.0
79.7
68
.1
77.0
78
.8
75.3
77
.5
77.6
79
.3
87.2
76
.6
80.7
68
.7
77.1
79
.8
76.5
78
.9
78.0
79
.5
88.8
76
.4
79.7
68
.0
76.7
78
.8
75.8
77
.5
77.7
79
.2
87.2
77.5
v
90.5
i0
LpA,
1s
121.
012
2.0
LpAe
q 12
2.0
122.
012
3.0
(C)
122.
0 (C
)
ii
ii
iA
)i
ii
i
ing
i
ii
ll
65707580859095
1 2
3 4
5 6
7 8
9 0
mi
me
K1
A
K2A
ev
ent 1
dB
(A)
1.20
4 dB
(A)
even
t 2
dB(A
) 1.
547
even
t 3
dB(A
) 1.
564
even
t 4
dB(A
) 1.
547
even
t 5
dB(A
) 2.
224
mic
pos
tion
even
t 1
even
t 2
even
t 3
even
t 4
even
t 5
Aver
age
std
0.24
0.
66
0.46
0.
38
0.61
0.
60
0.88
0.
25
0.29
1.
03
av s
td d
e0.
49
mic
pos
tion
87.2
dB(
A)
even
t 1
dB(C
) N
max
ev
ent 2
dB
(C)
#NU
M!
dB(A
) ev
ent 3
dB
(C)
even
t 4
dB(C
) ev
ent 5
dB
(C)
even
t 6
dB(C
) ev
ent 7
dB
(C)
even
t 8
dB(C
) ev
ent 9
dB
(C)
even
t 10
dBLp
C,p
eak
Aver
age
dBre
port
only
if >
130
dB
This
s th
e A
-wgt
sng
le-e
vent
em
sson
so
und
pres
sure
leve
l at t
he w
ork
stat
ion
LpA
,1s.
Fo
r com
paris
on w
th th
e va
lue
give
n in
nn
ex A
, 1.7
.4(f
of E
N 2
92-2
:199
1the
de
term
nato
n of
the
A-w
gt e
mss
on s
ound
pr
essu
re le
vel a
t the
wor
ksta
tion,
LpA
eq,
shal
l be
calc
ulat
ed fr
om L
pA,1
s by
tak
into
con
side
ratio
n th
e m
ax p
ossi
ble
num
ber
of d
rivin
g pr
oces
ses
in 1
s, N
max
,1s:
Lp
Aeq
= L
pA,1
s +
10lo
gNm
ax,1
s
This
s th
e ca
lcul
atio
n fo
r the
C-
wgt
pea
k em
issi
on s
ound
pr
essu
re le
vel o
f the
test
obj
ect
at th
e w
orks
tatio
n. D
eter
mne
d in
ac
cord
ance
wth
EN
ISO
112
01.
Pea
k =
high
est i
nsta
neou
s ev
e
L'pA
,1s
100
c po
sitio
n
L'pA,1s [d B(A)]
even
t 1
even
t 2
even
t 3
even
t 4
even
t 5
34

10 APPENDIX C – ADDITIONAL LABORATORY TEST RESULTS
Page 36 Tool C
Page 37 Tool D
Page 38 Tool E
Page 39 Tool F
Page 40 Tool J
Page 41 Tool K
35
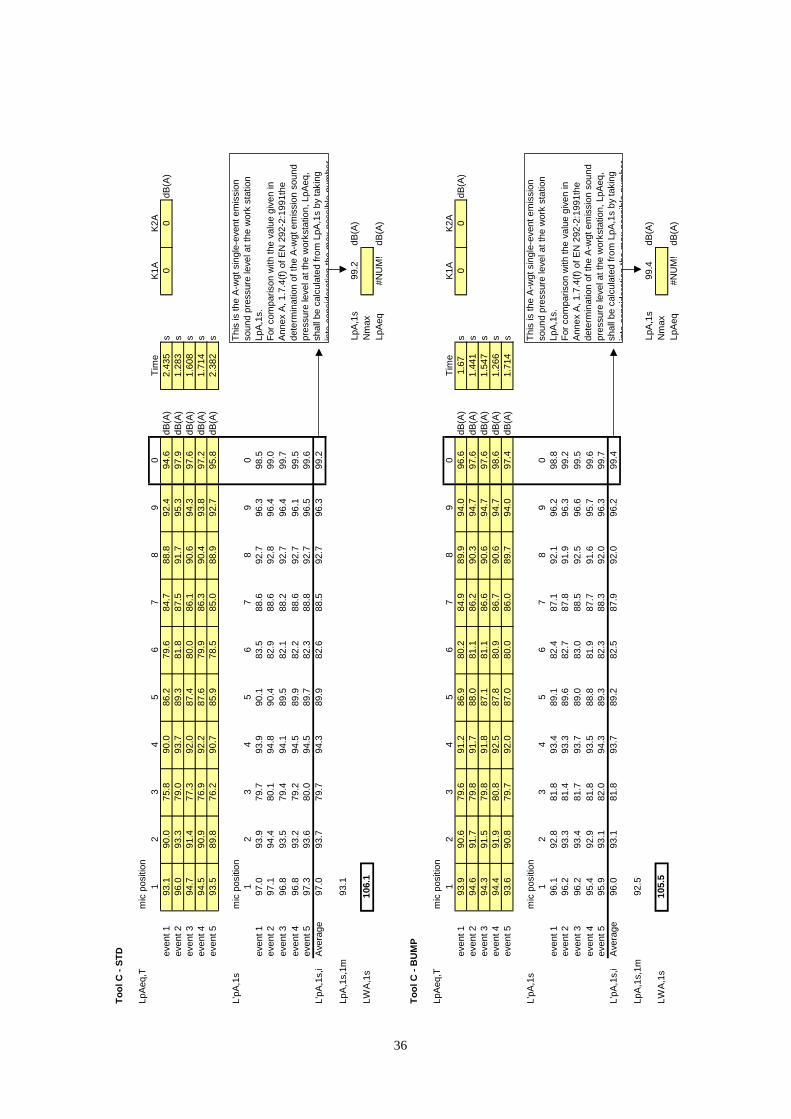
36
Tool
C -
STD
LpA
eq,T
m
ic p
ositi
on
1 2
34
56
78
9
Tim
e
K1A
K2
A
even
t 1
dB(A
) s
dB(A
) ev
ent 2
dB
(A)
sev
ent 3
dB
(A)
sev
ent 4
dB
(A)
sev
ent 5
dB
(A)
s
L'pA
,1s
mic
pos
ition
1
23
45
67
89
even
t 1
97.0
93
.9
79.7
93
.9
90.1
83
.5
88.6
92
.7
96.3
ev
ent 2
97
.1
94.4
80
.1
94.8
90
.4
82.9
88
.6
92.8
96
.4
even
t 3
96.8
93
.5
79.4
94
.1
89.5
82
.1
88.2
92
.7
96.4
ev
ent 4
96
.8
93.2
79
.2
94.5
89
.9
82.2
88
.6
92.7
96
.1
even
t 5
97.3
93
.6
80.0
94
.5
89.7
82
.3
88.8
92
.7
96.5
L'
pA,1
s,i
Ave
rage
97
.0
93.7
79
.7
94.3
89
.9
82.6
88
.5
92.7
96
.3
LpA
,1s,
1m
0 93
.1
90.0
75
.8
90.0
79
.6
84.7
88
.8
92.4
2.
435
0 0
96.0
93
.3
79.0
93
.7
87.5
91
.7
95.3
1.
283
94.7
91
.4
77.3
92
.0
86.1
90
.6
94.3
1.
608
94.5
90
.9
76.9
92
.2
86.3
90
.4
93.8
1.
714
93.5
89
.8
76.2
90
.7
85.0
88
.9
92.7
2.
382
0
93.1
il
ii
A)
lsh
all
into
con
side
ratio
n th
e m
ax p
ossi
ble
num
ber
86.2
94
.6
89.3
81
.8
97.9
87
.4
80.0
97
.6
87.6
79
.9
97.2
85
.9
78.5
95
.8
98.5
99
.0
99.7
99
.5
99.6
99
.2
This
s th
e A-
wgt
sin
gle-
even
t em
issi
on
soun
d pr
essu
re le
veat
the
wor
k st
atio
n Lp
A,1
s.
For c
ompa
rson
wth
the
valu
e gi
ven
in
nnex
A, 1
.7.4
(f o
f EN
292
-2:1
991t
he
dete
rmin
atio
n of
the
A-w
gt e
mis
sion
sou
nd
pres
sure
eve
l at t
he w
orks
tatio
n, L
pAeq
, b
e ca
lcul
ated
from
LpA
,1s
by ta
king
106.
1 Lp
A,1
s 99
.2
dB(A
) LW
A,1s
N
max
Lp
Aeq
#N
UM
! dB
(A)
Tool
C -
BU
MP
LpA
eq,T
m
ic p
ositi
on
12
34
56
78
9
Tim
e
K1A
K2
A
even
t 1
dB(A
) s
dB(A
) ev
ent 2
dB
(A)
sev
ent 3
dB
(A)
sev
ent 4
dB
(A)
sev
ent 5
dB
(A)
s
L'pA
,1s
mic
pos
ition
1
23
45
67
89
even
t 1
96.1
92
.8
81.8
93
.4
89.1
82
.4
87.1
92
.1
96.2
ev
ent 2
96
.2
93.3
81
.4
93.3
89
.6
82.7
87
.8
91.9
96
.3
even
t 3
96.2
93
.4
81.7
93
.7
89.0
83
.0
88.5
92
.5
96.6
ev
ent 4
95
.4
92.9
81
.8
93.5
88
.8
81.9
87
.7
91.6
95
.7
even
t 5
95.9
93
.1
82.0
94
.3
89.3
82
.3
88.3
92
.0
96.3
L'
pA,1
s,i
Ave
rage
96
.0
93.1
81
.8
93.7
89
.2
82.5
87
.9
92.0
96
.2
LpA
,1s,
1m
92.5
0 93
.9
90.6
79
.6
91.2
80
.2
84.9
89
.9
94.0
0
0 94
.6
91.7
79
.8
91.7
86
.2
90.3
94
.7
1.44
1 94
.3
91.5
79
.8
91.8
86
.6
90.6
94
.7
1.54
7 94
.4
91.9
80
.8
92.5
86
.7
90.6
94
.7
1.26
6 93
.6
90.8
79
.7
92.0
86
.0
89.7
94
.0
1.71
4
0 i
l
ii
A)
lsh
all
into
con
side
ratio
n th
e m
ax p
ossi
ble
num
ber
86.9
96
.6
1.67
88
.0
81.1
97
.6
87.1
81
.1
97.6
87
.8
80.9
98
.6
87.0
80
.0
97.4
98.8
99
.2
99.5
99
.6
99.7
99
.4
This
s th
e A-
wgt
sin
gle-
even
t em
issi
on
soun
d pr
essu
re le
veat
the
wor
k st
atio
n Lp
A,1
s.
For c
ompa
rson
wth
the
valu
e gi
ven
in
nnex
A, 1
.7.4
(f o
f EN
292
-2:1
991t
he
dete
rmin
atio
n of
the
A-w
gt e
mis
sion
sou
nd
pres
sure
eve
l at t
he w
orks
tatio
n, L
pAeq
, b
e ca
lcul
ated
from
LpA
,1s
by ta
king
105.
5 Lp
A,1
s 99
.4
dB(A
) LW
A,1s
N
max
Lp
Aeq
#N
UM
! dB
(A)
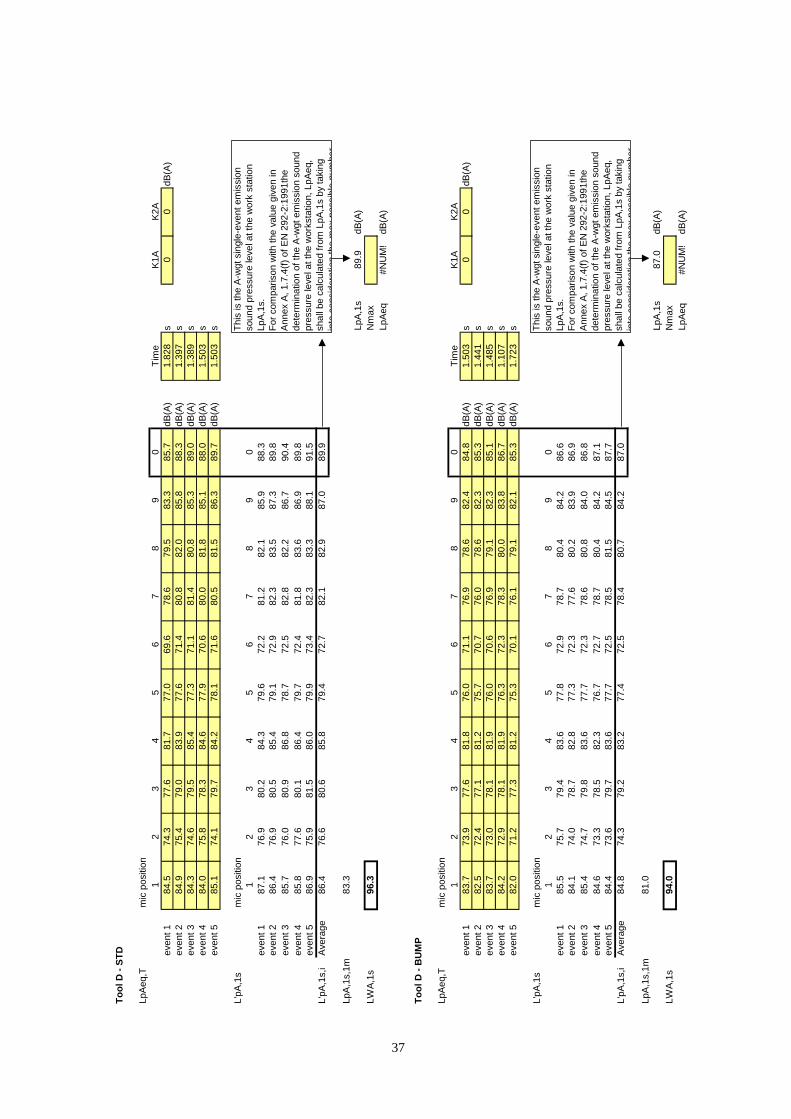
37
Tool
D -
STD
LpA
eq,T
m
ic p
ositi
on
12
34
56
78
9
Tim
e
K1A
K2
A
even
t 1
dB(A
) s
dB(A
) ev
ent 2
dB
(A)
sev
ent 3
dB
(A)
sev
ent 4
dB
(A)
sev
ent 5
dB
(A)
s
L'pA
,1s
mic
pos
ition
1
23
45
67
89
even
t 1
87.1
76
.9
80.2
84
.3
79.6
72
.2
81.2
82
.1
85.9
ev
ent 2
86
.4
76.9
80
.5
85.4
79
.1
72.9
82
.3
83.5
87
.3
even
t 3
85.7
76
.0
80.9
86
.8
78.7
72
.5
82.8
82
.2
86.7
ev
ent 4
85
.8
77.6
80
.1
86.4
79
.7
72.4
81
.8
83.6
86
.9
even
t 5
86.9
75
.9
81.5
86
.0
79.9
73
.4
82.3
83
.3
88.1
L'
pA,1
s,i
Aver
age
86.4
76
.6
80.6
85
.8
79.4
72
.7
82.1
82
.9
87.0
LpA
,1s,
1m
0 84
.5
77.6
81
.7
69.6
78
.6
85.7
0
0 84
.9
79.0
83
.9
71.4
80
.8
88.3
84
.3
79.5
85
.4
71.1
81
.4
89.0
84
.0
78.3
84
.6
70.6
80
.0
88.0
85
.1
79.7
84
.2
71.6
80
.5
89.7 0
88.3
89.8
90.4
89.8
91.5
89.9
83.3
ii
ion
ii
iA
)i
ing
into
con
side
ratio
n th
e m
ax p
ossi
ble
num
ber
74.3
77
.0
79.5
83
.3
1.82
8 75
.4
77.6
82
.0
85.8
1.
397
74.6
77
.3
80.8
85
.3
1.38
9 75
.8
77.9
81
.8
85.1
1.
503
74.1
78
.1
81.5
86
.3
1.50
3
This
is th
e A
-wgt
sng
le-e
vent
em
ssso
und
pres
sure
leve
l at t
he w
ork
stat
ion
LpA
,1s.
Fo
r com
pars
on w
th th
e va
lue
gve
n in
nn
ex A
, 1.7
.4(f
of E
N 2
92-2
:199
1the
de
term
inat
ion
of th
e A
-wgt
em
iss
on s
ound
pr
essu
re le
vel a
t the
wor
ksta
tion,
LpA
eq,
shal
l be
calc
ulat
ed fr
om L
pA,1
s by
tak
96.3
Lp
A,1
s 89
.9
dB(A
) LW
A,1
s N
max
LpA
eq
#NU
M!
dB(A
)
Tool
D -
BU
MP
LpA
eq,T
m
ic p
ositi
on
12
34
56
78
9
Tim
e
K1A
K2
A
even
t 1
dB(A
) s
dB(A
) ev
ent 2
dB
(A)
sev
ent 3
dB
(A)
sev
ent 4
dB
(A)
sev
ent 5
dB
(A)
s
L'pA
,1s
mic
pos
ition
1
23
45
67
89
even
t 1
85.5
75
.7
79.4
83
.6
77.8
72
.9
78.7
80
.4
84.2
ev
ent 2
84
.1
74.0
78
.7
82.8
77
.3
72.3
77
.6
80.2
83
.9
even
t 3
85.4
74
.7
79.8
83
.6
77.7
72
.3
78.6
80
.8
84.0
ev
ent 4
84
.6
73.3
78
.5
82.3
76
.7
72.7
78
.7
80.4
84
.2
even
t 5
84.4
73
.6
79.7
83
.6
77.7
72
.5
78.5
81
.5
84.5
L'
pA,1
s,i
Aver
age
84.8
74
.3
79.2
83
.2
77.4
72
.5
78.4
80
.7
84.2
LpA
,1s,
1m
81.0
0 83
.7
77.6
81
.8
71.1
76
.9
84.8
0
0 82
.5
77.1
81
.2
70.7
76
.0
85.3
83
.7
78.1
81
.9
70.6
76
.9
85.1
84
.2
78.1
81
.9
72.3
78
.3
86.7
82
.0
77.3
81
.2
70.1
76
.1
85.3 0
86.6
86.9
86.8
87.1
87.7
87.0
ii
ion
ii
iA
)i
ing
into
con
side
ratio
n th
e m
ax p
ossi
ble
num
ber
73.9
76
.0
78.6
82
.4
1.50
3 72
.4
75.7
78
.6
82.3
1.
441
73.0
76
.0
79.1
82
.3
1.48
5 72
.9
76.3
80
.0
83.8
1.
107
71.2
75
.3
79.1
82
.1
1.72
3
This
is th
e A
-wgt
sng
le-e
vent
em
ssso
und
pres
sure
leve
l at t
he w
ork
stat
ion
LpA
,1s.
Fo
r com
pars
on w
th th
e va
lue
gve
n in
nn
ex A
, 1.7
.4(f
of E
N 2
92-2
:199
1the
de
term
inat
ion
of th
e A
-wgt
em
iss
on s
ound
pr
essu
re le
vel a
t the
wor
ksta
tion,
LpA
eq,
shal
l be
calc
ulat
ed fr
om L
pA,1
s by
tak
94.0
Lp
A,1
s 87
.0
dB(A
) LW
A,1
s N
max
LpA
eq
#NU
M!
dB(A
)

38
Tool
E -
STD
LpA
eq,T
m
ic p
ositi
on
12
34
56
78
9
Tim
e
K1A
K2
A
even
t 1
dB(A
) s
dB(A
) ev
ent 2
dB
(A)
sev
ent 3
dB
(A)
sev
ent 4
dB
(A)
sev
ent 5
dB
(A)
s
L'pA
,1s
mic
pos
ition
1
23
45
67
89
even
t 1
91.3
88
.7
71.0
87
.9
84.3
75
.1
80.0
86
.5
89.1
ev
ent 2
90
.7
88.5
70
.9
87.7
85
.0
75.4
80
.1
86.5
89
.5
even
t 3
91.2
88
.4
70.8
88
.1
85.6
75
.7
80.6
86
.5
89.3
ev
ent 4
91
.1
89.1
71
.2
88.3
86
.0
76.1
80
.4
86.2
89
.6
even
t 5
91.3
88
.6
71.7
88
.1
85.8
75
.6
80.1
86
.3
88.8
L'
pA,1
s,i
Aver
age
91.1
88
.6
71.1
88
.0
85.3
75
.6
80.2
86
.4
89.2
LpA
,1s,
1m
0 89
.2
68.9
85
.8
73.0
77
.9
87.3
0
0 89
.0
69.2
86
.0
73.7
78
.4
87.4
88
.8
68.4
85
.7
73.3
78
.2
87.0
88
.5
68.6
85
.7
73.5
77
.8
87.2
88
.4
68.8
85
.2
72.7
77
.2
86.2 0
89.4
89.1
89.4
89.8
89.1
89.3
86.9
ii
ion
ii
iA
)i
ing
into
con
side
ratio
n th
e m
ax p
ossi
ble
num
ber
86.6
82
.2
84.4
87
.0
1.60
8 86
.8
83.3
84
.8
87.8
1.
477
86.0
83
.2
84.1
86
.9
1.72
3 86
.5
83.4
83
.6
87.0
1.
828
85.7
82
.9
83.4
85
.9
1.94
2
This
is th
e A
-wgt
sng
le-e
vent
em
ssso
und
pres
sure
leve
l at t
he w
ork
stat
ion
LpA
,1s.
Fo
r com
pars
on w
th th
e va
lue
gve
n in
nn
ex A
, 1.7
.4(f
of E
N 2
92-2
:199
1the
de
term
inat
ion
of th
e A
-wgt
em
iss
on s
ound
pr
essu
re le
vel a
t the
wor
ksta
tion,
LpA
eq,
shal
l be
calc
ulat
ed fr
om L
pA,1
s by
tak
99.9
Lp
A,1
s 89
.3
dB(A
) LW
A,1
s N
max
LpA
eq
#NU
M!
dB(A
)
Tool
E -
BU
MP
LpA
eq,T
m
ic p
ositi
on
12
34
56
78
9
Tim
e
K1A
K2
A
even
t 1
dB(A
) s
dB(A
) ev
ent 2
dB
(A)
sev
ent 3
dB
(A)
sev
ent 4
dB
(A)
sev
ent 5
dB
(A)
s
L'pA
,1s
mic
pos
ition
1
23
45
67
89
even
t 1
91.2
88
.5
71.5
87
.8
86.1
76
.3
79.9
85
.3
88.4
ev
ent 2
90
.9
88.4
71
.5
87.8
86
.4
75.8
80
.1
86.1
89
.5
even
t 3
91.9
88
.7
72.0
88
.8
86.2
76
.4
80.6
87
.3
90.0
ev
ent 4
91
.3
89.0
71
.7
88.0
86
.2
77.4
80
.5
86.0
89
.7
even
t 5
91.5
90
.1
72.5
88
.9
86.9
78
.0
80.5
86
.7
90.0
L'
pA,1
s,i
Aver
age
91.4
88
.9
71.8
88
.3
86.4
76
.8
80.3
86
.3
89.5
LpA
,1s,
1m
87.2
0 87
.9
68.2
84
.5
73.0
76
.6
86.5
0
0 87
.7
68.3
84
.6
72.6
76
.9
86.7
87
.7
67.8
84
.6
72.2
76
.4
86.2
89
.6
70.0
86
.3
75.7
78
.8
89.1
87
.9
68.9
85
.3
74.4
76
.9
86.7 0
89.8
89.9
90.4
90.8
90.3
90.2
ii
ion
ii
iA
)i
ing
into
con
side
ratio
n th
e m
ax p
ossi
ble
num
ber
85.2
82
.8
82.0
85
.1
2.15
3 85
.2
83.2
82
.9
86.3
2.
109
84.5
82
.0
83.1
85
.8
2.61
87
.3
84.5
84
.3
88.0
1.
477
86.5
83
.3
83.1
86
.4
2.26
8
This
is th
e A
-wgt
sng
le-e
vent
em
ssso
und
pres
sure
leve
l at t
he w
ork
stat
ion
LpA
,1s.
Fo
r com
pars
on w
th th
e va
lue
gve
n in
nn
ex A
, 1.7
.4(f
of E
N 2
92-2
:199
1the
de
term
inat
ion
of th
e A
-wgt
em
iss
on s
ound
pr
essu
re le
vel a
t the
wor
ksta
tion,
LpA
eq,
shal
l be
calc
ulat
ed fr
om L
pA,1
s by
tak
100.
2 Lp
A,1
s 90
.2
dB(A
) LW
A,1
s N
max
LpA
eq
#NU
M!
dB(A
)

39
Tool
F -
STD
LpA
eq,T
m
ic p
ositi
on
12
34
56
78
9
Tim
e
K1A
K2
A
even
t 1
dB(A
) s
dB(A
) ev
ent 2
dB
(A)
sev
ent 3
dB
(A)
sev
ent 4
dB
(A)
sev
ent 5
dB
(A)
s
L'pA
,1s
mic
pos
ition
1
23
45
67
89
even
t 1
89.3
75
.5
83.0
88
.4
77.1
77
.7
81.9
84
.3
88.0
ev
ent 2
88
.9
75.2
83
.8
88.5
76
.6
77.4
81
.8
83.9
87
.2
even
t 3
88.7
75
.8
84.6
88
.0
77.2
77
.8
82.2
84
.1
87.4
ev
ent 4
89
.2
75.5
84
.7
88.7
76
.8
76.9
82
.2
84.2
87
.2
even
t 5
88.6
75
.2
83.4
88
.8
76.7
77
.5
82.3
83
.9
87.4
L'
pA,1
s,i
Aver
age
88.9
75
.4
83.9
88
.5
76.9
77
.5
82.1
84
.1
87.4
LpA
,1s,
1m
0 87
.0
80.7
86
.1
75.4
79
.6
88.2
0
0 86
.3
81.2
85
.9
74.8
79
.2
87.9
86
.5
82.4
85
.8
75.6
80
.0
89.0
86
.3
81.8
85
.8
74.0
79
.3
89.3
85
.7
80.5
85
.9
74.6
79
.4
88.2 0
90.5
90.5
91.2
92.2
91.1
91.1
85.0
ii
ion
ii
iA
)i
ing
into
con
side
ratio
n th
e m
ax p
ossi
ble
num
ber
73.2
74
.8
82.0
85
.7
1.71
4 72
.6
74.0
81
.3
84.6
1.
828
73.6
75
.0
81.9
85
.2
1.65
2 72
.6
73.9
81
.3
84.3
1.
942
72.3
73
.8
81.0
84
.5
1.93
4
This
is th
e A
-wgt
sng
le-e
vent
em
ssso
und
pres
sure
leve
l at t
he w
ork
stat
ion
LpA
,1s.
Fo
r com
pars
on w
th th
e va
lue
gve
n in
nn
ex A
, 1.7
.4(f
of E
N 2
92-2
:199
1the
de
term
inat
ion
of th
e A
-wgt
em
iss
on s
ound
pr
essu
re le
vel a
t the
wor
ksta
tion,
LpA
eq,
shal
l be
calc
ulat
ed fr
om L
pA,1
s by
tak
98.0
Lp
A,1
s 91
.1
dB(A
) LW
A,1
s N
max
LpA
eq
#NU
M!
dB(A
)
Tool
F -
BU
MP
LpA
eq,T
m
ic p
ositi
on
12
34
56
78
9
Tim
e
K1A
K2
A
even
t 1
dB(A
) s
dB(A
) ev
ent 2
dB
(A)
sev
ent 3
dB
(A)
sev
ent 4
dB
(A)
sev
ent 5
dB
(A)
s
L'pA
,1s
mic
pos
ition
1
23
45
67
89
even
t 1
87.3
72
.6
84.7
88
.3
75.9
78
.3
82.1
83
.2
88.0
ev
ent 2
87
.2
71.6
83
.1
88.5
74
.4
78.5
82
.8
84.3
88
.0
even
t 3
88.2
73
.1
84.0
88
.2
75.2
79
.2
83.0
84
.5
89.0
ev
ent 4
87
.6
72.8
82
.5
87.8
75
.1
77.6
81
.4
83.4
87
.6
even
t 5
88.4
73
.6
84.1
87
.8
75.4
79
.4
82.7
84
.4
88.6
L'
pA,1
s,i
Aver
age
87.8
72
.8
83.7
88
.1
75.2
78
.6
82.4
84
.0
88.3
LpA
,1s,
1m
84.8
0 84
.0
81.4
85
.0
75.0
78
.8
88.2
0
0 86
.1
82.0
87
.4
77.4
81
.7
90.3
86
.3
82.1
86
.3
77.3
81
.1
90.4
87
.2
82.1
87
.4
77.2
81
.0
91.4
85
.6
81.3
85
.0
76.6
79
.9
89.6 0
91.5
91.4
92.3
91.8
92.4
91.9
ii
ion
ii
iA
)i
ing
into
con
side
ratio
n th
e m
ax p
ossi
ble
num
ber
69.3
72
.6
79.9
84
.7
2.16
2 70
.5
73.3
83
.2
86.9
1.
283
71.2
73
.3
82.6
87
.1
1.56
4 72
.4
74.7
83
.0
87.2
1.
107
70.8
72
.6
81.6
85
.8
1.89
This
is th
e A
-wgt
sng
le-e
vent
em
ssso
und
pres
sure
leve
l at t
he w
ork
stat
ion
LpA
,1s.
Fo
r com
pars
on w
th th
e va
lue
gve
n in
nn
ex A
, 1.7
.4(f
of E
N 2
92-2
:199
1the
de
term
inat
ion
of th
e A
-wgt
em
iss
on s
ound
pr
essu
re le
vel a
t the
wor
ksta
tion,
LpA
eq,
shal
l be
calc
ulat
ed fr
om L
pA,1
s by
tak
97.8
Lp
A,1
s 91
.9
dB(A
) LW
A,1
s N
max
LpA
eq
#NU
M!
dB(A
)

40
Tool
J -
STD
LpA
eq,T
m
ic p
ositi
on
12
34
56
78
9
Tim
e
K1A
K2
A
even
t 1
dB(A
) s
dB(A
) ev
ent 2
dB
(A)
sev
ent 3
dB
(A)
sev
ent 4
dB
(A)
sev
ent 5
dB
(A)
s
L'pA
,1s
mic
pos
ition
1
23
45
67
89
even
t 1
89.1
85
.1
77.5
84
.6
82.4
78
.4
82.8
82
.3
87.1
ev
ent 2
88
.9
85.8
77
.8
85.0
82
.4
78.6
83
.2
82.6
87
.3
even
t 3
88.8
85
.6
77.3
84
.9
82.6
78
.1
82.6
82
.5
87.1
ev
ent 4
89
.1
85.9
77
.5
85.1
82
.9
78.8
83
.8
82.9
87
.5
even
t 5
89.3
86
.4
77.8
85
.7
83.4
79
.7
84.3
82
.9
88.0
L'
pA,1
s,i
Aver
age
89.1
85
.8
77.6
85
.1
82.8
78
.8
83.4
82
.7
87.4
LpA
,1s,
1m
0 85
.5
73.9
81
.0
74.8
79
.2
86.0
0
0 85
.6
74.5
81
.7
75.3
79
.9
86.6
85
.3
73.8
81
.4
74.6
79
.1
86.1
86
.0
74.4
82
.0
75.7
80
.7
87.5
84
.2
72.7
80
.6
74.6
79
.2
86.1 0
89.6
89.9
89.6
90.6
91.2
90.2
84.9
ii
ion
ii
iA
)i
ing
into
con
side
ratio
n th
e m
ax p
ossi
ble
num
ber
81.5
78
.8
78.7
83
.5
2.31
2 82
.5
79.1
79
.3
84.0
2.
153
82.1
79
.1
79.0
83
.6
2.25
9 82
.8
79.8
79
.8
84.4
2.
048
81.3
78
.3
77.8
82
.9
3.27
This
is th
e A
-wgt
sng
le-e
vent
em
ssso
und
pres
sure
leve
l at t
he w
ork
stat
ion
LpA
,1s.
Fo
r com
pars
on w
th th
e va
lue
gve
n in
nn
ex A
, 1.7
.4(f
of E
N 2
92-2
:199
1the
de
term
inat
ion
of th
e A
-wgt
em
iss
on s
ound
pr
essu
re le
vel a
t the
wor
ksta
tion,
LpA
eq,
shal
l be
calc
ulat
ed fr
om L
pA,1
s by
tak
97.9
Lp
A,1
s 90
.2
dB(A
) LW
A,1
s N
max
LpA
eq
#NU
M!
dB(A
)
Tool
J -
BU
MP
LpA
eq,T
m
ic p
ositi
on
12
34
56
78
9
Tim
e
K1A
K2
A
even
t 1
dB(A
) s
dB(A
) ev
ent 2
dB
(A)
sev
ent 3
dB
(A)
sev
ent 4
dB
(A)
sev
ent 5
dB
(A)
s
L'pA
,1s
mic
pos
ition
1
23
45
67
89
even
t 1
88.4
85
.6
78.1
85
.6
82.8
78
.3
83.3
83
.2
87.4
ev
ent 2
88
.0
84.9
77
.1
84.3
83
.1
77.6
82
.9
83.3
86
.6
even
t 3
87.6
85
.0
77.0
84
.5
82.0
77
.3
83.1
83
.6
87.0
ev
ent 4
87
.7
85.3
77
.2
84.7
82
.3
77.6
82
.3
83.2
87
.0
even
t 5
88.8
86
.2
77.2
85
.8
84.3
80
.5
84.6
84
.4
88.8
L'
pA,1
s,i
Aver
age
88.1
85
.4
77.3
85
.0
82.9
78
.2
83.2
83
.5
87.3
LpA
,1s,
1m
84.6
0 86
.2
75.9
83
.4
76.1
81
.1
88.0
0
0 86
.9
76.0
83
.2
76.5
81
.8
88.8
86
.4
75.8
83
.3
76.1
81
.9
88.5
86
.1
75.6
83
.1
76.0
80
.7
88.3
88
.1
76.5
85
.1
79.8
83
.9
90.5 0
90.2
89.9
89.7
89.9
91.2
90.2
ii
ion
ii
iA
)i
ing
into
con
side
ratio
n th
e m
ax p
ossi
ble
num
ber
83.4
80
.6
81.0
85
.2
1.66
1 83
.8
82.0
82
.2
85.5
1.
274
83.8
80
.8
82.4
85
.8
1.32
7 83
.7
80.7
81
.6
85.4
1.
441
85.5
83
.6
83.7
88
.1
1.16
9
This
is th
e A
-wgt
sng
le-e
vent
em
ssso
und
pres
sure
leve
l at t
he w
ork
stat
ion
LpA
,1s.
Fo
r com
pars
on w
th th
e va
lue
gve
n in
nn
ex A
, 1.7
.4(f
of E
N 2
92-2
:199
1the
de
term
inat
ion
of th
e A
-wgt
em
iss
on s
ound
pr
essu
re le
vel a
t the
wor
ksta
tion,
LpA
eq,
shal
l be
calc
ulat
ed fr
om L
pA,1
s by
tak
97.6
Lp
A,1
s 90
.2
dB(A
) LW
A,1
s N
max
LpA
eq
#NU
M!
dB(A
)

Tool
K -
auto
fire
LpA
eq,T
m
ic p
ositi
on
L'pA
,1s
L'pA
,1s,
i
LpA
,1s,
1m
LWA
,1s
LpC
,pea
k
1 2
3 4
5 6
7 8
9 0
Ti90
.1
91.2
82
.5
90.9
90
.2
88.5
90
.8
91.2
91
.5
s 0
0 91
.2
91.4
84
.3
92.1
91
.0
87.7
92
.9
92.6
92
.5
s 88
.8
89.1
81
.8
89.7
87
.1
84.6
88
.5
89.0
89
.8
98.4
s
87.5
89
.2
79.5
87
.5
86.7
86
.2
85.7
85
.9
89.0
95
.9
s 89
.1
89.5
81
.8
87.3
87
.2
85.4
85
.8
85.9
89
.6
96.2
s
i1
2 3
4 5
6 7
8 9
0 79
.7
80.8
72
.1
80.5
79
.8
78.1
80
.4
80.8
81
.1
90.6
79
.9
80.1
73
.0
80.8
79
.7
76.4
81
.6
81.3
81
.2
90.7
78
.2
78.5
71
.2
79.1
76
.5
74.0
77
.9
78.4
79
.2
87.8
78
.8
80.5
70
.8
78.8
78
.0
77.5
77
.0
77.2
80
.3
87.2
78
.6
79.0
71
.3
76.8
76
.7
74.9
75
.3
75.4
79
.1
85.7
79
.0
79.8
71
.7
79.2
78
.1
76.2
78
.4
78.6
80
.2
88.4
78.4
91.4
i0
LpA,
1s
127.
012
9.0
LpAe
q 12
5.0
123.
011
9.0
(C)
124.
6 (C
)
ii
ii
iA
)i
ii
i
ing
i
ii
ll
65707580859095
1 2
3 4
5 6
7 8
9 0
mi
me
K1
A
K2A
ev
ent 1
10
1.0
dB(A
) 3.
981
dB(A
) ev
ent 2
10
2.0
dB(A
) 3.
375
even
t 3
dB(A
) 4.
939
even
t 4
dB(A
) 5.
924
even
t 5
dB(A
) 4.
157
mic
pos
tion
even
t 1
even
t 2
even
t 3
even
t 4
even
t 5
Aver
age
std
0.72
0.
99
0.86
1.
59
1.57
1.
72
2.54
2.
46
1.00
2.
18
mic
pos
tion
88.4
dB(
A)
even
t 1
dB(C
) N
max
ev
ent 2
dB
(C)
#NU
M!
dB(A
) ev
ent 3
dB
(C)
even
t 4
dB(C
) ev
ent 5
dB
(C)
even
t 6
dB(C
) ev
ent 7
dB
(C)
even
t 8
dB(C
) ev
ent 9
dB
(C)
even
t 10
dBLp
C,p
eak
Aver
age
dBre
port
only
if >
130
dB
This
s th
e A
-wgt
sng
le-e
vent
em
sson
so
und
pres
sure
leve
l at t
he w
ork
stat
ion
LpA
,1s.
Fo
r com
paris
on w
th th
e va
lue
give
n in
nn
ex A
, 1.7
.4(f
of E
N 2
92-2
:199
1the
de
term
nato
n of
the
A-w
gt e
mss
on s
ound
pr
essu
re le
vel a
t the
wor
ksta
tion,
LpA
eq,
shal
l be
calc
ulat
ed fr
om L
pA,1
s by
tak
into
con
side
ratio
n th
e m
ax p
ossi
ble
num
ber
of d
rivin
g pr
oces
ses
in 1
s, N
max
,1s:
Lp
Aeq
= L
pA,1
s +
10lo
gNm
ax,1
s
This
s th
e ca
lcul
atio
n fo
r the
C-
wgt
pea
k em
issi
on s
ound
pr
essu
re le
vel o
f the
test
obj
ect
at th
e w
orks
tatio
n. D
eter
mne
d in
ac
cord
ance
wth
EN
ISO
112
01.
Pea
k =
high
est i
nsta
neou
s ev
e
L'pA
,1s
100
c po
sitio
n
L'pA,1s [d B(A)]
even
t 1
even
t 2
even
t 3
even
t 4
even
t 5
41

11 APPENDIX D – IN REAL USE / FIELD RESULTS
Page 43 Site 1
Page 44 Site 2
Page 45 Site 3
Page 46 Site 4
42
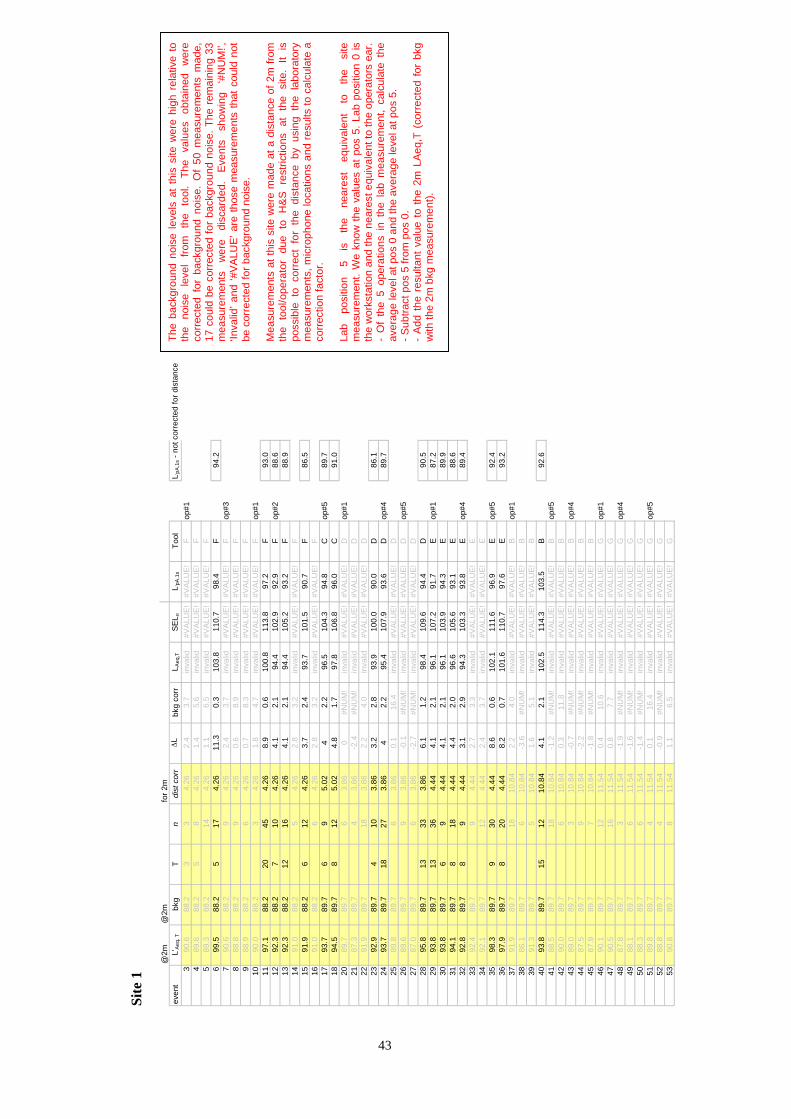
43
Site
1
even
t 3 4 5 6 7 8 9 10 11 12 13 14 15 16 17 18 20 21 22 23 24 25 26 27 28 29 30 31 32 33 34 35 36 37 38 39 40 41 42 43 44 45 46 47 48 49 50 51 52 53
L'@
2mA
eq, T
90.6
89
.6
89.3
99
.5
90.6
88
.8
88.9
90
.0
97.1
92
.3
92.3
91
.0
91.9
91
.0
93.7
94
.5
89.7
87
.3
91.9
92
.9
93.7
89
.8
89.6
87
.0
95.8
93
.8
93.8
94
.1
92.8
92
.4
92.1
98
.3
97.9
91
.9
86.1
91
.3
93.8
88
.5
90.0
89
.0
87.5
87
.9
90.1
90
.5
87.8
88
.1
88.3
89
.8
88.8
90
.8
@2m
bk
g 88
.2
88.2
88
.2
88.2
88
.2
88.2
88
.2
88.2
88
.2
88.2
88
.2
88.2
88
.2
88.2
89
.7
89.7
89
.7
89.7
89
.7
89.7
89
.7
89.7
89
.7
89.7
89
.7
89.7
89
.7
89.7
89
.7
89.7
89
.7
89.7
89
.7
89.7
89
.7
89.7
89
.7
89.7
89
.7
89.7
89
.7
89.7
89
.7
89.7
89
.7
89.7
89
.7
89.7
89
.7
89.7
T 3 5 5 20 7 12 6 6 8 4 18 13 13 6 8 8 9 8 15
n 3 8 14 17 9 9 6 3 45 10 16 5 12 6 9 12 6 4 18 10 27 6 9 6 33 36 9 18 9 9 12 30 20 18
6 5 12 18 6 3 9 7 12 16
3 6 6 4 4 8
for 2
m
dist
cor
r
4.26
4.
26
4.26
4.
26
4.26
4.
26
4.26
4.
26
4.26
4.
26
4.26
4.
26
4.26
4.
26
5.02
5.
02
3.86
3.
86
3.86
3.
86
3.86
3.
86
3.86
3.
86
3.86
4.
44
4.44
4.
44
4.44
4.
44
4.44
4.
44
4.44
10
.84
10.8
4 10
.84
10.8
4 10
.84
10.8
4 10
.84
10.8
4 10
.84
11.5
4 11
.54
11.5
4 11
.54
11.5
4 11
.54
11.5
4 11
.54
ΔL
2.4
1.4
1.1
11.3
2.
4 0.
6 0.
7 1.
8 8.
9 4.
1 4.
1 2.
8 3.
7 2.
8 4 4.8 0 -2.4
2.
2 3.
2 4 0.1
-0.1
-2
.7
6.1
4.1
4.1
4.4
3.1
2.7
2.4
8.6
8.2
2.2
-3.6
1.
6 4.
1 -1
.2
0.3
-0.7
-2
.2
-1.8
0.
4 0.
8 -1
.9
-1.6
-1
.4
0.1
-0.9
1.
1
bkg
corr
3.
7 5.
6 6.
5 0.
3 3.
7 8.
9 8.
3 4.
7 0.
6 2.
1 2.
1 3.
2 2.
4 3.
2 2.
2 1.
7 #N
UM
! #N
UM
! 4.
0 2.
8 2.
2 16
.4
#NU
M!
#NU
M!
1.2
2.1
2.1
2.0
2.9
3.3
3.7
0.6
0.7
4.0
#NU
M!
5.1
2.1
#NU
M!
11.8
#N
UM
! #N
UM
! #N
UM
! 10
.6
7.7
#NU
M!
#NU
M!
#NU
M!
16.4
#N
UM
! 6.
5
L Aeq
,T
inva
lid
inva
lid
inva
lid10
3.8
inva
lidin
valid
inva
lidin
valid
100.
8 94
.4
94.4
in
valid
93.7
in
valid
96.5
97
.8
inva
lidin
valid
in
valid
93.9
95
.4
inva
lid
inva
lid
inva
lid98
.4
96.1
96
.1
96.6
94
.3
inva
lidin
valid
102.
1 10
1.6
inva
lidin
valid
inva
lid10
2.5
inva
lidin
valid
inva
lidin
valid
inva
lidin
valid
inva
lidin
valid
inva
lidin
valid
inva
lidin
valid
inva
lid
SEL n
#VAL
UE!
#V
ALU
E!
#VAL
UE!
11
0.7
#VAL
UE!
#V
ALU
E!
#VAL
UE!
#V
ALU
E!
113.
8 10
2.9
105.
2 #V
ALU
E!
101.
5 #V
ALU
E!
104.
3 10
6.8
#VAL
UE!
#V
ALU
E!
#VAL
UE!
10
0.0
107.
9 #V
ALU
E!
#VAL
UE!
#V
ALU
E!
109.
6 10
7.2
103.
9 10
5.6
103.
3 #V
ALU
E!
#VAL
UE!
11
1.6
110.
7 #V
ALU
E!
#VAL
UE!
#V
ALU
E!
114.
3 #V
ALU
E!
#VAL
UE!
#V
ALU
E!
#VAL
UE!
#V
ALU
E!
#VAL
UE!
#V
ALU
E!
#VAL
UE!
#V
ALU
E!
#VAL
UE!
#V
ALU
E!
#VAL
UE!
#V
ALU
E!
L 'pA
,1s
#VAL
UE!
#V
ALU
E!
#VAL
UE!
98
.4
#VAL
UE!
#V
ALU
E!
#VAL
UE!
#V
ALU
E!
97.2
92
.9
93.2
#V
ALU
E!
90.7
#V
ALU
E!
94.8
96
.0
#VAL
UE!
#V
ALU
E!
#VAL
UE!
90
.0
93.6
#V
ALU
E!
#VAL
UE!
#V
ALU
E!
94.4
91
.7
94.3
93
.1
93.8
#V
ALU
E!
#VAL
UE!
96
.9
97.6
#V
ALU
E!
#VAL
UE!
#V
ALU
E!
103.
5 #V
ALU
E!
#VAL
UE!
#V
ALU
E!
#VAL
UE!
#V
ALU
E!
#VAL
UE!
#V
ALU
E!
#VAL
UE!
#V
ALU
E!
#VAL
UE!
#V
ALU
E!
#VAL
UE!
#V
ALU
E!
Tool
F F F F F F F F F F F F F F C C D D D D D D D D D E E E E E E E E B B B B B B B B B G G G G G G G G
L 'pA
,1s -
not c
orre
cted
for d
ista
nce
op#1
94.2
op
#3
op#1
93
.0
op#2
88
.6
88.9
86.5
op#5
89
.7
91.0
op
#1
86.1
op
#4
89.7
op#5
90.5
op
#1
87.2
89
.9
88.6
op
#4
89.4
op#5
92
.4
93.2
op
#1
92.6
op
#5
op#4
op#1
op#4
op#5
mea
sure
men
ts
Lab
posi
tion
5 is
th
e eq
uiva
lent
to
th
e si
te
- wi
The
back
grou
nd n
oise
leve
ls a
t th
is s
ite w
ere
high
rel
ativ
e to
the
nois
e le
vel
from
th
e to
ol.
The
valu
es
obta
ined
w
ere
corr
ecte
d fo
r ba
ckgr
ound
noi
se.
Of
50 m
easu
rem
ents
mad
e,
17 c
ould
be
corr
ecte
d fo
r ba
ckgr
ound
noi
se. T
he r
emai
ning
33
wer
e di
scar
ded.
E
vent
s sh
owin
g ‘#
NU
M!’,
‘In
valid
’ and
‘#VA
LUE
’ are
thos
e m
easu
rem
ents
that
cou
ld n
ot
be c
orre
cted
for b
ackg
roun
d no
ise.
Mea
sure
men
ts a
t thi
s si
te w
ere
mad
e at
a d
ista
nce
of 2
m fr
omth
e to
ol/o
pera
tor
due
to H
&S
res
trict
ions
at
the
site
. It
ispo
ssib
le t
o co
rrec
t fo
r th
e di
stan
ce b
y us
ing
the
labo
rato
ry
mea
sure
men
ts, m
icro
phon
e lo
catio
ns a
nd re
sults
to c
alcu
late
aco
rrect
ion
fact
or.
near
est
mea
sure
men
t. W
e kn
ow th
e va
lues
at p
os 5
. Lab
pos
ition
0 is
th
e w
orks
tatio
n an
d th
e ne
ares
t equ
ival
ent t
o th
e op
erat
ors
ear.
Of
the
5 op
erat
ions
in
the
lab
mea
sure
men
t, ca
lcul
ate
the
aver
age
leve
l at p
os 0
and
the
aver
age
leve
l at p
os 5
. - S
ubtra
ct p
os 5
from
pos
0.
- A
dd t
he r
esul
tant
val
ue t
o th
e 2m
LA
eq,T
(co
rrec
ted
for
bkg
th th
e 2m
bkg
mea
sure
men
t).
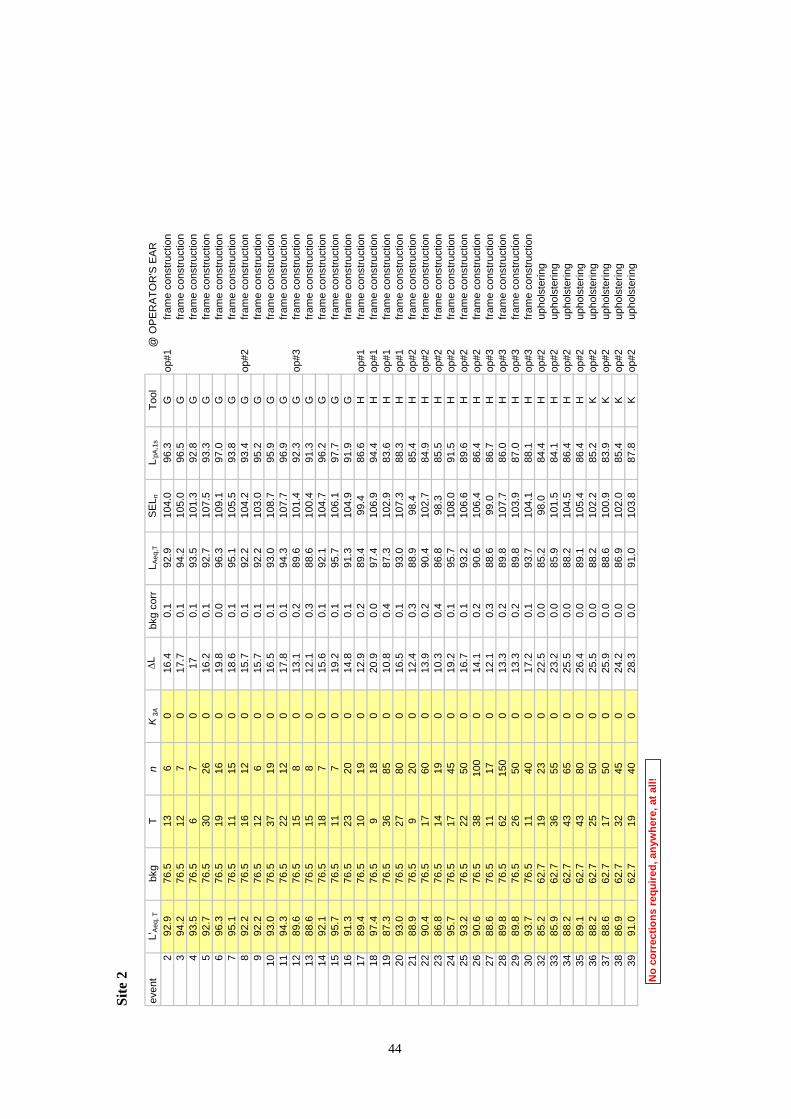
Site
2
44
even
t L'
Aeq
, T
bkg
T n
K 3A
Δ
L bk
g co
rr
L Aeq
,T
SEL n
L '
pA,1
s To
ol
2 92
.9
76.5
13
6
0 16
.4
0.1
92.9
10
4.0
96.3
G
3
94.2
76
.5
12
7 0
17.7
0.
1 94
.2
105.
0 96
.5
G
4 93
.5
76.5
6
7 0
17
0.1
93.5
10
1.3
92.8
G
5
92.7
76
.5
30
26
0 16
.2
0.1
92.7
10
7.5
93.3
G
6
96.3
76
.5
19
16
0 19
.8
0.0
96.3
10
9.1
97.0
G
7
95.1
76
.5
11
15
0 18
.6
0.1
95.1
10
5.5
93.8
G
8
92.2
76
.5
16
12
0 15
.7
0.1
92.2
10
4.2
93.4
G
9
92.2
76
.5
12
6 0
15.7
0.
1 92
.2
103.
0 95
.2
G
10
93.0
76
.5
37
19
0 16
.5
0.1
93.0
10
8.7
95.9
G
11
94
.3
76.5
22
12
0
17.8
0.
1 94
.3
107.
7 96
.9
G
12
89.6
76
.5
15
8 0
13.1
0.
2 89
.6
101.
4 92
.3
G
13
88.6
76
.5
15
8 0
12.1
0.
3 88
.6
100.
4 91
.3
G
14
92.1
76
.5
18
7 0
15.6
0.
1 92
.1
104.
7 96
.2
G
15
95.7
76
.5
11
7 0
19.2
0.
1 95
.7
106.
1 97
.7
G
16
91.3
76
.5
23
20
0 14
.8
0.1
91.3
10
4.9
91.9
G
17
89
.4
76.5
10
19
0
12.9
0.
2 89
.4
99.4
86
.6
H
18
97.4
76
.5
9 18
0
20.9
0.
0 97
.4
106.
9 94
.4
H
19
87.3
76
.5
36
85
0 10
.8
0.4
87.3
10
2.9
83.6
H
20
93
.0
76.5
27
80
0
16.5
0.
1 93
.0
107.
3 88
.3
H
21
88.9
76
.5
9 20
0
12.4
0.
3 88
.9
98.4
85
.4
H
22
90.4
76
.5
17
60
0 13
.9
0.2
90.4
10
2.7
84.9
H
23
86
.8
76.5
14
19
0
10.3
0.
4 86
.8
98.3
85
.5
H
24
95.7
76
.5
17
45
0 19
.2
0.1
95.7
10
8.0
91.5
H
25
93
.2
76.5
22
50
0
16.7
0.
1 93
.2
106.
6 89
.6
H
26
90.6
76
.5
38
100
0 14
.1
0.2
90.6
10
6.4
86.4
H
27
88
.6
76.5
11
17
0
12.1
0.
3 88
.6
99.0
86
.7
H
28
89.8
76
.5
62
150
0 13
.3
0.2
89.8
10
7.7
86.0
H
29
89
.8
76.5
26
50
0
13.3
0.
2 89
.8
103.
9 87
.0
H
30
93.7
76
.5
11
40
0 17
.2
0.1
93.7
10
4.1
88.1
H
32
85
.2
62.7
19
23
0
22.5
0.
0 85
.2
98.0
84
.4
H
33
85.9
62
.7
36
55
0 23
.2
0.0
85.9
10
1.5
84.1
H
34
88
.2
62.7
43
65
0
25.5
0.
0 88
.2
104.
5 86
.4
H
35
89.1
62
.7
43
80
0 26
.4
0.0
89.1
10
5.4
86.4
H
36
88
.2
62.7
25
50
0
25.5
0.
0 88
.2
102.
2 85
.2
K 37
88
.6
62.7
17
50
0
25.9
0.
0 88
.6
100.
9 83
.9
K 38
86
.9
62.7
32
45
0
24.2
0.
0 86
.9
102.
0 85
.4
K 39
91
.0
62.7
19
40
0
28.3
0.
0 91
.0
103.
8 87
.8
K
op#1
op#2
op#3
op#1
op#1
op#1
op#1
op#2
op#2
op#2
op#2
op#2
op#2
op#3
op#3
op#3
op#3
op#2
op#2
op#2
op#2
op#2
op#2
op#2
op#2
@ O
PER
ATO
R'S
EA
R
fram
e co
nstru
ctio
n fra
me
cons
truct
ion
fram
e co
nstru
ctio
n fra
me
cons
truct
ion
fram
e co
nstru
ctio
n fra
me
cons
truct
ion
fram
e co
nstru
ctio
n fra
me
cons
truct
ion
fram
e co
nstru
ctio
n fra
me
cons
truct
ion
fram
e co
nstru
ctio
n fra
me
cons
truct
ion
fram
e co
nstru
ctio
n fra
me
cons
truct
ion
fram
e co
nstru
ctio
n fra
me
cons
truct
ion
fram
e co
nstru
ctio
n fra
me
cons
truct
ion
fram
e co
nstru
ctio
n fra
me
cons
truct
ion
fram
e co
nstru
ctio
n fra
me
cons
truct
ion
fram
e co
nstru
ctio
n fra
me
cons
truct
ion
fram
e co
nstru
ctio
n fra
me
cons
truct
ion
fram
e co
nstru
ctio
n fra
me
cons
truct
ion
fram
e co
nstru
ctio
n up
hols
terin
g up
hols
terin
g up
hols
terin
g up
hols
terin
g up
hols
terin
g up
hols
terin
g up
hols
terin
g up
hols
terin
g
No
corr
ectio
ns re
quire
d, a
nyw
here
, at a
ll!
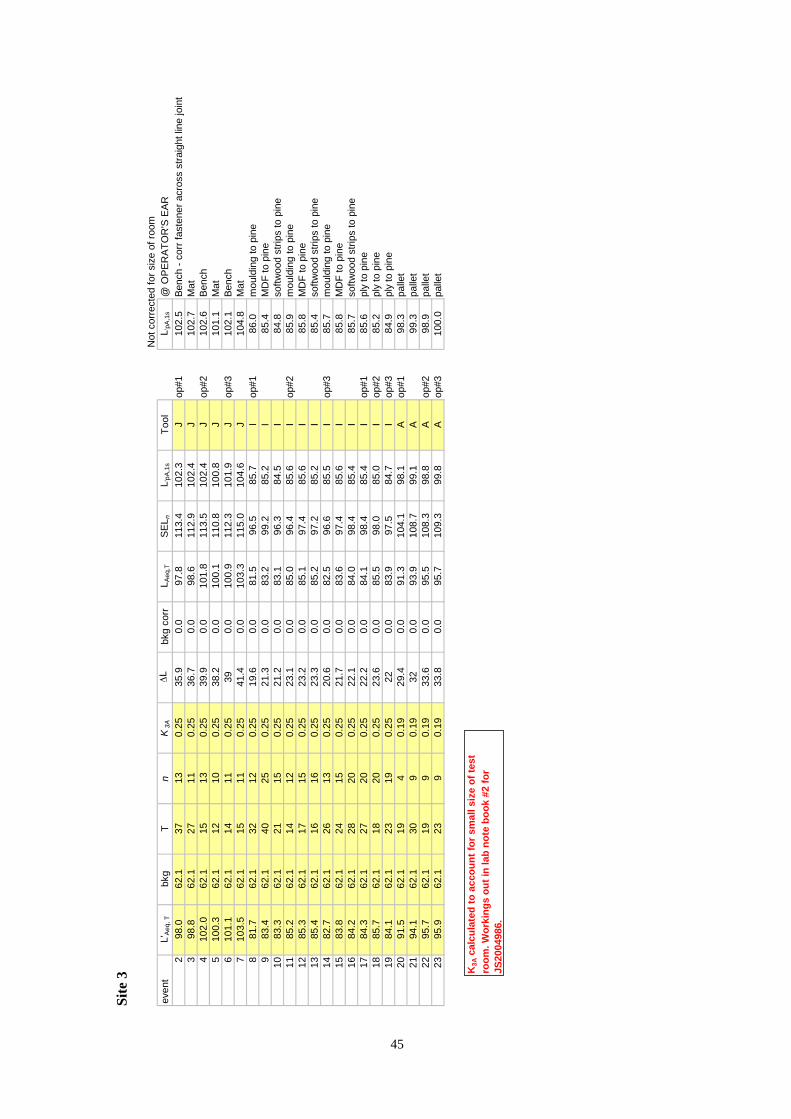
Site
3
Not
cor
rect
ed fo
r siz
e of
room
45
even
t L'
Aeq
, T
bkg
T n
K 3A
ΔL
bk
g co
rr
L Aeq
,T
SEL
n L '
pA,1
s To
ol
2 98
.0
62.1
37
13
0.
25
35.9
0.
0 97
.8
113.
4 10
2.3
J 3
98.8
62
.1
27
11
0.25
36
.7
0.0
98.6
11
2.9
102.
4 J
4 10
2.0
62.1
15
13
0.
25
39.9
0.
0 10
1.8
113.
5 10
2.4
J 5
100.
3 62
.1
12
10
0.25
38
.2
0.0
100.
1 11
0.8
100.
8 J
6 10
1.1
62.1
14
11
0.
25
39
0.0
100.
9 11
2.3
101.
9 J
7 10
3.5
62.1
15
11
0.
25
41.4
0.
0 10
3.3
115.
0 10
4.6
J 8
81.7
62
.1
32
12
0.25
19
.6
0.0
81.5
96
.5
85.7
I
9 83
.4
62.1
40
25
0.
25
21.3
0.
0 83
.2
99.2
85
.2
I 10
83
.3
62.1
21
15
0.
25
21.2
0.
0 83
.1
96.3
84
.5
I 11
85
.2
62.1
14
12
0.
25
23.1
0.
0 85
.0
96.4
85
.6
I 12
85
.3
62.1
17
15
0.
25
23.2
0.
0 85
.1
97.4
85
.6
I 13
85
.4
62.1
16
16
0.
25
23.3
0.
0 85
.2
97.2
85
.2
I 14
82
.7
62.1
26
13
0.
25
20.6
0.
0 82
.5
96.6
85
.5
I 15
83
.8
62.1
24
15
0.
25
21.7
0.
0 83
.6
97.4
85
.6
I 16
84
.2
62.1
28
20
0.
25
22.1
0.
0 84
.0
98.4
85
.4
I 17
84
.3
62.1
27
20
0.
25
22.2
0.
0 84
.1
98.4
85
.4
I 18
85
.7
62.1
18
20
0.
25
23.6
0.
0 85
.5
98.0
85
.0
I 19
84
.1
62.1
23
19
0.
25
22
0.0
83.9
97
.5
84.7
I
20
91.5
62
.1
19
4 0.
19
29.4
0.
0 91
.3
104.
1 98
.1
A 21
94
.1
62.1
30
9
0.19
32
0.
0 93
.9
108.
7 99
.1
A 22
95
.7
62.1
19
9
0.19
33
.6
0.0
95.5
10
8.3
98.8
A
23
95.9
62
.1
23
9 0.
19
33.8
0.
0 95
.7
109.
3 99
.8
A
op#1
op#2
op#3
op#1
op#2
op#3
op#1
op#2
op#3
op#1
op#2
op#3
L 'pA
,1s
102.
5 10
2.7
102.
6 10
1.1
102.
1 10
4.8
86.0
85
.4
84.8
85
.9
85.8
85
.4
85.7
85
.8
85.7
85
.6
85.2
84
.9
98.3
99
.3
98.9
10
0.0
@ O
PER
ATO
R'S
EA
R
Benc
h - c
orr f
aste
ner a
cros
s st
raig
ht li
ne jo
int
Mat
Be
nch
Mat
Be
nch
Mat
m
ould
ing
to p
ine
MD
F to
pin
e so
ftwoo
d st
rips
to p
ine
mou
ldin
g to
pin
eM
DF
to p
ine
softw
ood
strip
s to
pin
e m
ould
ing
to p
ine
MD
F to
pin
e so
ftwoo
d st
rips
to p
ine
ply
to p
ine
ply
to p
ine
ply
to p
ine
palle
tpa
llet
palle
tpa
llet
K 3A
cal
cula
ted
to a
ccou
nt fo
r sm
all s
ize
of te
st
room
. Wor
king
s ou
t in
lab
note
boo
k #2
for
JS20
0498
6.
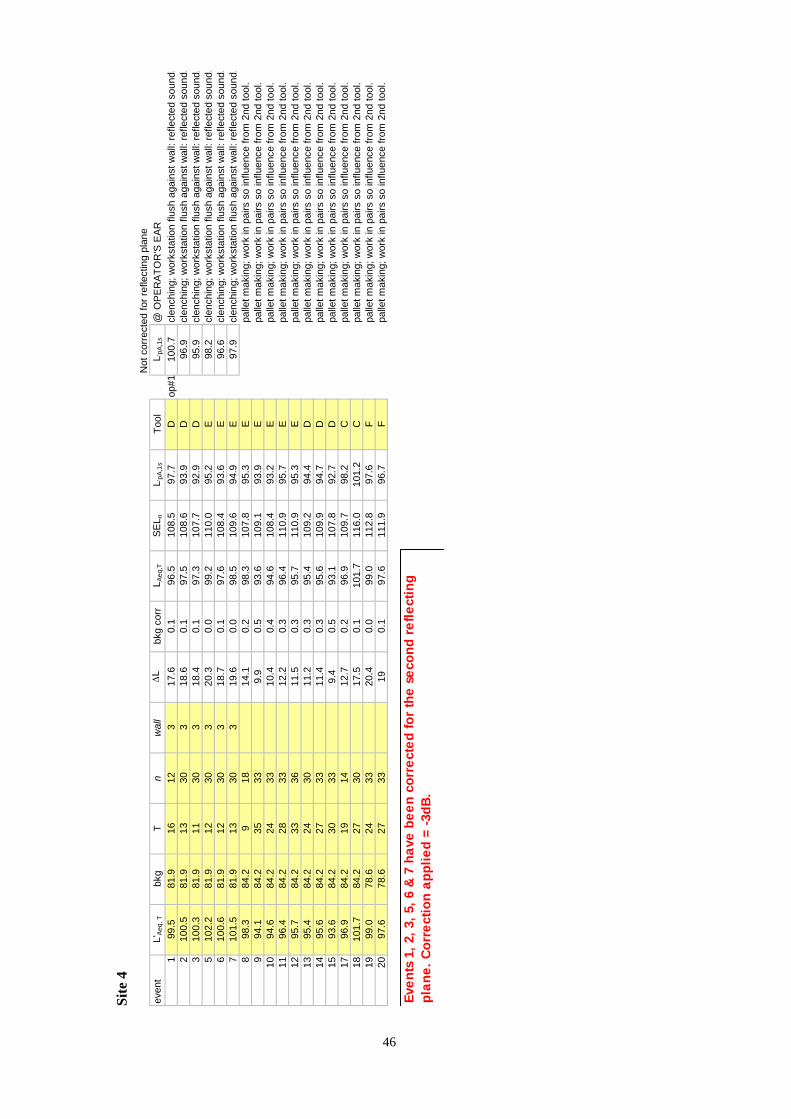
Site
4
even
t L'
Aeq
, T
bkg
T n
wal
l ΔL
bk
g co
rr
L Aeq
,T
SEL n
L '
pA,1
s To
ol
1 99
.5
81.9
16
12
3
17.6
0.
1 96
.5
108.
5 97
.7
D
2 10
0.5
81.9
13
30
3
18.6
0.
1 97
.5
108.
6 93
.9
D
3 10
0.3
81.9
11
30
3
18.4
0.
1 97
.3
107.
7 92
.9
D
5 10
2.2
81.9
12
30
3
20.3
0.
0 99
.2
110.
0 95
.2
E 6
100.
6 81
.9
12
30
3 18
.7
0.1
97.6
10
8.4
93.6
E
7 10
1.5
81.9
13
30
3
19.6
0.
0 98
.5
109.
6 94
.9
E 8
98.3
84
.2
9 18
14
.1
0.2
98.3
10
7.8
95.3
E
9 94
.1
84.2
35
33
9.
9 0.
5 93
.6
109.
1 93
.9
E 10
94
.6
84.2
24
33
10
.4
0.4
94.6
10
8.4
93.2
E
11
96.4
84
.2
28
33
12.2
0.
3 96
.4
110.
9 95
.7
E 12
95
.7
84.2
33
36
11
.5
0.3
95.7
11
0.9
95.3
E
13
95.4
84
.2
24
30
11.2
0.
3 95
.4
109.
2 94
.4
D
14
95.6
84
.2
27
33
11.4
0.
3 95
.6
109.
9 94
.7
D
15
93.6
84
.2
30
33
9.4
0.5
93.1
10
7.8
92.7
D
17
96
.9
84.2
19
14
12
.7
0.2
96.9
10
9.7
98.2
C
18
10
1.7
84.2
27
30
17
.5
0.1
101.
7 11
6.0
101.
2 C
19
99
.0
78.6
24
33
20
.4
0.0
99.0
11
2.8
97.6
F
20
97.6
78
.6
27
33
19
0.1
97.6
11
1.9
96.7
F
Not
cor
rect
ed fo
r ref
lect
ing
plan
e @
OPE
RA
TOR
'S E
AR
op
#1
100.
7 L '
pA,1
s
clen
chin
g; w
orks
tatio
n flu
sh a
gain
st w
all:
refle
cted
sou
nd.
96.9
cl
ench
ing;
wor
ksta
tion
flush
aga
inst
wal
l: re
flect
ed s
ound
. 95
.9
clen
chin
g; w
orks
tatio
n flu
sh a
gain
st w
all:
refle
cted
sou
nd.
98.2
cl
ench
ing;
wor
ksta
tion
flush
aga
inst
wal
l: re
flect
ed s
ound
. 96
.6
clen
chin
g; w
orks
tatio
n flu
sh a
gain
st w
all:
refle
cted
sou
nd.
97.9
cl
ench
ing;
wor
ksta
tion
flush
aga
inst
wal
l: re
flect
ed s
ound
. pa
llet m
akin
g; w
ork
in p
airs
so
influ
ence
from
2nd
tool
. pa
llet m
akin
g; w
ork
in p
airs
so
influ
ence
from
2nd
tool
. pa
llet m
akin
g; w
ork
in p
airs
so
influ
ence
from
2nd
tool
. pa
llet m
akin
g; w
ork
in p
airs
so
influ
ence
from
2nd
tool
. pa
llet m
akin
g; w
ork
in p
airs
so
influ
ence
from
2nd
tool
. pa
llet m
akin
g; w
ork
in p
airs
so
influ
ence
from
2nd
tool
. pa
llet m
akin
g; w
ork
in p
airs
so
influ
ence
from
2nd
tool
. pa
llet m
akin
g; w
ork
in p
airs
so
influ
ence
from
2nd
tool
. pa
llet m
akin
g; w
ork
in p
airs
so
influ
ence
from
2nd
tool
. pa
llet m
akin
g; w
ork
in p
airs
so
influ
ence
from
2nd
tool
. pa
llet m
akin
g; w
ork
in p
airs
so
influ
ence
from
2nd
tool
. pa
llet m
akin
g; w
ork
in p
airs
so
influ
ence
from
2nd
tool
.
Even
ts 1
, 2, 3
, 5, 6
& 7
hav
e be
en c
orre
cted
for
the
seco
nd r
efle
ctin
g pl
ane.
Cor
rect
ion
appl
ied
= -3
dB.
46

12 REFERENCES
[1] Control of Noise at Work Regulations 2005 Statutory Instrument 2005 No. 1643
[2] EU Physical Agents (Noise) Directive (2003/10/EC)
[3] The Supply of Machinery (Safety) Regulations 1992 (as amended) Statutory Instrument 1992 No. 3073
[4] BS EN 792-13:2000 Hand-held non-electric power tools. Safety requirements. Fastener driving tools.
[5] BS EN 12549:1999 Acoustics. Noise test code for fastener driving tools. Engineering method.
[6] BS EN ISO 3744:1995 Acoustics. Determination of sound power levels of noise sources using sound pressure. Engineering method in an essentially free field over a reflecting plane.
[7] BS EN ISO 11201:1996 Acoustics. Noise emitted by machinery and equipment. Measurement of emission sound pressure levels at a work station and at other specified positions. Engineering method in an essentially free field over a reflecting plane.
[8] BS EN ISO 4871:1997 Acoustics. Declaration and verification of noise emission values of machinery and equipment
[9] DIN 45 635 Teil 66 Mai 1992 Geräuschmessung an Maschinen. Luftschallemission, Hüllflächen-Verfahren Tragbare Eintreibgeräte (Measurement of airborne noise emitted by machines; enveloping surface method; fastener driving tools)
[10] BS EN 50144-2-16:2003 Safety of hand-held electric motor operated tools. Particular requirements for tackers.
[11] BS EN ISO 11202:1996 Acoustics. Noise emitted by machinery and equipment. Measurement of emission sound pressure levels at a work station and at other specified positions. Survey method in situ.
[12] NV/06/24 Correlation between vibration emission and vibration during real use: Fastener driving tools
47

Published by the Health and Safety Executive 04/08

Executive Health and Safety
Noise emission from fastener driving tools
The Supply of Machinery (Safety) Regulations 1992 as amended place duties on machine manufacturers and suppliers to design and construct machinery in such a way that noise emissions are reduced to the lowest level taking account of technical progress and the availability of techniques for reducing noise, particularly at source. There is also a requirement that manufacturers and suppliers provide information on the airborne noise emissions of their products. The Control of Noise at Work Regulations 2005, which came into force in April 2006 implementing the EU Physical Agents (Noise) Directive (2003/10/EC), state that employers may use manufacturers’ tool data to assess the risk to their employees from exposure to noise.
The aims of the work reported here were to:
n Measure the noise emission of the tools supplied by the manufacturers and compare to the manufacturers’ declared emission, if stated.
n Determine whether tools with a declared noise emission have been tested in accordance with the most appropriate test code.
n Comment on the suitability of the noise test methods for the family of tools under test.
n Investigate the link between the manufacturers’ declared emission and the in real use emission.
This project was carried out in conjunction with HSL project JR45.086, an investigation into the correlation between vibration emission and vibration during real use on fastener driving tools as reported in RR591.
This report and the work it describes were funded by the Health and Safety Executive (HSE). Its contents, including any opinions and/or conclusions expressed, are those of the author alone and do not necessarily reflect HSE policy.
RR625
www.hse.gov.uk