RPG-MWSC-160 Microwave Scintillometer - radiometer … · The RPG-MWSC-160 is designed to provide...
86
RPG-MWSC-160 Radiometer Physics GmbH Birkenmaarstr. 10 53340 Meckenheim, Germany 1 +49 (0) 2225 99981 – 0 www.radiometer-physics.de [email protected] All data and specifications are subject to change without notice! © Radiometer Physics GmbH 2014 Installation, Operation & Software Guide RPG-MWSC-160 Microwave Scintillometer Version 1.03
Transcript of RPG-MWSC-160 Microwave Scintillometer - radiometer … · The RPG-MWSC-160 is designed to provide...

RPG-MWSC-160 Radiometer Physics GmbH Birkenmaarstr. 10 53340 Meckenheim, Germany
1 +49 (0) 2225 99981 – 0
www.radiometer-physics.de [email protected]
All data and specifications are subject to change without notice! © Radiometer Physics GmbH 2014
Installation, Operation & Software Guide
RPG-MWSC-160 Microwave Scintillometer
Version 1.03

RPG-MWSC-160 Radiometer Physics GmbH Birkenmaarstr. 10 53340 Meckenheim, Germany
2 +49 (0) 2225 99981 – 0
www.radiometer-physics.de [email protected]
All data and specifications are subject to change without notice! © Radiometer Physics GmbH 2014
Installation, Operation & Software Guide
Document Change Log
Date Issue/Rev Change 17.03.2014 00/01 Work 03.07.2014 00/02 Work (Technical Description and Installation added) 23.07.2014 01/00 Release 12.01.2015 01/01 Update: installation chapter, saturation correction
20.05.2015 01/02 Update: sections: 2.1, 2.2 (back plane), 4.3 (coordinates), 3.3.4 (power level display), 5.4.1 (text log variances)
16.01.2015 01/03 Update section 3.3.4 (display+alignment)

RPG-MWSC-160 Radiometer Physics GmbH Birkenmaarstr. 10 53340 Meckenheim, Germany
3 +49 (0) 2225 99981 – 0
www.radiometer-physics.de [email protected]
All data and specifications are subject to change without notice! © Radiometer Physics GmbH 2014
Installation, Operation & Software Guide
Table of Contents
RPG-MWSC-160 ................................................................................................................. 1 Microwave Scintillometer ..................................................................................................... 1 Document Change Log ........................................................................................................ 2 1. Scope of this Document ................................................................................................... 5 2. Technical Description ....................................................................................................... 5
2.1 RPG-MWSC-160 Receiver ..................................................................... 7 2.2 RPG-MWSC-160 Transmitter ................................................................. 9 2.3 RPG-MWSC-160 Accessories .............................................................. 10
3. Installation…...……..…. .................................................................................................. 13 3.1 Unpacking RPG-MWSC-160 ................................................................ 13 3.2 Assembling the RPG-MWSC-160 Units ................................................ 15 3.2.1 Mounting GPS Clock and Weather Station ........................................... 15 3.2.2 Grounding of the instruments ............................................................... 17 3.3 Setting up the Combined OMS System ................................................ 18 3.3.1 Mounting the Alignment Units ............................................................... 19 3.3.2 Mounting on Towers ............................................................................. 21 3.3.3 Cable Connections and Power up ........................................................ 23 3.3.4 Alignment of the RPG-MWSC-160 units ............................................... 25
4. Software Description ...................................................................................................... 27 4.1 Installation of Host Software ................................................................. 27 4.1.1 Hardware Requirements for Host PC ................................................... 27 4.1.2 Directory Tree ...................................................................................... 28 4.2 Getting Started ..................................................................................... 31 4.2.1 Interfacing via Ethernet ........................................................................ 32 4.3 Define Measurement Setups ................................................................ 38 4.4 Data Storage Host Configuration .......................................................... 43 4.5 Exchanging Data Files ......................................................................... 44 4.6 Starting Measurements ........................................................................ 45 4.7 The Data Processing Chain .................................................................. 47 4.8 Data Post Processing ........................................................................... 50 4.9 Inspecting Data Files ............................................................................ 51 4.10 Transform Data Files to ASCII Format .................................................. 53 4.11 File Concatenation ............................................................................... 54 4.12 The License Manager ........................................................................... 55 4.13 Software Updates ................................................................................. 56 4.14 Automatic E-Mail Warning Messages ................................................... 57 4.15 Changing the Application Size on the Screen ....................................... 59 4.16 Shutting Down the Scintillometer PC .................................................... 59

RPG-MWSC-160 Radiometer Physics GmbH Birkenmaarstr. 10 53340 Meckenheim, Germany
4 +49 (0) 2225 99981 – 0
www.radiometer-physics.de [email protected]
All data and specifications are subject to change without notice! © Radiometer Physics GmbH 2014
Installation, Operation & Software Guide
5. Scientific Background ..................................................................................................... 60
5.1 Turbulent Fluxes in the Surface Layer .................................................. 60 5.2 The Scintillation Signal ......................................................................... 62 5.3 Sensible and Latent Heat Fluxes from Scintillometry ............................ 64 5.4 The Data Processing Chain .................................................................. 65 5.4.1 From Signal Variances to Structure Parameters ................................... 66 5.4.2 Structure Parameters of Temperature and Humidity ............................. 70 5.4.3 MOST– from Structure Parameters to Heat Fluxes .............................. 71 5.4.4 Signal Saturation .................................................................................. 74 5.4.5 Absorption Fluctuations ........................................................................ 75 5.4.6 Effective Height .................................................................................... 75 5.4.7 Roughness Length and Zero-Displacement Height .............................. 76 5.4.8 References ........................................................................................... 78
Appendix A (File Formats) ................................................................................................. 80 A1: Heat Flux Files (*.FLX) ......................................................................... 80 A2: Variance-Files (*.VAR) ......................................................................... 81 A3: Raw Data Files (*.RAW) ....................................................................... 83 A4: Housekeeping Data Files (*.HKD) ........................................................ 84
Appendix B (Instrument Dimensions) ................................................................................. 86

RPG-MWSC-160 Radiometer Physics GmbH Birkenmaarstr. 10 53340 Meckenheim, Germany
5 +49 (0) 2225 99981 – 0
www.radiometer-physics.de [email protected]
All data and specifications are subject to change without notice! © Radiometer Physics GmbH 2014
Installation, Operation & Software Guide
1. Scope of this Document This document contains information about: • Description of scientific background of scintillometry and deduction of the equations
used in the instrument software to calculate sensible heat and latent heat fluxes • Technical description of the RPG-MWSC-160 with details about its principle of
operation • Complete software description with details on data formats (binary) • Installation and maintenance of the RPG-MWSC-160 and optical LAS systems that
are operated in combination with the microwave system
2. Technical Description The MicroWave Scintillometer (MWS) RPG-MWSC-160 consists of a receiver and transmitter. It is combined with a Large Aperture Scintillometer (LAS) observing in the near infrared spectral region. Any commercially available LAS can be used. The combined system includes two transmitters and two receivers and is henceforth called OMS (Optical/Microwave Scintillometer). This chapter describes the MWS units only. For technical information on the LAS system please refer to the manufacturer’s manual. Parameter Specification Frequency 160.8 GHz (λ=1.86 mm)
Radiated power maximum power: >25 mW, 50 dB attenuator
Antenna type Cassegrain with 300 mm aperture
Antenna gain 52 dB
Beam width 0.45° FWHM
Detection bandwidth 10 kHz
Gain stability > 2.0 × 10⁻⁵
Temperature stability < 0.03 K (two-stage control)
Power supply 12 V DC
Power consumption max.50 W (per unit), 20 W typical (receiver), 15 W typical (transmitter)
Output data
Level 0 • 1 kHz digital raw data for RPG-MWSC-160 and LAS • housekeeping data.
Level 1 • (co)variances of the combined OMS system.
Level 2 • structure parameters 𝐶𝑛² • sensible and latent heat fluxes 𝐻, 𝐿𝑉𝐸 (with weather station)
Type of installation Line of sight Tx/Rx system (transmit/receive)
Baseline length 500 m to 10 km

RPG-MWSC-160 Radiometer Physics GmbH Birkenmaarstr. 10 53340 Meckenheim, Germany
6 +49 (0) 2225 99981 – 0
www.radiometer-physics.de [email protected]
All data and specifications are subject to change without notice! © Radiometer Physics GmbH 2014
Installation, Operation & Software Guide
The RPG-MWSC-160 transmitter signal originates from an RF source at 13.4 GHz. The signal is multiplied to 160.8 GHz and fed to a horn antenna. Cassegrain optics with a 300 mm main reflector form a beam with a Half Power Beam Width (HPBW) of 0.42°. After travelling through the atmosphere over a path length of up to 10 km, the signal reaches the antenna of the receiver unit. Behind the feed horn the received signal enters a sub-harmonic mixer. Here, the signal is mixed with a Local Oscillator (LO) signal that is multiplied to 79.8 GHz. The resulting Intermediate Frequency (IF) of 1200 MHz is then boosted by +20dB before it enters the detector diode (Figure 1). The signal is synchronously digitized with the analogue LAS signal and fed to the Scintillometer-PC (SP-C). The S-PC offers an Ethernet interface to set up a connection with an external Host-PC (H-PC). The H-PC is used to operate the combined OMS system:
• Measurement, setup and configuration.
• Complete data processing from digitized raw data to sensible and latent heat fluxes.
• Archiving of all data formats (see Appendix).
Once a measurement has been initialized via the H-PC, the scintillometer can be disconnected and work autonomously. Additionally, Level 1 data (signal variances, housekeeping data) and Level 2 data (e.g. heat fluxes) can be stored on the S-PC. These data can be downloaded to the H-PC at a later stage (section 4.5) to reprocess all available data products (section 4.8). Due to the large data volume, raw data can only be stored on the H-PC.
Figure 1: Technical scheme of the RPG-MWSC-160.

RPG-MWSC-160 Radiometer Physics GmbH Birkenmaarstr. 10 53340 Meckenheim, Germany
7 +49 (0) 2225 99981 – 0
www.radiometer-physics.de [email protected]
All data and specifications are subject to change without notice! © Radiometer Physics GmbH 2014
Installation, Operation & Software Guide
2.1 RPG-MWSC-160 Receiver Figure 2 gives an overview on the receiver’s connectors and components attached to the housing.
Figure 2: Rear view of the RPG-MWSC-160 receiver. The RPG-MWSC-160 is designed to provide the power supply for the connected LAS system. The 12 V DC In socket is either connected to an appropriate 12 V DC source or to the optional AC power supply that is mounted to the receiver rear plate. The “LAS RX” socket is used for 12 V DC supply the LAS devices and provides the analogue demodulated voltage(s) from the LAS receiver. Digital data out connects the internal S-PC to the external H-PC. Three LEDs on the backside of the receiver unit inform about the status of the combined system (Figure 3):
● CPU alert … if blinking, the S-PC is not running. ● optical alert … if on, the signal level from optical scintillometer is too low. ● microwave alert … if on, the signal level from microwave scintillometer is too low.
Fuse
Microwave signal level display
Alert LEDs
Digital data out
12 V DC Out and LAS input
12 V DC In
External ports
BNC connector for microwave signal level

RPG-MWSC-160 Radiometer Physics GmbH Birkenmaarstr. 10 53340 Meckenheim, Germany
8 +49 (0) 2225 99981 – 0
www.radiometer-physics.de [email protected]
All data and specifications are subject to change without notice! © Radiometer Physics GmbH 2014
Installation, Operation & Software Guide
The Microwave signal level can be directly measured on a BNC service connector. This connector should only be used in combination with a floating potential device like a battery powered digital volt meter. Otherwise ground loop problems may occur which deteriorate the microwave signal. The S-PC can be accessed via external ports for monitor, mouse and keyboard. The ports are protected by a removable black plastic cap (Figure 4). A GPS clock for positioning and timing and the optional weather station for flux calculations are mounted to the receiver housing,
Figure 3: Signal level and status alerts for the combined system.
Figure 4: Use an Allan key to remove protection cap for external ports.
USB ports for keyboard and mouse
VGA interface for monitor
Sub-D service connector Reset Scintillometer-PC
Protection cap

RPG-MWSC-160 Radiometer Physics GmbH Birkenmaarstr. 10 53340 Meckenheim, Germany
9 +49 (0) 2225 99981 – 0
www.radiometer-physics.de [email protected]
All data and specifications are subject to change without notice! © Radiometer Physics GmbH 2014
Installation, Operation & Software Guide
2.2 RPG-MWSC-160 Transmitter Figure 5 gives an overview on the layout of the transmitter housing.
Figure 5: Rear view of the RPG-MWSC-160 transmitter.
The maximum power level of the transmitter signal of about 25 mW can be manually reduced using a turning knob at the backside of the transmitter unit. The turning knob is protected by a plastic cap. The power level display gives a value between 0 and 2000 as a proxy for the output power. Apart from the receiver and the transmitter, two alignment units are part of the RPG-MWSC-160 base package. These units are necessary for an accurate alignment of the receiver and the transmitter along the measurement path. The units allow to adjust the instruments’ pointing along two axes: ±10°in elevation and 0°-360° in azimuth direction (Figure 6).
Figure 6: Top and bottom view of the alignment units for RPG-MWSC-160.
Fuse
12V DC Out
12V DC In
Power level adjust
Top Bottom
Power level display

RPG-MWSC-160 Radiometer Physics GmbH Birkenmaarstr. 10 53340 Meckenheim, Germany
10 +49 (0) 2225 99981 – 0
www.radiometer-physics.de [email protected]
All data and specifications are subject to change without notice! © Radiometer Physics GmbH 2014
Installation, Operation & Software Guide
2.3 RPG-MWSC-160 Accessories Apart from the two base units of the RPG-MWSC-160, different optional accessories are available. If the complete OMS system shall be mounted on tripods, different tripod heights with maximum heights between 3 m and 5 m are available (Figure 7). Increasing path lengths need increasing observation height (Figure 20). When using the optional double base plate MWS and LAS transmitters/receivers can be mounted on a single tripod (Figure 8, Figure 9).
Figure 7: Tripods with different maximum heights are available (e.g. 3 m).
Figure 8: Double base plate for combined mounting of MWS and LAS units.
3.0 m

RPG-MWSC-160 Radiometer Physics GmbH Birkenmaarstr. 10 53340 Meckenheim, Germany
11 +49 (0) 2225 99981 – 0
www.radiometer-physics.de [email protected]
All data and specifications are subject to change without notice! © Radiometer Physics GmbH 2014
Installation, Operation & Software Guide
Figure 9: Mounting options for the combined OMS system. For the pre-alignment of the MWS units alignment telescopes are available (Figure 10).
Figure 10: Alignment telescopes for the RPG-MWSC-160. For the optional AC supply two power supplies – mounted to backside of each unit – and 50 m power cables are available (Figure 11). The AC supplies power both the MWS and LAS receiver/transmitter. The only exception is transmitter of BLS2000 from Scintec. This unit must be supplied separately, because its power consumption is too large.

RPG-MWSC-160 Radiometer Physics GmbH Birkenmaarstr. 10 53340 Meckenheim, Germany
12 +49 (0) 2225 99981 – 0
www.radiometer-physics.de [email protected]
All data and specifications are subject to change without notice! © Radiometer Physics GmbH 2014
Installation, Operation & Software Guide
Figure 11: Left: AC power supply mounted to RPG-MWSC-160 transmitter, Right: 50 m power cable. The external weather station Vaisala WXT-520 (Figure 12) is needed for online calculation of the sensible and latent heat fluxes. The station is mounted to a pole attached to the receiver housing. Temperature, relative humidity, pressure, wind direction and speed (2D sonic) are automatically read by the operating software and used within the data processing chain.
Figure 12: Weather station Vaisala WXT-520.

RPG-MWSC-160 Radiometer Physics GmbH Birkenmaarstr. 10 53340 Meckenheim, Germany
13 +49 (0) 2225 99981 – 0
www.radiometer-physics.de [email protected]
All data and specifications are subject to change without notice! © Radiometer Physics GmbH 2014
Installation, Operation & Software Guide
3. Installation This chapter covers the complete installation and setup of the OMS system.
3.1 Unpacking RPG-MWSC-160
The RPG-MWS-160 transmit/receive system is shipped in a single flight case with the dimensions given in Table 1.
Content Length [mm]
Width [mm]
Height [mm]
Total weight [kg]
• MWS transmitter • MWS receiver • Rain shields • Alignment units • Power cables • Data cables • Tool set • Weather station • Alignment telescopes • Double base plate
950 760 650 ~80
Table 1: RPG-MWSC-160 packing list. Optional components in gray.
Figure 13: Unpacking the RPG-MWSC-160.

RPG-MWSC-160 Radiometer Physics GmbH Birkenmaarstr. 10 53340 Meckenheim, Germany
14 +49 (0) 2225 99981 – 0
www.radiometer-physics.de [email protected]
All data and specifications are subject to change without notice! © Radiometer Physics GmbH 2014
Installation, Operation & Software Guide
The standard cable set consists of:
● Power/data cables for connecting LAS units with RPG-MWSC-160. ● 10 m power cable for 12 VDC supply. ● A fibre-optics-to-Ethernet-converter (including short network cable). ● 50 m fibre optics data cable for connecting RPG-MWSC-160 receiver to H-PC. ● Grounding kit to protect the scintillometer units and the weather station.
Figure 14: A: AC power cable (50 m), B: Connecting cables between MWSC and LAS units for data (only receiver) and power (these cable may differ for different LAS systems), C: Data cable (50 m), D: Grounding kit (only shown for receiver).
A B
C D

RPG-MWSC-160 Radiometer Physics GmbH Birkenmaarstr. 10 53340 Meckenheim, Germany
15 +49 (0) 2225 99981 – 0
www.radiometer-physics.de [email protected]
All data and specifications are subject to change without notice! © Radiometer Physics GmbH 2014
Installation, Operation & Software Guide
Figure 15: Different views of RPG-MWSC-160 units.
3.2 Assembling the RPG-MWSC-160 Units The RPG-MWSC-160 units are delivered with rain shields are already mounted to the instrument housing. The receiver’s GPS clock is already installed as well (Figure 16). However, in case it is required by the specific measurement setup, the user can mount the GPS and the weather station (Figure 17) on the other side of the housing.
3.2.1 Mounting GPS Clock and Weather Station
Figure 16: Mounting the GPS clock to the RPG-MWSC-160 receiver. The mounting plate can either be attached to the left or right side of the receiver box.

RPG-MWSC-160 Radiometer Physics GmbH Birkenmaarstr. 10 53340 Meckenheim, Germany
16 +49 (0) 2225 99981 – 0
www.radiometer-physics.de [email protected]
All data and specifications are subject to change without notice! © Radiometer Physics GmbH 2014
Installation, Operation & Software Guide
Figure 17: Mounting the weather station Vaisala WXT-520. A: Fix the station on top of the pole. The “North” arrow has to be aligned with the instrument’s side wall. B: Station, mounting pole and connecting cable. C: Use Allan key to mount the pole to the RPG-MWSC-160 receiver. D: Take care that the pole ends well above the receiver’s bottom plate level.
Figure 18: Connecting GPS clock and weather station.
RPG-MWSC-160 Radiometer Physics GmbH Birkenmaarstr. 10 53340 Meckenheim, Germany
17 +49 (0) 2225 99981 – 0
www.radiometer-physics.de [email protected]
All data and specifications are subject to change without notice! © Radiometer Physics GmbH 2014
Installation, Operation & Software Guide
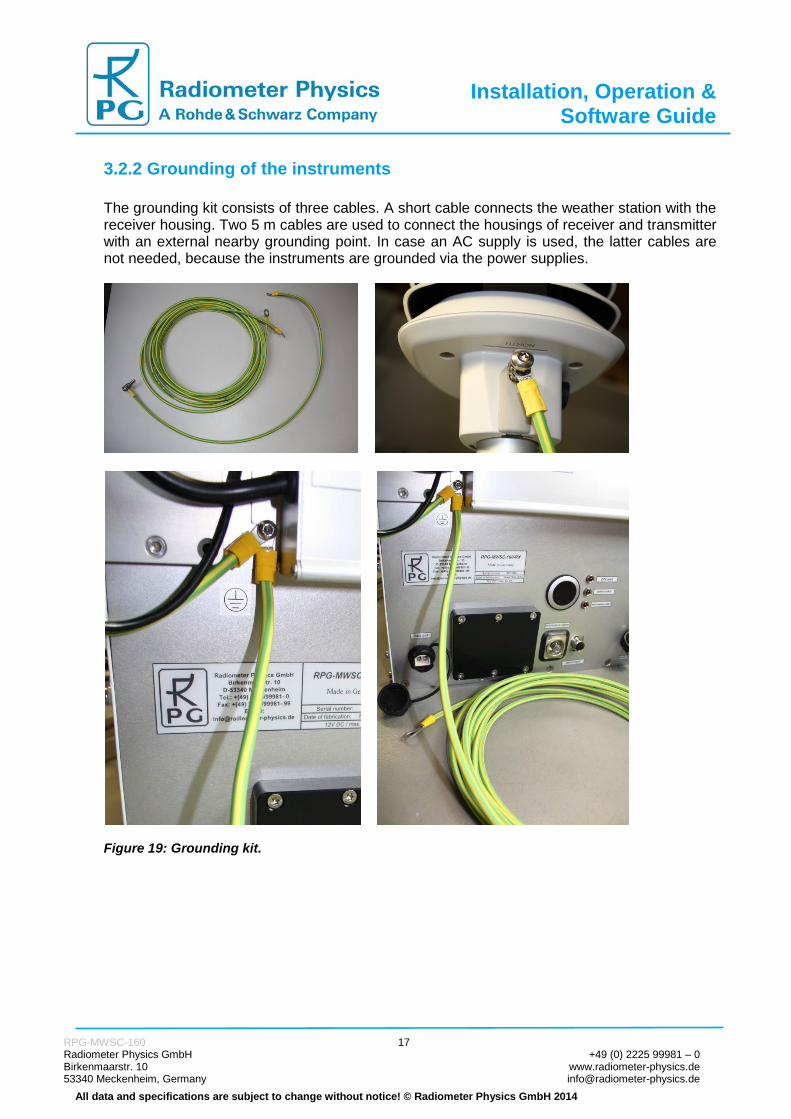
3.2.2 Grounding of the instruments The grounding kit consists of three cables. A short cable connects the weather station with the receiver housing. Two 5 m cables are used to connect the housings of receiver and transmitter with an external nearby grounding point. In case an AC supply is used, the latter cables are not needed, because the instruments are grounded via the power supplies.
Figure 19: Grounding kit.

RPG-MWSC-160 Radiometer Physics GmbH Birkenmaarstr. 10 53340 Meckenheim, Germany
18 +49 (0) 2225 99981 – 0
www.radiometer-physics.de [email protected]
All data and specifications are subject to change without notice! © Radiometer Physics GmbH 2014
Installation, Operation & Software Guide
3.3 Setting up the Combined OMS System
The setup of the OMS system needs to comply with several requirements in order to guarantee a high data quality.
The setup is completely characterized by the … • path length 𝐿, which is the distance between transmitters and receivers • beam heights above ground along 𝐿 • beam distance 𝑑 between LAS beam and MWS beam Figure 20 is a schematic overview of the measurement setup. The beam heights depend on the measured instruments’ heights above ground and the topography along 𝐿. The topography and 𝐿 are known from GPS measurements or can be derived from a map. The beam heights are used to determine an effective path height 𝐻𝑒𝑒𝑒 that is an important input parameter for flux calculations (section 5.4.5). For horizontal beams over flat terrain, 𝐻𝑒𝑒𝑒 equals the observation height 𝐻𝑜𝑜𝑜. The ratio between 𝐻𝑜𝑜𝑜 and 𝐿 determines the strength of the observed scintillation signal. In order to avoid saturation of the LAS signal, long path length should go along with high observation heights (section 5.4.4). Figure 19 gives an orientation for the choice of both parameters.
Figure 20: Saturation of the LAS signal in dependence of the observed sensible heat fluxes (T=300 K, RH=80%, p=1013.25 hPa), saturation criterion from Ochs and Wilson, 1993 [1].

RPG-MWSC-160 Radiometer Physics GmbH Birkenmaarstr. 10 53340 Meckenheim, Germany
19 +49 (0) 2225 99981 – 0
www.radiometer-physics.de [email protected]
All data and specifications are subject to change without notice! © Radiometer Physics GmbH 2014
Installation, Operation & Software Guide
Furthermore, the measured relative instrument positions determine the displacements 𝑑𝑇 and 𝑑𝑅 between transmitters and between receivers, respectively. The displacements 𝑑𝑇 ≪ 𝐿 and 𝑑𝑅 ≪ 𝐿 give the beam distance 𝑑 (Figure 21).The two instrument pairs are set up with crossing signal paths. This reduces 𝑑 in the middle of the path and improves the overlap between the two scintillation signals observed at optical and microwave observations.
Figure 21: Setup of a combined Optical/Microwave Scintillometer (OMS) system with crossing beams. Tx: transmitter, Rx: receivers.
3.3.1 Mounting the Alignment Units
Figure 22: No tools are needed to fasten the alignment unit to the RPG-MWSC-160 units.

RPG-MWSC-160 Radiometer Physics GmbH Birkenmaarstr. 10 53340 Meckenheim, Germany
20 +49 (0) 2225 99981 – 0
www.radiometer-physics.de [email protected]
All data and specifications are subject to change without notice! © Radiometer Physics GmbH 2014
Installation, Operation & Software Guide
For scintillometer measurements over short path lengths – where low observation heights of a few meters are sufficient (Figure 20) - using tripods is the usually the most practical way for setting up the instruments. The LAS and MWS transmitter / receivers can be mounted on separate tripods (Figure 23). In this case, the MWS transmitter / receiver – with the alignment unit attached to it – is directly mounted on top of the tripod. Optionally, RPG offers a double mounting plate to allow for a small distance between the microwave and optical scintillometers (Figure 8). The mounting on the double plate is shown in Figure 24.
Figure 23: Fasten center bolt to mount RPG-MWSC-160 units on a tripod (single configuration).
Figure 24: Mounting the MWSC units in the double configuration.

RPG-MWSC-160 Radiometer Physics GmbH Birkenmaarstr. 10 53340 Meckenheim, Germany
21 +49 (0) 2225 99981 – 0
www.radiometer-physics.de [email protected]
All data and specifications are subject to change without notice! © Radiometer Physics GmbH 2014
Installation, Operation & Software Guide
Figure 25: Double base plate and mounting adaptors for LAS transmitter and receiver.
3.3.2 Mounting on Towers With increasing path lengths the scintillometers have to be mounted at higher observations heights. For example, a path length of 5000 m needs an observation height above 40 meters to avoid saturation of the LAS signal (Figure 20).

RPG-MWSC-160 Radiometer Physics GmbH Birkenmaarstr. 10 53340 Meckenheim, Germany
22 +49 (0) 2225 99981 – 0
www.radiometer-physics.de [email protected]
All data and specifications are subject to change without notice! © Radiometer Physics GmbH 2014
Installation, Operation & Software Guide
Figure 26: OMS transmitters mounted on a measurement tower in Lindenberg, Germany. Sometimes - e.g. when the OMS system is mounted on a measurement tower - it is difficult to read signal level display on the rear of the MWS receiver. In this case the MWS receiver provides a BNC-connector to read the signal level directly from the instrument (Figure 27).
Figure 27: BNC connector to read the RPG-MWSC-160 detector voltage (only for diagnosis).

RPG-MWSC-160 Radiometer Physics GmbH Birkenmaarstr. 10 53340 Meckenheim, Germany
23 +49 (0) 2225 99981 – 0
www.radiometer-physics.de [email protected]
All data and specifications are subject to change without notice! © Radiometer Physics GmbH 2014
Installation, Operation & Software Guide
3.3.3 Cable Connections and Power up The RPG-MWSC units provide a connector for a direct 12 VDC. Optionally, two AC power supplies are mounted on the backside of each instrument. In both cases the LAS transmitter and receiver are connected to the RPG-MWSC-160 units for power supply (exception: BLS2000 from Scintec). Additionally, the LAS receiver provides the optical raw signal to the RPG-MWSC-160 receiver via a short data cable. For the LAS instruments the power and data connection is either combined on one socket (Kipp&Zonen Mk-I) or it is realized separately (Scintec, Kipp&Zonen Mk-II).
Figure 28: Example: power and data cables for the Kipp&Zonen Mk-II receiver. On the transmitter side there is only a power cable.

RPG-MWSC-160 Radiometer Physics GmbH Birkenmaarstr. 10 53340 Meckenheim, Germany
24 +49 (0) 2225 99981 – 0
www.radiometer-physics.de [email protected]
All data and specifications are subject to change without notice! © Radiometer Physics GmbH 2014
Installation, Operation & Software Guide
The MWS and LAS raw signals are synchronously digitized inside the RPG-MWSC-160 receiver. The digital raw data is then transferred to the H-PC via a fibre cable connection (Figure 29, Figure 30). The fibre optical cable is connecting the MWS receiver with a fibre-to-LAN converter. The Ethernet cable can either be plugged into a local network or it can directly connect to the H-PC (peer-to-peer configuration) (section 4.2.1).
Figure 29: Setting up the fibre optical cable for data transfer.
Figure 30: Data transmission and conversion.
Power supply
Ethernet connection
Optical data signal
B

RPG-MWSC-160 Radiometer Physics GmbH Birkenmaarstr. 10 53340 Meckenheim, Germany
25 +49 (0) 2225 99981 – 0
www.radiometer-physics.de [email protected]
All data and specifications are subject to change without notice! © Radiometer Physics GmbH 2014
Installation, Operation & Software Guide
3.3.4 Alignment of the RPG-MWSC-160 units An accurate alignment of the OMS system is important, because of the small beam width involved (for instance 0.42° HPBW for the MWS). Furthermore, it is beneficial for both MWS and LAS, because it helps to reduce the power consumption: A good alignment allows a reduction of the transmitter power level. It is recommended to perform the system alignment and power levelling is done in fair weather conditions. This guarantees that the received signal does not exceed the maximum level, when conditions become more humid afterwards.
Figure 31: Example: Alignment of an OMS system. For the alignment of the receiver and transmitter unit, the pointing of both instruments is adjusted by using the 2-axes alignment units (Figure 32). The alignment process includes two steps: At first, the alignment telescopes (Figure 33) help to catch the transmitted signal by adjusting the receiver and the transmitter by sight.
Figure 32: RPG-MWSC-160 alignment units allow adjustment of azimuth (A) and elevation (B) angle.
A B

RPG-MWSC-160 Radiometer Physics GmbH Birkenmaarstr. 10 53340 Meckenheim, Germany
26 +49 (0) 2225 99981 – 0
www.radiometer-physics.de [email protected]
All data and specifications are subject to change without notice! © Radiometer Physics GmbH 2014
Installation, Operation & Software Guide
Figure 33: Adjustment of the MWS/LAS alignment telescopes. In a second step, the power levels are maximized by fine tuning the receiver’s pointing. When no transmitter signal is received, the displayed value is close to zero (Figure 34). If ‘1’ is displayed, the signal level is out of range. Only one axis shall be adjusted at a time. As soon as the direction of maximum signal level is found, the power level of the transmitter is adjusted to a value close to 1000 (Figure 35, maximum is 2000).
Figure 34: Receiver signal level display. Then the pointing of the receiver unit is fixed. Now the transmitter pointing is again tuned to further maximize the signal level. When the signal maximum is found, the transmitter pointing is fixed and the power level is adjusted to an optimal signal level of about 100%(Figure 34, Figure 35, singal level range: 0-200%)1. The alignment can be further improved by iterating the described process. Finally, note down the according transmitter power level that is displayed on the transmitter rear panel.
1 Instruments with serial number 3010001-3010004 use a different scaling with a signal range of 0-2000. It shall be tuned to 1000.
Focus Zoom Light

RPG-MWSC-160 Radiometer Physics GmbH Birkenmaarstr. 10 53340 Meckenheim, Germany
27 +49 (0) 2225 99981 – 0
www.radiometer-physics.de [email protected]
All data and specifications are subject to change without notice! © Radiometer Physics GmbH 2014
Installation, Operation & Software Guide
Figure 35: Remove protection cap on transmitter rear panel to adjust output power level.
4. Software Description The following text colour conventions are used in this software description:
● Button labels are printed in green. Example: Cancel ● Messages that must be answered by Yes or No are printed in light blue. Example:
Overwrite the existing file? ● Labels are printed in grey: UTC ● Names of group boxes are printed in blue. Example: Setup Handling (in
Configuration Measurement Setup) ● Names of tabs are printed in violet. Example: Configuration ● Names of menus are printed in black. Example: Configure TCP/IP Settings ● Labels of Entry-Boxes are printed in light blue. Example: yTL ● When a speed button shall be clicked, this is indicated by its symbol. Example:
● Hints to speed buttons are printed in brown. Example: License Manager ● Selections from list boxes are printed in magenta. Example: Wageningen LAS ● Selections from radio buttons or check boxes are printed in dark green. Example:
Raw Data (*.RAW) ● File names are printed in orange. Example: MyFileName ● Directory names are printed in dark blue. Example: C:\ RPG-MWSC\
4.1 Installation of Host Software
4.1.1 Hardware Requirements for Host PC The hardware requirements for running the host PC (H-PC) software MWSC-EXE are the following:
• Windows® 7 operating system or higher • 200 MB of free RAM for software execution • LAN interface for communicating with the microwave scintillometer (MWS) • Fibre Optics-to-LAN Converter (part of MWS delivery)
Protection cap
up down

RPG-MWSC-160 Radiometer Physics GmbH Birkenmaarstr. 10 53340 Meckenheim, Germany
28 +49 (0) 2225 99981 – 0
www.radiometer-physics.de [email protected]
All data and specifications are subject to change without notice! © Radiometer Physics GmbH 2014
Installation, Operation & Software Guide
4.1.2 Directory Tree The H- PC software can be installed in any directory and on any partition or drive. Once started, MWSC-EXE will automatically create sub-directories under the selected root-directory. Let us assume, this root directory is D:\MyProgs\RPG-MWSC\. In this case the directory tree looks like this:

RPG-MWSC-160 Radiometer Physics GmbH Birkenmaarstr. 10 53340 Meckenheim, Germany
29 +49 (0) 2225 99981 – 0
www.radiometer-physics.de [email protected]
All data and specifications are subject to change without notice! © Radiometer Physics GmbH 2014
Installation, Operation & Software Guide
D: |--- MyProgs
|--- RPG-MWSC | |---CONFIG | |---MCF | |---DATA | |---HELP | |---LICENSE | |---LOG | |---QUICKLOOKS | |---RADIOMETER PC | |---TEMP | |---TRANSLATION | |---Chinese | |---English | |---French | |---German | |---Italian | |---Korean | |---Spanish
The RPG-MWSC -directory contains (at least) the following files:
• MWSC.EXE : Host PC scintillometer software • BORLNDMM.DLL : Dynamic link library, memory management functions (can be
different in future releases) • CC32140MT.DLL : Dynamic link library, Core functions (can be different in future releases) • IndyCore190.BPL : Indy system library extension file needed for SMTP-server
functionality • IndyProtocols190.BPL: Indy system library extension file needed for SMTP-server • IndySystem190.BPL: Indy sockets system library extension file • CG32.DLL : Dynamic link library, needed to run CodeGuard test programs • NETCDF.DLL : Dynamic link library, netCDF file format routines • RTL190.BPL : Run time library extension file • VCL190.BPL : Visual component library extension file • VCLIMG190.BPL : Visual component library extension file
These files are dynamically linked to MWSC.EXE during program start. If one of them is missing, the software will ask for it when started and terminate execution. …\CONFIG\: Here the SW stores its general configuration file MWSC.CFG (this is
created by clicking or when exiting the program) and the MainFormSize.DAT file
which holds information about the current size of the application (selected by ). …\CONFIG\MCF\: Directory for storing measurement setups (Measurement Configuration File).
RPG-MWSC-160 Radiometer Physics GmbH Birkenmaarstr. 10 53340 Meckenheim, Germany
30 +49 (0) 2225 99981 – 0
www.radiometer-physics.de [email protected]
All data and specifications are subject to change without notice! © Radiometer Physics GmbH 2014
Installation, Operation & Software Guide
…\DATA\: Suggested directory for data file storage. This directory may have any other name or may be located on a different drive. It also holds the archiving tree, if file archiving is enabled. …\HELP\: Location for online help files. These will be included in future releases. …\LICENSE\: Location for license ID files. Please refer to section ‘License File Manager’. …\LOG\: Log directory for file access error file FileAccessErrors.LOG and the TCP/IP scanning file Get_IP.LOG. …\QUICKLOOKS\: Suggested directory for JPG or Bitmap quick-look graphics files. …\RADIOMETER PC\: Contains copied files from scintillometer PC. …\TEMP\: Directory for temporary files (for internal use only). …\TRANSLATION\: Translation files for adapting application to foreign languages. On delivery, the complete installation folder is copied to a memory stick. The software can be installed by simply copying the installation folder to a PC (that fulfils the requirements described in 4.1.1) and creating a short-cut to MWSC.EXE for the desktop.

RPG-MWSC-160 Radiometer Physics GmbH Birkenmaarstr. 10 53340 Meckenheim, Germany
31 +49 (0) 2225 99981 – 0
www.radiometer-physics.de [email protected]
All data and specifications are subject to change without notice! © Radiometer Physics GmbH 2014
Installation, Operation & Software Guide
4.2 Getting Started
When starting the application MWSC.EXE ( ), the screen looks like this:
It is subdivided into different areas:
● A row of shortcut buttons on the top of the screen, allowing for a quick access to all software menus
● Another row of empty message boxes below the shortcut button row
● The graphical data display area arranged into pages with the selection tags Configuration, Raw Data, Structure Parameters, Heat Fluxes, Surface Sensors and Housekeeping Data.
● A status display on the right showing continuous information about the Environment, Receiver Status, Measurement Status and Host PC.
In order to run a measurement, two steps need to be taken in advance. The user must first define a measurement setup and then establish a connection to the MWS. Details about setup definitions are given in a later chapter. We first want to focus on how to connect to the embedded PC inside the scintillometer.

RPG-MWSC-160 Radiometer Physics GmbH Birkenmaarstr. 10 53340 Meckenheim, Germany
32 +49 (0) 2225 99981 – 0
www.radiometer-physics.de [email protected]
All data and specifications are subject to change without notice! © Radiometer Physics GmbH 2014
Installation, Operation & Software Guide
4.2.1 Interfacing via Ethernet
4.2.1.1 Setting up IPs The RPG-MWSC-160 scintillometer model communicates via a LAN (Ethernet)
interface. In order to establish a connection to the instrument, the user clicks on to select the TCP-IP Interface menu. The configuration entry looks like this:
The scintillometer PC (S-PC) is delivered with a fixed default IP address (default: 192.168.0.1, port no.:7777) which can be altered later. For a fist connection the user needs to enter this IP to the edit fields right to Scintillometer IP: (see encircled line above). The scintillometer Gateway is set to the same address as the scintillometer IP, which is required for a ‘peer-to-peer’ connection between the S-PC and the H-PC. A peer-to-peer connection is an Ethernet connection between two PCs without using a network in between. In order to set up a peer-to-peer connection, the H-PC must have a fixed IP address as well and its gateway set to the same IP address. For changing the radiometer IP and gateway, e.g. when the radiometer shall be connected to a network, click Change Scintillometer Settings (a new menu pops up) and edit the fields to the desired numbers:

RPG-MWSC-160 Radiometer Physics GmbH Birkenmaarstr. 10 53340 Meckenheim, Germany
33 +49 (0) 2225 99981 – 0
www.radiometer-physics.de [email protected]
All data and specifications are subject to change without notice! © Radiometer Physics GmbH 2014
Installation, Operation & Software Guide
The red IP / gateway settings are sent to the radiometer by clicking Send to Scintillometer. After new IPs have been successfully sent to the S-PC, it will be no longer reachable through the old IP / gateway addresses. In the case of a successful transfer of the new IP / gateway to the scintillometer, the new IP is copied to the current IP fields automatically so that the H-PC can continue its connection to the radiometer. Then click Connect. You may test the connection with Test LAN Connections. The H-PC will then try to get access to the S-PC via the specified IP address. If the connection is successful, ‘STANDBY’ is indicated in the blue panel, otherwise ‘No Connection’. Example: Consider a newly delivered scintillometer with initial IP of 192.168.0.1, gateway of 192.168.0.1 and with port address 7777. With this IP configuration the scintillometer cannot be successfully connected to a network. In order to connect to it directly in a peer-to-peer connection, the MWS communication cable must be connected DIRECTLY (not via a network) to the Ethernet connector of the H-PC. Without limitation of generality, let us assume the H-PC IP to be 192.168.12.27. In order to tell the H-PC to directly listen to the LAN interface (NOT via a network gateway), its gateway should also be set to 192.168.12.27 to enable a peer-to-peer connection.
The blue ellipse marks the S-PC’s default IP and the green ellipse marks the H-PC IP setting. In order to modify the H-PC settings, click on the Change button and the following menu shows up (with possibly different settings):

RPG-MWSC-160 Radiometer Physics GmbH Birkenmaarstr. 10 53340 Meckenheim, Germany
34 +49 (0) 2225 99981 – 0
www.radiometer-physics.de [email protected]
All data and specifications are subject to change without notice! © Radiometer Physics GmbH 2014
Installation, Operation & Software Guide
For establishing a peer-to-peer connection, click the Peer-to-Peer Connection button. The gateway address will be copied from the H-PC IP address. Then click Apply and the H-PC will be ready to connect to the scintillometer. By clicking on Test LAN Connections, the connection between H-PC and R-PC can be checked. If a connection can be established, the message STANDBY is shown in the blue field. Let us now assume, the user’s administrator wants to connect the scintillometer to a network with the following network settings:
IP: 160.144.13.104 Standard Gateway: 160.144.11.1 Port Address: 6565
The way to send this new configuration to the S-PC is the following: 1. Click on Change Radiometer Network Settings. The fields for the new scintillometer IP and scintillometer gateway are displayed in red. Edit these fields to the following settings:
2. Then click on Send to Scintillometer. The settings in red are now transferred to the S-PC. If the scintillometer has successfully changed its IP / gateway / port settings, a confirmation message is displayed.

RPG-MWSC-160 Radiometer Physics GmbH Birkenmaarstr. 10 53340 Meckenheim, Germany
35 +49 (0) 2225 99981 – 0
www.radiometer-physics.de [email protected]
All data and specifications are subject to change without notice! © Radiometer Physics GmbH 2014
Installation, Operation & Software Guide
After the IP / gateway / port numbers have been altered on the scintillometer, it is not possible to connect to it anymore through a peer-to-peer connection. Therefore, connect the scintillometer’s communication line to the network. 3. Let us assume, the user’s administrator has reserved the following network settings for the H-PC:
IP: 160.144.13.201 Standard Gateway: 160.144.11.1
Modify the H-PC TCP/IP settings by clicking Change and enter the new settings. Confirm your changes with Apply. The H-PC then needs to be connected to the network as well. Now both, the S-PC and the H-PC, are properly connected to the network with specific unique addresses and a connection between the two can be established over the network (e.g. click on Connect to verify this). Click Apply in the TCP-IP Interface menu to save the new settings.
4.2.1.2 VPN Connections

RPG-MWSC-160 Radiometer Physics GmbH Birkenmaarstr. 10 53340 Meckenheim, Germany
36 +49 (0) 2225 99981 – 0
www.radiometer-physics.de [email protected]
All data and specifications are subject to change without notice! © Radiometer Physics GmbH 2014
Installation, Operation & Software Guide
If the H-PC is located far from the local network to which the radiometer is connected, the H-PC is typically using a VPN (Virtual Private Network) connection to the local network. This VPN connection is acting as a virtual adapter on the H-PC and can be inspected in the Host Adapter Settings menu. If you are not familiar of how to set up a VPN connection to a local network on your H-PC, please contact your network administrator. The VPN service must be started on the Host-PC before it can be detected by the Host SW. When checking the Use VPN if available box, you can ensure that the H-PC will always prefer the VPN connection over other active adapters on the system. For a long term installation the VPN connection should be configured with re-dial option for the case that the VPN connection is interrupted. The Host-PC will then automatically reconnect to the scintillometer as soon as the VPN becomes operational again.
4.2.1.3 Multiple Clients The S-PC connected to a H-PC is acting as a server, while the H-PC is the client. Every exchange of data packages is initiated by a H-PC request. The S-PC is permanently listening to its IP address and port for possible client requests. The H-PC is defined to be the FIRST client that connects to the scintillometer. The scintillometer then reserves its connection channel to this H-PC. Any other client requests from other IPs are rejected by the scintillometer and a message is displayed to the new (secondary) client:
The secondary client is blocked from being connected to the scintillometer.
4.2.1.4 Ethernet Passwords When the scintillometer becomes part of a network (not in a peer-to-peer connection), it acts as a server that will only allow one client (H-PC) to connect to it. In principle, any client, who uses a valid network address and who knows the scintillometer’s IP address, can connect to the scintillometer. Therefore, the scintillometer is using a password control system in order to identify the access right of a particular client. This password is called a User Access Password (UAPW) and it is defined by a person with administrator rights, who should be a single IT person responsible for the network. Also the network administrator has a password called the Administrator Password (AMPW). When clicking Ethernet Passwords from the TPC-IP interface menu, a new menu opens for defining such passwords.

RPG-MWSC-160 Radiometer Physics GmbH Birkenmaarstr. 10 53340 Meckenheim, Germany
37 +49 (0) 2225 99981 – 0
www.radiometer-physics.de [email protected]
All data and specifications are subject to change without notice! © Radiometer Physics GmbH 2014
Installation, Operation & Software Guide
The menu appears in the way shown below (left), if the AMPW is already defined. The fields to enter new passwords are disabled, until a valid AMPW is entered, which switches the menu to the status on the right. At scintillometer delivery, the default AMPW is ‘Administrator’. The responsible network administrator should overwrite the AMPW as soon as possible when the scintillometer has been assigned a valid IP address in a network. The network administrator is the only person who is authorized to set the UAPW and the password checking enable / disable.
A user who tries to connect to the scintillometer with a valid UAPW (Lock In button) will be accepted if no other client is currently present. Otherwise he will be rejected and informed about the radiometer connection being occupied. Only the Administrator has the right to interfere in an established communication between the scintillometer and a H-PC by clicking the Lock Out Current Client button. The Administrator client then becomes the new H-PC. . When an administrator has entered a valid AMPW, he can define a new UAPW or enable / disable password checking by the scintillometer. Once a UAPW check is enabled and the UAPW has been defined by the Administrator, a client must enter the UAPW when he connects to the scintillometer. Otherwise the access will be denied. If a client has entered the correct UAPW, the connection to the scintillometer can be established (assuming the client is the first client) and the UAPW is stored on the client’s disk so that a new entry of the UAPW is not required if the client tries to connect to the scintillometer multiple times. The UAPW can be deleted from disk by Clear User Password on this Host PC to enforce the entry of the UAPW next time a user wants to access the scintillometer again. The UAPW entry cannot be over-ruled by an entry of the AMPW. When the UAPW entry is requested, only the correct UAPW is accepted. An Administrator, who has

RPG-MWSC-160 Radiometer Physics GmbH Birkenmaarstr. 10 53340 Meckenheim, Germany
38 +49 (0) 2225 99981 – 0
www.radiometer-physics.de [email protected]
All data and specifications are subject to change without notice! © Radiometer Physics GmbH 2014
Installation, Operation & Software Guide
forgotten the UAPW, can enter the correct AMPW and define a new UAPW or disable the password checking to get access to the S-PC.
4.3 Define Measurement Setups
Once the connection to the MWS is established (e.g. click ), a measurement setup should be defined or selected before a measurement can be started. To do so, switch to the Configuration tag in the data display area:
The Measurement Setup page (see above figure) summarizes all geometrical definitions of a measurement. The various parameters and their names are illustrated in a graphical schematic. The used coordinate system has its x-axis directed to the connecting line between transmitters and receivers with its origin at the transmitter location. The vertical direction is the z-axis and the lateral direction the y-axis. The following coordinates are defined:
● zTL: LAS transmitter z-coordinate [m], measured above ground level ● zTM: MWS transmitter z-coordinate [m], measured above ground level ● zRL: LAS receiver z-coordinate [m], measured above ground level ● zRM: MWS receiver z-coordinate [m], measured above ground level ● yTL: LAS lateral transmitter displacement ● yRL: LAS lateral receiver displacement

RPG-MWSC-160 Radiometer Physics GmbH Birkenmaarstr. 10 53340 Meckenheim, Germany
39 +49 (0) 2225 99981 – 0
www.radiometer-physics.de [email protected]
All data and specifications are subject to change without notice! © Radiometer Physics GmbH 2014
Installation, Operation & Software Guide
In this coordinate system the MWS lateral displacement is zero. In a correct setup the connecting lines of LAS receiver / transmitter and MWS receiver / transmitter must intersect somewhere along the signal path. This can be achieved by reverting the relative LAS and MWS positions on the transmitter and receiver side. For example, if the LAS and MWS are at the same altitude (zTL = zTM and zRL = zRM), the lateral LAS displacement coordinates of transmitter and receiver must have different signs, e.g. yTL = -yRL. The relative y and z coordinates shall be measured with an accuracy of about 1 cm. In addition to the relative (ground level referenced) z-coordinates, the user defines the topography between transmitters and receivers by entering a set of 10 positions x[i] and z[i], i = 1,…10. The total path length is therefore defined as x[10]. The topographic z-coordinates are GPS altitudes (in m). If not directly measured using a handheld GPS receiver, the x and z-coordinates may also be derived from Google-maps. The accuracy of the absolute x and z coordinates shall be about 1 m.
Note: Accurate measurements of the x, y and z-coordinates are essential for valuable heat flux observations! Particularly, when observing at short path lengths and low observation heights.
Furthermore, a surface roughness length parameter (in [m]) can be selected from a combo box (Surf. Roughn.:). This parameter is needed in the calculation of the friction velocity (see section 76). The MWS is equipped with a meteorological station providing wind speed and wind direction information. In order to derive the wind component orthogonal to the signal path, the path orientation relative to north (clockwise) is needed. The path orientation is entered in Orient. Rel. to North (CW): In addition to the LAS and MWS positions, the user can select from a list of different commercially available LAS systems. While currently there is only one MWS model available (the RPG-MWSC-160), the following LAS systems can be run together with the MWS:
● Scintec BLS 450 ● Scintec BLS 900 ● Scintec BLS 2000 ● Kipp & Zonen LAS Mk-I ● Kipp & Zonen LAS Mk-II ● Wageningen LAS
These instruments have different wavelength and aperture diameters. By selecting one of them from the combo, the correct numbers are automatically assigned from an internal LAS archive. After the measurement geometry is defined, it must be stored to the setup archive. Please enter a setup name to New Entry Name: and click Add. The program then computes the spectral filter functions that are needed for later data processing. This computation takes about a few minutes (the computation progress is indicated by a progress bar), depending on the path length. When finished, the setup name is added to the combo box under Current Setup: and the computation results are stored in the setup archive. If the user selects a setup from the combo box, the computation of the spectral filter functions is not repeated, because the results have been saved to the archive. It is also possible to Delete or Overwrite setup entries.

RPG-MWSC-160 Radiometer Physics GmbH Birkenmaarstr. 10 53340 Meckenheim, Germany
40 +49 (0) 2225 99981 – 0
www.radiometer-physics.de [email protected]
All data and specifications are subject to change without notice! © Radiometer Physics GmbH 2014
Installation, Operation & Software Guide
For expert users, who are familiar with the theoretical background of scintillometry, the spectral filter functions are plotted on the Spectral Filters & Weighting Functions page for information purpose. The plot shows that the maximum of the LAS fluctuation spectrum is in the order of a few hundred wave numbers while the MWS scintillation spectrum cuts off below 30 wave numbers. In order to capture the full scintillation information, the MWS samples the LAS signal with 1 kHz sampling rate. From the spectral filter function plot, it can also be seen that the MWS must be more sensitive than a LAS because its filter function peaks about one order of magnitude below the LAS filter curve. The scintillation signal level rises with increasing path length. In order to run the MWS efficiently, the minimum path length should be around 1000 m, depending on the evapo-transpiration level. The lower the evapo-transpiration, the longer is the required path length in order to achieve a sufficient signal to noise ratio. Another important parameter for the heat flux data analysis is the effective signal path height above ground. The computation of effective height requires the knowledge of the sensitivity weighting functions along the signal path. These functions are also plotted on the Spectral Filters & Weighting Functions page.
Example of spectral filter functions, computed from a setup geometry (blue: MWS, red, LAS, green: Covariance OMS). The effective height computation is based on a convolution of the weighting functions and the distance of signal path to vertical topography coordinate along the path. The plot shows the weighting functions for MWS (blue), LAS (red) and the correlated signal (green). The topography is indicated as a green underground contour and the signal paths for LAS and MWS (tilt and location) is given as red and blue straight lines for LAS and MWS respectively.
RPG-MWSC-160 Radiometer Physics GmbH Birkenmaarstr. 10 53340 Meckenheim, Germany
41 +49 (0) 2225 99981 – 0
www.radiometer-physics.de [email protected]
All data and specifications are subject to change without notice! © Radiometer Physics GmbH 2014
Installation, Operation & Software Guide
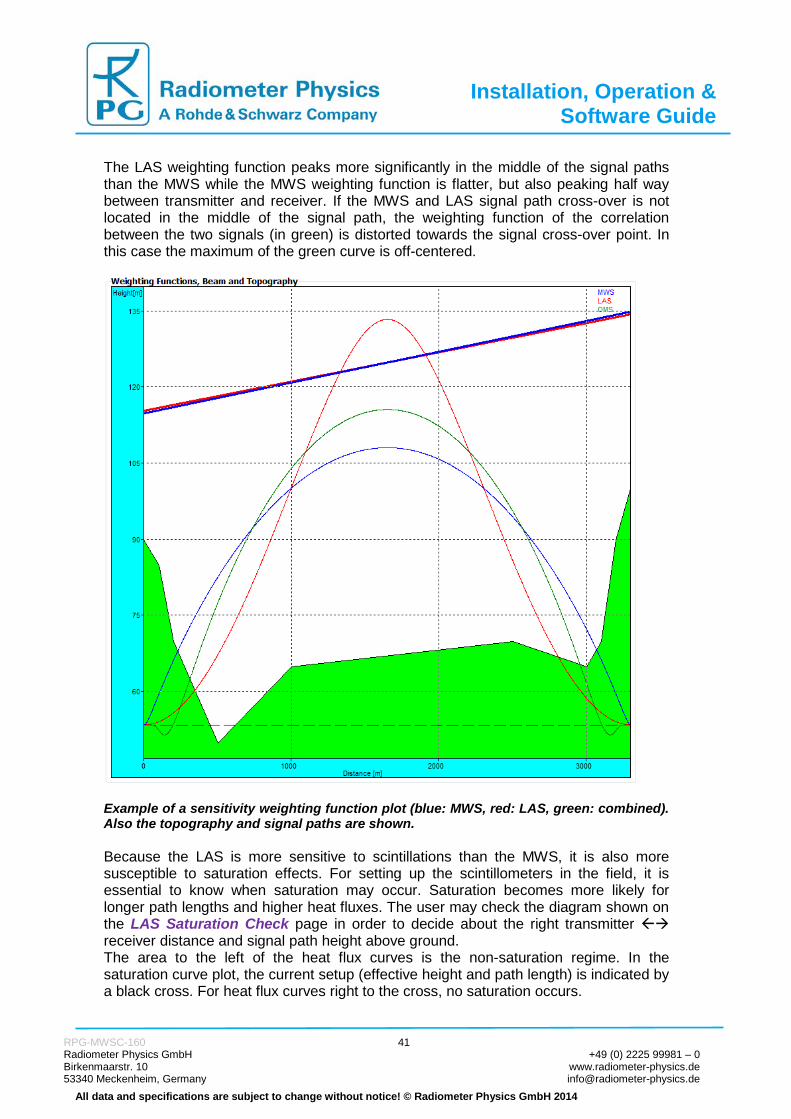
The LAS weighting function peaks more significantly in the middle of the signal paths than the MWS while the MWS weighting function is flatter, but also peaking half way between transmitter and receiver. If the MWS and LAS signal path cross-over is not located in the middle of the signal path, the weighting function of the correlation between the two signals (in green) is distorted towards the signal cross-over point. In this case the maximum of the green curve is off-centered.
Example of a sensitivity weighting function plot (blue: MWS, red: LAS, green: combined). Also the topography and signal paths are shown. Because the LAS is more sensitive to scintillations than the MWS, it is also more susceptible to saturation effects. For setting up the scintillometers in the field, it is essential to know when saturation may occur. Saturation becomes more likely for longer path lengths and higher heat fluxes. The user may check the diagram shown on the LAS Saturation Check page in order to decide about the right transmitter receiver distance and signal path height above ground. The area to the left of the heat flux curves is the non-saturation regime. In the saturation curve plot, the current setup (effective height and path length) is indicated by a black cross. For heat flux curves right to the cross, no saturation occurs.

RPG-MWSC-160 Radiometer Physics GmbH Birkenmaarstr. 10 53340 Meckenheim, Germany
42 +49 (0) 2225 99981 – 0
www.radiometer-physics.de [email protected]
All data and specifications are subject to change without notice! © Radiometer Physics GmbH 2014
Installation, Operation & Software Guide
On the Measurement Setup page the user also specifies which file types are stored during a measurement (Data Storage Options). The following file types are available:
Example of LAS saturation curves, plotted as a function of path length and minimum effective height. The black cross indicates the setup configuration. In this example, saturation would occur at sensible heat fluxes above 500 Watts/m². Scintillometer-PC:
● Variance Data Files (*.VAR) ● Housekeeping Data Files (*.HKD)
Host-PC:
● Raw Data Files (*.RAW) ● Variance Data Files (*.VAR) ● Heat Flux Data Files (*.FLX) ● Housekeeping Data Files (*.HKD)
After a measurement has been started, the checkboxes for enabling certain data file types are frozen and cannot be altered. The data file settings must be selected before measurement start. *.RAW data files (level 0) contain (in addition to the setup data and GPS position in the header) the surface sensor data (resolution 1 second) and the LAS and MWS detector voltages (resolution 1 ms). For a detailed description of the file format, see Appendix A. *.VAR data files (level 1) contain (in addition to the setup data and GPS position in the header) the surface sensor data (resolution 1 minute) and the variances for LAS, MWS and the co-variance of the two (resolution 1 minute). The file stores all the information to calculate heat fluxes. For a detailed format description, see Appendix A.

RPG-MWSC-160 Radiometer Physics GmbH Birkenmaarstr. 10 53340 Meckenheim, Germany
43 +49 (0) 2225 99981 – 0
www.radiometer-physics.de [email protected]
All data and specifications are subject to change without notice! © Radiometer Physics GmbH 2014
Installation, Operation & Software Guide
*.FLX data files (level 2) contain (in addition to the setup data and GPS position in the header) the surface sensor data (resolution 1 minute) and the heat flux data (resolution 1 minute). For a detailed description of the file format, see Appendix A. *.HKD data files contain the GPS position and nine housekeeping signals (resolution 1 second). For a detailed description of the file format, see Appendix A.
4.4 Data Storage Host Configuration The final step before a measurement can be started is the data file path specification.
Open the Directories and Data Formats menu by clicking .
Directories and Data Formats menu, including data archiving.
The Host PC group box on the main screen displays the data storage details. The data storage directory is selected from the directory tree shown in Data Directory. In the same menu the user specifies, if an ASCII or netCDF version of the data files (which are in binary format by default) shall be automatically created. ASCII and / or netCDF files will then (if this option is selected) be stored to the same data directory as the binary files. Data archiving is a useful feature to prevent the data directory to be filled with ten thousands of files which may overload the operating system. MS operating systems cannot handle many (in the order of ten thousands) files in a single directory. If Enable is checked, the software automatically creates sub-directories in the data directory and stores the data files according to the year, month and day of file storage. E.g. a file 08111623.VAR would be stored in a directory …\RPG-MWSC\Data\Y2008\M11\D16\. Automatic file concatenation to daily files can also be enabled.

RPG-MWSC-160 Radiometer Physics GmbH Birkenmaarstr. 10 53340 Meckenheim, Germany
44 +49 (0) 2225 99981 – 0
www.radiometer-physics.de [email protected]
All data and specifications are subject to change without notice! © Radiometer Physics GmbH 2014
Installation, Operation & Software Guide
Quick-look files can be automatically created and stored to a separate directory. The file formats BMP and JPG are available. When clicking the QL Diagram List button, a list of graphics windows is displayed. Each of these windows can be enabled / disabled for quick-look file generation. When enabled, a certain graphics display is periodically (defined by QL Period) converted to a JPG or Bitmap file and stored to the quick-look directory.
4.5 Exchanging Data Files
The file transfer menu is opened by clicking . It can be used to exchange files between host and scintillometer PCs. It is possible to transfer not only single files but also complete directories (including sub-directories). This feature becomes beneficial when a lot of data has to be transferred from the scintillometer’s file backup to the H-PC.
Files or directories can be deleted by marking them and clicking the right mouse button:

RPG-MWSC-160 Radiometer Physics GmbH Birkenmaarstr. 10 53340 Meckenheim, Germany
45 +49 (0) 2225 99981 – 0
www.radiometer-physics.de [email protected]
All data and specifications are subject to change without notice! © Radiometer Physics GmbH 2014
Installation, Operation & Software Guide
From the displayed drop-down list the user may select ‘Delete Selected Scintillometer PC Files’ or ‘Rename Scintillometer PC File’. These functions are also available for directories. Those buttons with green arrows pointing from left to right will move files / directories from the H-PC to the R-PC and those with a green arrow pointing from right to left will move files / directories from the scintillometer to the host. If the user tries to send files to the RPG-MWSC directory (the system directory), a password check is initiated:
The H-PC is asking for the entry of the Administrator password (AMPW) to complete the desired action. This mechanism prevents unauthorized users to overwrite important S-PC system files.
4.6 Starting Measurements When the data cable is properly installed between H-PC and S-PC and the Ethernet IP settings are correctly specified according to section 4.2.1, the host connects to the
scintillometer by clicking . The graphics data display immediately presents raw data samples like in the figure below. The two Raw Data Scope displays are continuously updated by the current detector voltages of the MWS and connected LAS. The MWS not only digitizes its own microwave signal, but synchronously also the LAS analogue raw signal. The synchronisation of both time series is within 10 µs so that the co-variance calculation is not affected over the whole fluctuation frequency band. Both time series are sampled with 1 ms sampling rate. The user may change time axis and ADC axis settings or may switch to the Mean T.-Series plot (mean signal time series). The scope display is useful to check the signal level from the transmitters. Also the noise performance of the receiver (without transmitter signal) may be analysed.

RPG-MWSC-160 Radiometer Physics GmbH Birkenmaarstr. 10 53340 Meckenheim, Germany
46 +49 (0) 2225 99981 – 0
www.radiometer-physics.de [email protected]
All data and specifications are subject to change without notice! © Radiometer Physics GmbH 2014
Installation, Operation & Software Guide
The power spectral density (PSD) is presented in the upper left diagram. The sampling period of the FFT can be selected between 1s and 1048 s. The PSD informs about the fluctuation spectrum of the LAS and MWS and is a good diagnostics tool to identify artificial spectral components like 50 Hz pickup, tower vibration modes (if the LAS / MWS are mounted on a tower), etc.
In the lower left corner the LAS, MWS variances and co-variance (COV) are displayed. These parameters are calculated according to equations (9)-(11) and are needed as a basis for deriving heat fluxes.
Data display after successfully connecting to the MWS.
In this display mode, no data is stored to any data files. File storage is only performed during a running measurement. After a setup has been defined or selected and the file storage on the scintillometer and host PC is specified, a measurement can be started
with . This command transfers the setup information to the scintillometer so that the instrument is capable of running the measurement independently without a connected host. Therefore, after initiating a measurement start, the Ethernet connection to the host may be interrupted, but the scintillometer automatically continues the measurement and stores its result in a file backup system, similar to the archiving system on the H-PC. Please note, that the S-PC does not provide file storage for raw data (*.RAW) because of the large file size (670 MB / day). Raw data files are only created on the H-PC.

RPG-MWSC-160 Radiometer Physics GmbH Birkenmaarstr. 10 53340 Meckenheim, Germany
47 +49 (0) 2225 99981 – 0
www.radiometer-physics.de [email protected]
All data and specifications are subject to change without notice! © Radiometer Physics GmbH 2014
Installation, Operation & Software Guide
If the scintillometer is interrupted by a power failure, it automatically restarts the interrupted measurement after power return. If the H-PC is connecting to the S-PC while the scintillometer is running a measurement, the host automatically ‘jumps’ into the measurement, using the same setup as the scintillometer.
The data transfer between H-PC and S-PC can be halted any time with and
continued with . This will not terminate a running measurement and there is no loss of data unless the break is shorter than 10 minutes.
A running measurement is terminated (on both, S-PC and H-PC) by clicking .
4.7 The Data Processing Chain A detailed systematic summary of the mathematical procedures involved in the derivation of sensible heat and latent heat fluxes is given in section 5.4. For expert users the host software displays some of the intermediate products like the structure parameters of the turbulent flow for the refractive index (equations 27-29) and for temperature and for humidity (section 5.4.2), or the correlation parameter 𝑅𝑇𝑇 (equation 52).
Structure parameter displays. Left: Diffraction structure parameters, right: Met. structure parameters.

RPG-MWSC-160 Radiometer Physics GmbH Birkenmaarstr. 10 53340 Meckenheim, Germany
48 +49 (0) 2225 99981 – 0
www.radiometer-physics.de [email protected]
All data and specifications are subject to change without notice! © Radiometer Physics GmbH 2014
Installation, Operation & Software Guide
The experienced user may also adjust certain parameters involved in the data processing algorithms:
● Running mean time used in the processing from raw data (scintillation voltage time series) to variances, range 1 sec to 60 sec (default 10 sec), Raw Data display page
● Variance integration time, range 1 minute to 10 minutes (default 10 minutes), Raw Data display page
● MOST coefficients, Structure Parameters display page
● Heat flux averaging, range 1 minute to 60 minutes, Heat Fluxes display page
Once a measurement has been started, these parameters are frozen and cannot be altered.
RTQ correlation parameter (left) and heat fluxes diplay (right).
The heat fluxes diplay includes markers for sunset (SS) and sunrise (SR).

RPG-MWSC-160 Radiometer Physics GmbH Birkenmaarstr. 10 53340 Meckenheim, Germany
49 +49 (0) 2225 99981 – 0
www.radiometer-physics.de [email protected]
All data and specifications are subject to change without notice! © Radiometer Physics GmbH 2014
Installation, Operation & Software Guide
Surface sensor diplay: Barometric pressure, environmental temperature, relative humidity and rain flag.
By clicking W, the display switches to wind speed and wind direction.
The wind speed measured by the met station is an important parameter in the flux calculation algorithm. Without wind speed there is no heat flux.

RPG-MWSC-160 Radiometer Physics GmbH Birkenmaarstr. 10 53340 Meckenheim, Germany
50 +49 (0) 2225 99981 – 0
www.radiometer-physics.de [email protected]
All data and specifications are subject to change without notice! © Radiometer Physics GmbH 2014
Installation, Operation & Software Guide
Housekeeping data display monitoring the receiver temperature, its thermal stability, total instrument power consumption (receiver unit only), power supply voltages, PID regulator voltage and AGC receiver local oscillator power control.
4.8 Data Post Processing
The produced data files are divided into the following categories:
● *.RAW data files, Level 0: These files contain sufficient information to derive all other data levels (Level 1 and Level 2)
● *. VAR data files, Level 1: These files contain all information to derive Level 2 data
● *. FLX data files, Level 2: These are the end product files In general it would be sufficient to only store raw data because all other data levels can be generated from it. The major disadvantage is the enormous file size of approx. 670 MB / day. For users who do not need to inspect PSDs or who are not willing to tune variance integration and running mean time in a post processing step, will prefer to only store variance data files (*.VAR, Level 1), which are much smaller (70 kB / day). The host software provides a post processor to create
● Level 1 and Level 2 data files from raw data files (Level 0) ● Level 2 data files from variance data files (Level 1)
The post processor is invoked by clicking . The following menu is opened:

RPG-MWSC-160 Radiometer Physics GmbH Birkenmaarstr. 10 53340 Meckenheim, Germany
51 +49 (0) 2225 99981 – 0
www.radiometer-physics.de [email protected]
All data and specifications are subject to change without notice! © Radiometer Physics GmbH 2014
Installation, Operation & Software Guide
Select a list of source files or a directory to be processed (with or without sub-directories). Select the source file type (*.VAR or *.RAW) and start the post processor with Process. The processor can be terminated any time by clicking Terminate.
4.9 Inspecting Data Files The program includes a viewer for all data file types (RAW, VAR, FLX and HKD). Click
and select Open Scintillation Data Files (*.RAW, *.VAR, *.FLX):
RPG-MWSC-160 Radiometer Physics GmbH Birkenmaarstr. 10 53340 Meckenheim, Germany
52 +49 (0) 2225 99981 – 0
www.radiometer-physics.de [email protected]
All data and specifications are subject to change without notice! © Radiometer Physics GmbH 2014
Installation, Operation & Software Guide
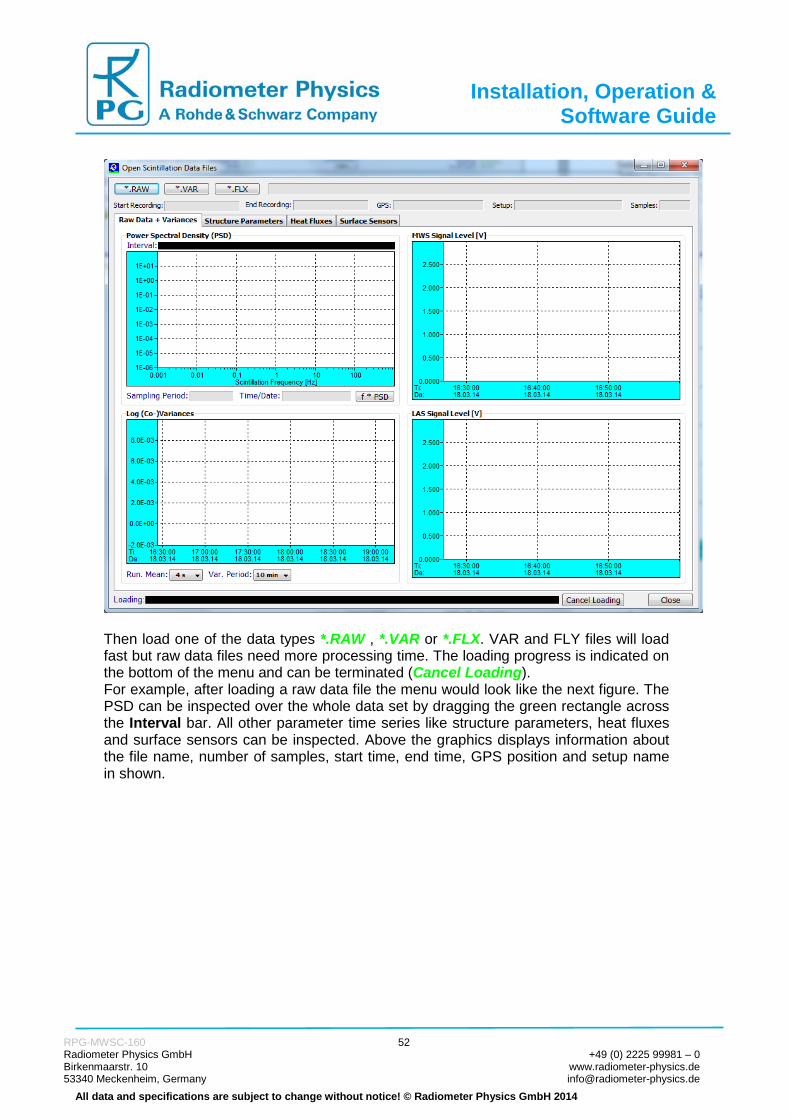
Then load one of the data types *.RAW , *.VAR or *.FLX. VAR and FLY files will load fast but raw data files need more processing time. The loading progress is indicated on the bottom of the menu and can be terminated (Cancel Loading). For example, after loading a raw data file the menu would look like the next figure. The PSD can be inspected over the whole data set by dragging the green rectangle across the Interval bar. All other parameter time series like structure parameters, heat fluxes and surface sensors can be inspected. Above the graphics displays information about the file name, number of samples, start time, end time, GPS position and setup name in shown.

RPG-MWSC-160 Radiometer Physics GmbH Birkenmaarstr. 10 53340 Meckenheim, Germany
53 +49 (0) 2225 99981 – 0
www.radiometer-physics.de [email protected]
All data and specifications are subject to change without notice! © Radiometer Physics GmbH 2014
Installation, Operation & Software Guide
Software display after opening a raw data file.
4.10 Transform Data Files to ASCII Format
The standard data file format is binary (file structures listed in Appendix A) because it is more compact than other formats. In the case that a human readable format is
required, the binary files can be transformed to ASCII. When using the command (Transform Data Files to ASCII Format), a binary data file is converted to an ASCII file. The file name of the new file is the binary file name with appended ‘.ASC’, e.g. the variance binary format file 140513.VAR is converted to 140513.VAR.ASC. Beside this manual ASCII file generation, it is possible to automatically store data in ASCII format during the active measurement. See section 4.4 for details. Another frequently used data format is the netCDF format. The manual conversion of a
binary file to a netCDF file is performed with . The file extension of the converted file is ‘.NC’. Automatic conversion to netCDF during measurements is activated in the Define Directories and Data Formats menu. As in all other post processing menus, file conversions may be performed for multiple files selected from a file box or for complete directories, with or without sub-directories.

RPG-MWSC-160 Radiometer Physics GmbH Birkenmaarstr. 10 53340 Meckenheim, Germany
54 +49 (0) 2225 99981 – 0
www.radiometer-physics.de [email protected]
All data and specifications are subject to change without notice! © Radiometer Physics GmbH 2014
Installation, Operation & Software Guide
4.11 File Concatenation
In a measurement, data files are stored in chunks of hourly files with file name convention YYMMDDHH.xxx (YY = year (two digits), MM = month, DD = day, HH = hour, xxx = file type extension (RAW, VAR, FLX or HKD)). For inspecting data, it is sometimes more convenient to overview a full day of data. If the user enables Auto File Concat. within the Directories and Data Formats menu, the hourly files are automatically concatenated to daily files. For example, the files 14051300.VAR, 14051301.VAR, 14051302.VAR, 14051303.VAR,… Are connected to a file named 140513.VAR; of course the two digits HH for the hour are missing in this filename. The hourly files are deleted after concatenation. It should be clear that only files of the same type can be concatenated. If the automatic file concatenation was not activated during a measurement, this
procedure can be post processed by clicking :
File concatenation menu. The user may concatenate multiple files from a file list or perform the concatenation process in complete directories (all types in a row), with or without sub-directories. This way the post processing can be realized in a few mouse clicks for a complete data set, e.g. by selecting a ‘year’ directory (for instance Y2014).

RPG-MWSC-160 Radiometer Physics GmbH Birkenmaarstr. 10 53340 Meckenheim, Germany
55 +49 (0) 2225 99981 – 0
www.radiometer-physics.de [email protected]
All data and specifications are subject to change without notice! © Radiometer Physics GmbH 2014
Installation, Operation & Software Guide
4.12 The License Manager RPG’s scintillometers are delivered with a preliminary limited license of 30 days. Without activating an unlimited license, the scintillometer stops operation when the limited license is expired. The common procedure to avoid this is the following:
Invoke the License Manager by clicking the button. The menu below pops up.
License manager menu. The user retrieves license status information with the Get License Status command. The license type (limited or unlimited) as well as the expiration date and time will be displayed. In order to obtain an unlimited license, the following steps have to be performed:
1. Connect to the scintillometer and click the Get License ID from Scintillometer button. The license ID code is then written to the file ‘LicID.DAT’ stored in the license directory …\LICENSE\ (see section 4.1.2).
2. Send the ‘LicID.DAT’ file to RPG (by e-mail to [email protected]). Then the 10 digit license code will be returned (also by e-mail).
3. Enter the 10 digit license code into the edit box in the license manager and click Send License Code. The license manager will inform the user if the unlimited license installation was successful or not. If not successful, please contact RPG again.

RPG-MWSC-160 Radiometer Physics GmbH Birkenmaarstr. 10 53340 Meckenheim, Germany
56 +49 (0) 2225 99981 – 0
www.radiometer-physics.de [email protected]
All data and specifications are subject to change without notice! © Radiometer Physics GmbH 2014
Installation, Operation & Software Guide
4.13 Software Updates Sometimes it is desirable to update the scintillometer and host software version, in order to add advanced features to the data processing or to correct software bugs. The scintillometer SW is running on an embedded PC and is named ScinPC.EXE. This file is located in the scintillometer’s root directory …\RPG-MWSC\. The host SW name is MWSC.EXE and it is located in the application’s root directory (…\RPG-MWSC\) on the host PC. For a SW update the following steps should be followed: 1. Step: Save the old software versions a) Create a directory to save the old software versions (e.g. C:\MyPath\Save\).
b) Connect the H-PC to the scintillometer and enter the File Transfer Menu ( ). On the left side (H-PC, ‘This PC (Host)’) browse to the directory for saving the files (e.g. C:\MyPath\ SAVE) and on the right side (Scintillometer) in the …\RPG-MWSC\ directory mark the ScinPC.EXE file. Then click Copy Selected Files. c) locate the MWSC.EXE file in the …\RPG-MWSC\ directory on the H-PC and copy this file to the C:\MyPath\Save\ directory (by using the Operating System Explorer). 2. Step: Overwrite the old versions by the new ones
a) Copy the new version of ScinPC.EXE (the S-PC software) to an arbitrary directory on your host PC (e.g. …\RPG-MWSC\Scintillometer PC). In the file transfer menu, browse to that directory. Mark the ScinPC.EXE file in the file list within the This PC (Host) box and mark the …\RPG-MWSC\ directory in the Scintillometer PC (Embedded) box. Click the Copy Selected Files button. Because you are now going to overwrite a file in the scintillometer’s system directory, you must enter the Administrator password to proceed.
File Transfer Menu

RPG-MWSC-160 Radiometer Physics GmbH Birkenmaarstr. 10 53340 Meckenheim, Germany
57 +49 (0) 2225 99981 – 0
www.radiometer-physics.de [email protected]
All data and specifications are subject to change without notice! © Radiometer Physics GmbH 2014
Installation, Operation & Software Guide
b) Reboot the S-PC to run the new ScinPC.EXE version ( ). Wait for approximately 3 minutes until the S-PC has finished its booting process.
c) Terminate MWSC.EXE on the host and overwrite it by the new version.
d) Execute MWSC.EXE and reconnect to the scintillometer with .
The software upgrade is finished. You can confirm the successful upgrade by reading the software version numbers of both, the embedded S-PC (see main window, Receiver Status box on the right side) and the H-PC (see main window caption).
4.14 Automatic E-Mail Warning Messages While a measurement is running, several events that may occur are of major interest for the user. These events could be:
• A scintillometer hardware problem • A communication loss to the scintillometer has occurred • The power level from transmitter is too low • The free disk space on the scintillometer or host is insufficient
The host SW offers the possibility to send automatic e-mails to pre-defined addresses
via a built-in SMTP server. Click to enter the SMTP server menu:

RPG-MWSC-160 Radiometer Physics GmbH Birkenmaarstr. 10 53340 Meckenheim, Germany
58 +49 (0) 2225 99981 – 0
www.radiometer-physics.de [email protected]
All data and specifications are subject to change without notice! © Radiometer Physics GmbH 2014
Installation, Operation & Software Guide
Menu for defining automatic E-Mail warning messages.
The first step is to define the SMTP server details. The user may configure a server of his choice (enter the server, a user address with user and password and the port number for the server) or simply click Load Defaults to use the RPG mail server for this purpose. Then enter the address of a mail recipient as a message target and add it to the mail list (Add Entry). Before adding an address, the copy status may be selected (TO, CC, BCC). The message types can be enabled or disabled separately. Mail server settings, the mailing list and event types are stored permanently by clicking Apply. The communication may be tested by sending a test message (Send Test Message). Automatic e-mails must be enabled by checking Enable Automatic E-Mail Messages (Alerts).

RPG-MWSC-160 Radiometer Physics GmbH Birkenmaarstr. 10 53340 Meckenheim, Germany
59 +49 (0) 2225 99981 – 0
www.radiometer-physics.de [email protected]
All data and specifications are subject to change without notice! © Radiometer Physics GmbH 2014
Installation, Operation & Software Guide
4.15 Changing the Application Size on the Screen The host SW can scale the application to almost any common screen size. This may be useful if you want to use a beamer to display the host application in the beamer’s
screen resolution and size.Click to enter the Application Size menu:
The screen size in brackets <…> is the host’s maximum screen size but you can select any (smaller) sizes to fit the application on other screens (like a beamer). The application sizing can be done any time, even during a running measurement.
4.16 Shutting Down the Scintillometer PC Before the scintillometer is turned off (power off), it should be shut down first. This is
performed by the command. After a shutdown has been initiated, please wait for at least one minute until powering off the MWS.
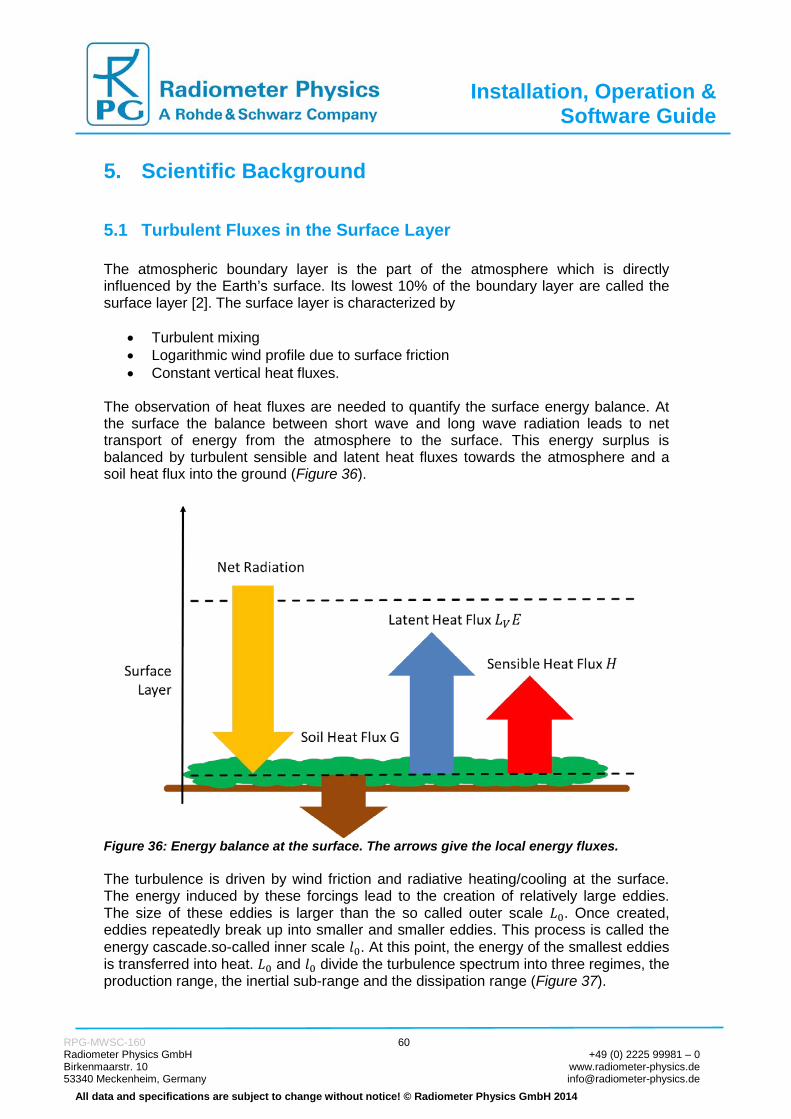
RPG-MWSC-160 Radiometer Physics GmbH Birkenmaarstr. 10 53340 Meckenheim, Germany
60 +49 (0) 2225 99981 – 0
www.radiometer-physics.de [email protected]
All data and specifications are subject to change without notice! © Radiometer Physics GmbH 2014
Installation, Operation & Software Guide
5. Scientific Background
5.1 Turbulent Fluxes in the Surface Layer The atmospheric boundary layer is the part of the atmosphere which is directly influenced by the Earth’s surface. Its lowest 10% of the boundary layer are called the surface layer [2]. The surface layer is characterized by
• Turbulent mixing • Logarithmic wind profile due to surface friction • Constant vertical heat fluxes.
The observation of heat fluxes are needed to quantify the surface energy balance. At the surface the balance between short wave and long wave radiation leads to net transport of energy from the atmosphere to the surface. This energy surplus is balanced by turbulent sensible and latent heat fluxes towards the atmosphere and a soil heat flux into the ground (Figure 36).
Figure 36: Energy balance at the surface. The arrows give the local energy fluxes. The turbulence is driven by wind friction and radiative heating/cooling at the surface. The energy induced by these forcings lead to the creation of relatively large eddies. The size of these eddies is larger than the so called outer scale 𝐿0. Once created, eddies repeatedly break up into smaller and smaller eddies. This process is called the energy cascade.so-called inner scale 𝑙0. At this point, the energy of the smallest eddies is transferred into heat. 𝐿0 and 𝑙0 divide the turbulence spectrum into three regimes, the production range, the inertial sub-range and the dissipation range (Figure 37).
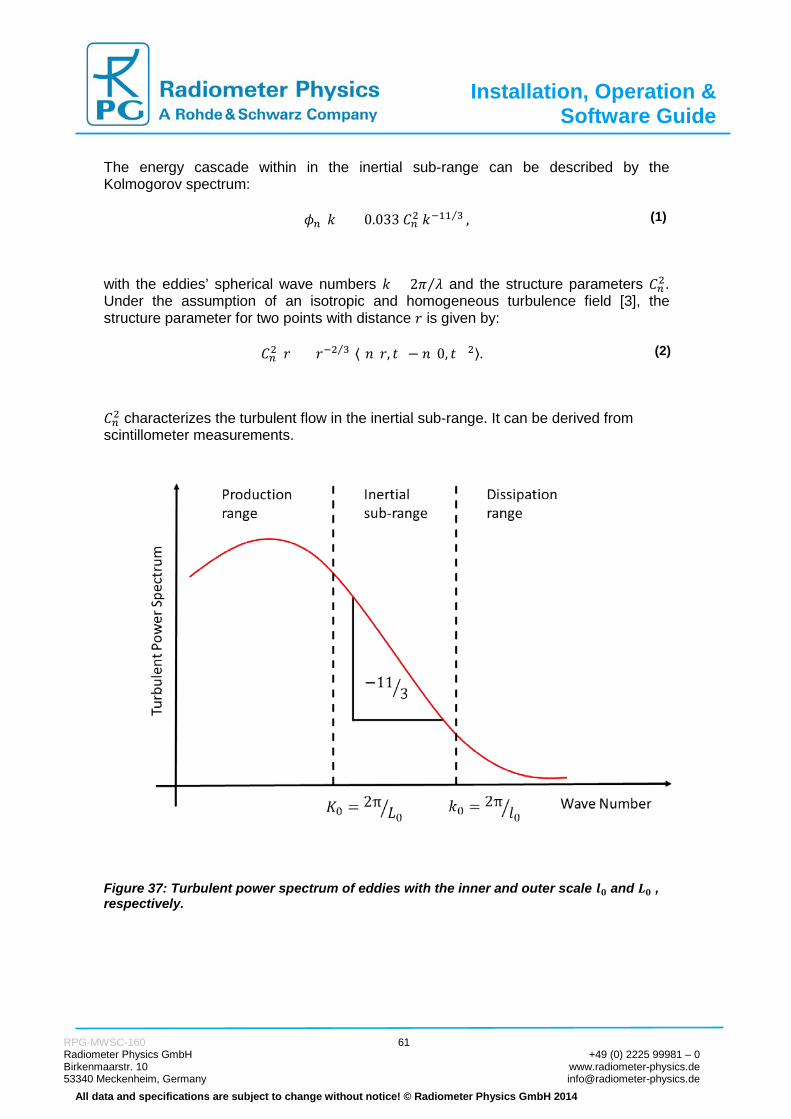
RPG-MWSC-160 Radiometer Physics GmbH Birkenmaarstr. 10 53340 Meckenheim, Germany
61 +49 (0) 2225 99981 – 0
www.radiometer-physics.de [email protected]
All data and specifications are subject to change without notice! © Radiometer Physics GmbH 2014
Installation, Operation & Software Guide
The energy cascade within in the inertial sub-range can be described by the Kolmogorov spectrum:
𝜙𝑛(𝑘) = 0.033 𝐶𝑛2 𝑘−11 3⁄ , (1)
with the eddies’ spherical wave numbers 𝑘 = 2𝜋 𝜆⁄ and the structure parameters 𝐶𝑛2. Under the assumption of an isotropic and homogeneous turbulence field [3], the structure parameter for two points with distance 𝑟 is given by:
𝐶𝑛2(𝑟) = 𝑟−2 3 ⁄ ⟨[𝑛(𝑟, 𝑡) − 𝑛(0, 𝑡)]2⟩. (2)
𝐶𝑛2 characterizes the turbulent flow in the inertial sub-range. It can be derived from scintillometer measurements.
Figure 37: Turbulent power spectrum of eddies with the inner and outer scale 𝒍𝟎 and 𝑳𝟎 , respectively.

RPG-MWSC-160 Radiometer Physics GmbH Birkenmaarstr. 10 53340 Meckenheim, Germany
62 +49 (0) 2225 99981 – 0
www.radiometer-physics.de [email protected]
All data and specifications are subject to change without notice! © Radiometer Physics GmbH 2014
Installation, Operation & Software Guide
5.2 The Scintillation Signal A scintillometer observing at a single wave length 𝜆 consists of a single transmitter (Tx) that emits a signal of constant intensity 𝐼𝜆 and a receiver (Rx) that records the signal fluctuations. The distance between the transmitter and the receiver is called the path length 𝐿 (Figure 38).
Figure 38: Signal path 𝑳 and first Fresnel zone with the maximum radius 𝑭 (Fresnel length). The observed signal fluctuations are due to turbulent structures of the atmospheric refractive index. Under the assumption of Taylor’s theorem a frozen turbulent is advected through the measurement path by the mean cross wind (Figure 39). This means that the spatial structure of the turbulent flow - expressed by the structure parameter 𝐶𝑛2 (2) - can be captured by recording the time series of the scintillation signal [4]. However, this is only true as long as the eddies observed by the scintillometer lie within the inertial sub-range of the turbulence spectrum.
Figure 39: Taylor’s theorem – the cross wind advects the frozen turbulence field through the scintillometer beam.

RPG-MWSC-160 Radiometer Physics GmbH Birkenmaarstr. 10 53340 Meckenheim, Germany
63 +49 (0) 2225 99981 – 0
www.radiometer-physics.de [email protected]
All data and specifications are subject to change without notice! © Radiometer Physics GmbH 2014
Installation, Operation & Software Guide
In order to validate this assumption the so-called Fresnel length, which combines wave length 𝜆 and 𝐿, is introduced:
𝐹 = √𝜆 𝐿 . (3)
𝐹 is the maximum diameter of the first Fresnel zone (Figure 5). The first Fresnel zone is an ellipsoid with the transmitter and receiver units in the focal spots. It characterizes the area where most of the scintillation signal is generated. Therefore, a clean scintillation signal can only be observed when the first Fresnel zone is free of obstacles. Any signals that originate from the edges of the first Fresnel zone interfere destructively with the signal coming straight from the transmitter. As signals originating from the middle of the path dominate the total scintillation signal (Figure 8), 𝐹 reflects the eddy size that most effectively contributes to the scintillation signal. This means that the Kolmogorov spectrum (equation (1)) can be applied for:
𝑙0 < 𝐹 < 𝐿0 . (4)
The observed scintillation signal combines large scale effects due to refraction (eddies as focusing lenses) and diffraction (bending around eddies). At the lower of the eddy spectrum observations are constrained by the inner scale 𝑙0. In case of 𝐹 ≪ 𝑙0 refraction dominates. Otherwise, diffraction is the dominating process. For microwave frequencies, 𝐹 is so large that diffraction always dominates [5]. On the other end, the outer scale 𝐿0 is in the order of the observation height above the surface [6]. This means in case the path height is too small compared to the path length, outer scale effects may affect MWS measurements, because the Fresnel length is in the same order. Also for LAS measurements at path lengths 𝐿 > 100𝑚 diffraction is the dominating process (𝐹 ≫ 𝑙0). (4) is easily met by optical scintillometers. In case of Large Aperture Scintillometers (LAS), the inertial sub-range is more constrained by the antenna’s aperture diameter 𝐷 [6]:
20𝑙0 < 𝐷 < 10𝐿0 . (5)
This means, 𝐷 has to be large enough to efficiently supress inner scale effects. In this case, small scale turbulence is effectively averaged out across the antenna aperture (equations 18-20). The scintillation signal is given by the variance 𝜎ln (𝐼𝜆)
2 of logarithmic intensity fluctuations. A theoretical value of the measured variance is given by the solution of the wave equation using Rytov’s perturbation method. For spherical waves that propagates from a point source to a point detector through a statistically homogenous and isotropic medium it is given by [7]:
𝜎ln (𝐼𝜆)2 = 4𝜋² 𝑘𝜆2 �𝑑𝑑
𝐿
0
� 𝑑𝑘∞
0
𝑘 𝜙(𝑘) 𝑠𝑠𝑛2 �𝑑𝐿 (𝐿 − 𝑑)𝑘²
2 𝑘𝜆� ,
(6)

RPG-MWSC-160 Radiometer Physics GmbH Birkenmaarstr. 10 53340 Meckenheim, Germany
64 +49 (0) 2225 99981 – 0
www.radiometer-physics.de [email protected]
All data and specifications are subject to change without notice! © Radiometer Physics GmbH 2014
Installation, Operation & Software Guide
where 𝑘𝜆 = 2𝜋 𝜆⁄ is the spherical wave number of the observed wave length. Equation (6 relates the observed variances to the turbulence spectrum 𝜙(𝑘). All other parameters are determined by the measurement setup. Under the condition that the scintillometer measures within the inertial sub-range (equation (4)), the measured variance 𝜎ln (𝐼𝜆)
2 provides the path averaged structure parameter ⟨𝐶𝑛2⟩. ⟨𝐶𝑛2⟩ can be derived from the variance of logarithmic signal Intensities 𝐼 and the measurement configuration by [1]:
�𝐶𝑛,𝐿𝐿𝐿�2 = 1.12 𝜎𝑙𝑛(𝐼𝐿𝐿𝐿)
2 𝐷7 3⁄ 𝐿−3 ,
(7)
�𝐶𝑛,𝑀𝑀𝐿�² = 2.015 𝜎𝑙𝑛(𝐼𝑀𝑀𝐿)2 𝑘−7 6⁄ 𝐿−11 6⁄ .
(8)
5.3 Sensible and Latent Heat Fluxes from Scintillometry The use of scintillometry for measurements of turbulent fluxes within the surface layer is a well-established technique. Optical scintillometers have been successfully operated for many years now. The problem is that using optical scintillometers alone allows to determine the sensible heat flux 𝐻, but not the latent heat flux 𝐿𝑉𝐸 due to evapotranspiration. However, 𝐿𝑉𝐸 makes up an important contribution to the surface energy balance (Figure 34). Obviously, both components should be observed at once. The simultaneous measurement of both fluxes is provided by Eddy-Covariance (EC) stations. However, these are point measurements, which provide limited spatial representativeness and require relatively long integration times. In contrast, scintillometers provide path-integrated measurements at shorter integration times. Like EC stations, scintillometry can provide direct measurements of the sensible heat flux 𝐻 and the latent heat flux 𝐿𝑉𝐸 at the same time by combining an optical scintillometer with a microwave scintillometer like the RPG-MWSC-160. The combined system records time series of intensity fluctuations are simultaneously for both wave lengths. This allows the evaluation of not only the optical and microwave signal alone, but also the co-spectrum of both instruments. This allows for an independent calculation of sensible and latent heat fluxes at once [8]. The concept of the combined scintillometer systems is to … 1. … relate three measured (co)variances to three structure parameters of the
refractive index.
2. … use measurements of temperature and humidity to transfer the structure parameters of the refractive index to three structure parameters that describe the turbulent temperature and humidity field.
3. … apply the Monin-Obukhov Similarity Theory (MOST) to the structure parameters of temperature and humidity field to estimate the sensible and latent heat flux.

RPG-MWSC-160 Radiometer Physics GmbH Birkenmaarstr. 10 53340 Meckenheim, Germany
65 +49 (0) 2225 99981 – 0
www.radiometer-physics.de [email protected]
All data and specifications are subject to change without notice! © Radiometer Physics GmbH 2014
Installation, Operation & Software Guide
In following section gives a detailed description of this the process, which his implemented in the operating software.
5.4 The Data Processing Chain This chapter describes the theoretical basis of the RPG-MWSC-160 software’s (chapter 4) data processing chain: Starting with measured signal intensities and ending with the determination of sensible and latent heat fluxes 𝐻 and 𝐿𝑉𝐸. In large parts the data evaluation follows the publication of Lüdi et al. (2005) [8] who introduce a method that combines a Large Aperture Scintillometer (LAS) and a MicroWave Scintillometer (MWS). The combined Optical/Microwave System (OMS) method uses the covariance system of the signal intensities measured at each wave length. This method is superior to the Two-wave-length method [3], because it does not depend on the assumption of a constant correlation between temperature and humidity fluctuations. Figure 40 gives an overview on the complete data processing chain.
Figure 40: Scheme of RPG-MWSC-160 data processing: from signal intensities to heat fluxes.

RPG-MWSC-160 Radiometer Physics GmbH Birkenmaarstr. 10 53340 Meckenheim, Germany
66 +49 (0) 2225 99981 – 0
www.radiometer-physics.de [email protected]
All data and specifications are subject to change without notice! © Radiometer Physics GmbH 2014
Installation, Operation & Software Guide
5.4.1 From Signal Variances to Structure Parameters Both receivers of the OMS system provide a detector voltage that is proportional to the observed signal intensities. The variances over a given time interval of the logarithmic intensities 𝐼𝐿𝐿𝐿 and 𝐼𝑀𝑀𝐿 are:
𝜎²LAS = ��𝐼𝐿𝐿𝐿𝐼𝐿𝐿𝐿0 � − �
𝐼𝐿𝐿𝐿𝐼𝐿𝐿𝐿0 ����������
�
2��������������������������
(9)
𝜎²MWS = ��𝐼𝑀𝑀𝐿
𝐼𝑀𝑀𝐿0 � − �
𝐼𝑀𝑀𝐿
𝐼𝑀𝑀𝐿0 �
�����������
2�����������������������������
(10)
The integration time interval has to cover the whole scintillation down to frequencies of approximately 0.01𝐻𝐻. The covariance of the two signals is given by:
𝜎𝑂𝑀𝐿 = ��𝐼𝐿𝐿𝐿𝐼𝐿𝐿𝐿0 � − �
𝐼𝐿𝐿𝐿𝐼𝐿𝐿𝐿0 ����������
� ��𝐼𝑀𝑀𝐿
𝐼𝑀𝑀𝐿0 � − �
𝐼𝑀𝑀𝐿
𝐼𝑀𝑀𝐿0 �
�����������
�����������������������������������������������������
(11)
The signal levels 𝐼𝐿𝐿𝐿0 and 𝐼𝑀𝑀𝐿
0 are used to scale the scintillation signals. They are provided by a running average value of the raw signal. The running mean period is user-selectable. The scaling makes the scintillation signal independent of the absolute detector level and includes acts as a high pass filter of the raw signal. The filtering effect is valuable used to exclude gain drifts and separates the scintillation signal from atmospheric absorption processes [9]. The latter aspect is particularly important for the microwave signal (water vapor absorption). When equation (6) is applied to the OMS system, the following theoretical values for the measured (co)variances is given by [8]:
𝜎𝐿𝐿𝐿2 = 8.448𝜋² 𝑘𝐿𝐿𝐿2 �𝑑𝑑𝐿
0
� 𝑑𝑘∞
0
𝑘−8 3⁄ 𝐻𝐿𝐿𝐿 𝐹𝐿𝐿𝐿 𝐶𝑛,𝐿𝐿𝐿2 ,
(12)
𝜎𝑀𝑀𝐿2 = 8.448𝜋² 𝑘𝑀𝑀𝐿
2 �𝑑𝑑� 𝑑𝑘∞
0
𝐿
0
𝑘−8 3⁄ 𝐻𝑀𝑀𝐿 𝐹𝑀𝑀𝐿 𝐶𝑛,𝑀𝑀𝐿2 ,
(13)
𝜎𝑂𝑀𝐿 = 8.448𝜋² 𝑘𝐿𝐿𝐿 𝑘𝑀𝑀𝐿 �𝑑𝑑𝐿
0
� 𝑑𝑘∞
0
𝑘−8 3⁄ 𝐻𝑂𝑀𝐿 𝐹𝑂𝑀𝐿 𝐽0(𝑘|𝑑|) 𝐶𝑛,𝑂𝑀𝐿 ,
(14)
with spherical wave numbers 𝑘 = 2𝜋 𝜆⁄ , the first order Bessel function 𝐽0, the beam displacement 𝑑 along the path 𝐿, and :
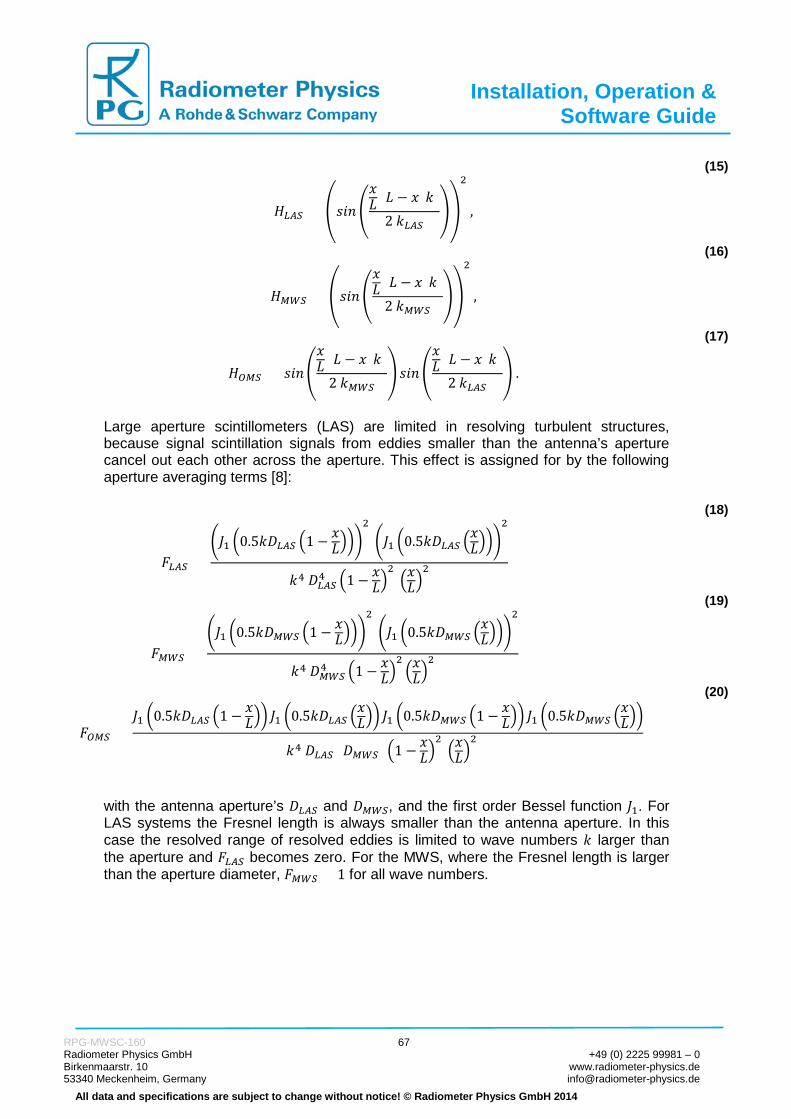
RPG-MWSC-160 Radiometer Physics GmbH Birkenmaarstr. 10 53340 Meckenheim, Germany
67 +49 (0) 2225 99981 – 0
www.radiometer-physics.de [email protected]
All data and specifications are subject to change without notice! © Radiometer Physics GmbH 2014
Installation, Operation & Software Guide
𝐻𝐿𝐿𝐿 = �𝑠𝑠𝑛 �𝑑𝐿 (𝐿 − 𝑑)𝑘²
2 𝑘𝐿𝐿𝐿��
2
,
(15)
𝐻𝑀𝑀𝐿 = �𝑠𝑠𝑛�𝑑𝐿 (𝐿 − 𝑑)𝑘²
2 𝑘𝑀𝑀𝐿��
2
,
(16)
𝐻𝑂𝑀𝐿 = 𝑠𝑠𝑛�𝑑𝐿 (𝐿 − 𝑑)𝑘²
2 𝑘𝑀𝑀𝐿�𝑠𝑠𝑛�
𝑑𝐿 (𝐿 − 𝑑)𝑘²
2 𝑘𝐿𝐿𝐿� .
(17)
Large aperture scintillometers (LAS) are limited in resolving turbulent structures, because signal scintillation signals from eddies smaller than the antenna’s aperture cancel out each other across the aperture. This effect is assigned for by the following aperture averaging terms [8]:
𝐹𝐿𝐿𝐿 = �𝐽1 �0.5𝑘𝐷𝐿𝐿𝐿 �1 − 𝑑
𝐿���2
�𝐽1 �0.5𝑘𝐷𝐿𝐿𝐿 �𝑑𝐿���
2
𝑘4 𝐷𝐿𝐿𝐿4 �1 − 𝑑𝐿�
2 �𝑑𝐿�
2
(18)
𝐹𝑀𝑀𝐿 = �𝐽1 �0.5𝑘𝐷𝑀𝑀𝐿 �1 − 𝑑
𝐿���2
�𝐽1 �0.5𝑘𝐷𝑀𝑀𝐿 �𝑑𝐿���
2
𝑘4 𝐷𝑀𝑀𝐿4 �1 − 𝑑
𝐿�2�𝑑𝐿�
2
(19)
𝐹𝑂𝑀𝐿 = 𝐽1 �0.5𝑘𝐷𝐿𝐿𝐿 �1 − 𝑑
𝐿�� 𝐽1 �0.5𝑘𝐷𝐿𝐿𝐿 �𝑑𝐿�� 𝐽1 �0.5𝑘𝐷𝑀𝑀𝐿 �1 − 𝑑
𝐿�� 𝐽1 �0.5𝑘𝐷𝑀𝑀𝐿 �𝑑𝐿��
𝑘4 𝐷𝐿𝐿𝐿² 𝐷𝑀𝑀𝐿² �1 − 𝑑𝐿�
2 �𝑑𝐿�
2
(20)
with the antenna aperture’s 𝐷𝐿𝐿𝐿 and 𝐷𝑀𝑀𝐿, and the first order Bessel function 𝐽1. For LAS systems the Fresnel length is always smaller than the antenna aperture. In this case the resolved range of resolved eddies is limited to wave numbers 𝑘 larger than the aperture and 𝐹𝐿𝐿𝐿 becomes zero. For the MWS, where the Fresnel length is larger than the aperture diameter, 𝐹𝑀𝑀𝐿 = 1 for all wave numbers.

RPG-MWSC-160 Radiometer Physics GmbH Birkenmaarstr. 10 53340 Meckenheim, Germany
68 +49 (0) 2225 99981 – 0
www.radiometer-physics.de [email protected]
All data and specifications are subject to change without notice! © Radiometer Physics GmbH 2014
Installation, Operation & Software Guide
The double integrals of equations 12-14 include the normalized spatial weighting functions:
𝑊𝐿𝐿𝐿(𝑑) = � 𝑑𝑘∞
0
𝑘−8 3⁄ 𝐻𝐿𝐿𝐿 𝐹𝐿𝐿𝐿 �𝑑𝑑𝐿
0
� 𝑑𝑘∞
0
𝑘−8 3⁄ 𝐻𝐿𝐿𝐿 𝐹𝐿𝐿𝐿�
(21)
𝑊𝑀𝑀𝐿(𝑑) = � 𝑑𝑘∞
0
𝑘−8 3⁄ 𝐻𝑀𝑀𝐿 𝐹𝑀𝑀𝐿 �𝑑𝑑𝐿
0
� 𝑑𝑘∞
0
𝑘−8 3⁄ 𝐻𝑀𝑀𝐿 𝐹𝑀𝑀𝐿�
(22)
𝑊𝑂𝑀𝐿(𝑑) = � 𝑑𝑘∞
0
𝑘−8 3⁄ 𝐻𝑂𝑀𝐿 𝐹𝑂𝑀𝐿 𝐽0(𝑘|𝑑(𝑑)|) �𝑑𝑑𝐿
0
� 𝑑𝑘∞
0
𝑘−8 3⁄ 𝐻𝑂𝑀𝐿 𝐹𝑂𝑀𝐿 𝐽0(𝑘|𝑑(𝑑)|)�
(23)
Figure 41: Normalized path weighting functions. The weighting functions give the contribution of different position on the path to the total scintillation signal. For symmetric instrument setups the weighting function peak in the middle of the path (Figure 41). This reflects the fact that eddies with radii in the order of the Fresnel length (Figure 38) contribute most effectively to the scintillation signal.

RPG-MWSC-160 Radiometer Physics GmbH Birkenmaarstr. 10 53340 Meckenheim, Germany
69 +49 (0) 2225 99981 – 0
www.radiometer-physics.de [email protected]
All data and specifications are subject to change without notice! © Radiometer Physics GmbH 2014
Installation, Operation & Software Guide
Furthermore, the dependency of equations 12-14 on the wave number 𝑘 can be extracted by defining the spectra filter functions [8]:
𝐺𝐿𝐿𝐿(𝑘) = 8.448𝜋² 𝑘𝐿𝐿𝐿2 �𝑑𝑑𝐿
0
𝑘−8 3⁄ 𝐻𝐿𝐿𝐿 𝐹𝐿𝐿𝐿
(24)
𝐺𝑀𝑀𝐿(𝑘) = 8.448𝜋² 𝑘𝑀𝑀𝐿2 �𝑑𝑑
𝐿
0
𝑘−8 3⁄ 𝐻𝑀𝑀𝐿 𝐹𝑀𝑀𝐿
(25)
𝐺𝑂𝑀𝐿(𝑘) = 8.448𝜋² 𝑘𝐿𝐿𝐿 𝑘𝑀𝑀𝐿 �𝑑𝑑𝐿
0
𝑘−8 3⁄ 𝐻𝑂𝑀𝐿 𝐹𝑂𝑀𝐿 𝐽0(𝑘|𝑑(𝑑)|)
(26)
Figure 42: The Spectral Filter functions 𝑮 depend on the measurement setup ( 𝑳 =𝟓𝟎𝟎𝟎𝟓, 𝒅���⃗ = (−𝟎.𝟓, +𝟎.𝟓), 𝝀𝑳𝑳𝑳 = 𝟖𝟖𝟎𝟖𝟓,𝝀𝑴𝑴𝑳 = 𝟏.𝟖𝟖𝟓𝟓,𝑫𝑳𝑳𝑳 = 𝟎.𝟏𝟓𝟓,𝑫𝑴𝑴𝑳 = 𝟎.𝟑𝟎𝟓).

RPG-MWSC-160 Radiometer Physics GmbH Birkenmaarstr. 10 53340 Meckenheim, Germany
70 +49 (0) 2225 99981 – 0
www.radiometer-physics.de [email protected]
All data and specifications are subject to change without notice! © Radiometer Physics GmbH 2014
Installation, Operation & Software Guide
For path averaged structure parameters �𝐶𝑛,𝐿𝐿𝐿�
2, �𝐶𝑛,𝑀𝑀𝐿�2, �𝐶𝑛,𝑂𝑀𝐿� equations 4-6
transform to:
�𝐶𝑛,𝐿𝐿𝐿�2 = 𝜎𝐿𝐿𝐿2 � 𝑑𝑘
∞
0
𝐺𝐿𝐿𝐿(𝑘)�
(27)
�𝐶𝑛,𝑀𝑀𝐿�2 = 𝜎𝑀𝑀𝐿
2 � 𝑑𝑘∞
0
𝐺𝑀𝑀𝐿(𝑘)�
(28)
�𝐶𝑛,𝑂𝑀𝐿�= 𝜎𝑂𝑀𝐿 � 𝑑𝑘∞
0
𝐺𝑂𝑀𝐿(𝑘)�
(29)
While 𝜎𝐿𝐿𝐿2 ,𝜎𝑀𝑀𝐿
2 ,𝜎𝑂𝑀𝐿 are provided by the scintillation measurements, the integral over G does only depend on the geometrical measurement configuration, the observed wave lengths and the antenna apertures.
5.4.2 Structure Parameters of Temperature and Humidity Once the structure parameters of the refractive index 𝐶𝑛 have been determined, the turbulence field has to be expressed in terms of temperature and humidity, because the heat fluxes are mainly determined by fluctuations of these parameters.
𝐶𝑛,𝐿𝐿𝐿2 =
𝐴𝑇,𝐿𝐿𝐿²𝑇�²
𝐶𝑇2 + 2 𝐴𝑇,𝐿𝐿𝐿 𝐴𝑇,𝐿𝐿𝐿
𝑇 �𝑞�𝐶𝑇𝑇 +
𝐴𝑇,𝐿𝐿𝐿²𝑞�²
𝐶𝑇2 ,
(30)
𝐶𝑛,𝑀𝑀𝐿2 =
𝐴𝑇,𝑀𝑀𝐿²𝑇�²
𝐶𝑇2 + 2 𝐴𝑇,𝑀𝑀𝐿 𝐴𝑇,𝑀𝑀𝐿
𝑇 �𝑞�𝐶𝑇𝑇 +
𝐴𝑇,𝑀𝑀𝐿²𝑞�²
𝐶𝑇2 ,
(31)
𝐶𝑛,𝑂𝑀𝐿 =𝐴𝑇,𝑂𝑀𝐿²𝑇�²
𝐶𝑇2 + 2 𝐴𝑇,𝑂𝑀𝐿 𝐴𝑇,𝑂𝑀𝐿
𝑇 �𝑞�𝐶𝑇𝑇 +
𝐴𝑇,𝑂𝑀𝐿²𝑞�²
𝐶𝑇2 ,
(32)
where 𝑳-coefficients include the partial derivatives of the refractive index depending mainly on temperature and humidity [10] [11]. There are many different set available in the literature. Therefore, the user is able to set the coefficients by hand. The default values for 𝑳𝑻,𝑳𝑳𝑳,𝑳𝒒,𝑳𝑳𝑳,𝑳𝑻,𝑴𝑴𝑳, and 𝑳𝒒,𝑴𝑴𝑳 used by the software are taken by from [12] Reference 𝑳-coefficients 𝐴𝑇,𝐿𝐿𝐿 𝐴𝑇,𝐿𝐿𝐿 𝐴𝑇,𝑀𝑀𝐿 𝐴𝑇,𝑀𝑀𝐿 Ward et al.2013 [12] (spec.) −𝟐.𝟕𝟎 ∙ 𝟏𝟎−𝟒 −𝟖.𝟖𝟓 ∙ 𝟏𝟎−𝟕 −𝟒.𝟏𝟑 ∙ 𝟏𝟎−𝟒 𝟕.𝟏𝟒 ∙ 𝟏𝟎−𝟓 Ward et al. 2013 [12] (abs.) −2.71 ∙ 10−4 −6.89 ∙ 10−7 −3.42 ∙ 10−4 7.18 ∙ 10−5 Table 2: Coefficients for optical and microwave frequencies for standard atmospheric conditions (𝑻 = 𝟐𝟖𝟖 𝑲, 𝒑 = 𝟏𝟎𝟎𝟎 𝒉𝒉𝒉, 𝒒 = 𝟎.𝟎𝟏𝟎 𝒌𝒌 𝒌𝒌 − 𝟏). The software uses be coefficients based on the conservation of specific humidity (bold) instead of absolute humidity [12].

RPG-MWSC-160 Radiometer Physics GmbH Birkenmaarstr. 10 53340 Meckenheim, Germany
71 +49 (0) 2225 99981 – 0
www.radiometer-physics.de [email protected]
All data and specifications are subject to change without notice! © Radiometer Physics GmbH 2014
Installation, Operation & Software Guide
The combined equation 32 uses the arithmetic mean values:
𝐴𝑇,𝑂𝑀𝐿 = 0.5�𝐴𝑇,𝐿𝐿𝐿 + 𝐴𝑇,𝑀𝑀𝐿 � (33)
𝐴𝑇,𝑂𝑀𝐿 = 0.5�𝐴𝑇,𝐿𝐿𝐿 + 𝐴𝑇,𝑀𝑀𝐿 � (34) The system of the three equations (30-32) can be solved when using an OMS system, because the combined method provides three structure parameters 𝐶𝑛. The corresponding coefficient matrix 𝑀 is invertible when
𝐴𝑇,𝐿𝐿𝐿 𝐴𝑇,𝑀𝑀𝐿
𝐴𝑇,𝑀𝑀𝐿 𝐴𝑇,𝐿𝐿𝐿≠ 1 ,
and gives the solution for 𝐶𝑇2,𝐶𝑇𝑇 ,𝐶𝑇2 [8] :
�𝐶𝑇2𝐶𝑇𝑇𝐶𝑇2
� = 𝑀−1 � 𝐶𝑛,𝐿𝐿𝑜2
𝐶𝑛,𝑀𝑀𝐿2
𝐶𝑛,𝑂𝑀𝐿
� , (35)
with [9] [11]:
𝑀−1 =1
�𝐴𝑇,𝐿𝐿𝐿 𝐴𝑇,𝑀𝑀𝐿 − 𝐴𝑇,𝑀𝑀𝐿 𝐴𝑇,𝐿𝐿𝐿�2 ∙
�𝐴𝑇,𝑀𝑀𝐿² 𝐴𝑇,𝐿𝐿𝐿² −2 𝐴𝑇,𝐿𝐿𝐿𝐴𝑇,𝑀𝑀𝐿
−𝐴𝑇,𝑀𝑀𝐿𝐴𝑇,𝑀𝑀𝐿 −𝐴𝑇,𝐿𝐿𝐿𝐴𝑇,𝐿𝐿𝐿 𝐴𝑇,𝐿𝐿𝐿𝐴𝑇,𝑀𝑀𝐿 + 𝐴𝑇,𝑀𝑀𝐿𝐴𝑇,𝐿𝐿𝐿
𝐴𝑇,𝑀𝑀𝐿² 𝐴𝑇,𝐿𝐿𝐿² −2 𝐴𝑇,𝐿𝐿𝐿𝐴𝑇,𝑀𝑀𝐿
� . (36)
5.4.3 MOST– from Structure Parameters to Heat Fluxes The Monin-Obukhov Scaling Theory (MOST) provides a relation between the structure functions and the heat fluxes for the horizontally homogenous turbulent surface layer. A central parameter of MOST is the Obukhov length 𝐿𝑂𝑜. For the unstable surface layer, 𝐿𝑂𝑜 gives the negative of the height below which the turbulence is predominately generated by wind shear [13]. Above −𝐿𝑂𝑜 the production is dominated by buoyancy. In combination with the observation height 𝐻, 𝐿𝑂𝑜 is used to define the dimensionless stability parameter 𝜁 = 𝐻/𝐿𝑂𝑜. 𝜁 < 0 characterizes the unstable surface layer, while for 𝜁 ≥ 0, the surface layer is stable. The relation between the structure parameters 𝐶𝑇2 and 𝐶𝑇2 is given by empirically determined MOST functions 𝑓𝑇(𝜁) and 𝑓𝑇(𝜁):
𝑧2 3⁄ 𝐶𝑇²𝑇∗²
= 𝑓𝑇(𝜁) , (37) 𝑧2 3⁄ 𝐶𝑞²𝑇∗²
= 𝑓𝑇(𝜁) , (38)

RPG-MWSC-160 Radiometer Physics GmbH Birkenmaarstr. 10 53340 Meckenheim, Germany
72 +49 (0) 2225 99981 – 0
www.radiometer-physics.de [email protected]
All data and specifications are subject to change without notice! © Radiometer Physics GmbH 2014
Installation, Operation & Software Guide
with the scaling variables:
𝑇∗ = −𝐻
�̅� 𝑐𝑝 𝑢∗ ,
(39)
𝑞∗ = −(1 − 𝑞�)𝐿𝑉𝐸
�̅� 𝐿𝑉 𝑢∗ ,
(40)
𝑢∗ =𝜅 𝑢
ln �𝐻 − 𝑑0𝐻0
� − 𝛹𝑚(𝜁) + 𝛹𝑚(𝜁0) .
(41)
𝑢∗ is the friction velocity, 𝐻0 is the roughness length and 𝑑0 is the zero displacement height. 𝐻0 and 𝑑0 are used to characterize the surface (section vi). 𝛹𝑚(𝜁) and 𝛹𝑚(𝜁0) are stability corrections [4]:
𝑑𝑚 = (1 − 16 𝜁)1 4� (42)
𝛹𝑚(𝜁) = 2 ln �1+𝑥𝑚2� + ln �1+𝑥𝑚
2
2�+ atan(𝑑𝑚) + 𝜋
2 (43)
for unstable conditions (𝜁 < 0) and
𝛹𝑚(𝜁) = 1 − (1 + 6.25 𝜁)4 5� (44)
for stable conditions (𝜁 ≥ 0). The MOST functions are divided into two classes:
𝑓𝑇(𝜁) = 𝑑𝑇,1 (1− 𝑑𝑇,2 𝜁)−2 3⁄ , (45)
𝑓𝑇(𝜁) = 𝑑𝑇,1 (1− 𝑑𝑇,2 𝜁)−2 3⁄ (46) for the unstable surface layer (𝜁 < 0) and
𝑓𝑇(𝜁) = 𝑑𝑇,1 (1 + 𝑑𝑇,2 𝜁)+2 3⁄ , (47)
𝑓𝑇(𝜁) = 𝑑𝑇,1 (1 + 𝑑𝑇,2 𝜁)+2 3 ⁄ (48) for the stable surface layer (ζ ≥ 0). The fit parameters 𝑑𝑇,1, 𝑑𝑇,2,𝑑𝑇,1 and 𝑑𝑇,2 are usually determined from Eddy-covariance measurements. Table 3 gives a short list of references, which include different parameter sets. The default values used by the operating software are taken from [14].

RPG-MWSC-160 Radiometer Physics GmbH Birkenmaarstr. 10 53340 Meckenheim, Germany
73 +49 (0) 2225 99981 – 0
www.radiometer-physics.de [email protected]
All data and specifications are subject to change without notice! © Radiometer Physics GmbH 2014
Installation, Operation & Software Guide
MOST coefficients surface layer conditions unstable stable Reference 𝑑𝑇,1 𝑑𝑇,2 𝑑𝑇,1 𝑑𝑇,2 𝑑𝑇,1 𝑑𝑇,2 𝑑𝑇,1 𝑑𝑇,2 Wyngaard and Izumi 1971 [15] 4.9 7.0 - - 4.9 2.75 - - Hartogensis and de Bruin [16] - - - - 4.7 1.6 - - Li et al. 2012 [14] 6.7 14.9 3.5 4.5 4.5 1.3 3.5 2.4 Table 3: MOST coefficients from different publications. Default values of the operating software are given in bold numbers. The scaled variables 𝑇∗, 𝑞∗ and 𝑢∗ are used to iteratively determine the sensible heat flux 𝐻 and the latent heat flux 𝐿𝑉𝐸. The starting point is an initial guess for 𝐻 and 𝐿𝑉𝐸. For known flux signs, the stability parameter 𝜁 = 𝐻 𝐿𝑂𝑜⁄ is determined from the Obukhov length
𝐿𝑂𝑜 = 𝑢∗² 𝑇�𝑔 𝜅 𝑇∗
, (49)
with the mean environmental temperature 𝑇�, the gravitational acceleration 𝑔 and the von-Karman constant 𝜅 = 0.4. The iteration process converges to scales 𝑇∗ and 𝑞∗ that give the following fluxes:
𝐻 = −𝐻
�̅� 𝑐𝑝 𝑢∗ ,
(50)
𝐿𝑉𝐸 = −�̅�
(1 − 𝑞�) 𝐿𝑉 𝑢∗ 𝑞∗ .
(51)
Then mean specific humidity 𝑞� and the mean air density �̅� are determined from external in-situ measurements. However, the differentiation between stable and unstable conditions divides the flux calculations into two regimes. The stability of the surface layer is directly related to the direction of the sensible heat flux: ζ and H are always of opposite sign. Therefore, the sign of 𝐻 has to be known prior to the flux iteration. The ambiguity of the quadratic equations (37) does not allow determining the sign of H from the structure parameter 𝐶𝑇2. Therefore, scintillometer measurements are often complemented by other observations to determine the flux signs. Fortunately, this is not needed when using an OMS system, because the co-spectrum provides the correlated structure parameter 𝐶𝑇𝑇. This allows observing the correlation coefficient
𝑅𝑇𝑇 =𝐶𝑇𝑇
�𝐶𝑇2𝐶𝑇2 .
(52)
𝑅𝑇𝑇 ranges between -1 and + 1 and gives the linear correlation between temperature and humidity fluctuations. In the classical two-wavelength method [17], 𝑅𝑇𝑇 is set to +1 for unstable conditions and to -1 for stable conditions [3]. 𝑅𝑇𝑇 has the same sign as the product of sensible and latent heat flux 𝐻 ∙ 𝐿𝑉𝐸 [3]. While negative sensible heat fluxes coincide with temperature inversions, negative latent heat fluxes are due to the formation of dew. Nevertheless, even when the latent heat flux becomes negative the absolute value is usually small. Therefore, RPG-MWSC’s operating software assumes that the latent heat flux always has a positive sign (𝐿𝑉𝐸 > 0).

RPG-MWSC-160 Radiometer Physics GmbH Birkenmaarstr. 10 53340 Meckenheim, Germany
74 +49 (0) 2225 99981 – 0
www.radiometer-physics.de [email protected]
All data and specifications are subject to change without notice! © Radiometer Physics GmbH 2014
Installation, Operation & Software Guide
In this case, 𝑅𝑇𝑇 unambiguously provides the sign of the sensible heat flux 𝐻. Typically, unstable conditions result in positive sensible heat fluxes during the day, while 𝐻 becomes negative, when the stable surface layer is building up due to radiative cooling at night. Alternatively, strong evaporation may also lead to negative 𝐻. These cases can be identified by 𝑅𝑇𝑇 < 0 during the day.
5.4.4 Signal Saturation In weak turbulence, the measured LAS variance is proportional to the path-averaged structure parameter [18]:
�𝐶𝑛,𝐿𝐿𝐿�² = 1.12 𝜎ln(𝐼𝐿𝐿𝐿)2 𝐷7 3⁄ 𝐿−3. (53)
The proportionality is based on the single scattering approximation [1], which assumed that a wave front emitted by the transmitter is only disturbed once before reaching the receiver. This assumption breaks down, when turbulence becomes stronger [19]. As a consequence equations 12-14 are only valid for weak scattering which is limited by [19]:
𝜎ln(𝐼)2 < 0.3 . (54)
Beyond this limit – within the strong scattering regime - the signal variance is completely saturated and consequently does no longer increase with ⟨𝐶𝑛,𝐿𝐿𝐿⟩2 [20]. However, within an intermediate range the observed signals are only partially saturated. In contrast to the non-saturated signal, the variance is not proportional to the measured ⟨𝐶𝑛,𝐿𝐿𝐿⟩2 anymore, because multi-scattering effects degrade the coherence of the wave front. As a consequence, the signal contribution from eddies smaller than the Fresnel length increases [19]. For Kolmogorov turbulence (equation 1), smaller eddies contribute less to the total variance. Therefore, the observed variance starts to saturate. Following [1], the saturation free domain is further restricted by:
⟨𝐶𝑛,𝐿𝐿𝐿⟩2 < 0.193 𝐿−8 3⁄ 𝜆2 6⁄ 𝐷5 3⁄ . (55)
For the MWS system, which is much less affected by saturation, it is appropriate to use equation 54 alone to exclude saturation [9]. In the intermediate range the partially saturated LAS signal variance can be corrected by appending the following term to equations 12-14 [19][20]:
𝑀𝐿𝑇= 𝑒𝑑𝑒 �−48𝑘𝐿𝐿𝐿
2𝐿 �𝑘𝛹(𝑘) �1 − 𝐽0 �𝑘2𝐿𝐿(1−𝐿)
𝑘𝐿𝐿𝐿�� + ∫ 𝑑𝑘′∞
𝑘 𝛹(𝑘′)�1 − 𝐽0 �𝑘𝑘′𝐿𝐿(1−𝐿)
𝑘𝐿𝐿𝐿���� ,
(56)
with
Ψ(𝑘) = � 𝑑𝑘′∞
𝑘 Φ(𝑘′).
(57)

RPG-MWSC-160 Radiometer Physics GmbH Birkenmaarstr. 10 53340 Meckenheim, Germany
75 +49 (0) 2225 99981 – 0
www.radiometer-physics.de [email protected]
All data and specifications are subject to change without notice! © Radiometer Physics GmbH 2014
Installation, Operation & Software Guide
This correction neglects the impact of the inner scale and is – following [20] - the most appropriate saturation correction. Within RPG’s operating software, the correction is realized by a numerical look-up table that is automatically read during observations. The tables have been calculated for each of the compatible LAS systems. Additionally, observations that do not meet the saturation limits (equations 54, 55) are flagged.
5.4.5 Absorption Fluctuations As stated in section 5.4.1 the scintillation signal, can be separated from absorption fluctuations by normalizing the signal variance by a running mean value (equation 11). For the same purpose (in addition to cross wind detection) the LAS systems BLS900 and BLS2000 use a dual disk configuration. RPG-MWSC-160 fully supports this feature. RPG’s data processing of the dual disk system is equivalent to the processing that is applied by Scintec (compare manufacturer’s manual).
5.4.6 Effective Height When the OMS system is operated with almost constant beam heights over flat terrain, the observation height 𝐻𝑜𝑜𝑜 is the average instrument height above ground. However, for slant paths and over topography, the beam height 𝐻𝑜𝑒𝑏𝑚 depends on the path position 𝑑. In this case 𝐻𝑜𝑜𝑜 should be replaced by an effective height 𝐻𝑒𝑒𝑒 [21] (Figure 43). 𝐻𝑒𝑒𝑒 equals a constant observation height that reproduces the observed path averaged structure parameters ⟨𝐶𝑇⟩² and ⟨𝐶𝑇⟩² and can therefore be used to determine the fluxes 𝐻 and 𝐿𝑉𝐸. When the curvature effect and the stability is neglected, the effective height is calculated by [21]:
𝐻𝑒𝑒𝑒 = � 𝑑𝑑𝐿
0 𝐻𝑜𝑒𝑏𝑚(𝑑) ∙ 𝑊(𝑑).
(58)
𝐻𝑒𝑒𝑒 is calculated for the optical and microwave beam separately - using different weighting functions 𝑊𝐿𝐿𝐿 and 𝑊𝑀𝑀𝐿. For the OMS system the average value is used:
𝐻𝑒𝑒𝑒𝑂𝑀𝐿 = 0.5�𝐻𝑒𝑒𝑒𝐿𝐿𝐿 +𝐻𝑒𝑒𝑒𝑀𝑀𝐿�. (59)

RPG-MWSC-160 Radiometer Physics GmbH Birkenmaarstr. 10 53340 Meckenheim, Germany
76 +49 (0) 2225 99981 – 0
www.radiometer-physics.de [email protected]
All data and specifications are subject to change without notice! © Radiometer Physics GmbH 2014
Installation, Operation & Software Guide
Figure 43: Illustration of the effective height 𝑯𝒆𝒆𝒆 calculated for a slant path over topography.
5.4.7 Roughness Length and Zero-Displacement Height When heat fluxes are derived from scintillometer measurement, it is assumed that the observations are performed within the surface layer. The surface is characterized by heat fluxes that are constant with height and a logarithmic profile of the horizontal wind speed
𝑢(𝐻) =𝑢∗𝜅
ln �𝐻 − 𝑑0𝐻0
� , (60)
with the friction velocity 𝑢∗ and the von-Karman constant 𝜅 (section iii). The surface is described by the roughness length 𝐻0 and the zero-displacement height 𝑑0. 𝐻0 + 𝑑0 gives the height where the wind drops to zero due to surface friction. In case this layer is not known from wind profiler data, it has to be estimated. The roughness of the surface is determined by the size 𝐻 and distribution of roughness elements along the measurement path. The distribution is estimated by the average spacing 𝐻 between the roughness elements. For 𝑋 ≳ 𝐻, the displacement height 𝑑0 should be set to zero and landscape dependent values for 𝐻0 can be read from Table 4.

RPG-MWSC-160 Radiometer Physics GmbH Birkenmaarstr. 10 53340 Meckenheim, Germany
77 +49 (0) 2225 99981 – 0
www.radiometer-physics.de [email protected]
All data and specifications are subject to change without notice! © Radiometer Physics GmbH 2014
Installation, Operation & Software Guide
Terrain description 𝑋 𝐻⁄ 𝐻0 [𝑚] Open sea, Fetch at least 5 km 0.0002 Mud flats, snow; no vegetation, no obstacles
0.005
Open flat terrain; grass, few isolated obstacles
0.03
Low crops; occasional large obstacles >20 0.1 High crops; scattered obstacles 15-20 0.25 Parkland, bushes; numerous obstacles ≈10 0.5 Regular large obstacle coverage (suburb, forest)
1.0 City centre with high- and low-rise buildings
>2.0
Table 4: Roughness length 𝒛𝟎 for different landscapes from WMO CIMO guide [22]. However, if the roughness elements are densely packed, e.g. for observations over a dens crop field or forest, the vegetation with an average 𝐻𝑣𝑒𝑔 results in lifting the zero wind level by:
𝑑0 ≈ 0.7𝐻𝑣𝑒𝑔 . (61)
The remaining roughness is then characterized by
𝐻0 ≈ 0.1𝐻𝑣𝑒𝑔 . (62)
The most appropriate selection of 𝐻0 and 𝑑0 is illustrated in Figure 42: The settings for the roughness length d0 zero-displacement height z0 depend on.

RPG-MWSC-160 Radiometer Physics GmbH Birkenmaarstr. 10 53340 Meckenheim, Germany
78 +49 (0) 2225 99981 – 0
www.radiometer-physics.de [email protected]
All data and specifications are subject to change without notice! © Radiometer Physics GmbH 2014
Installation, Operation & Software Guide
Figure 44: The settings for the roughness length 𝒅𝟎 zero-displacement height 𝒛𝟎 depend on characteristic surface irregularities. 𝑯𝒗𝒆𝒌 is the vegetation height and 𝑯𝒐𝒐𝒐 is the observation height.
5.4.8 References [1] T. Wang, G. R. Ochs, and S. F. Clifford, “A saturation-resistant optical scintillometer to
measure C2n,” J. Opt. Soc. Am., vol. 68, no. 3, pp. 334–338, Mar. 1978. [2] W. M. L. Meijninger, O. K. Hartogensis, W. Kohsiek, J. C. B. Hoedjes, R. M. Zuurbier,
and H. A. R. D. Bruin, “Determination of Area-Averaged Sensible Heat Fluxes with a Large Aperture Scintillometer over a Heterogeneous Surface – Flevoland Field Experiment,” Bound.-Layer Meteorol., vol. 105, no. 1, pp. 37–62, Oct. 2002.
[3] R. J. Hill, “Algorithms for Obtaining Atmospheric Surface-Layer Fluxes from Scintillation Measurements,” J Atmos Ocean Tech, vol. 14, pp. 456–467, 1997.
[4] O. Hartogensis, “Exploring Scintillometry in the Stable Atmospheric Surface Layer,” Wageningen, 2006.
[5] A. J. H. van Kesteren, “Measuring water-vapour and carbon-dioxide Fluxes at Field scales with Scintillometry,” Wageningen, 2012.

RPG-MWSC-160 Radiometer Physics GmbH Birkenmaarstr. 10 53340 Meckenheim, Germany
79 +49 (0) 2225 99981 – 0
www.radiometer-physics.de [email protected]
All data and specifications are subject to change without notice! © Radiometer Physics GmbH 2014
Installation, Operation & Software Guide
[6] A. F. Moene, W. M. L. Meijninger, O. K. Hartogensis, W. Kohsiek, and H. A. R. De Bruin,
“A review of the relationships describing the signal of a Large Aperture Scintillometer.” [7] R. S. Lawrence and J. W. Strohbehn, “A survey of clear-air propagation effects relevant
to optical communications,” Proc. IEEE, vol. 58, no. 10, pp. 1523–1545, Oct. 1970. [8] A. Lüdi, F. Beyrich, and C. Mätzler, “Determination of the Turbulent Temperature–
Humidity Correlation from Scintillometric Measurements,” Bound.-Layer Meteorol., vol. 117, no. 3, pp. 525–550, Dec. 2005.
[9] W. M. L. Meijninger, F. Beyrich, A. Lüdi, W. Kohsiek, and H. A. R. D. Bruin, “Scintillometer-Based Turbulent Fluxes of Sensible and Latent Heat Over a Heterogeneous Land Surface – A Contribution to Litfass-2003,” Bound.-Layer Meteorol., vol. 121, no. 1, pp. 89–110, Oct. 2006.
[10] E. L. Andreas, “Estimating C_n^2 over snow and sea ice from meteorological data,” J. Opt. Soc. Am. A, vol. 5, no. 4, p. 481, Apr. 1988.
[11] E. L. Andreas, “Three-Wavelength Method of Measuring Path-Averaged Turbulent Heat Fluxes,” J. Atmospheric Ocean. Technol., vol. 7, no. 6, pp. 801–814, Dec. 1990.
[12] H. C. Ward, J. G. Evans, O. K. Hartogensis, A. F. Moene, H. A. R. De Bruin, and C. S. B. Grimmond, “A critical revision of the estimation of the latent heat flux from two-wavelength scintillometry,” Q. J. R. Meteorol. Soc., p. n/a–n/a, 2013.
[13] A. M. Obukhov, “Turbulence in an atmosphere with a non-uniform temperature,” Bound.-Layer Meteorol., vol. 2, no. 1, pp. 7–29, Mar. 1971.
[14] D. Li, E. Bou-Zeid, and H. A. R. De Bruin, “Monin–Obukhov Similarity Functions for the Structure Parameters of Temperature and Humidity,” Bound.-Layer Meteorol, vol. 145, pp. 45–67, 2012.
[15] J. C. WYNGAARD, Y. IZUMI, and J., STUART A. COLLINS, “Behavior of the Refractive-Index-Structure Parameter near the Ground,” J. Opt. Soc. Am., vol. 61, no. 12, pp. 1646–1650, Dezember 1971.
[16] O. K. Hartogensis and H. A. R. D. Bruin, “Monin–Obukhov Similarity Functions of the Structure Parameter of Temperature and Turbulent Kinetic Energy Dissipation Rate in the Stable Boundary Layer,” Bound.-Layer Meteorol., vol. 116, no. 2, pp. 253–276, Aug. 2005.
[17] W. Kohsiek and M. H. A. J. Herben, “Evaporation derived from optical and radio-wave scintillation,” Appl. Opt., vol. 22, no. 17, pp. 2566–2570, Sep. 1983.
[18] D. L. FRIED, “Propagation of a Spherical Wave in a Turbulent Medium,” J. Opt. Soc. Am., vol. 57, no. 2, pp. 175–180, Feb. 1967.
[19] S. F. Clifford, G. R. Ochs, and R. S. Lawrence, “Saturation of optical scintillation by strong turbulence,” J. Opt. Soc. Am., vol. 64, no. 2, pp. 148–154, Feb. 1974.
[20] J. Kleissl, O. K. Hartogensis, and J. D. Gomez, “Test of Scintillometer Saturation Correction Methods Using Field Experimental Data,” Bound.-Layer Meteorol., vol. 137, no. 3, pp. 493–507, Dec. 2010.
[21] O. K. Hartogensis, C. J. Watts, J.-C. Rodriguez, and H. A. R. De Bruin, “Derivation of an Effective Height for Scintillometers: La Poza Experiment in Northwest Mexico,” J. Hydrometeorol., vol. 4, no. 5, pp. 915–928, Oct. 2003.
[22] “CIMO Guide 7th Edition,” calameo.com. [Online]. Available: http://www.calameo.com/books/000418449cceb3c866f47. [Accessed: 04-Apr-2014].

RPG-MWSC-160 Radiometer Physics GmbH Birkenmaarstr. 10 53340 Meckenheim, Germany
80 +49 (0) 2225 99981 – 0
www.radiometer-physics.de [email protected]
All data and specifications are subject to change without notice! © Radiometer Physics GmbH 2014
Installation, Operation & Software Guide
Appendix A (File Formats) A1: Heat Flux Files (*.FLX) Variable Name Type # Bytes Description FLXCode int 4 File ID Code (=971062) T0(1) int 4 Time of first sample N int 4 Number of recorded samples GPSLong float 4 GPS Longitude GPSLat float 4 GPS Latitude
HeaderLen int 4 Length of following header info in bytes SetupStr wide char 2*(string
length +1) null terminated wide character string (each char is coded with 2 bytes), giving the measurement setup name
MWSStr wide char 2*(string length +1)
null terminated wide character string (each char is coded with 2 bytes), giving the MWS model used
LASStr wide char 2*(string length +1)
null terminated wide character string (each char is coded with 2 bytes), giving the LAS model used
LASAp double 8 LAS aperture diameter [m] MWSAp double 8 MWS aperture diameter [m] LASWl double 8 LAS wavelength [µm] MWSWl double 8 LAS wavelength [µm]
zTM double 8 MWS transmitter height above ground [m]
zRM double 8 MWS receiver height above ground [m] zTL double 8 LAS transmitter height above ground [m] zRL double 8 LAS receiver height above ground [m] yTL double 8 LAS transmitter lateral displacement [m] yRL double 8 LAS receiver lateral displacement [m]
PathOr double 8 Orientation of signal path relative to north direction [DEG, clock wise]
SurRoughLen double 8 Surface roughness length [m] TopoX[] double 8x10 Topography x-coordinate array, distance
from transmitter along path, 10 points (including transmitter coord. X=0)
TopoZ[] double 8x10 Topography z-coordinate array, GPS altitude of each topography point corresponding to TopoX[]
EffHeight double 8 Effective height above ground for complete signal path [m]
Gint[] double 3x8 Integrated spectral density (LAS, MWS, Covariance)
RunMean int 4 Running mean time for variance calculation [sec]
VarPer int 4 Variance integration period [sec] T_1(1) int 4 Time of sample 1
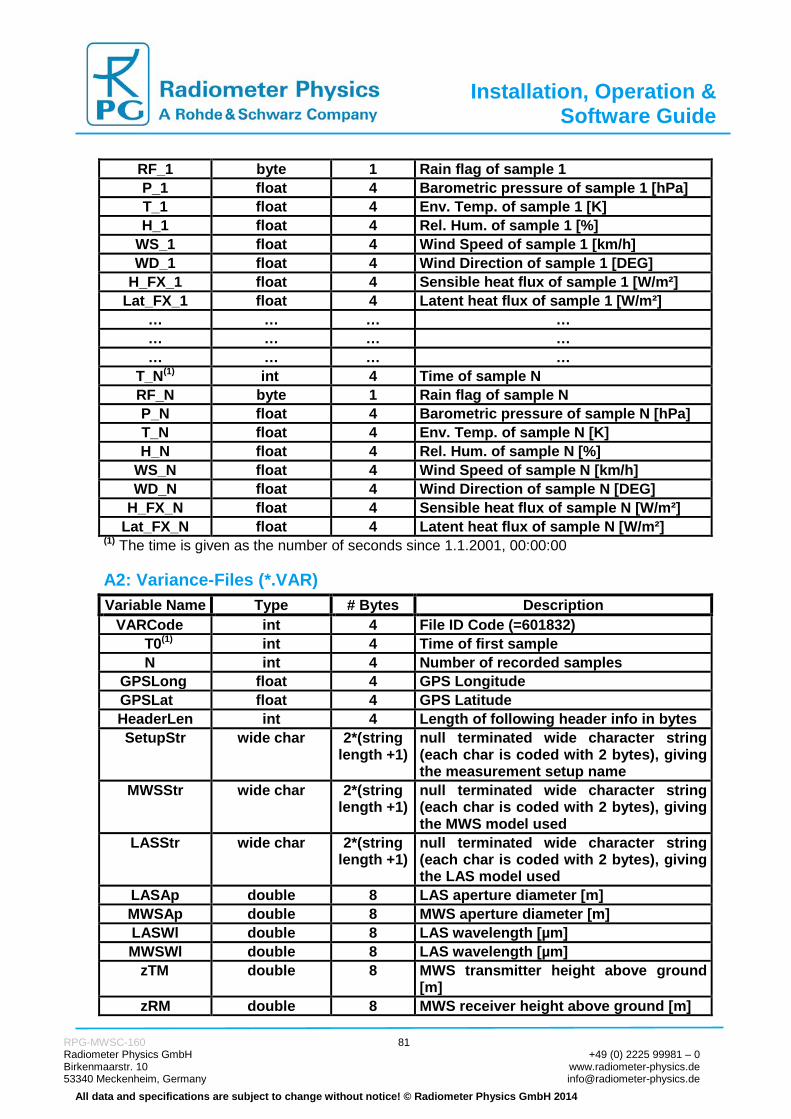
RPG-MWSC-160 Radiometer Physics GmbH Birkenmaarstr. 10 53340 Meckenheim, Germany
81 +49 (0) 2225 99981 – 0
www.radiometer-physics.de [email protected]
All data and specifications are subject to change without notice! © Radiometer Physics GmbH 2014
Installation, Operation & Software Guide
RF_1 byte 1 Rain flag of sample 1 P_1 float 4 Barometric pressure of sample 1 [hPa] T_1 float 4 Env. Temp. of sample 1 [K] H_1 float 4 Rel. Hum. of sample 1 [%]
WS_1 float 4 Wind Speed of sample 1 [km/h] WD_1 float 4 Wind Direction of sample 1 [DEG]
H_FX_1 float 4 Sensible heat flux of sample 1 [W/m²] Lat_FX_1 float 4 Latent heat flux of sample 1 [W/m²]
… … … … … … … … … … … …
T_N(1) int 4 Time of sample N RF_N byte 1 Rain flag of sample N P_N float 4 Barometric pressure of sample N [hPa] T_N float 4 Env. Temp. of sample N [K] H_N float 4 Rel. Hum. of sample N [%]
WS_N float 4 Wind Speed of sample N [km/h] WD_N float 4 Wind Direction of sample N [DEG]
H_FX_N float 4 Sensible heat flux of sample N [W/m²] Lat_FX_N float 4 Latent heat flux of sample N [W/m²]
(1) The time is given as the number of seconds since 1.1.2001, 00:00:00
A2: Variance-Files (*.VAR) Variable Name Type # Bytes Description VARCode int 4 File ID Code (=601832) T0(1) int 4 Time of first sample N int 4 Number of recorded samples GPSLong float 4 GPS Longitude GPSLat float 4 GPS Latitude
HeaderLen int 4 Length of following header info in bytes SetupStr wide char 2*(string
length +1) null terminated wide character string (each char is coded with 2 bytes), giving the measurement setup name
MWSStr wide char 2*(string length +1)
null terminated wide character string (each char is coded with 2 bytes), giving the MWS model used
LASStr wide char 2*(string length +1)
null terminated wide character string (each char is coded with 2 bytes), giving the LAS model used
LASAp double 8 LAS aperture diameter [m] MWSAp double 8 MWS aperture diameter [m] LASWl double 8 LAS wavelength [µm] MWSWl double 8 LAS wavelength [µm]
zTM double 8 MWS transmitter height above ground [m]
zRM double 8 MWS receiver height above ground [m]

RPG-MWSC-160 Radiometer Physics GmbH Birkenmaarstr. 10 53340 Meckenheim, Germany
82 +49 (0) 2225 99981 – 0
www.radiometer-physics.de [email protected]
All data and specifications are subject to change without notice! © Radiometer Physics GmbH 2014
Installation, Operation & Software Guide
zTL double 8 LAS transmitter height above ground [m] zRL double 8 LAS receiver height above ground [m] yTL double 8 LAS transmitter lateral displacement [m] yRL double 8 LAS receiver lateral displacement [m]
PathOr double 8 Orientation of signal path relative to north direction [DEG, clock wise]
SurRoughLen double 8 Surface roughness length [m] TopoX[] double 8x10 Topography x-coordinate array, distance
from transmitter along path, 10 points (including transmitter coord. X=0)
TopoZ[] double 8x10 Topography z-coordinate array, GPS altitude of each topography point corresponding to TopoX[]
EffHeight double 8 Effective height above ground for complete signal path [m]
Gint[] double 3x8 Integrated spectral density (LAS, MWS, Covariance)
RunMean int 4 Running mean time for variance calculation [sec]
VarPer int 4 Variance integration period [sec] T_1(1) int 4 Time of sample 1 RF_1 byte 1 Rain flag of sample 1 P_1 float 4 Barometric pressure of sample 1 [hPa] T_1 float 4 Env. Temp. of sample 1 [K] H_1 float 4 Rel. Hum. of sample 1 [%]
WS_1 float 4 Wind Speed of sample 1 [km/h] WD_1 float 4 Wind Direction of sample 1 [DEG]
LAS_VAR_1 double 8 LAS variance of sample 1 MWS_VAR_1 double 8 MWS variance of sample 1 COV_VAR_1 double 8 Covariance of sample 1
… … … … … … … … … … … …
T_N(1) int 4 Time of sample N RF_N byte 1 Rain flag of sample N P_N float 4 Barometric pressure of sample N [hPa] T_N float 4 Env. Temp. of sample N [K] H_N float 4 Rel. Hum. of sample N [%]
WS_N float 4 Wind Speed of sample N [km/h] WD_N float 4 Wind Direction of sample N [DEG]
LAS_VAR_N double 8 LAS variance of sample N MWS_VAR_N double 8 MWS variance of sample N COV_VAR_N double 8 Covariance of sample N
(1) The time is given as the number of seconds since 1.1.2001, 00:00:00

RPG-MWSC-160 Radiometer Physics GmbH Birkenmaarstr. 10 53340 Meckenheim, Germany
83 +49 (0) 2225 99981 – 0
www.radiometer-physics.de [email protected]
All data and specifications are subject to change without notice! © Radiometer Physics GmbH 2014
Installation, Operation & Software Guide
A3: Raw Data Files (*.RAW) Variable Name Type # Bytes Description RAWCode int 4 File ID Code (=294001) T0(1) int 4 Time of first sample N int 4 Number of recorded samples GPSLong float 4 GPS Longitude GPSLat float 4 GPS Latitude
HeaderLen int 4 Length of following header info in bytes SetupStr wide char 2*(string
length +1) null terminated wide character string (each char is coded with 2 bytes), giving the measurement setup name
MWSStr wide char 2*(string length +1)
null terminated wide character string (each char is coded with 2 bytes), giving the MWS model used
LASStr wide char 2*(string length +1)
null terminated wide character string (each char is coded with 2 bytes), giving the LAS model used
LASAp double 8 LAS aperture diameter [m] MWSAp double 8 MWS aperture diameter [m] LASWl double 8 LAS wavelength [µm] MWSWl double 8 LAS wavelength [µm]
zTM double 8 MWS transmitter height above ground [m]
zRM double 8 MWS receiver height above ground [m] zTL double 8 LAS transmitter height above ground [m] zRL double 8 LAS receiver height above ground [m] yTL double 8 LAS transmitter lateral displacement [m] yRL double 8 LAS receiver lateral displacement [m]
PathOr double 8 Orientation of signal path relative to north direction [DEG, clock wise]
SurRoughLen double 8 Surface roughness length [m] TopoX[] double 8x10 Topography x-coordinate array, distance
from transmitter along path, 10 points (including transmitter coord. X=0)
TopoZ[] double 8x10 Topography z-coordinate array, GPS altitude of each topography point corresponding to TopoX[]
EffHeight double 8 Effective height above ground for complete signal path [m]
Gint[] double 3x8 Integrated spectral density (LAS, MWS, Covariance)
RunMean int 4 Running mean time for variance calculation [sec] (has no effect here)
VarPer int 4 Variance integration period [sec] (has no effect here)
T_1(1) int 4 Time of sample 1 RF_1 byte 1 Rain flag of sample 1

RPG-MWSC-160 Radiometer Physics GmbH Birkenmaarstr. 10 53340 Meckenheim, Germany
84 +49 (0) 2225 99981 – 0
www.radiometer-physics.de [email protected]
All data and specifications are subject to change without notice! © Radiometer Physics GmbH 2014
Installation, Operation & Software Guide
P_1 float 4 Barometric pressure of sample 1 [hPa] T_1 float 4 Env. Temp. of sample 1 [K] H_1 float 4 Rel. Hum. of sample 1 [%]
WS_1 float 4 Wind Speed of sample 1 [km/h] WD_1 float 4 Wind Direction of sample 1 [DEG]
LAS[ ]_1 float 1000x4 Array of 1000 LAS voltage samples in 1 ms resolution of sample 1
MWS [ ]_1 float 1000x4 Array of 1000 MWS voltage samples in 1 ms resolution of sample 1
… … … … … … … … … … … …
T_N(1) int 4 Time of sample N RF_N byte 1 Rain flag of sample N P_N float 4 Barometric pressure of sample N [hPa] T_N float 4 Env. Temp. of sample N [K] H_N float 4 Rel. Hum. of sample N [%]
WS_N float 4 Wind Speed of sample N [km/h] WD_N float 4 Wind Direction of sample N [DEG]
LAS[ ]_N float 1000x4 Array of 1000 LAS voltage samples in 1 ms resolution of sample N
MWS [ ]_N float 1000x4 Array of 1000 MWS voltage samples in 1 ms resolution of sample N
(1) The time is given as the number of seconds since 1.1.2001, 00:00:00
A4: Housekeeping Data Files (*.HKD) Variable Name Type # Bytes Description HKDCode int 4 File ID Code (=5093871) T0(1) int 4 Time of first sample N int 4 Number of recorded samples GPSLong float 4 GPS Longitude GPSLat float 4 GPS Latitude
HeaderLen int 4 Length of following header info in bytes (here zero)
T_1(1) int 4 Time of sample 1 AGC_1 float 4 AGC voltage [V] (receiver LO) of sample
1 Pow_1 float 4 Total power consumption [W] of sample
1 PID_1 float 4 PID regulator voltage [V] of sample 1 Trec_1 float 4 Receiver temperature [K] of sample 1 RFV_1 float 4 RF supply voltage [V] of sample 1, 4.4V
OPA1_1 float 4 OPA1 voltage [V] of sample 1, +8V OPA2_1 float 4 OPA1 voltage [V] of sample 1, -8V GSV_1 float 4 General supply voltage [V] of sample 1,
+12V

RPG-MWSC-160 Radiometer Physics GmbH Birkenmaarstr. 10 53340 Meckenheim, Germany
85 +49 (0) 2225 99981 – 0
www.radiometer-physics.de [email protected]
All data and specifications are subject to change without notice! © Radiometer Physics GmbH 2014
Installation, Operation & Software Guide
Stab_1 float 4 Thermal receiver stability [K] of sample 1
… … … … … … … … … … … …
T_N(1) int 4 Time of sample N AGC_N float 4 AGC voltage [V] (receiver LO) of sample
N Pow_N float 4 Total power consumption [W] of sample
N PID_N float 4 PID regulator voltage [V] of sample N Trec_N float 4 Receiver temperature [K] of sample N RFV_N float 4 RF supply voltage [V] of sample N, 4.4V
OPA1_N float 4 OPA1 voltage [V] of sample N, +8V OPA2_N float 4 OPA1 voltage [V] of sample N, -8V GSV_N float 4 General supply voltage [V] of sample N,
+12V (1) The time is given as the number of seconds since 1.1.2001, 00:00:00

RPG-MWSC-160 Radiometer Physics GmbH Birkenmaarstr. 10 53340 Meckenheim, Germany
86 +49 (0) 2225 99981 – 0
www.radiometer-physics.de [email protected]
All data and specifications are subject to change without notice! © Radiometer Physics GmbH 2014
Installation, Operation & Software Guide
Appendix B (Instrument Dimensions)
Total weights:
• Receiver: 12 kg (including weather station)
• Transmitter: 10 kg


![INDEX [] · 2 days ago · 2020 pc ip • ip • pc lol 8 rpg - o 2020 kog 2020 rpg rpg o 2020 rpg rpg o m 2020 rpg rpg o: 2020 rpg rpg o m 2020 tcg (rts) - a3: 2020.03.12 rpg rpg](https://static.fdocuments.net/doc/165x107/5e81aa597c3af44c935c8893/index-2-days-ago-2020-pc-ip-a-ip-a-pc-lol-8-rpg-o-2020-kog-2020-rpg.jpg)