RP-1-OC-70 southeast Pacific geophysical survey · This recorder had two disadvantages. ... plastic...
64
u.s. DEPARTMENT OF COMMERCE Frederick 8. Dent, Secretary NATIONAL OCEANIC AND ATMOSPHERIC ADMINISTRATION Robert M. White, Administrator ENVIRONMENTAL RESEARCH LABORATORIES Wilmot N. Hess, Director NOAA TECHNICAL REPORT ERL 261-POL 18 RP-l-0C-70 Southeast Pacific Geophysical Survey H.R. STEVENS, Jr. BOULDER, COLO. February 1973 For sale by the Superintendent of Documents, U. S. Government Printing Office, Washington, D. C. 20402
Transcript of RP-1-OC-70 southeast Pacific geophysical survey · This recorder had two disadvantages. ... plastic...

u.s. DEPARTMENT OF COMMERCEFrederick 8. Dent, Secretary
NATIONAL OCEANIC AND ATMOSPHERIC ADMINISTRATION
Robert M. White, Administrator
ENVIRONMENTAL RESEARCH LABORATORIES
Wilmot N. Hess, Director
NOAA TECHNICAL REPORT ERL 261-POL 18
RP-l-0C-70 Southeast PacificGeophysical Survey
H.R. STEVENS, Jr.
BOULDER, COLO.February 1973
For sale by the Superintendent of Documents, U. S. Government Printing Office, Washington, D. C. 20402

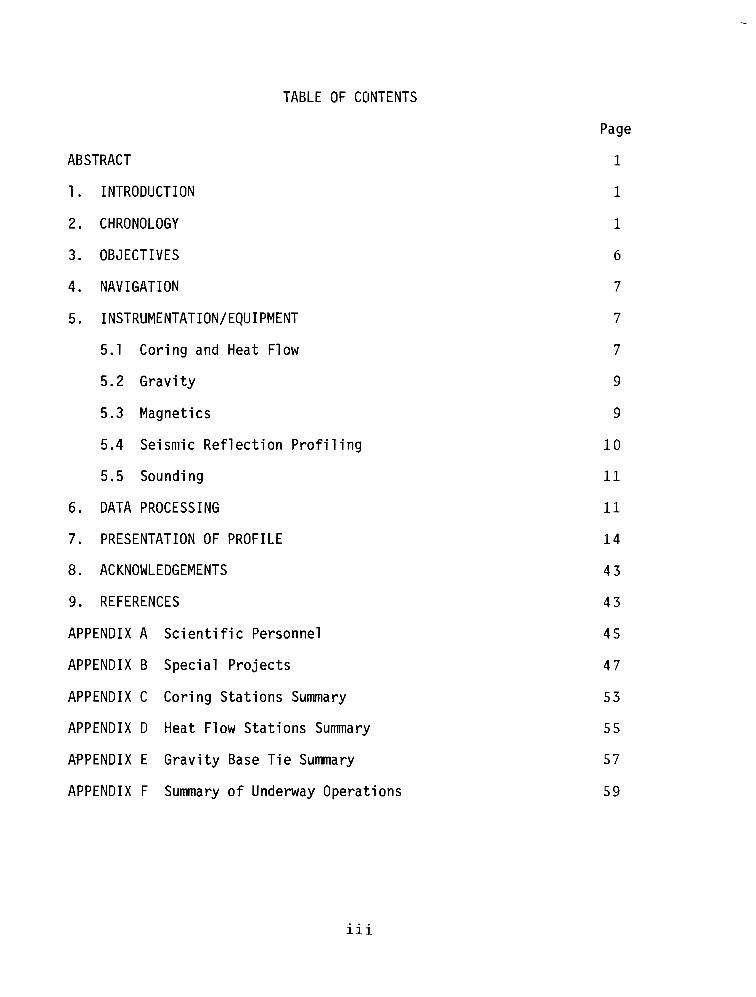
TABLE OF CONTENTS
ABSTRACT
1. INTRODUCTION
2. CHRONOLOGY
3. OB~IECTIVES
4. NAVIGATION
5. INSTRUMENTATION/EQUIPMENT
5.1 Coring and Heat Flow
5.2 Gravity
5.3 Magnetics
5.4 Seismic Reflection Profiling
5.5 Sounding
6. DATA PROCESSING
7. PRESENTATION OF PROFILE
8. ACKNOWLEDGEMENTS
9. REFERENCES
APPENDIX A Scientific Personnel
APPENDIX B Special Projects
APPENDIX C Coring Stations Summary
APPENDIX D Heat Flow Stations Summary
A~PENDIX E Gravity Base Tie Summary
APPENDIX F Summary of Underway Operations
iii
Page
1
1
1
6
7
7
7
9
9
10
11
11
14
43
43
45
47
53
55
57
59

Page
POL Geophysical Survey Track 2
Leg I Seattle - Tahiti 3
Leg II Tahiti - EPR - Valparaiso 4
Leg III Valparaiso - EPR - Guayaquil 5
East Pacific Rise 10
LIST OF FIGURES
Figure 1
Figure 2
Figure 3
Figure 4
Figure 5
Figure 6 Data Processing Flow Chart - (1970) USC&GSS OCEANOGRAPHER 12
Figure 7 Data Processing Flow Chart - POL
Figure 8 Seattle - Tahiti Location Index
Figure 9 Tahiti - Valparaiso Location Index
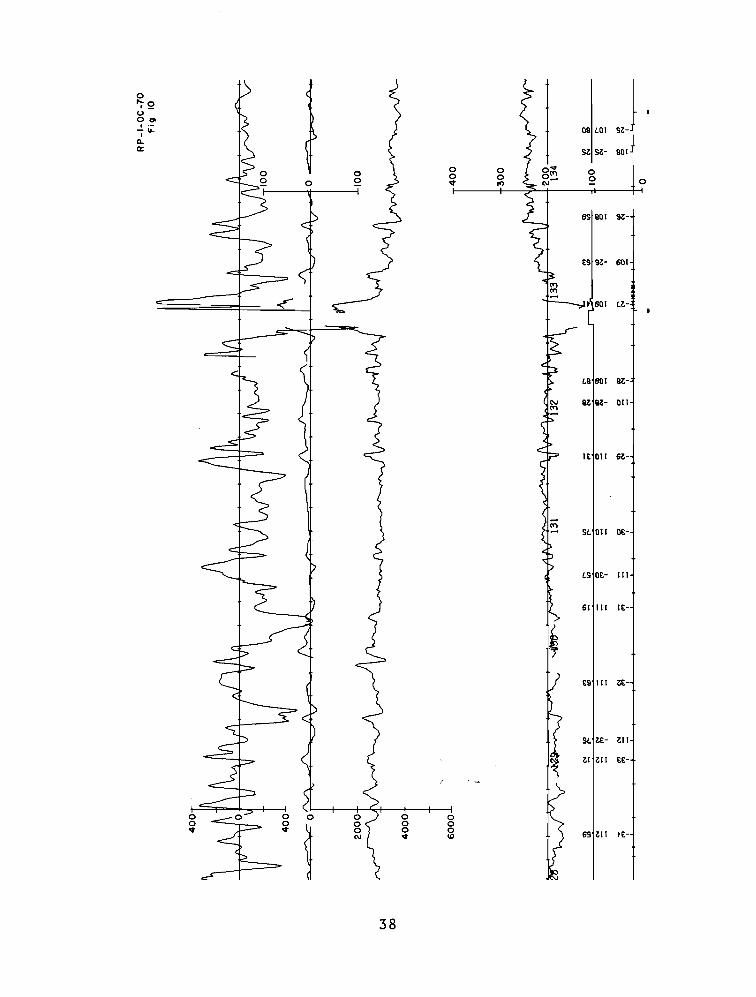
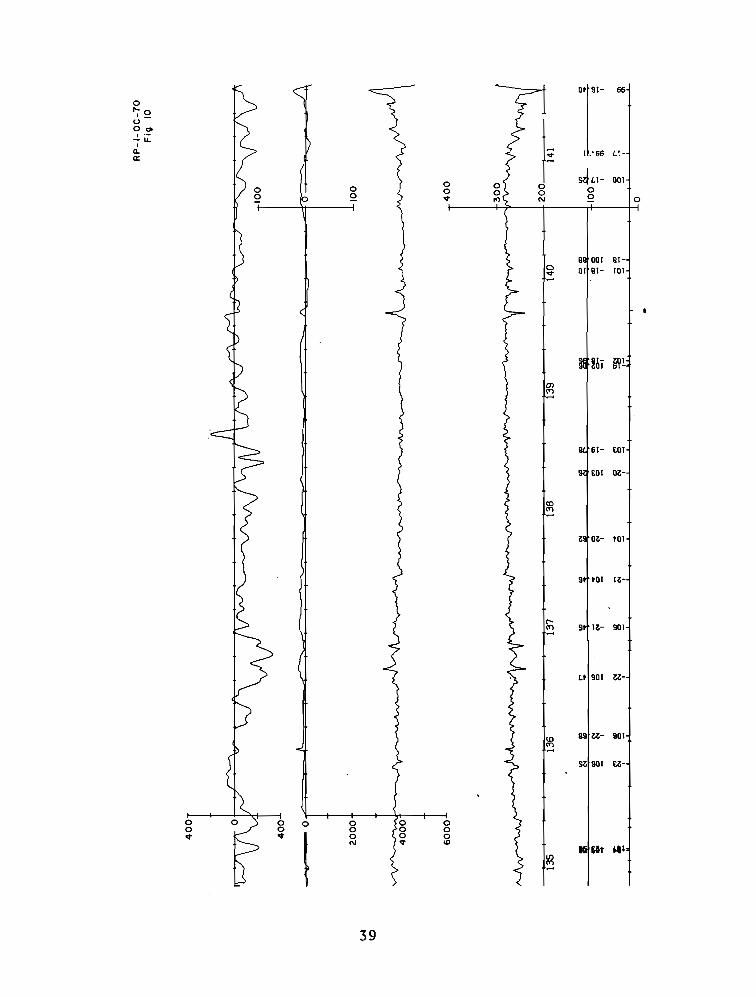
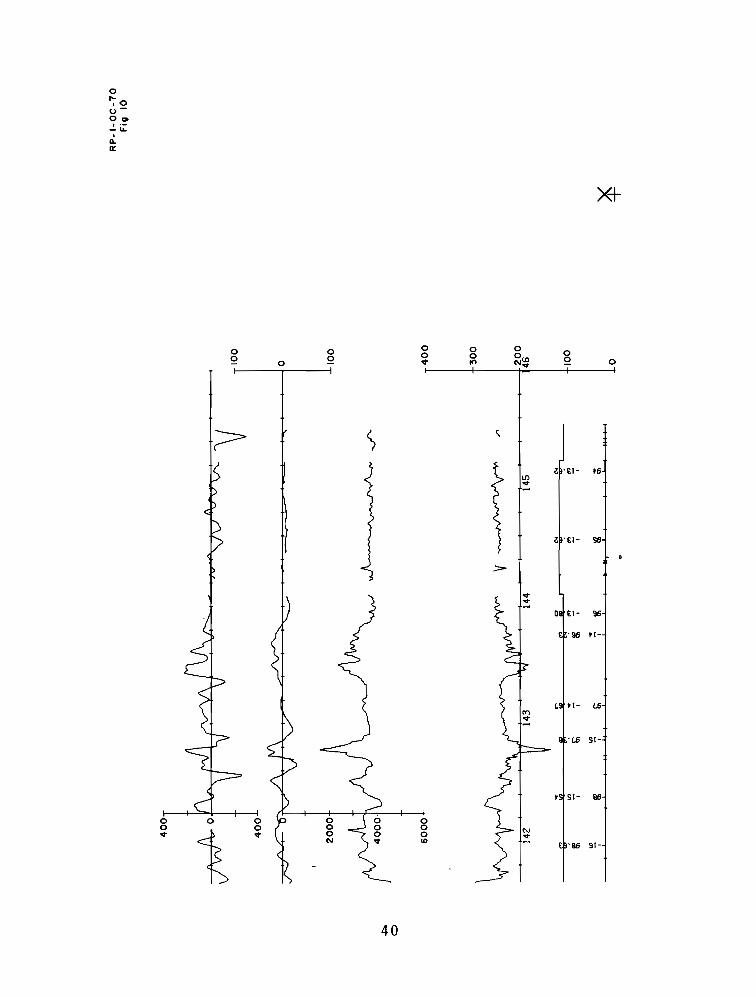
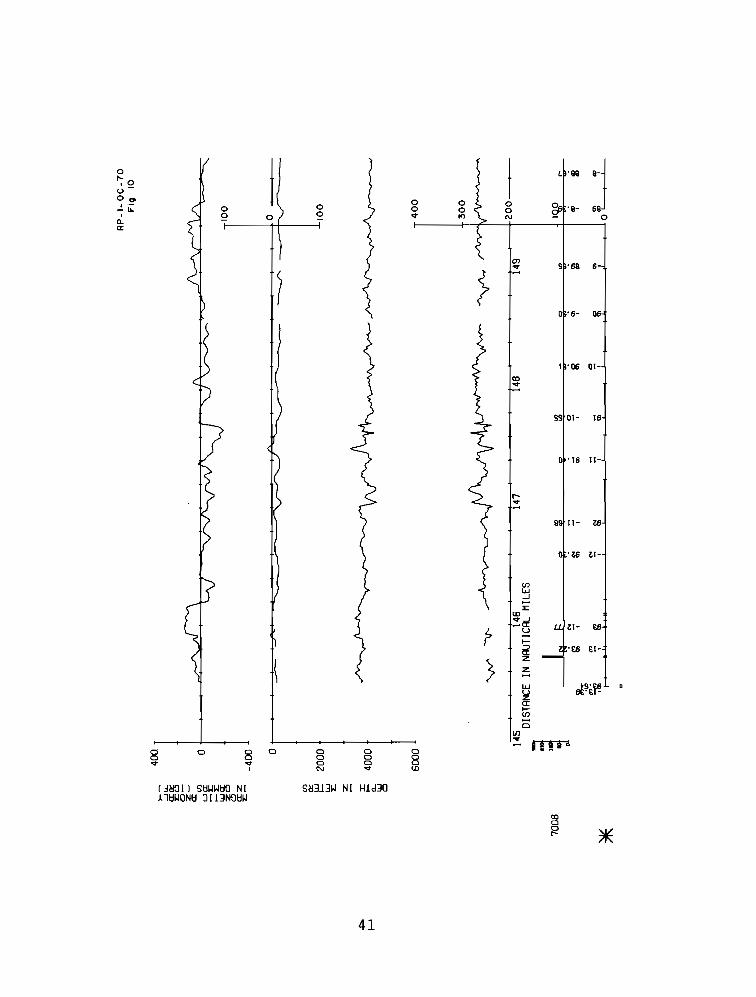
Figure 10 Valparaiso - EPR - Guayaquil Location Index
iv
13
15
21
33
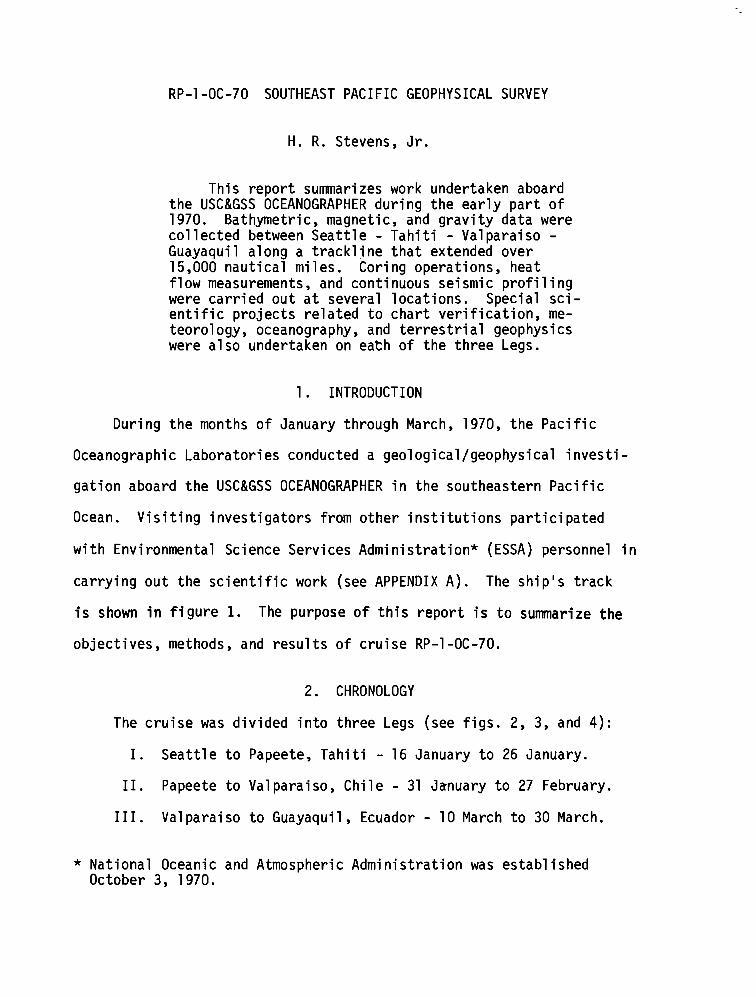
RP-l-OC-70 SOUTHEAST PACIFIC GEOPHYSICAL SURVEY
H. R. Stevens, Jr.
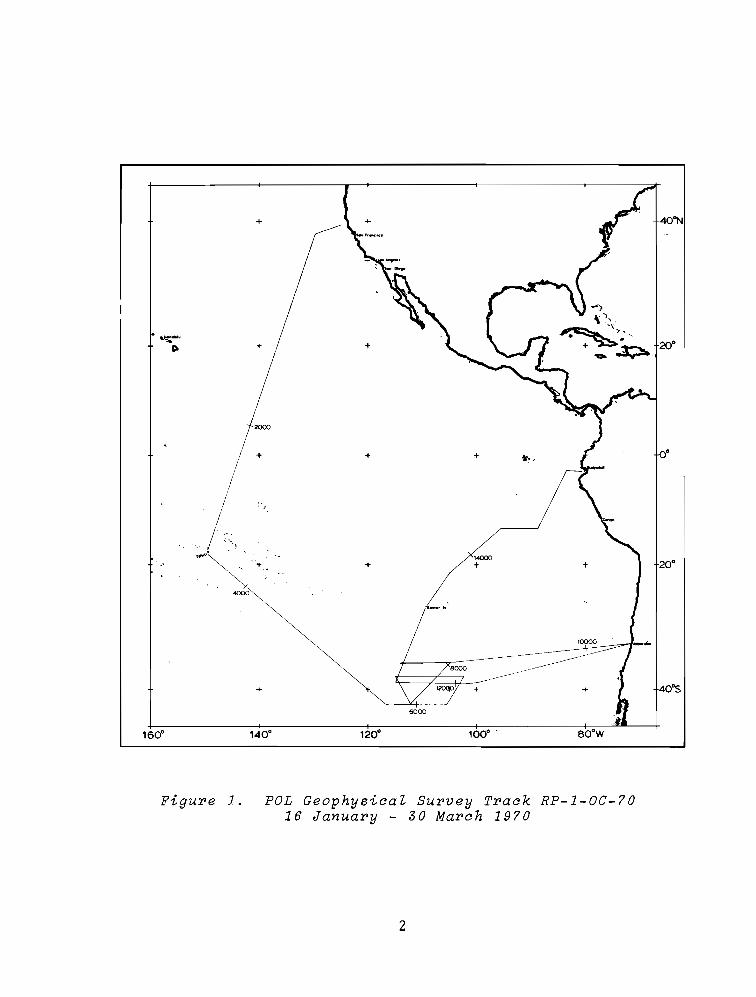
This report summarizes work undertaken aboardthe USC&GSS OCEANOGRAPHER during the early part of1970. Bathymetric, magnetic, and gravity data werecollected between Seattle - Tahiti - Valparaiso Guayaquil along a trackline that extended over15,000 nautical miles. Coring operations, heatflow measurements, and continuous seismic profilingwere carried out at several locations. Special scientific projects related to chart verification, meteorology, oceanography, and terrestrial geophysicswere also undertaken on eath of the three Legs.
1. INTRODUCTION
During the months of January through March, 1970, the Pacific
Oceanographic Laboratories conducted a geological/geophysical investi
gation aboard the USC&GSS OCEANOGRAPHER in the southeastern Pacific
Ocean. Visiting investigators from other institutions participated
with Environmental Science Services Administration* (ESSA) personnel in
carrying out the scientific work (see APPENDIX A). The ship's track
is shown in figure 1. The purpose of this report is to summarize the
objectives, methods, and results of cruise RP-l-OC-70.
2. CHRONOLOGY
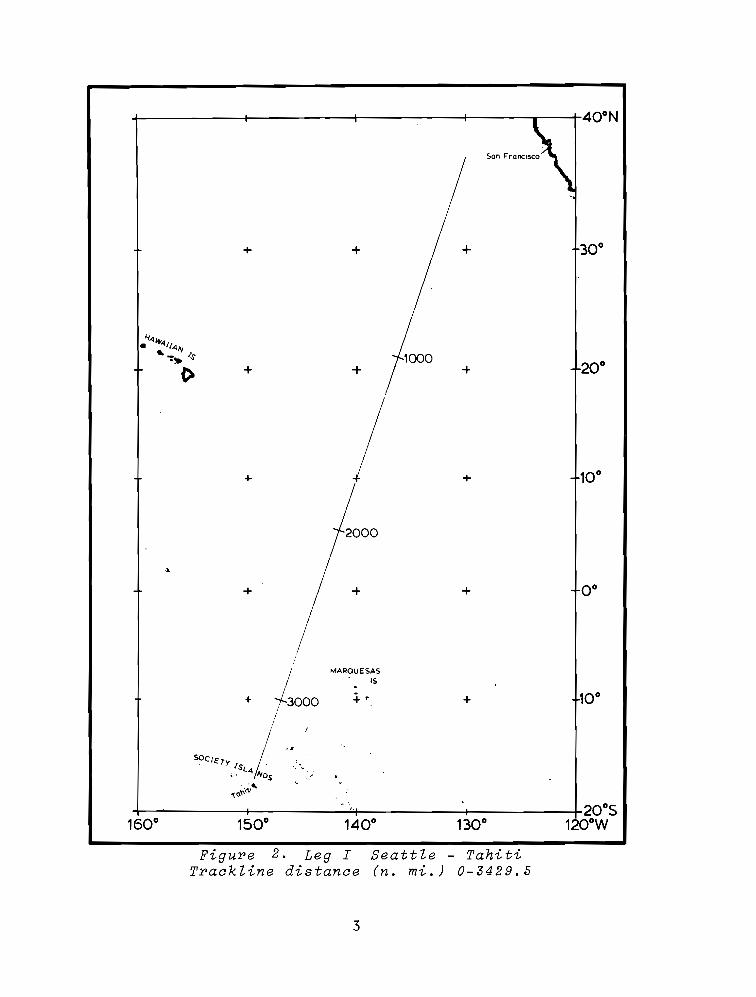
The cruise was divided into three Legs (see figs. 2, 3, and 4):
I. Seattle to Papeete, Tahiti - 16 January to 26 January.
II. Papeete to Valparaiso, Chile - 31 January to 27 February.
III. Valparaiso to Guayaquil, Ecuador - 10 March to 30 March.
* National Oceanic and Atmospheric Administration was establishedOctober 3, 1970.
"',
160·
+
+
2000
140· 120·
6000
14000+
100· .
+
ooסס1
+
80·W
20·
Figure 1. POL GeophysicaZ Survey Track RP-1-0C-7016 January - 30 March 1970
2
~------+----------I------+----...---+400N
+
+
+
+
+
+
...
+
+ +
+
+
I MAROUESAS
1= IS
+ + r + 10°
ro,,,,, L··'IS(4 . . .•. "'DS .....
. .,"io'f;\\\.\
20°5160° 150° 140° 130° 1200 W
Figure 2. Leg I Seattle - TahitiTrackline distance (n. mi.) 0-3429.5
3

10·
\a"ao
IT
UA
MO
TU
AR
CH
IPE
LA
GO
.... "..Ta~iti
'..~
';
. ,.~.l20
'+
+..
++
++
40
00
~,
Ea
st.r
Is~
.j::>
.I
T+
""+
++
++
+J13
0· 40
·+
++
60
00
++
+
II
II
II
II
I....
I45"
51
50
·1
40
·no
·1
20
·11
0·1
00
·9
0·
80
·7
0·W
Fig
ure
3.
Leg
II
Ta
hit
i-
EP
R-
Va
lpa
rais
oT
ra
ckli
ne
Dis
tan
ce
(n.
mi.
)3
41
7.9
-1
03
97
.4

II
I00
:.1:.I
10
°...
lll(t
CO
RE
&H
EA
TF
LO
WS
TA
TlO
Nlt
CO
RE
ST
AT
lON
_.
0
+ +
+ 14
00
0
++
+
10°
20°
V'1
30
°+ 80
°
+ 90
°
+ 10
0°
12
00
0
Ea
ste
rIs
110°
II
II
1«
14
0°5
70
0W
120°
Fig
ure
4.
Leg
III
Va
lpa
rais
o-
EP
R-
Gu
aya
qu
ilT
ra
akli
ne
Dis
tan
ae
(n.
mi.
)1
04
05
-1
55
79
.9

3. OBJECTIVES
Leg I. The USC&GSS OCEANOGRAPHER departed Seattle 13 January. A gravity
signature line was run off Cape Flattery, Washington. The collection of
underway geophysical data commenced 17 January at 37.l00 N and l29.96°W.
The principal objectives for this Leg were to obtain gravity, magnetic,
and bathymetric data across the Murray, Molokai, Clarian, Clipperton, and
Marquesas Fracture Zones. A secondary objective was to develope a routine
for shoipboard data processing which would permit a preliminary evaluation
of the data while the cruise was in progress (see section 6 Data Process
ing).
Leg II. The OCEANOGRAPHER 1eft Papeete, Tahiti on 31 January for the
East Pacific Rise (EPR) working area and Valparaiso. One of the primary
objectives was the acquisition of underway geophysical data along the
overall trackline that included three crossings normal to the general
axial trend of the East Pacific Rise. These traverses were made along the
42°S, 38°S, and 36°S parallels. Boundaries for the area to be investigated
were set at 300 S to 45°S and 105°W to l15°W. Other objectives were to
obtain on-station data from coring and heat flow operations along 36°S
latitude between 106°W and l14°W.
Leg III. The ship left Valparaiso on 10 March for the EPR and Guayaquil.
Basic objectives were continued on this Leg. Underway bathymetric, gravity,
and magnetic data were collected and heat flow operations were conducted
along the 39°S parallel from 102°43'W to l15°96'W and along l3°37 1 S
between 95°3l'W and 93°44'W.
6
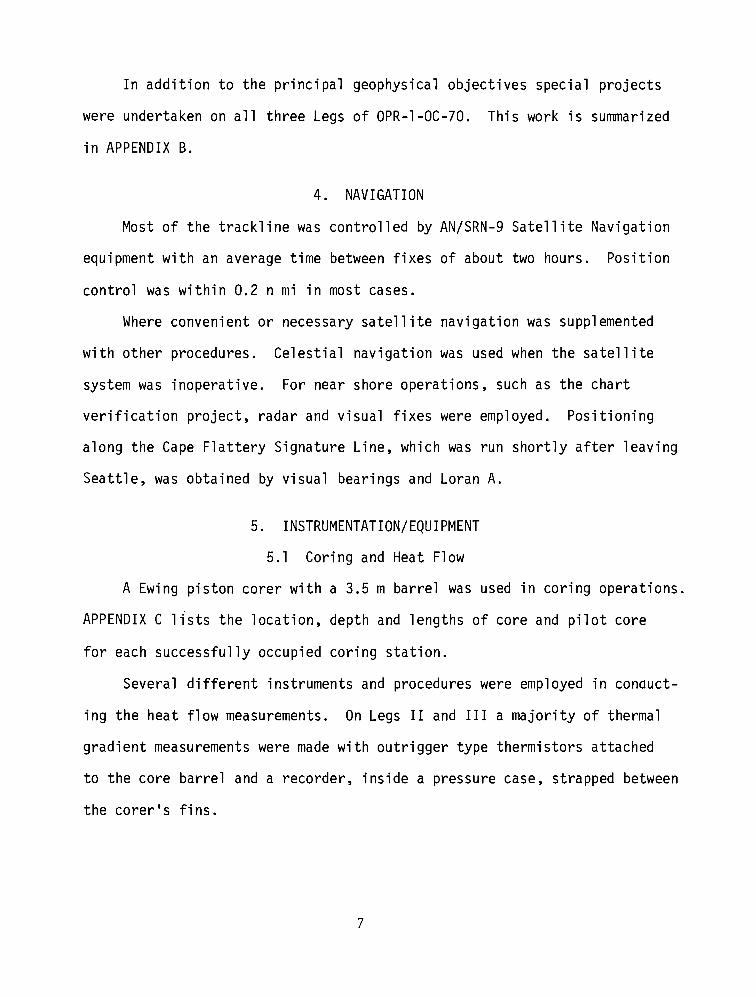
In addition to the principal geophysical objectives special projects
were undertaken on all three Legs of OPR-l-OC-70. This work is summarized
in APPENDIX B.
4. NAVIGATION
Most of the trackline was controlled ~ AN/SRN-9 Satellite Navigation
equipment with an average time between fixes of about two hours. Position
control was within 0.2 n mi in most cases.
Where convenient or necessary satellite navigation was supplemented
with other procedures. Celestial navigation was used when the satellite
system was inoperative. For near shore operations, such as the chart
verification project, radar and visual fixes were employed. Positioning
along the Cape Flattery Signature Line, which was run shortly after leaving
Seattle, was obtained by visual bearings and Loran A.
5. INSTRUMENTATION/EQUIPMENT
5.1 Coring and Heat Flow
A Ewing piston corer with a 3.5 m barrel was used in coring operations.
APPENDIX C llsts the location, depth and lengths of core and pilot core
for each successfully occupied coring station.
Several different instruments and procedures were employed in conduct
ing the heat flow measurements. On Legs II and III a majority of thermal
gradient measurements were made with outrigger type thermistors attached
to the core barrel and a recorder, inside a pressure case, strapped between
the corer's fins.
7
Two types of geothermal gradient recorders were used. A Massachusetts
Institute of Technology (MIT) instrument photographically recorded the
gradient temperatures in analog form to the nearest O.OloC. Data were
obtained from six thermistors, including one thermistor that sensed bottom
water temperatures. This recorder had two disadvantages. Loading and
unloading of film was done in the dark and errors could be introduced when
reading the processed film and digitizing the analog data.
The other gradient recorder used with the piston corer was an ESSA
instrument which employed three thermistors and recorded digitally on
punched plastic tape. Values were read to the nearest O.OloC. Punched
plastic tape had the advantage that it could immediately be taken from the
pressure case, checked, and run through the computer without need of first
digitizing the data.
In addition to the MIT and ESSA gradient recorders, used in conjunction
with the piston corer on Legs II and III, an in situ thermal gradient/con
ductivity probe was used on several Leg II stations. This instrument,
developed by Clive Lister of the University of Washington, functioned
as an independent unit. While in position on the ocean bottom it measured
both the conductivity of the sediment and the thermal gradient. Gradient
temperatures were measured for 10 minutes. A heating element in the probe
was then activated for 20 minutes to measure the rate of temperature
increase and permit conductivities of the sediment to be determined.
The Lister instrument obtained measurements in the sediment at three
positions along an 8 ft probe of 1/2 in diameter. Data were recorded
digitally on punched plastic tape. The 80 lb weight of the equipment made
8
handling and lowering relatively easy in contrast to that of the piston
corer which required more manpower and heavier equipment.
Thermal conductivities of sediments collected with the piston corer
were determined by the transient measurement method described by Von Herzen
and Maxwell (1959). A needle containing a wire heat"ing element was in
serted into the core after its recovery from the bottom. Heat was
applied at a known and constant rate. The rise in temperature with time
was monitored and from this the thermal conductivity of the sediment was
determined.
APPENDIX D lists the location, type of equipment used, and the
heat flux value for each successfully occupied station.
5.2 Gravity
The gravity meter aboard the OCEANOGRAPHER was an Askania GSS2, number
22. Gravity data were recorded continuously on an analog trace and also
digitized at 5 min intervals on punched paper tape.
Heavy seas, encountered in the early part of February, introduced
large cross-coupling errors into the data. Because of this and accompany
ing gyrotable jitter these data were unreliable and eliminated from the
geophysical profile presented in section 7. The quality of other gravity
data acquired throughout the cruise is good. APPENDIX E gives the gravity
base tie summary.
5.3 Magnetic$
A varian V-4937 proton magnetometer was towed at a cable length of
650 ft. Total field magnetic intensities were recorded continuously on
an analog trace and also digitized at 5 min intervals on punched paper
9
tape. The magnetic data were computer processed and are presented in two
formats. These are referred to as the Revised Geophysical Report and the
Geophysical Profile. The quality of the data is considered good.
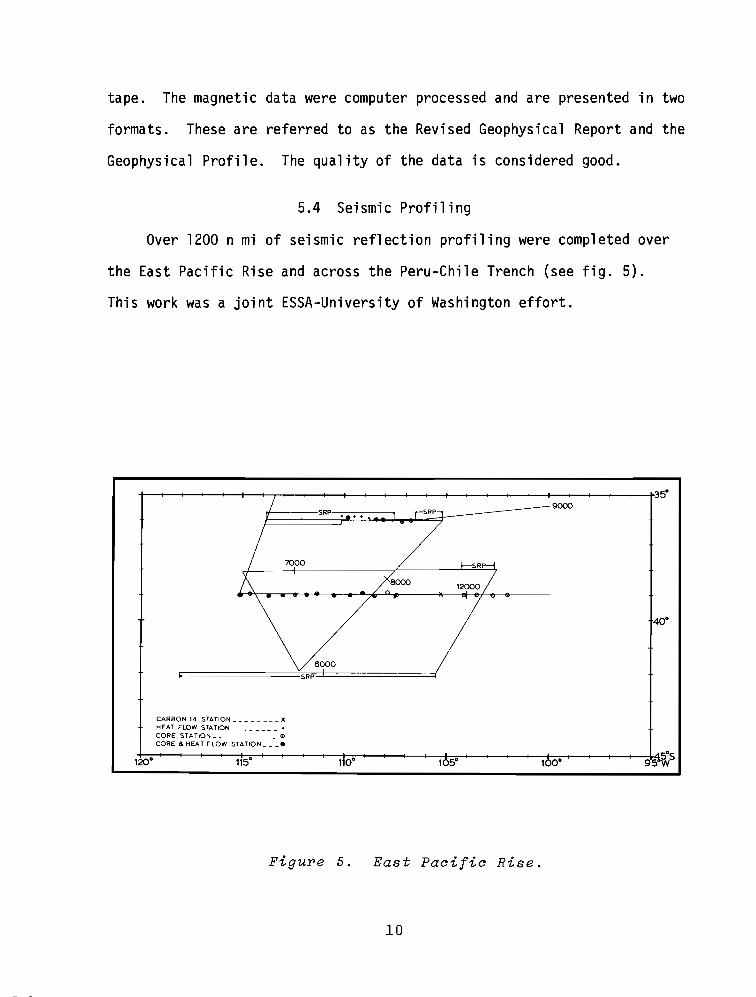
5.4 Seismic Profiling
Over 1200 n mi of seismic reflection profiling were completed over
the East Pacific Rise and across the Peru-Chile Trench (see fig. 5).
This work was a joint ESSA-University of Washington effort.
+--------+---..,..----+----__-+---+-- --+_- -+:35·
rI-----~~~:::J......C=r_---9000~ --SRP SRP
7000
40·
CARBON 14 STATION XHEAT FLOW STATlON +
CORE STATION 0
CORE &HEAT FLOW STATlON •
1·'±:20::O·------1:T.15:o·----+-----:111!:::O·....----"71r.s:o·----+-+---:1±O:::;·;-+-----~9~~S
Figure 5. East Pacific Rise.
10
The profiler was developed by Clive Lister. It operated at the re
latively high frequency of 200 Hz and transmitted a single pulse at a
4 sec repetition rate. Bottom penetration of the generated signal was
limited to the upper sediments. Resolution of the record was excellent.
The pulser was mounted on a float and towed 6 ft below the surface
at a cable length of 150 ft. The hydrophone array was towed 500 ft be
hind the ship at approximately 8 knots.
5.5 Sounding Equipment
Edo transceivers and depth recorders were used to obtain 12 kHz bathy
metric data. The transceivers were Edo models 248-16 and 248 B. Sound
ing traces were recorded on Edo model 33A Precision Bottom Recorders
(PBR). Edo wide beam transducers and General Electric narrow beam trans
ducers were used in conjunction with a PBR. All soundings were recorded
in fathoms.
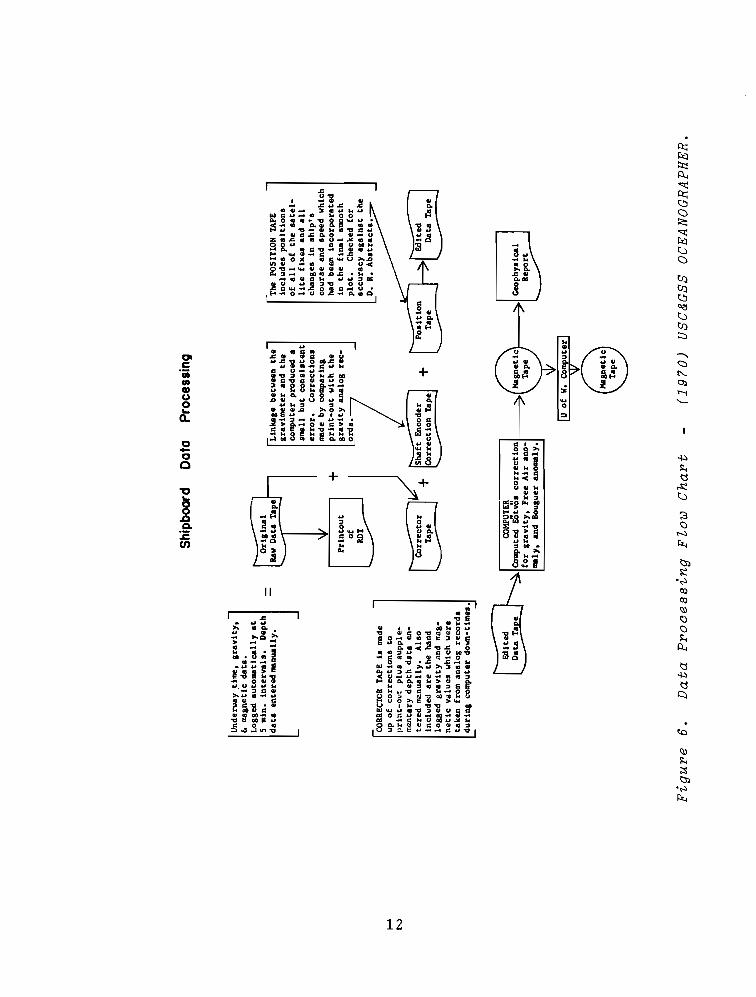
6. DATA PROCESSING
Data acquired during underway operations were processed aboard ship
and ashore. The Revised Geophysical Report and the Geophysical Profile
are the end products of a series of processing procedures illustrated in
the Data Processing Flow Charts (see figs 6 and 7). The archive retrieval
information and editing system (ARIES) used at POL is described by
Holloway (1971).
11
f-'
N
~nder
WaY
,tim
e,g
raV
ity
,]f.
mag
neti
cd
ata.
Log
Sed
auto
mat
leal
lyat
5m
in.
inte
rvals
.D
epth
data
ente
red
man
ual
ly.
CORR
ECTC
RTA
PEis
mad
eup
of
corr
ecti
on
sto
?rln
t-o
l!t
plu
ssu
pp
le
men
tary
dep
thd
sta
en
tere
dm
anu
ally
.A
lso
Incl
ud
edare
the
hand
logg
edg
rav
ity
and
nag
neti
cv
alu
esw
hich
wer
eta
ken
from
anal
og
reco
rd.
du
rin
gco
mpu
ter
dow
n-ti
me•
•
Ship
boar
dD
ata
Pro
cess
ing
+
The
POSI
TIO
NTA
PEin
clu
des
po
siti
on
so
fall
of
the
sate
lli
tefi~e.
and
all
chan
ges
Insh
ip's
cou
rse
and
spee
dw
hich
had
been
inco
rpo
rate
din
the
fin
al
smoo
thp
lot.
Che
cked
for
sccu
racy
agai
nst
the
D.
R.
Ab
stra
cts.
COM
PUTE
RC
ompu
ted
EO
tv8.
corr
ecti
on
I-:>
1fo
rg
rav
ity
,fr
ee
Air
ano
m
aly,
and
Bou
guer
anom
aly.
Fig
uY'e
6.
Da
taP
Y'o
aes
sin
gF
low
Cha
Y't
(19
70
)U
SC&
GSS
OC
EA
NO
GR
AP
HE
R.

RO
.L.
Dat
aP
roce
ssin
g
~m;~t~r
I~I
~:~~:~c
I\
{}
lGaF
Val
ues
com
pute
dh
ere
.
I
Arc
hiv
e
Retr
iev
al~I
Cal
Gra
vit
y!
/V71:oQ~~~ng
/....
....1
In:o
rmat
ion
Com
pV
alu
es_
.E
dit
ing
Plo
tter
\5
ster
n~
Ac.N
\,("
--
Dep
thV
alu
esI
../
II
\I
Rev
ised
Geo
ph
ysi
cal
Rep
ort
-I..
......
----
_(S
tora
ge)
Po
siti
on
I......
fN
avig
atio
nI
/
Tap
e~
Dat
a Fig
ur-e
7.
Da
taP
r-o
aes
sin
gF
low
Cha
r-t
--P
.O.L
.
~
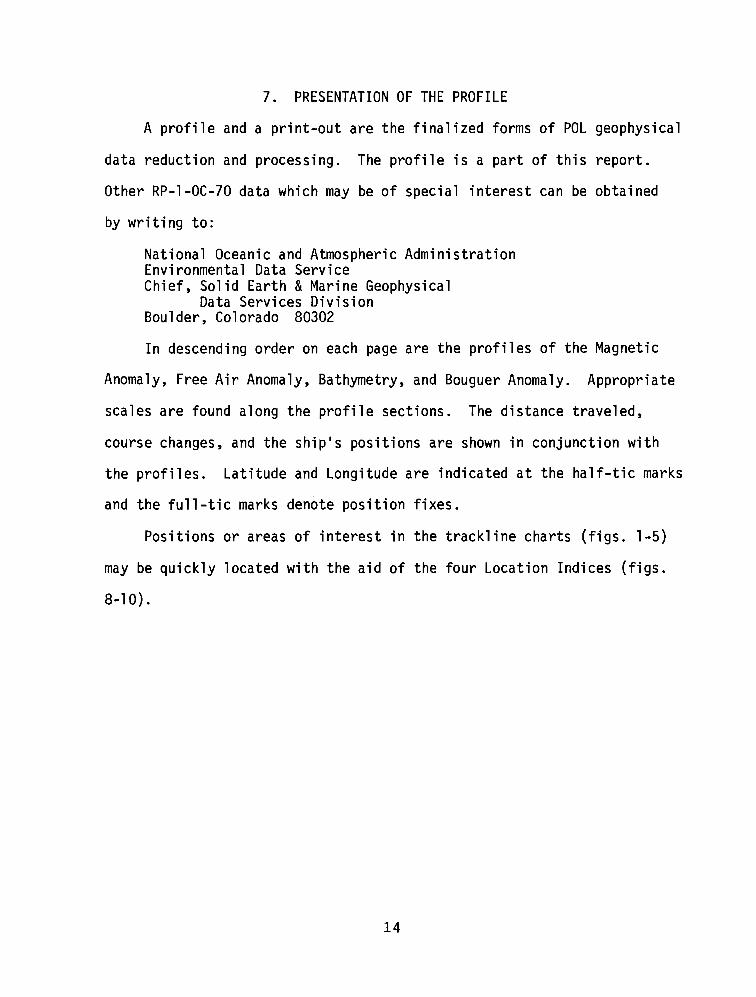
7. PRESENTATION OF THE PROFILE
A profile and a print-out are the finalized forms of POL geophysical
data reduction and processing. The profile is a part of this report.
Other RP-l-OC-70 data which may be of special interest can be obtained
by writing to:
National Oceanic and Atmospheric AdministrationEnvironmental Data ServiceChief, Solid Earth &Marine Geophysical
Data Services DivisionBoulder, Colorado 80302
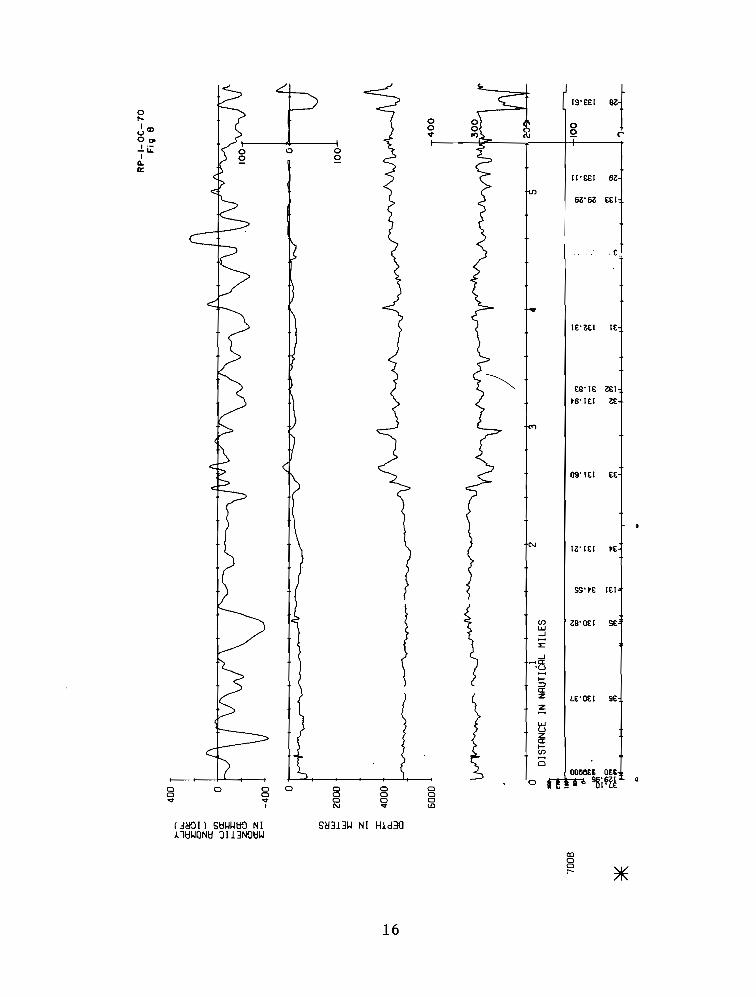
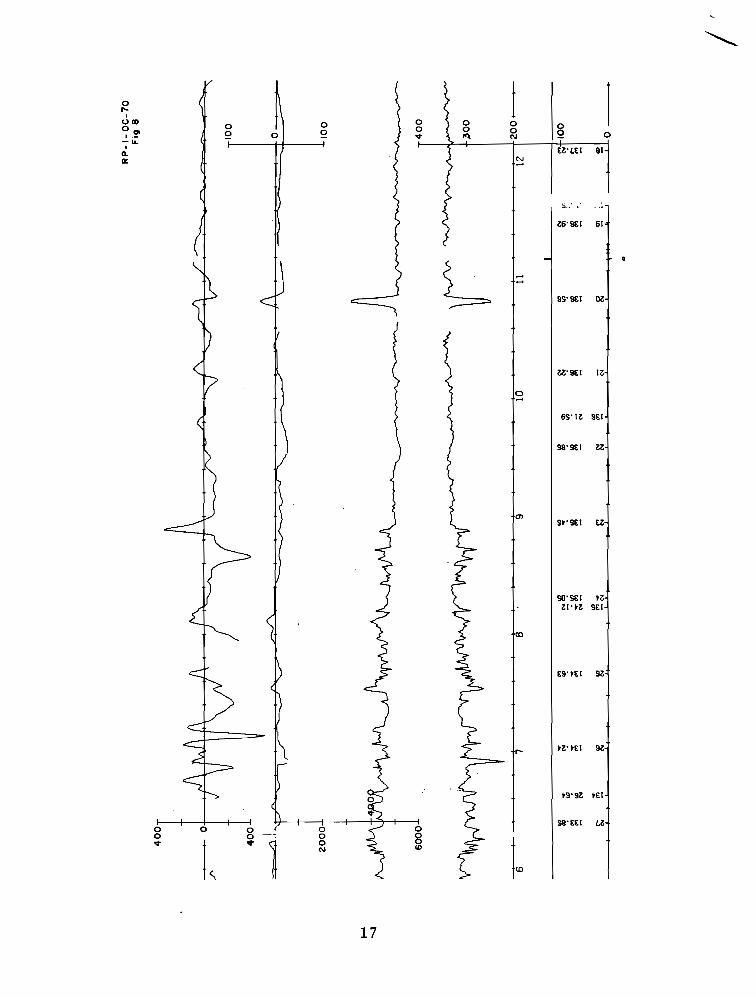
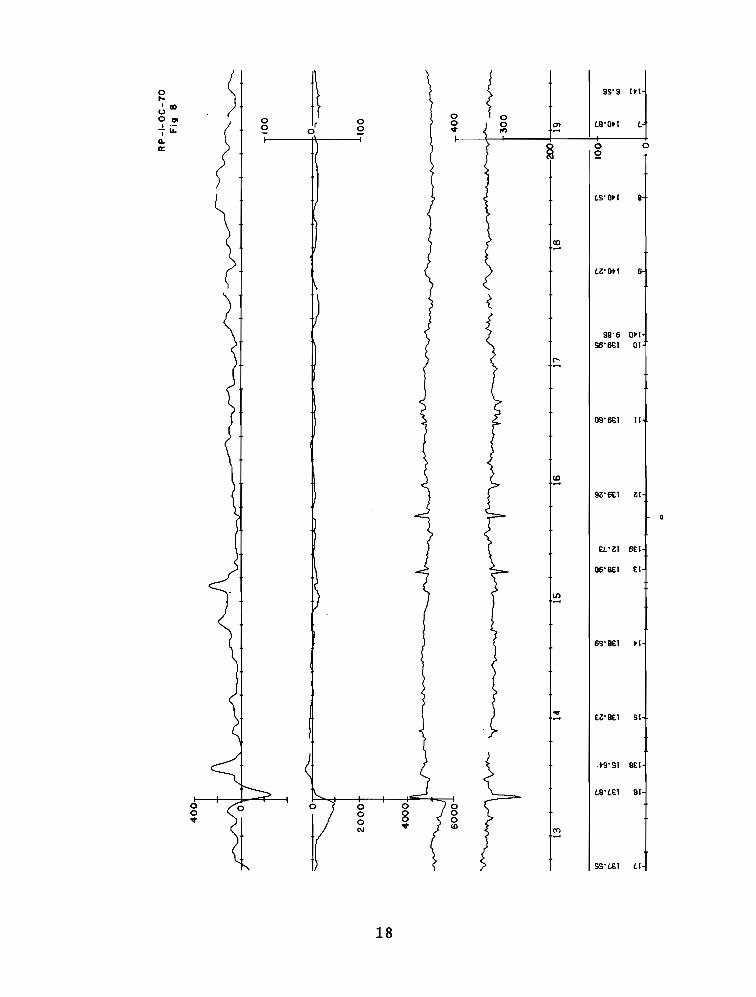
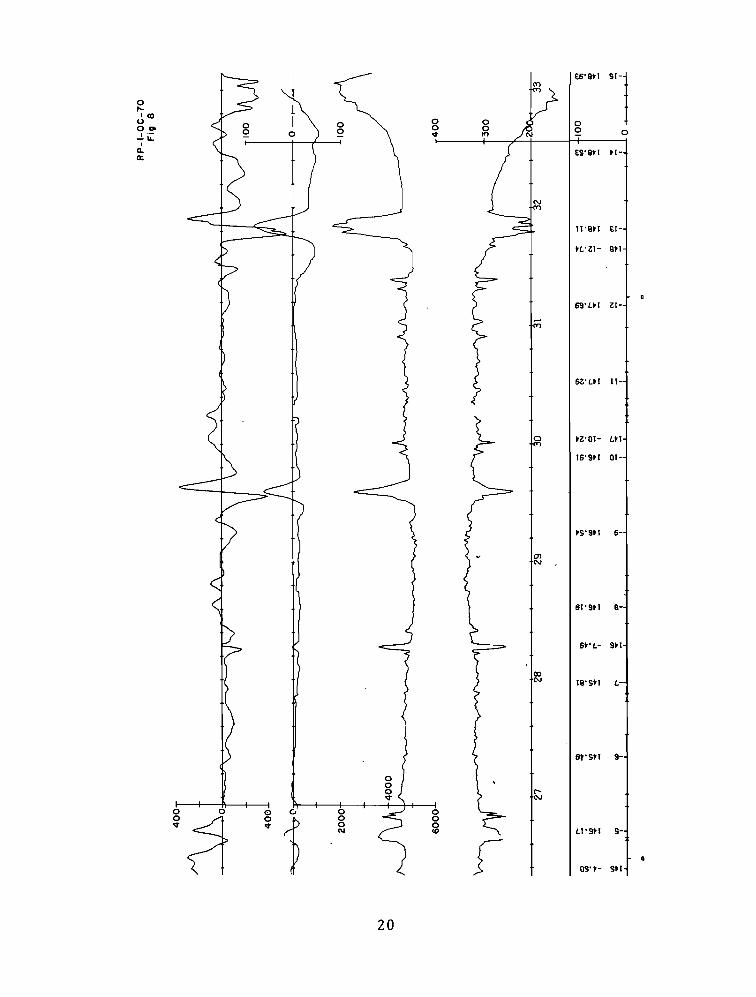
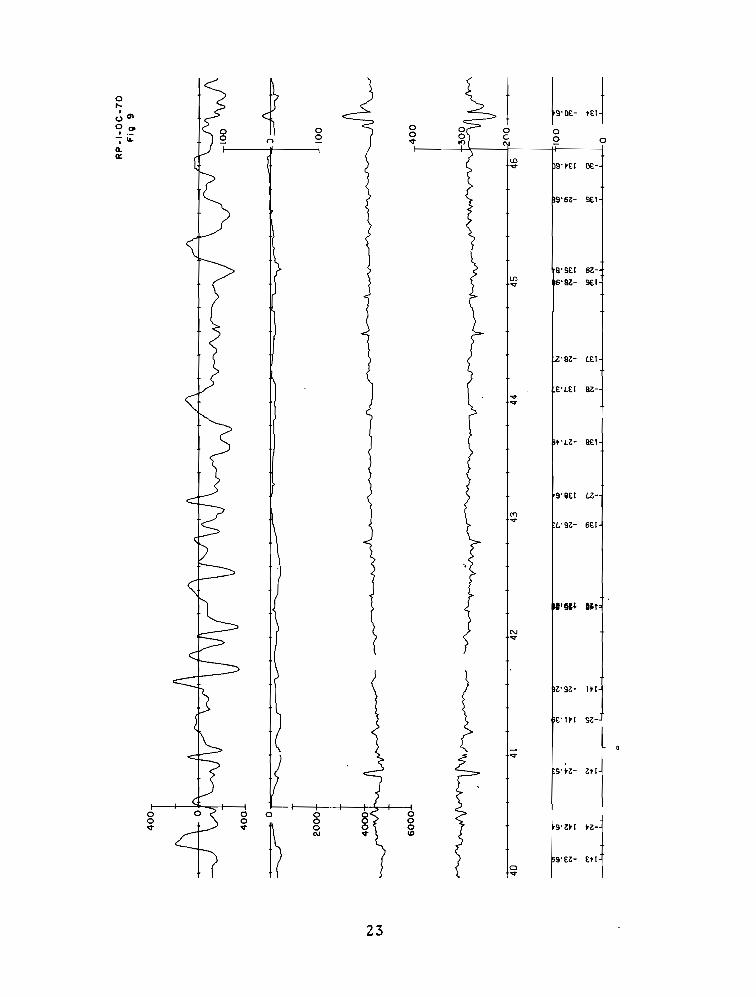
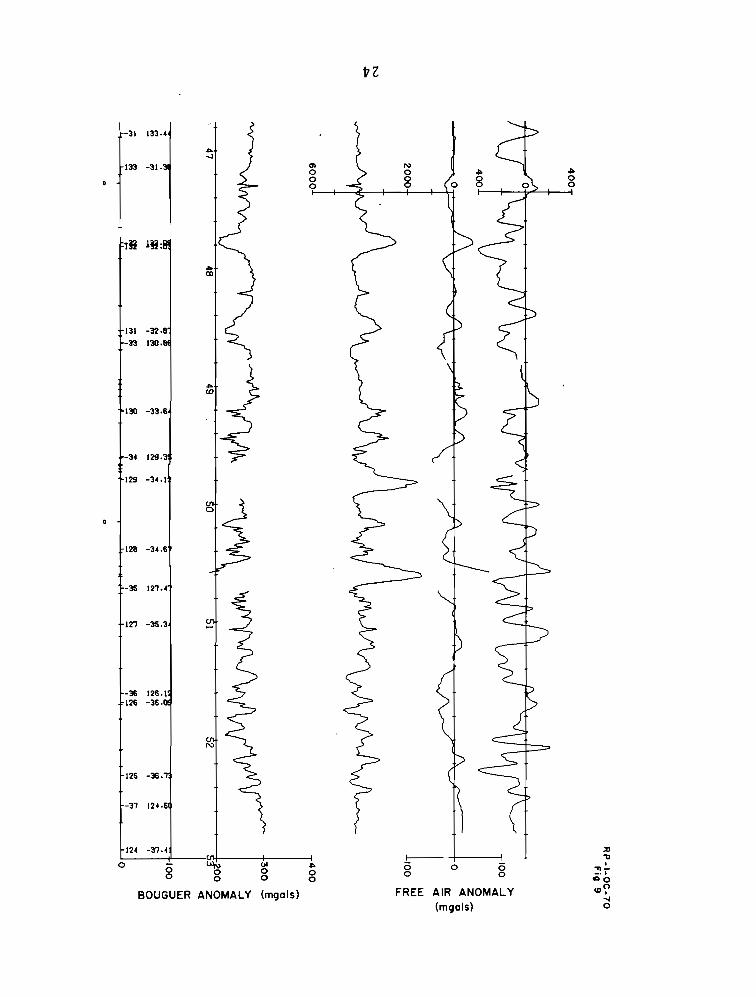
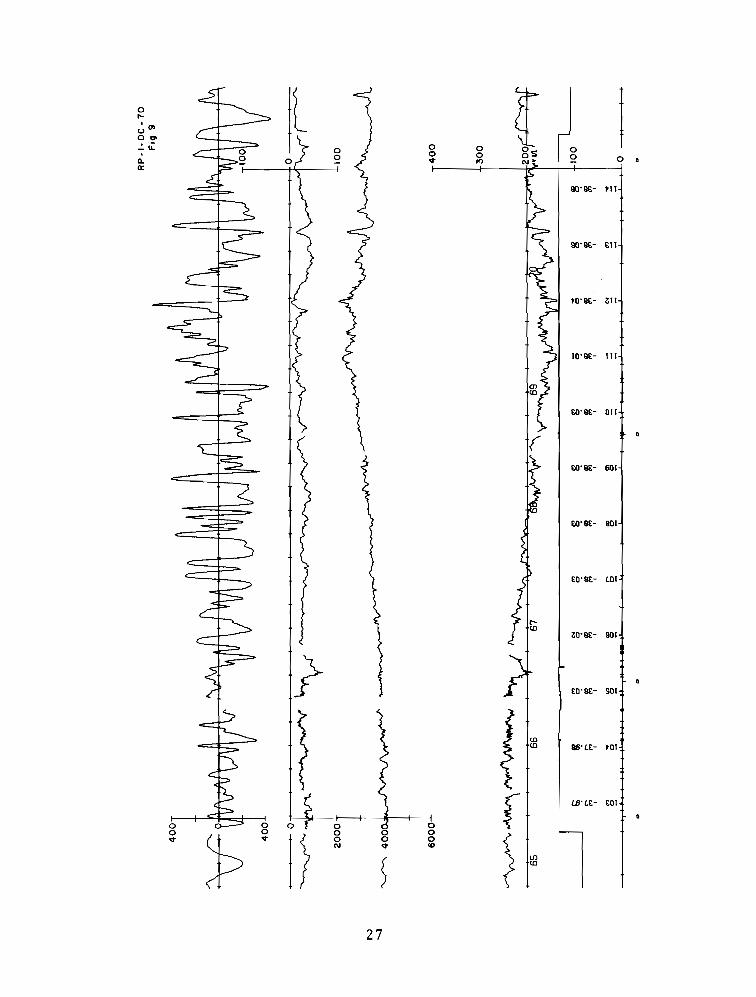
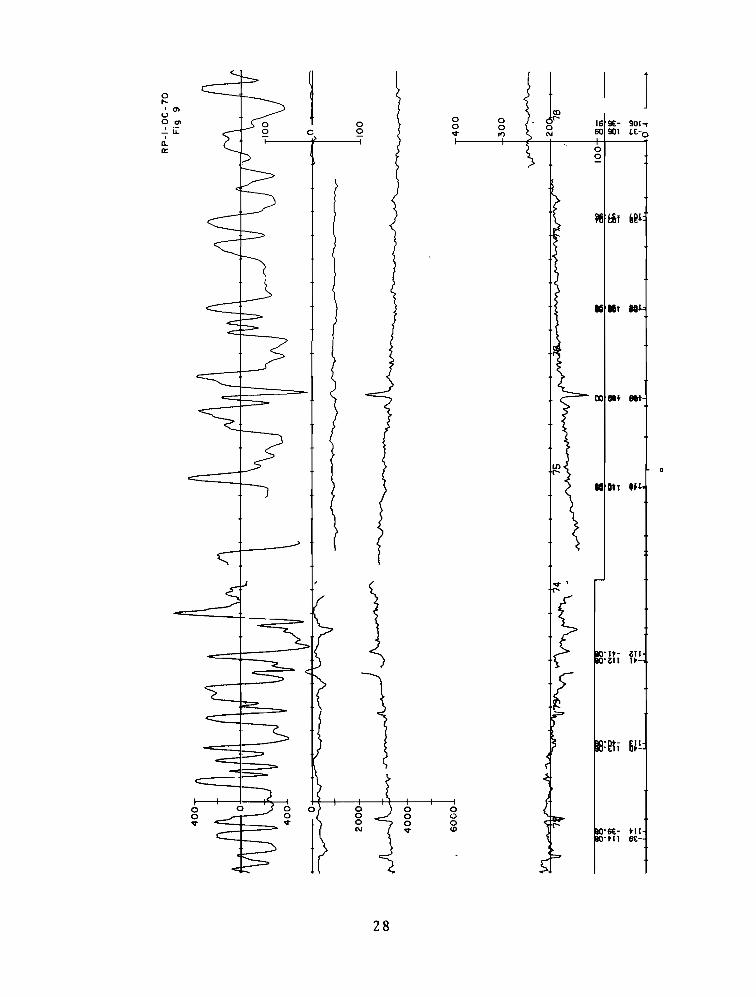
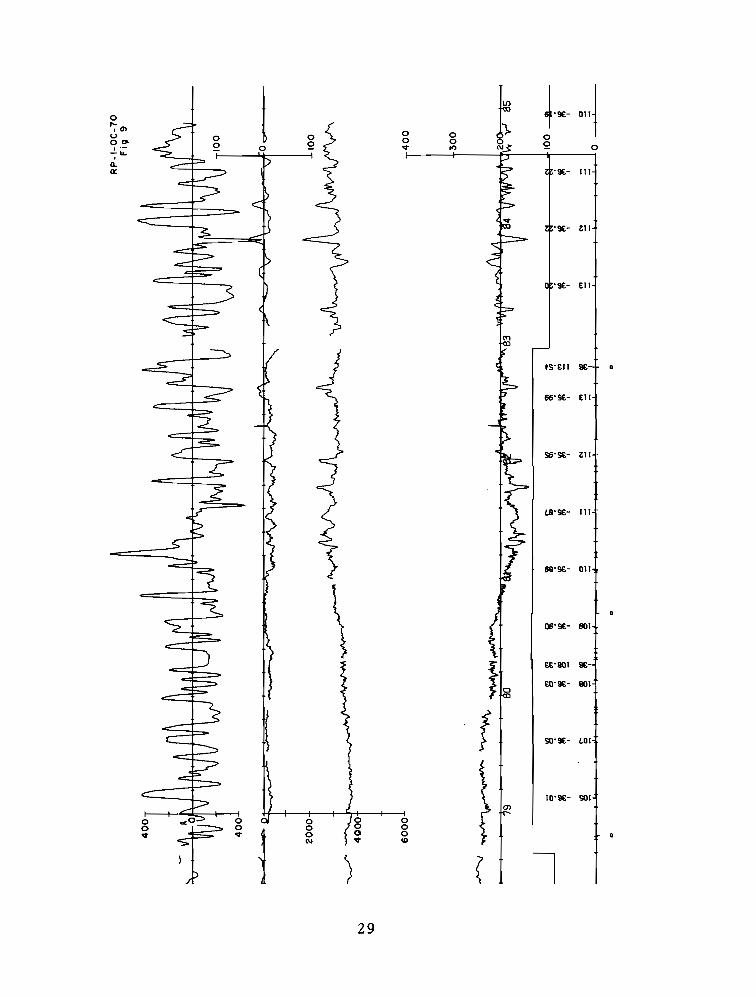
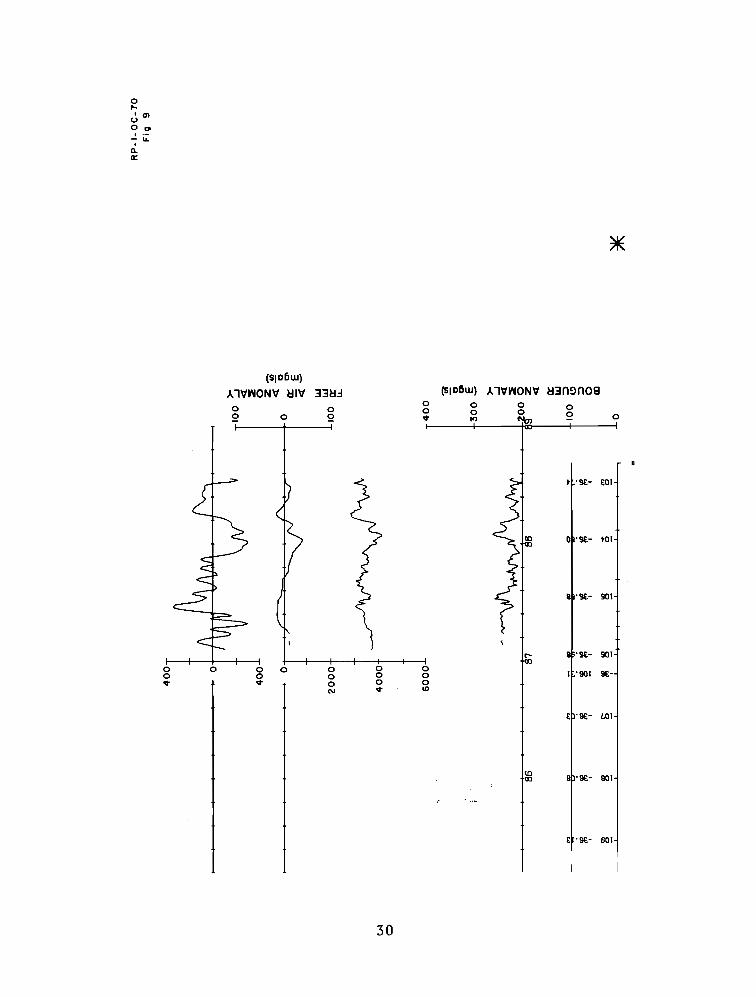
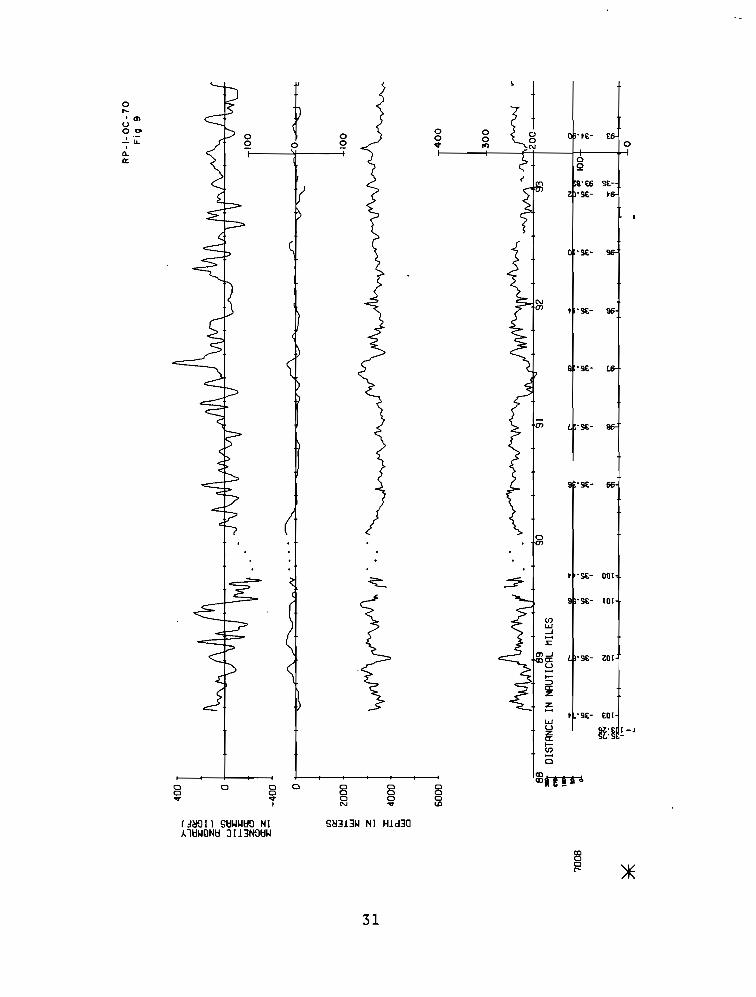
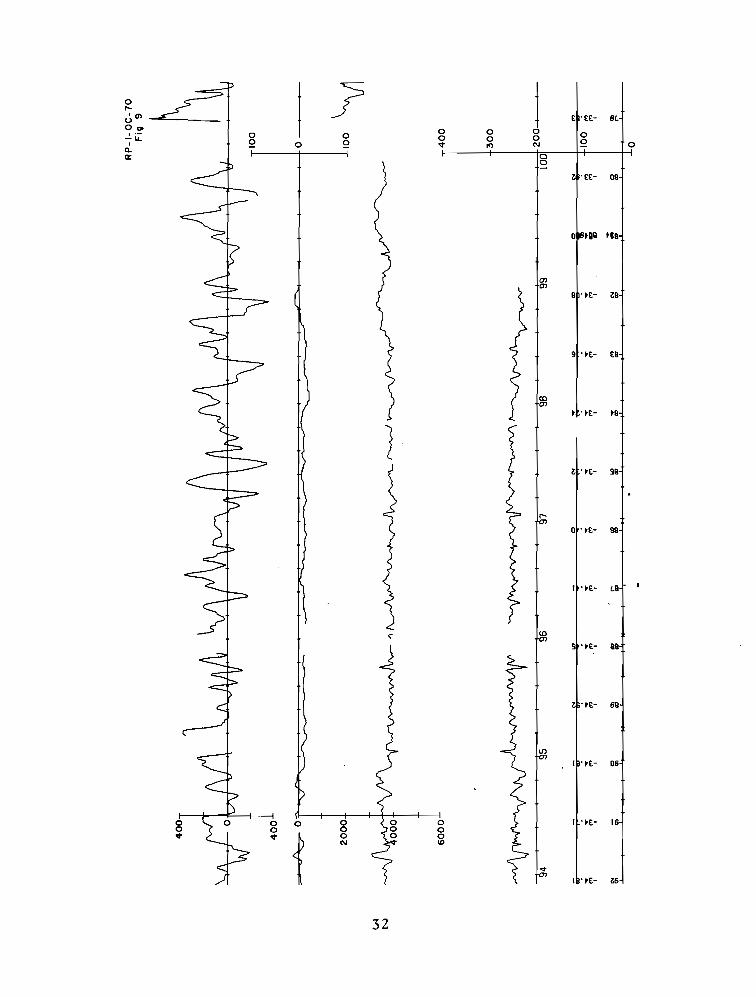
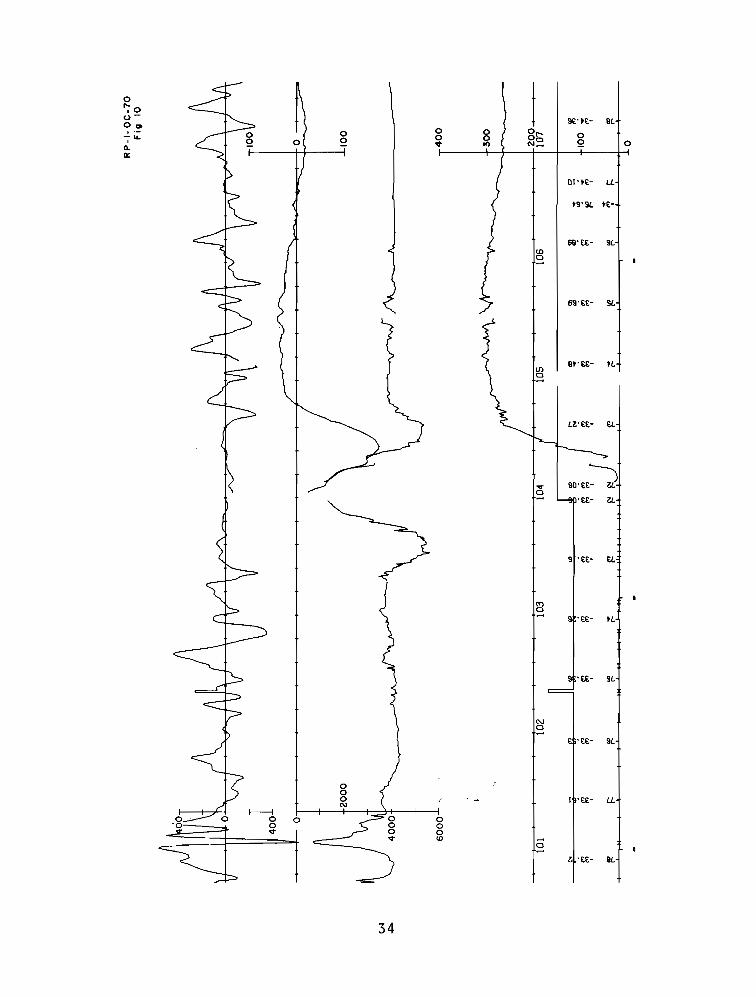
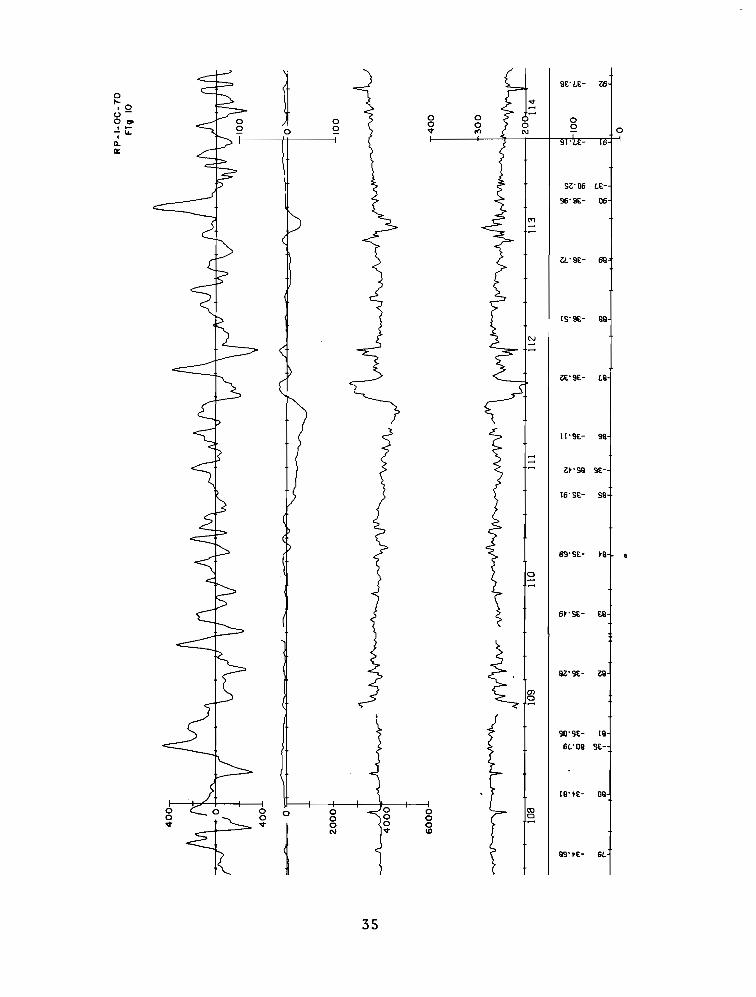
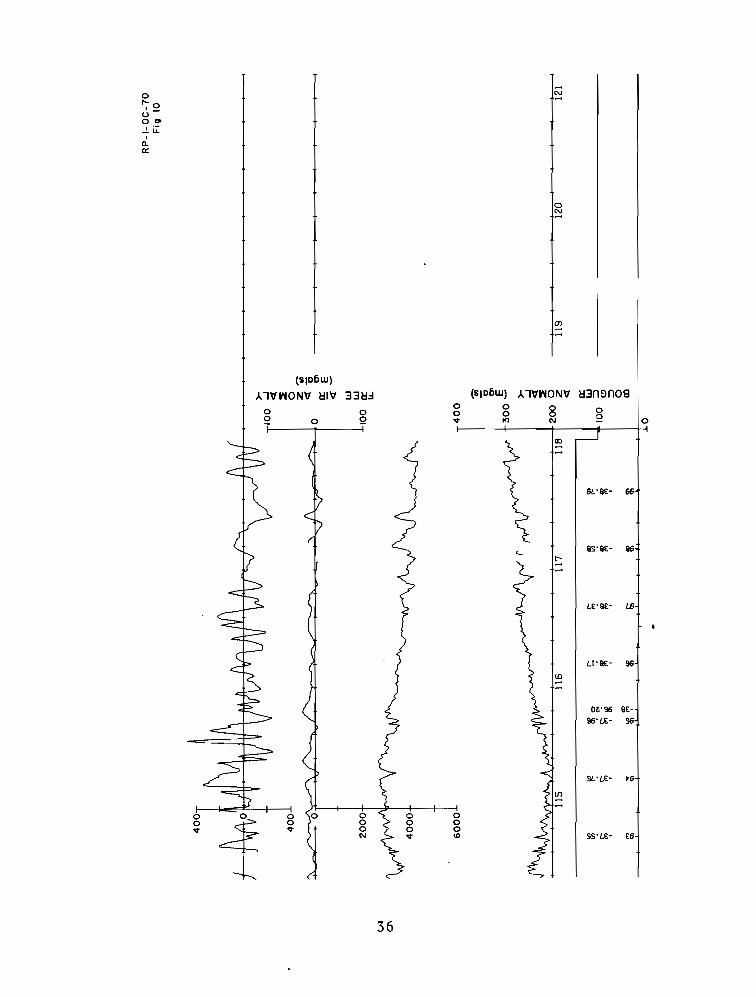
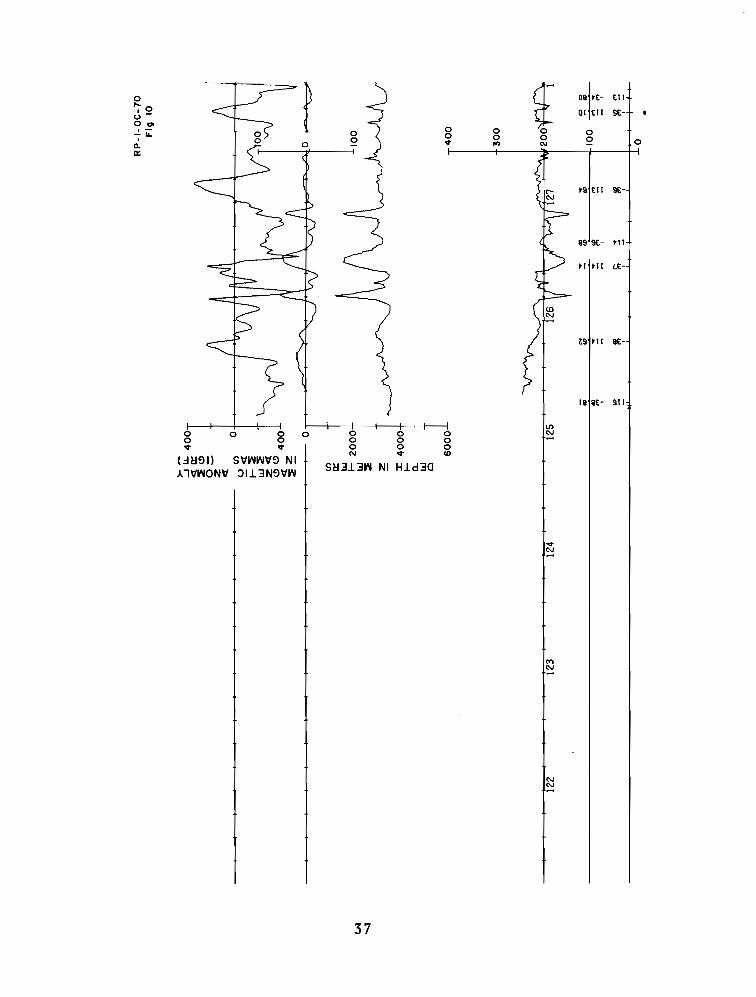
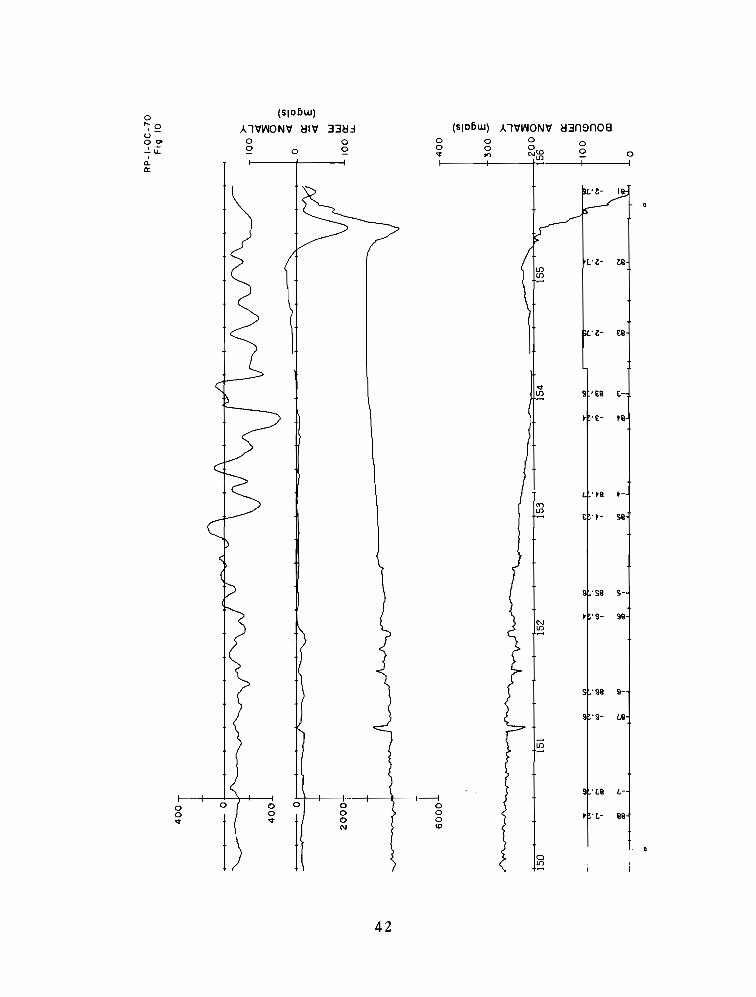
In descending order on each page are the profiles of the Magnetic
Anomaly, Free Air Anomaly, Bathymetry, and Bouguer Anomaly. Appropriate
scales are found along the profile sections. The distance traveled,
course changes, and the ship's positions are shown in conjunction with
the profiles. Latitude and Longitude are indicated at the half-tic marks
and the full-tic marks denote position fixes.
Positions or areas of interest in the trackline charts (figs. 1-5)
may be quickly located with the aid of the four Location Indices (figs.
8-10).
14
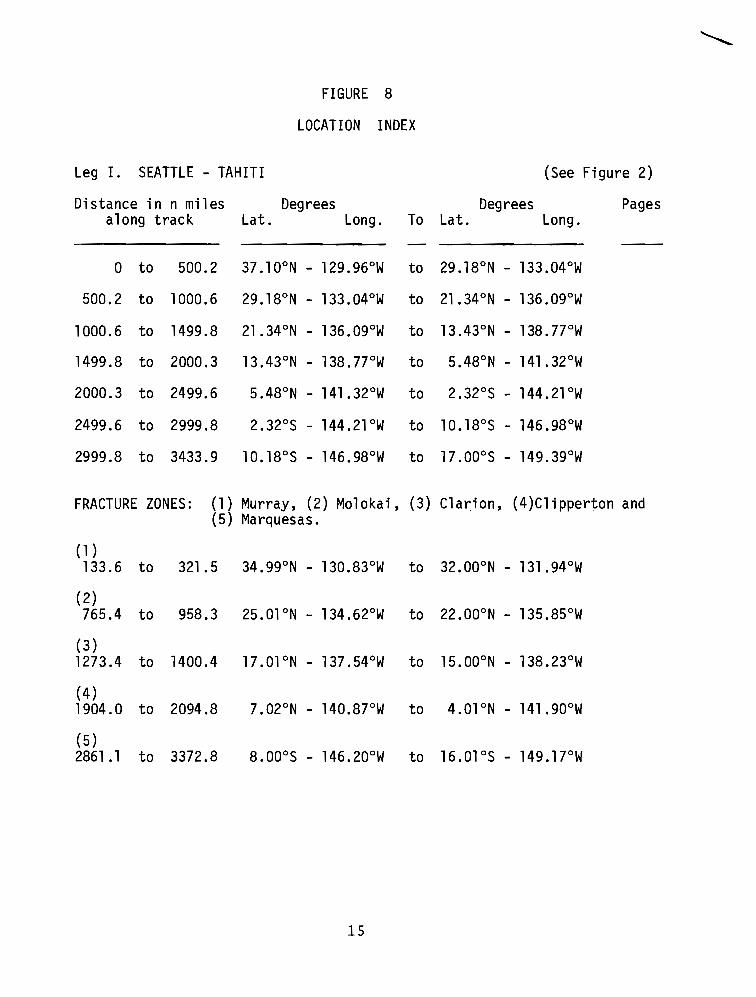
Leg I. SEATTLE - TAHITI
FIGURE 8
LOCATION INDEX
(See Figure 2)
Di stance inn mil es Degrees Degrees Pagesalong track Lat. Long. To Lat. Long.
o to 500.2 37.100 N - 129.96°W to 29.18°N - 133.04°W
500.2 to 1000.6 29.18°N - 133.04°W to 21.34°N - 136.09°W
1000.6 to 1499.8 21.34°N - 136.09°W to 13.43°N - 138.77°W
1499.8 to 2000.3 13.43°N - 138.77°W to 5.48°N - 141.32°W
2000.3 to 2499.6
2499.6 to 2999.8 2.32°S - 144.21°W to 10.18°S - 146.98°W
2999.8 to 3433.9 10.18°S - 146.98°W to 17.000 S - 149.39°W
FRACTURE ZONES: (1) Murray, (2) Molokai, (3) Cla~ion, (4)Clipperton and(5) Marquesas.
(1 )133.6 to 321.5 34.99°N - 130.83°W to 32.000 N - 131.94°W
(2)765.4 to 958.3 25.01°N - 134.62°W to 22.000 N - 135.85°W
(3)1273.4 to 1400.4 17.01°N - 137.54°W to 15.000 N - 138.23°W
(4)1904.0 to 2094.8
(5)2861.1 to 3372.8
15
EQ'IE Uf
~6'IEr ~E
LE'OEI 9E
O9'IEI EE
SS'~E lEI
IE'UI fE
I.LJUZa:.....en-o
13 ~Q'OEI SE
--'~
--'-a:'U
.....~a:zz-
....
oog<D
ooo~
ogC\J
og~
I
og~
L IS'EEI i0I"- 0JeD 0 0
0",.,. Q C-
0·-- ... 0 0I Q
II.0::
Il'EEf 6~
6~'~ EEl
( .:IMQ I I Sl::llJlJt:tn NIAll::llJONl::l JI13NOl::llJ
S~313lJ NI Hld30
<Xlo
l2 *16
6S'll 9EI
U'9E1 Il
SQ'SEI U
m
to
o-
s_- ,- --,
l5'9E1 51
~ --9S'9EI Ol
.l'.El 9l
.9'9l .El
0 0 0 0 0SQ'EEI ~l
0 0 0 8.,.
L.,.
10
~N '"
0 t,..,<'>(1)0", 0 0 0 0 0
1 __ 2 0 0 0 0 00
- ... .,. "\ N 52 0
I
Cl. El'~EI 91II< N
17
El'8El SI
09"6£1 II
OS·lltl EI
EL.·ll SEI
98"S Otl96"6£1 01
9l'SEl II
SS"lltl tl
...-
LO-
t9"SI lltl
L.8"L.EI 91
0 0 00 0 0". 0 0
N ".('f)-
SS"L.EI 1.1
0 ~ \ i 9S" 9 Itl,..'Ill)
U 0 00", 0 ( 0 0 0 en L.8·0tl I.I .- 0 0 ". If) -"'iu. 0Q.
~0 0a:2
L.s·ot! 8
CD-L.l"Otl S
18

91"£tl
(Y)N
NN
IS"ltl S
0 0 0 0 0
~0 0 0 N0 0 0N .,. <D
LT" ttl 9
0 ~ ~ .-j,.. ,j'
I
OeD0 ... 0 0 0 0 0
I ._Q
0 0 0 0-LL.,. ", N 0
I
11.lr
tt"ttl £-
LI)N
II" ttl l-
t9"1- ttl
18"£tl 1-
....N
19
II'Stl £1-
18'9tl 01-
6l'Lti 11-
59'Ltl ll-
tS'9tl 8-
mN
81'9tl S-
8t'L- 9tl
coN IS'Stl L-
a tl'OI- Ltl
8t'Sti 9-
000 r--~ N
0 0 <:> (j 0 00
rl0
10 0
~ ~ 0 0N <D LI'Stl S-
OS't- Stl
~£6'Stl
"-10...ICI)
0U 0 0 00 ... 0 0 0 01'- ~ If) N-I&.I
0.. £S'Stl tI-ll:
20
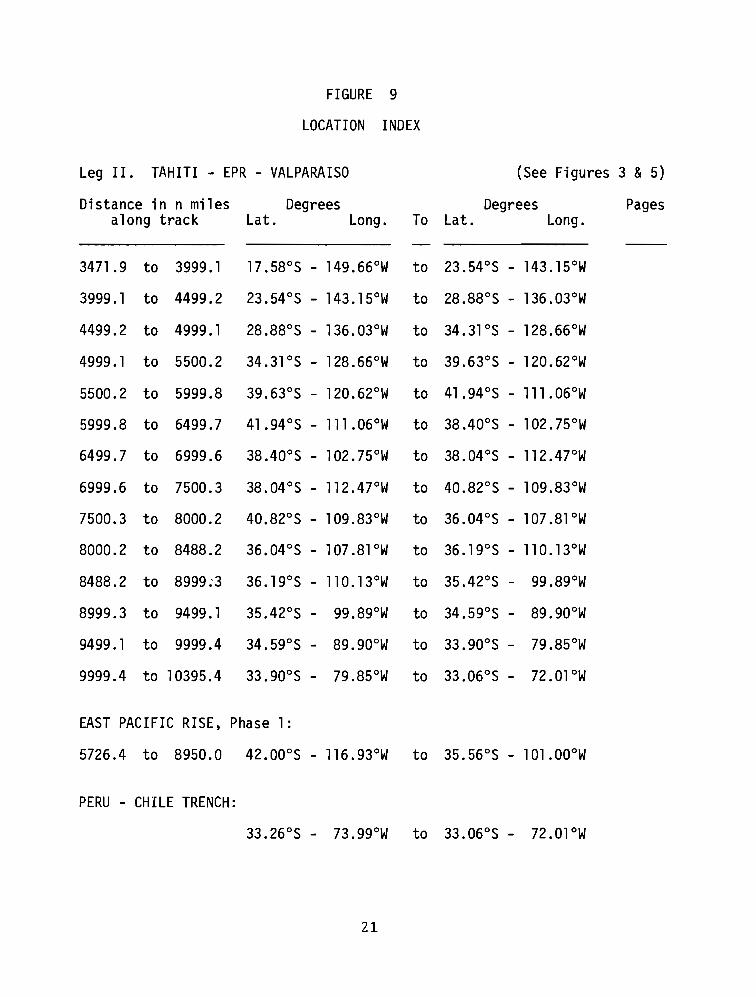
FIGURE 9
LOCATION INDEX
Leg II. TAHITI - EPR - VALPARAI50 (5ee Figures 3 &5)
Distance in n miles Degrees Degrees Pagesalong track Lat. Long. To Lat. Long.
3471.9 to 3999.1 17.58°5 - 149.66°W to 23.54°5 - 143.15°W
3999.1 to 4499.2 23.54°5 - 143.15°W to 28.88°5 - 136.03°W
4499.2 to 4999.1 28.88°5 - 136.03°W to 34.31°5 - 128.66°W
4999.1 to 5500.2 34.31°5 - 128.66°W to 39.63°5 - 120.62°W
5500.2 to 5999.8 39.63°5 - 120.62°W to 41.94°5 - 111.06°W
5999.8 to 6499.7 41.94°5 - 111 .06°W to 38.40°5 - 102.75°W
6499.7 to 6999.6 38.40°5 - 102.75°W to 38.04°5 - 112.47°W
6999.6 to 7500.3 38.04°5 - 112.47°W to 40.82°5 - 109.83°W
7500.3 to 8000.2 40.82°5 - 109.83°W to 36.04°5 - 107.81°W
8000.2 to 8488.2 36.04°5 - 107.81°W to 36.19°5 - 110.13°W
8488.2 to 8999:3 36.19°5 - 110.13°W to 35.42°5 - 99.89°W
8999.3 to 9499.1 35.42°5 - 99.89°W to 34.59°5 - 89.900 W
9499.1 to 9999.4 34.59°$ - 89.900 W to 33.90°5 - 79.85°W
9999.4 to 10395.4 33.90°$ - 79.85°W to 33.06°$ - 72.01 oW
EA5T PACIFIC RI5E, Phase 1:
5726.4 to 8950.0 42.00°5 - 116.93°W to 35.56°5 - 101.000 W
PERU - CHILE TRENCH:
33.26°5 - 73.99°W to 33.06°5 - 72.Ol oW
21

1·
'SI- Qtl
t'9tl IZ-
I'ZZ- StlI'Stl U-
l.'l.tl OZ-
£'IZ- 9tl
S'OZ- I.tl
Ot'Stl 1.1-
91'Stl 91-
1.9'Sti QI-
oooID
ooo~
oooC\l
oo~
0,..I
VOl0",1'- '£tl uj-ILI
Q.a: 0
0 'u- ttl~ 0
22
'8~- LEI
t'L~- 8El
E'LEI 8~-
8'SEI ~
'~- 9EI
9' 8EI L~-
L' 9~- 6El
~'S~- It I
E'ltl S~-
...S't~- ~tJ
0 0 0 0 00 0
~0 0
<t <t 0 0
r'·~' "jN <l>
9'E~- Etla...
0
~ j ~,oc- ."jt-o
U OI
O~ 0 0 0, .- 0-;- ... n 0 <t 2 0C1.0:
9'~EI OE-
9'6~- SEI
23
-31 133.4
133 -31.
T~ 1~:
131 -32.8'-33 130.
130 -33.6
-34 129.
129 -34.1
128 -34.6
-35 121.4
121 -35.3
-36126
125
-31 124.6
enooo
tZ
Nooo
~
oo
BOUGUER ANOMALY (mgals)
124 -31.4
FREE AIR ANOMALY(mgals)
o ooUNoo
l>Ioo
~
oo
oo
o oo
::0'tl.
"TI-_.,"'0
"'~....o

'6£- I~I
'I~I 6£-
1'8£- tll
·tll 8£-
lJlUJ....J
~
(n....Ja:u~::)a:z
~
UJUza:~
lJl
o
/.'8£- UI
'81l H-
'O~- 611
'O~- O~I
(' 0<:1 O~-
lJl
.....lJl
1 J..- .u! ·~ Q 0
oo,.,o
o<t
oQ
o....~(J)0",.!.~
ICl.II:
oo....
o 8....I
o oooN
o8....
8aU)
( :I~ I 1 Stl~~tJ{) NIAltl~ONtl JI13NOtl~
S~313~ NI Hld30
0Cla
12 *25

t 'It- 601
t 'It- QOI
S9 tOI It-
~t It- SOl
-<0
o 0o 0
~ ~
6L 8£-tOil
0 tl tOI 6£-r--~lll 0
0 00 0
00", Q .,. ,.., Q 0, .--;-11-C1.cr
16 tol Ot-II Ot- tOI
26
~O'9E- ~II
10'9£- 111
EO'9£- LOI
EO'9£- 901
EO'9£- 601
EO' 9E- 011
90' 9E- Ell
9O'9E- ~II
oor<>
ooq-
~O'9£- 901
}EO'9£- SOl
1 t (0(0 116' LE- ~Ol
f /.6' LE- EOI
0 0 00
P 110 0
?.,. 0 0
q- UI
>LJ)(0
27
o,...':'<7>0",..!.~,Q.ll::
j i J0,...
901~'0>
0 0 16 9E-u0", 0 0 0 0 60 901 LE-O' .-
C ~ v ,., (\j-a..,0
a.II::
0
'n- ~II'~II n-
'SE- •••'.11 SE-
00 BI+ BIt
IG DtT 'H
.... '
1[
ooo<D
ooov
28
tS'£1I 9£-
L8'S£- III·
96'9£- ~II·
66'9£- £11
oo..,
oo.,.
511'9£- 011
\ 06'9£- 601
U'801 9£-
£0'9£- 801
( SO'9£- LOI
o";"0>u0'", .--;1&-Cl.0::
o...c..'>Cll0",, .--;l&.n-o::
(SID6w)
Al'1tt'\lON'It ~1'It 33H:l
oI
~ '9£- tOI
1 '901 9£-
ooI
oo":'en
oo..,
(SID6w) Al'1tt'\lON'It ~3n~n08
oooID
oo.,.
oooC\I
oQo
o 0o.,.
oo
ooo.,.
t '!It- LOI
l:8 9 .!It- 901
t '!It- 601
30
I 'S£- 001
I 'S£- £01
o 'S£- sa
t 'S£- 96
8 'S£- t6
'S£- Q6
9 ·S£- 101
·S£- 66
enu.J...J-:i:
en ci. t· S£- ZOIu-......;;;)II:Z
~
u.J
~ If:P-J......en-a
115f"ft1""&a8to
8a..a
8N
a aa..
I
aaa..
0
f. j
I"-'0>
(.)
l~0'" 0 0 . 1£-~Li:
0 0 0 £6, 0 Q v rtl 0
'l.0:: 0
Q
8'£6 S£-Z 'S£- 16
(.:I~11 Sl:fWWl:ffi NIAll:fWDNl:f JI13NOl:fW
S~313W NI Hld30
31
(0(j)
0 0 0 I • ~E- 160 0
{0 0N <D
..(j)
I '~E- l6
32
0 :; j,..Oil> E 'EE- 6t0",, .- 0
0 0 0 0-;lL Q0 0 0 Q
~0 ... .... N 0
a:: 00- 08
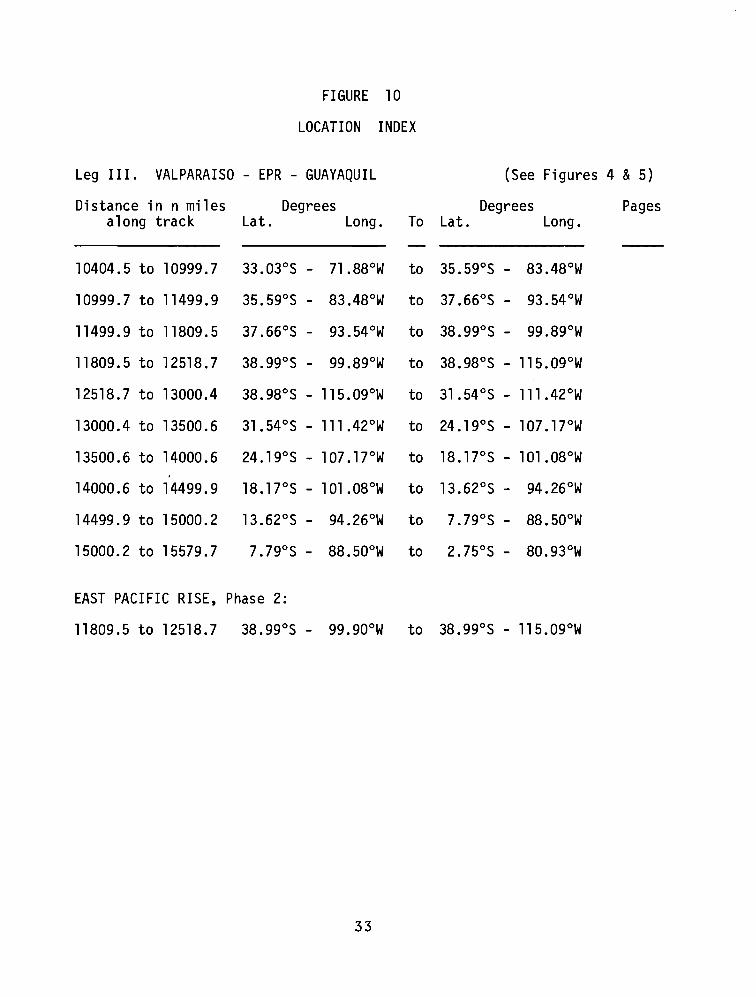
FIGURE 10
LOCATION INDEX
Leg II I. VALPARAISO - EPR - GUAYAQUIL (See Figures 4 &5)
Distance in n miles Degrees Degrees Pagesalong track Lat. Long. To Lat. Long.
10404.5 to 10999.7 33.03°S - 71.88°W to 35.59°S - 83.48°W
10999.7 to 11499.9 35.59°S - 83.48°W to 37.66°S - 93.54°W
11499.9 to 11809.5 37.66°S - 93.54°W to 38.99°S - 99.89°W
11809.5 to 12518.7 38.99°S - 99.89°W to 38.98°S - 115.09°W
12518.7 to 13000.4 38.98°S - 115.09°W to 31.54°S - 111.42°W
13000.4 to 13500.6 31.54°S - 111 .42°W to 24.19°S - 107.17°W
13500.6 to 14000.6 24.19°S - 107.17°W to 18.17°S - 101.08°W
14000.6 to 14499.9 18.17°S - 101 .08°W to 13.62°S - 94.26°W
14499.9 to 15000.2 13.62°S - 94.26°W to 7.79°S - 88.500 W
15000.2 to 15579.7 7.79°S - 88.500 W to 2.75°S - 80.93°W
EAST PACIFIC RISE, Phase 2:
11809.5 to 12518.7 38.99°S - 99.900 W to 38.99°S - 115.09°W
33
SL
\ '((- LL
9 ,((-
~ '((- QL
('((- 9L
Q.'U- nII)0-
Ll'((- (L
).... 90'((- <II.0
'U- ~L
o
No-
ooo<0
goN
0 j":"00- 9('.(- QL0",
0 0 0 .....' -- 0 0-;-1&.~
0 0 0 0 Q 00 ~.., N_
Il.It:
0\'.(- LL
.9'9L .(-
SQ'((- 9Lto0-
69-((- SL
34
6Q
~t'SQ 9£-
IS'9£- QQ
11'9£- 9Q
~'9£- ~Q
16' S£- SQ
69'S£- tQ
6t'S£- £II
t lIZ'S£- ~Q
(7)Cl
SO'S£- IQ
6~'OQ S£-
IQ't£- OQ
a a a a a a a a:la zr a a a a Clv v
ja a a'" v III
QS't£- 6~
~~6
a...,0u-0", a a a a, - a a a 2-L<- a v .., a,
Q. I'~£- 16a::
S~'06 ~£-
06
35
o"'0~-00..!.ii:
Ill.cr:
oN
en-
LE' 9£- La
U'QE- 96
QS'QE- Q6
Ol'sa QE96' LE- sa
c....
(SIDDW)
Al'tWON't ~I't 33~.:1 (SIDDW) Al'tWON't ~3n~n08
0 00 0 0 00 0 0
~ 0 Q v ,., C\l 2 0
\D--6L'QE- 66
SL'LE- ~6
0
i0 0
0 0 0v v 0
<D SS'LE- ES
36
tl til L£-
89 9£- tIT
188£- SII
19 tIT 8£-
lJl
""ooo<D
o 0o 0o 0'" .,.
S~3.l3Vtl NI H.ld30
oooo.,. oo.,.
(.:I~~1l S'1VtlVtl'1~ NIAl'1VtlON'f :)I.l3N~'1Vtl
0
f [";"0081 t£- £11
0-0",
01 £11 S£-
, .--;~ 0
0
Q.0
00 0 0
a:0
.,. 0 0 0If) '" 0
t9 £11 9£-
37
8£
::0"tlI
.,,- _.,"'0
oO~
o
... ooo~8=:(g o?1<:"1!_I I,,>III') III
enooo
... oo
l>Ioo
oo
III-30~5"1
108-25125
109-26153
110-28~28
-26108159
-2510"1180
-30lIM"15
-3111I~19
112-32~"15
-33112~12
-291I0~31
-34112~59
-28109~8"1
-32IIH63
o
8 001 8101 81- 101
Sl: 901 El:-
89 U- 901
l.t SOl u-
o....-
CD....-
0 0 0 0 0 00 0 0 0 0• •
t0 0 0N • ID "T Ut
I/)....-
Ot 91- 66
0";2U0",, .--;-LLll. .... I '66 LI-It:
0 JI.I- 0010 0 00 0
0 2 • I") 2 0
39
o":00-0 .....--~.Q.
ll:
oo o
oo
oo~
oo,., o
2
X+
o
oo~
o oo~
40
oooCD
Lf)...-~ '£J- ~6
~ '£1- S6
0'16 11-
I '06 01-
SS 01- 16
OJ...-
r-...-99 11- ~6
'~ ~I-
(fJlJJ--I-:I:
to... --1_a:
~I- t6r u....:J 't6 €I-a:
}zZ
lJJ 6l~€r-uza:....(fJ
0LJ)...
ft!1'""&-aaaID
aaa...
aaaN
a aa...
I
Cloa...
0 ~ 'QQ '-j~Q00", 0, .- 0 0 0-L>- 0 0 0 'Q- 6Q, 0ll.
0.,. It) N 0
a:
en... S '6Q 6-
~-
o '6- 06
(jWll StlloJloJl::f() NIAltlloJONtl JI13NDtlloJ
S~3131oJ NI Hld30
OJ
8r- *
41
aaa'"
a a°NID a a
lflf-------+------+-----+-I----II
aa<t
33~.:l
°a
(Sloflw)
Al\f~ON\f ~I\f
oo
o.... 0~-0""~~,ll.a:
...lfl 9 '£Q £-
IQ
ZQ
'SQ S-
'Z- tQ
~ 'S- 9Q
'9Q 9-
9 '9- LQ
lfl
9 "LQ L-
a a a aa
ja a
~ 'L- QQ<t 0 a
N tD
alfl
42
8. ACKNOWLEDGEMENTS
I thank F.P. Naugler, J.M. Wageman, and D.A. Emilia for helpful sug
gestions used in the preparation of this report. They, along with R.E.
Burns, read the manuscript and offered constructive criticisms. S.P.
Perry was responsible for producing the geophysical profile. R.R. Uh"lhorn
did the drafting. Laurie Burgess typed the manuscript.
A special acknowledgement is due the officers and crew of the
OCEANOGRAPHER. Their efforts contributed to the success of RP-l-OC-70.
9. REFERENCES
Holloway, Gregory (1971), A Quick Users Guide to ARIES. Archive Re
trieval Information Editing System, (POL Manual).
Von Herzen, R.P. and A.E. Maxwell (1950), The measurement of thermal
conductivity of deep-sea sediments by a needle probe method. J.
Geophys. Res, Vol. 64, 1557-1563.
43


APPENDIX A SCIENTIFIC PERSONNEL
NAME AFFI LIATION DATE
Robert E. Burns* ESSA - POL 13 January-31 March
Clive R.B. Lister u. of Washington 13 January-5 March
Alexander Ma1ahoff u. of Washington 13 January-30 January
Richard W. Marvin u. of Washington 13 January-30 January
Robert G. Zachariadis u. of Washington 13 January-30 January
Albert Erickson M.LT. 2 March-31 March
Stanley Cisowski M.LT. 2 March-31 March
Beverly Carroll M.LT. 2 March-31 March
Elaine Papworth M.LT. 2 March-31 March
Lawrence Machesky U. of Hawaii 5 March-31 March
*Chief Scientist
45

APPENDIX B SPECIAL PROJECTS
B 1. Bathythermographs
Expendable bathythermograph (XBT) observations were made daily at
OOOOZ, 0600Z, 1200Z, and 1800Z while enroute to Tahiti (Leg I). Surface
bucket temperatures were taken for reference. The seawater temperature
recorder operated continuously. These readings agreed within ~ 0.2°C of
bucket temperatures.
B 2. Chart Verification
Leg I: Matahive Island
Date Position Verified: 25 January 1970
Findings: The position check utilized Satellite Navigation, visual
bearings, and radar distances. The island's position was found to lie as
charted on H.O. Chart 5732.
Leg II: Juan Fernandes Islands: Robinson Crusoe, Santa Clara, and
Alejandro Selkirk Island (Mas Afuera)
Date Position Verified: 25 February 1970
Findings: Positions were checked utilizing Satellite Navigation,
visual bearings, and radar distances. The charted positions of Robinson
Crusoe and Santa Clara Islands on H.O. Chart 1267 differ up to 5 n mi from
the positions shown on the 1969 Chilean Chart No. 509. The positions as
shown on the Chilean chart were substantiated. The position of Alejandro
Selkirk Island appeared to be 2.6 n mi southwest of its charted position
on H.O. 1267.
47
B 3. Deep Sea Camera
The Massachusetts Institute of Technology supplied an EG&G camera and
strobe light for the deep sea photography operations. The camera apparatus
and the Edo pinger were lowered at positions 39.01 0 S - 105.24°W, 39.03°S
107.56°W, 38.76°S - 111.36°W, and 39.02°S - 115.08°W on Leg II.
The camera focal length was set between 4 and 20 ft. Depth control
was maintained by using the PBR in conjunction with an oscilloscope. The
camera unit was kept at a distance of approximately 12 ft off the bottom
with the aid of the pinger. Malfunctioning of the camera brought negative
results at two stations.
B 4. Easter Island (Rapa Nui) Gravity Survey
The land gravity survey of Easter Island was not initially one of the
OPR-l-OC-70 projects but resulted from the illness and subsequent medical
evacuation to the Island of the OCEANOGRAPHER'S 3rd Assistant Engineer.
The stop-over at Easter Island offered an opportunity to obtain gravity
data that could be tied into the first order world gravity net. A success
ful reconnaissance gravity survey was made on the 22nd and 23rd of March
during Leg III portion of the cruise. Readings were taken at 23 stations.
Ship personnel involved in these measurements were Mr. L.F. Machesky,
U. of Hawaii, Lt. F.P. Rossi, and Ensigns J.A. Miller, and A. N. Flior
USESSA of the USC&GSS OCEANOGRAPHER. Their efforts were combined with
those of Mr. Mark Speath, USC&GSS, Rockville, Maryland, Mr. Dan Wa"lker,
U. of Hawaii, and Sr. Bernardo, U. of Chile. These men who volunteered
48
their services, were living on the island at the time and engaged in
completing a new seismic vault. Island transportation was provided by
the Chilean Air Force, Easter Island Detachment.
B 5. Equatorial Surface Current Study
Velocities and directions of equatorial surface currents were measured
between 135°W and 1500 Wlongitude during Leg I of the cruise. The method
of determining ship set and drift used in this study is not complex but it
does require highly accurate navigation. The computed direction and
speed of the surface current is expressed as a vector quantity obtained
after the difference between the indicated course and distance and the
actual course and distance-made-good has been established. Primary control
of the trackline was maintained with AN/SRN-9 Satellite Navigation equip
ment. Course errors, after averaging, are believed to be within + 1°.
Distance through the water, determined by the underwater log distance
indicator (ULDI), is believed to be accurate to within + 0.1 n mi/hr.
This includes effect of wind on ships speed. After completion of the
smooth plotting, the ship's actual course and distance are probably accu
rate to within 0.5° and 0.5 n mi/hr.
The results of this surface current study are in general agreement
with the findings of others (summarized by Neumann and Pierson, 1966).
Data acquired along the OCEANOGRAPHER'S trackline indicates that a marked
change in the direction of the South Equatorial Current occurs approxi
mately 1° south of the equator. The surface currents south of the South
Equatorial Current, at about 60 S latitude, also turn from a south-south
westerly direction and flow south-southeastward around the western edge
49
of the Marquesas Islands and the Tuamotu Archipelago. The suggestion
has been made that these islands may partially divert the flow of the
South Pacific Gyre with a resulting surface current pattern that is not
a part of the large scale circulation. It is necessary to emphasize,
however, that the data from this surface current study are applicable
only to the region investigated between 135°W and 1500 Win January 1970.
B 6. Meteorology
Surface meteorological observations were taken daily at 0000, 0600,
1200, and 1800 hrs except when in port. The weather program began 17
January and continued for the remainder of the cruise. A recording
barograph operated from 13 January to 30 March.
Forecasts and facsimile weather charts, transmitted from Navy Fleet
Weather Central in Honolulu, aided the ship's meteorology officer in setting
up weather forcasts for shipboard use.
A total of 208 observations were recorded. Of these, 198 were trans
mitted for relay to weather centers in Washington, D.C. and Honolulu,
Hawaii. Synoptic weather observations and barogram records were checked
and filed for later shipment to the Marine Climatological Branch, U.S.
Weather Bureau.
B 7. Radiocarbon Study
Water samples for a Carbon-14 study were taken at 39°00 1 S and
105°15 1W for Anthony W. Young of the University of Washington Chemistry
Department. Fifteen gallon samples were obtained from the surface and
50
at depths of 50, 100, 200, 300, 500, 750, 1600, 2000 and 2400 meters.
The samples were processed aboard ship to remove the dissolved carbonate
fraction and later sent to the University's Radiocarbon Dating Laboratory
for analyses.
B 8. References
Knauss, J.A. (1963), Equatorial Current Systems, in The Sea, ed. M.N. Hill,
£' 235-252, (Interscience Publishers, New York - London)
Neumann, G. and W.J. Pierson, Jr. (1966), Principles of Physical Oceano
graphy, (Prentice - Hall, Inc., New Jersey).
51


APPENDIX C CORING STATION SUMMARY
Position Location Depth Core Pilot CoreNumber Lat. Long. (meters) Length(cm) Length(cm)
1059 360 02'5 - 1330 53 1W 3236 187
1089 350 54 1 5 - 1090 51 1W 2850 201
1093 350 59 15 - 1080 28'W 3374 229 52
1096 36 0 04 1 5 - 1070 ll l W 3437 110 45
1097 360 02'5 - 1060 46 1W 3595 130 46
1440 390 01 IS - 1020 01 1W 3994 164 51
1449 390 01 IS - 1020 43 1W 3952 98 37
1465 390 00 1 5 - 1030 32 1W 3889 134 59
1473 390 00'5 - 1040 07 1W 3737 236 51
1503 380 59'S - 1070 30 l W 3509 246 53
1504 380 59 1 5 - 107 0 33'W 3540 203 28
1506 390 04'5 - 1070 34 1W 3548 233
1520 380 58 1 5 - 107 0 54 1W 3510 149 57
1521 390 02'5 - 1080 33'W 3397 219 47
1528 380 56 1 5 - 1090 06'W 3074 214 55
1534 390 01 IS - 1090 44 1W 3170 177 54
1540 390 01 1 5 - 1100 31 1W 2811 184 53
1549 380 58 1 5 - 111 0 21 1W 2754 159 46
1560 390 00'5 - 111 0 51 1W 2924 136 54
53
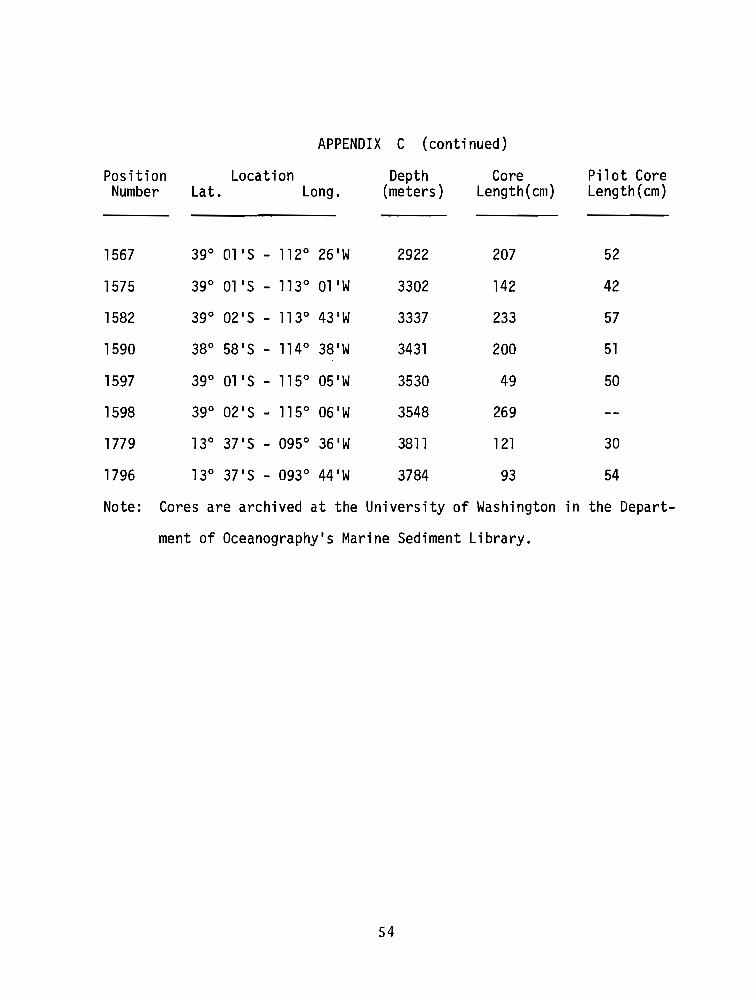
APPENDIX C (continued)
Position LocationNumber Lat. Long.
Depth(meters)
CoreLength(cm)
Pilot CoreLength(cm)
1567 39° 01'$ - 112° 26 1W 2922 207 52
1575 39° 01'$ - 113° 01 'w 3302 142 42
1582 39° 02 1$ - 113° 43'W 3337 233 57
1590 38° 58 1$ - 114° 38 1W 3431 200 51
1597 39° 01'$ - 115° 05 1W 3530 49 50
1598 39° 02 1 $ - 115° 06 1W 3548 269
1779 13° 37 1$ - 095° 36 1W 3811 121 30
1796 13° 37 1$ - 093° 44 1W 3784 93 54
Note: Cores are archived at the University of Washington in the Depart-
ment of Oceanography's Marine Sediment Library.
54
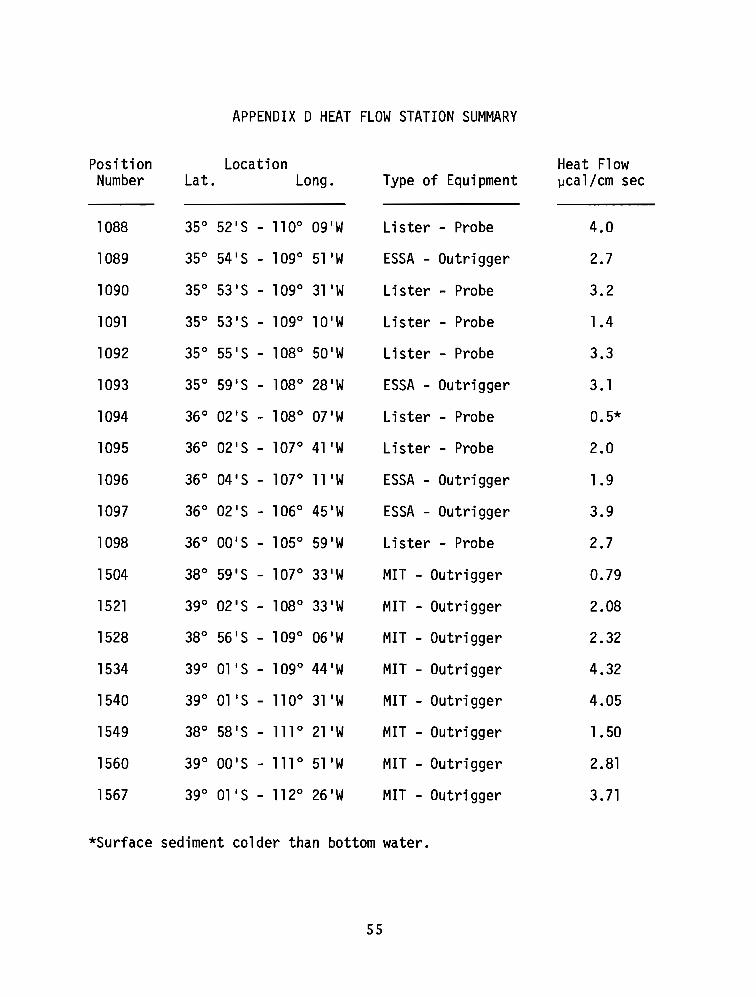
APPENDIX D HEAT FLOW STATION SUMMARY
Positi on Location Heat FlowNumber Lat. Long. Type of Equipment ~cal/cm sec
1088 35° 52 1S - 110° 09 1W Lister - Probe 4.0
1089 35° 54 1S - 109° 51 'W ESSA - Outrigger 2.7
1090 35° 53'S - 109° 31 'W Lister - Probe 3.2
1091 35° 53'S - 109° 10 l W Lister - Probe 1.4
1092 35° 55 1S - 108° 50 l W Lister - Probe 3.3
1093 35° 59'S - 108° 28 1W ESSA - Outrigger 3. 1
1094 36° 02 1S - 108° 07 1W Lister - Probe 0.5*
1095 36° 02 1S - 107° 41 'W Lister - Probe 2.0
1096 36° 04'S - 107° 11'W ESSA - Outrigger 1.9
1097 36° 02 1S - 106° 45 1W ESSA - Outrigger 3.9
1098 36° OOIS - 105° 59'W Lister - Probe 2.7
1504 38° 59'S - 107° 33 1W MIT - Outrigger 0.79
1521 39° 02'S - 108° 33'W MIT - Outri gger 2.08
1528 38° 56 1S - 109° 06'W MIT - Outrigger 2.32
1534 39° 01 1 S - 109° 44'W MIT - Outri gger 4.32
1540 39° 01 IS - 110° 31 'W MIT - Outrigger 4.05
1549 38° 58 1S _ 111 ° 21 IW MIT- Outri gger 1.50
1560 39° OO'S _ 111 ° 51 1W MIT - Outri gger 2.81
1567 39° 01' S - 112° 26'W MIT - Outri gger 3.71
*Surface sediment colder than bottom water.
55
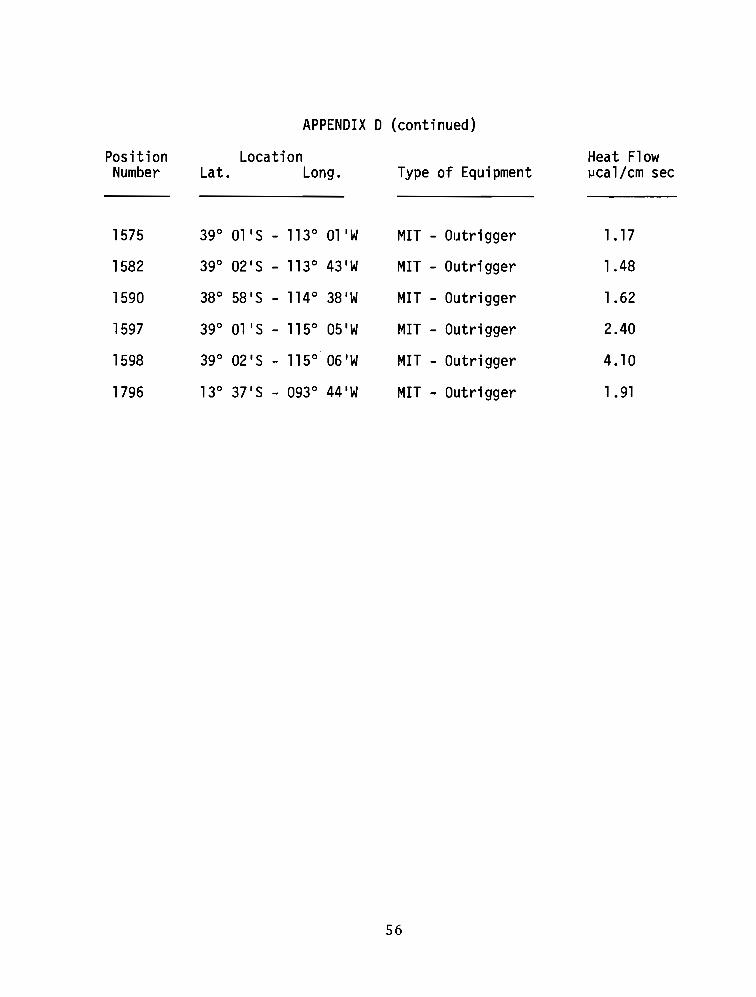
APPENDIX D (continued)
PositionNumber
LocationLat. Long. Type of Equipment
Heat FlowlJca1/cm sec
1575 39° 01 'S - 113° 01 1W MIT - Outrigger 1.17
1582 39° 02'S _ 113° 43'W MIT - Outri gger 1.48
1590 38° 58 1S - 114° 38 1W MIT - Outri gger 1.62
1597 39° 01 IS - 115° 05'W MIT - Outrigger 2.40
1598 39° 02'S - 115° 06'W MIT - Outrigger 4.10
1796 13° 37'S - 093° 44 1W MIT - Outri gger 1. 91
56
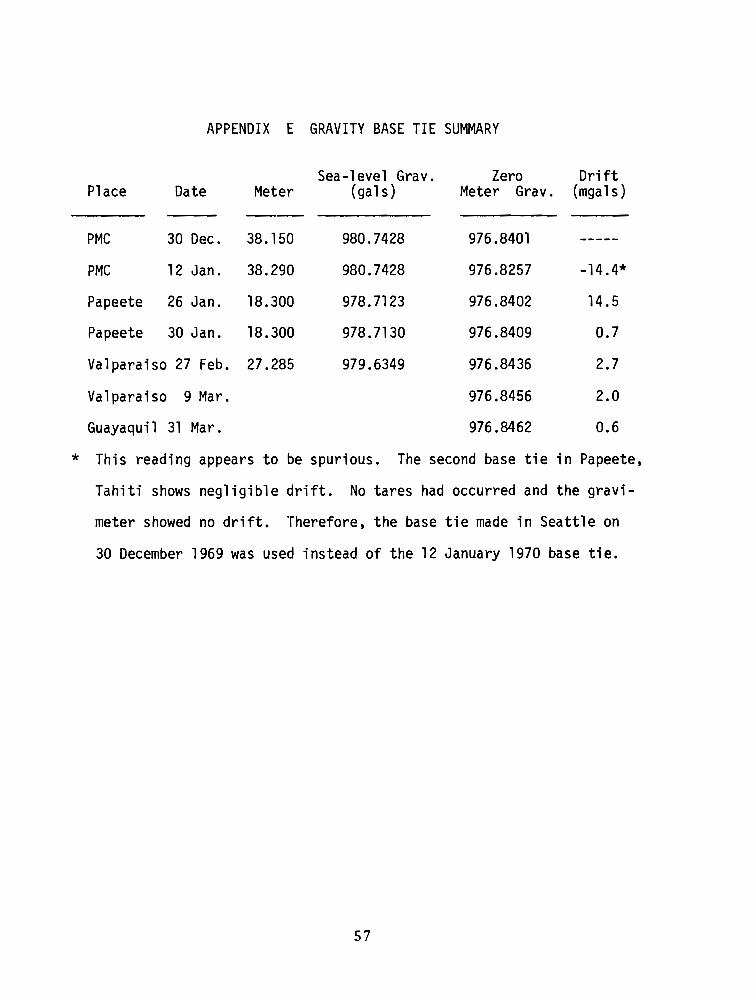
APPENDIX E GRAVITY BASE TIE SUMMARY
Place DateSea-level Grav. Zero Drift
Meter (ga1s) Meter Grav. (mga1s )
PMC 12 Jan. 38.290
Valparaiso 9 Mar.
Guayaquil 31 Mar.
Papeete 26 Jan. 18.300
Papeete 30 Jan. 18.300
Valparaiso 27 Feb. 27.285
PMC 30 Dec. 38.150 980.7428
980.7428
978.7123
978.7130
979.6349
976.8401
976.8257
976.8402
976.8409
976.8436
976.8456
976.8462
-14.4*
14.5
0.7
2.7
2.0
0.6
* This reading appears to be spurious. The second base tie in Papeete.
Tahiti shows negligible drift. No tares had occurred and the gravi
meter showed no drift. Therefore. the base tie made in Seattle on
30 December 1969 was used instead of the 12 January 1970 base tie.
57

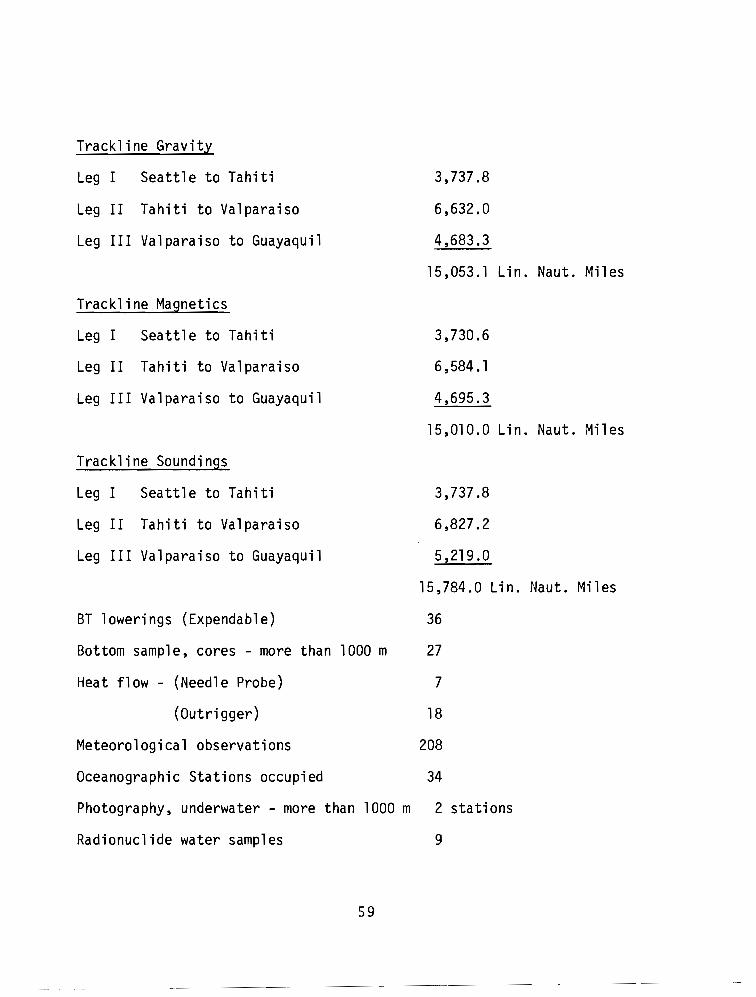
Trackline Soundings
Leg I Seattle to Tahiti
Leg II Tahiti to Valparaiso
Leg III Valparaiso to Guayaquil
Trackline Gravity
Leg I Seattle to Tahiti 3,737.8
Leg II Tahiti to Valparaiso 6,632.0
Leg III Valparaiso to Guayaquil 4,683.3
15,053.1 Lin. Naut. Miles
Trackline Magnetics
Leg I Seattle to Tahiti 3,730.6
Leg II Tahiti to Valparaiso 6,584.1
Leg III Valparaiso to Guayaquil 4,695.3
15,010.0 Lin. Naut. Miles
3,737.8
6,827.2
5,219.0
15,784.0 Lin. Naut. Miles
BT lowerings (Expendable) 36
Bottom sample, cores - more than 1000 m 27
Heat flow - (Needle Probe) 7
(Outri gger) 18
Meteorological observations 208
Oceanographic Stations occupied 34
Photography, underwater - more than 1000 m 2 stations
Radionuclide water samples 9
S9
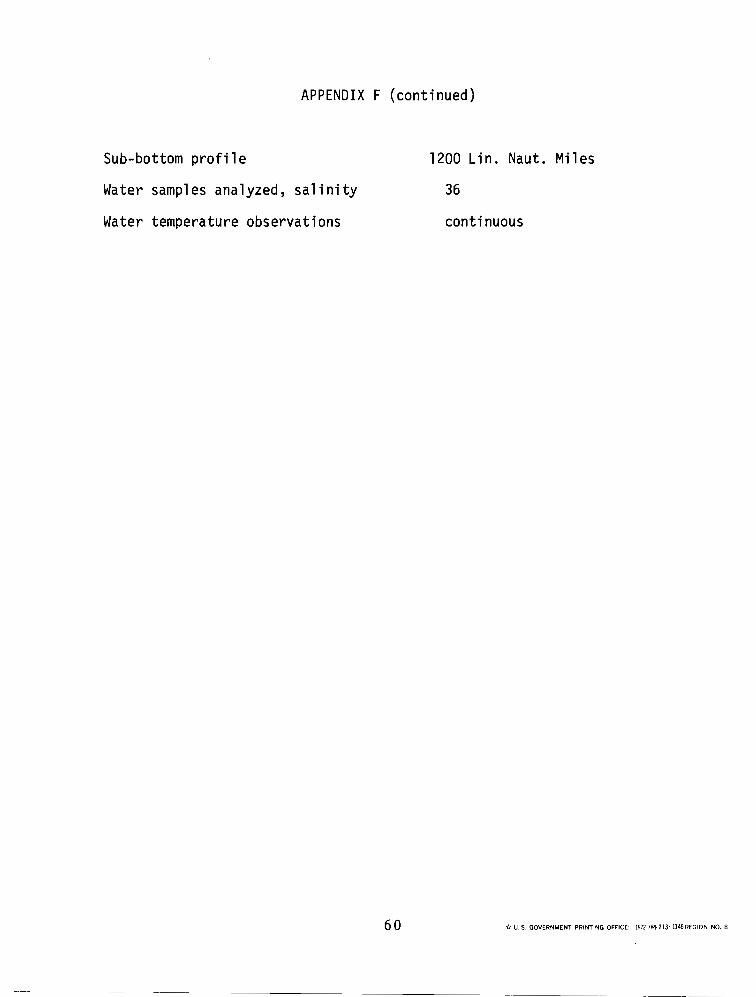
APPENDIX F (continued)
Sub-bottom profile
Water samples analyzed, salinity
Water temperature observations
60
1200 Lin. Naut. Miles
36
continuous
-tr u. s. GOVERNMENT PRINTING OFFICE: 1972·7B4·213/1146REGION NO.8