Royal Bank of Canada - · PDF file€Royal Bank of Canada € ... Modified Following...
37
Royal Bank of Canada $1,750,000,000 2.300% Covered Bonds Due 2021 unconditionally and irrevocably guaranteed as to payments by RBC Covered Bond Guarantor Limited Partnership We will pay interest on the 2.300% covered bonds due March 22, 2021, semi-annually on March 22 and September 22 of each year. We will make the first interest payment on the covered bonds on September 22, 2016. The covered bonds will mature on March 22, 2021. The covered bonds will be our unsecured obligations and will rank equally with our other unsecured and unsubordinated indebtedness from time to time outstanding. The covered bonds are unconditionally and irrevocably guaranteed as to payments by RBC Covered Bond Guarantor Limited Partnership as described in the prospectus. We will issue each covered bond in minimum denominations of U.S.$1,000 and integral multiples of U.S.$1,000. Other than as set forth under “Terms and Conditions of the Covered Bonds – Early Redemption for Taxation Reasons” in the prospectus, we may not redeem the covered bonds prior to their maturity. There is no sinking fund for the covered bonds. We are a registered issuer and this Programme is a registered program under Part I.1 of the National Housing Act (Canada) and the Canadian Registered Covered Bond Programs Guide as amended, restated or replaced from time to time (the “Guide”) published by Canada Mortgage and Housing Corporation (“CMHC”), the administrator of the Canadian covered bond legal framework under Part I.1 of the National Housing Act (Canada). The covered bonds will be registered covered bonds under Part I.1 of the National Housing Act (Canada) and the Guide. THESE COVERED BONDS HAVE NOT BEEN APPROVED OR DISAPPROVED BY CMHC NOR HAS CMHC PASSED UPON THE ACCURACY OR ADEQUACY OF THIS PROSPECTUS SUPPLEMENT. THESE COVERED BONDS ARE NOT INSURED OR GUARANTEED BY CMHC OR THE GOVERNMENT OF CANADA OR ANY OTHER AGENCY THEREOF. Investing in the covered bonds involves a number of risks. See “Risk Factors” beginning on page 17 of the accompanying prospectus dated June 25, 2015. ________________________________________________ NONE OF THE SECURITIES AND EXCHANGE COMMISSION, ANY STATE SECURITIES COMMISSION OR ANY OTHER REGULATORY BODY HAS APPROVED OR DISAPPROVED OF THE COVERED BONDS OR PASSED UPON THE ACCURACY OF THIS PROSPECTUS SUPPLEMENT. ANY (1) The price to the public also will include interest accrued on the covered bonds after March 22, 2016, if any. This prospectus supplement may be used by certain of our affiliates in connection with offers and sales of the covered bonds in market-making transactions. We will deliver the covered bonds in book-entry form through the facilities of The Depository Trust Company (including through its indirect participants CDS Clearing and Depository Services Inc., Euroclear and Clearstream) on or about March 22, 2016 against payment in immediately available funds. The covered bonds will not constitute deposits that are insured by the Canada Deposit Insurance Corporation, the U.S. Federal Deposit Insurance Corporation or any other Canadian or U.S. governmental agency or instrumentality. Investment in the covered bonds is not subject to restriction under the Volcker Rule as an investment in an ownership interest in a covered fund. See Certain Investment Company Act Considerations. ________________________________________________ Prospectus Supplement to the Prospectus dated June 25, 2015 Filed Pursuant to Rule 424(b)(2) Registration Statement No. 333-203567 Per Covered Bond Total Public offering price (1) U.S.$999.30 U.S.$1,748,775,000.00 Underwriting commissions U.S.$2.50 U.S.$4,375,000.00 Proceeds, before expenses, to Royal Bank of Canada U.S.$996.80 U.S.$1,744,400,000.00 Programme Arranger RBC Capital Markets Joint Book-Running Managers RBC Capital Markets Goldman, Sachs & Co. HSBC TD Securities Co-Managers ANZ Securities BB&T Capital Markets DBS Bank Ltd. Desjardins Securities Fifth Third Securities ING Lloyds Securities nabSecurities, LLC National Bank of Canada Financial Markets Natixis Santander Standard Chartered Bank SunTrust Robinson Humphrey US Bancorp Prospectus Supplement dated March 14, 2016.
Transcript of Royal Bank of Canada - · PDF file€Royal Bank of Canada € ... Modified Following...

Royal Bank of Canada
$1,750,000,000 2.300% Covered Bonds Due 2021
unconditionally and irrevocably guaranteed as to payments by
RBC Covered Bond Guarantor Limited Partnership
We will pay interest on the 2.300% covered bonds due March 22, 2021, semi-annually on March 22 and September 22 of each year. We will make the first interest payment on the covered bonds on September 22, 2016. The covered bonds will mature on March 22, 2021. The covered bonds will be our unsecured obligations and will rank equally with our other unsecured and unsubordinated indebtedness from time to time outstanding. The covered bonds are unconditionally and irrevocably guaranteed as to payments by RBC Covered Bond Guarantor Limited Partnership as described in the prospectus. We will issue each covered bond in minimum denominations of U.S.$1,000 and integral multiples of U.S.$1,000.
Other than as set forth under “Terms and Conditions of the Covered Bonds – Early Redemption for Taxation Reasons” in the prospectus, we may not redeem the covered bonds prior to their maturity. There is no sinking fund for the covered bonds.
We are a registered issuer and this Programme is a registered program under Part I.1 of the National Housing Act (Canada) and the Canadian Registered Covered Bond Programs Guide as amended, restated or replaced from time to time (the “Guide”) published by Canada Mortgage and Housing Corporation (“CMHC”), the administrator of the Canadian covered bond legal framework under Part I.1 of the National Housing Act (Canada). The covered bonds will be registered covered bonds under Part I.1 of the National Housing Act (Canada) and the Guide.
THESE COVERED BONDS HAVE NOT BEEN APPROVED OR DISAPPROVED BY CMHC NOR HAS CMHC PASSED UPON THE ACCURACY OR ADEQUACY OF THIS PROSPECTUS SUPPLEMENT. THESE COVERED BONDS ARE NOT INSURED OR GUARANTEED BY CMHC OR THE GOVERNMENT OF CANADA OR ANY OTHER AGENCY THEREOF.
Investing in the covered bonds involves a number of risks. See “Risk Factors” beginning on page 17 of the accompanying prospectus dated June 25, 2015. ________________________________________________
NONE OF THE SECURITIES AND EXCHANGE COMMISSION, ANY STATE SECURITIES COMMISSION OR ANY OTHER REGULATORY BODY HAS
APPROVED OR DISAPPROVED OF THE COVERED BONDS OR PASSED UPON THE ACCURACY OF THIS PROSPECTUS SUPPLEMENT. ANY REPRESENTATION TO THE CONTRARY IS A CRIMINAL OFFENSE.
(1) The price to the public also will include interest accrued on the covered bonds after March 22, 2016, if any.
This prospectus supplement may be used by certain of our affiliates in connection with offers and sales of the covered bonds in market-making transactions. We will deliver the covered bonds in book-entry form through the facilities of The Depository Trust Company (including through its indirect participants CDS Clearing and
Depository Services Inc., Euroclear and Clearstream) on or about March 22, 2016 against payment in immediately available funds.
The covered bonds will not constitute deposits that are insured by the Canada Deposit Insurance Corporation, the U.S. Federal Deposit Insurance Corporation or any other Canadian or U.S. governmental agency or instrumentality.
Investment in the covered bonds is not subject to restriction under the Volcker Rule as an investment in an ownership interest in a covered fund. See Certain Investment Company Act Considerations.
________________________________________________
Prospectus Supplement to the Prospectus dated June 25, 2015 Filed Pursuant to Rule 424(b)(2)
Registration Statement No. 333-203567
Per Covered Bond Total Public offering price (1) U.S.$999.30 U.S.$1,748,775,000.00 Underwriting commissions U.S.$2.50 U.S.$4,375,000.00 Proceeds, before expenses, to Royal Bank of Canada U.S.$996.80 U.S.$1,744,400,000.00
Programme Arranger
RBC Capital Markets
Joint Book-Running Managers RBC Capital Markets Goldman, Sachs & Co. HSBC TD Securities
Co-Managers
ANZ Securities BB&T Capital Markets DBS Bank Ltd. Desjardins Securities Fifth Third Securities ING Lloyds Securities nabSecurities, LLC National Bank of Canada Financial Markets Natixis Santander Standard Chartered Bank SunTrust Robinson Humphrey US Bancorp
Prospectus Supplement dated March 14, 2016.

SUMMARY
This section is meant as a summary and should be read in conjunction with the accompanying prospectus to help you understand the covered bonds. This prospectus supplement, together with the accompanying prospectus, contains the terms of the covered bonds and supersedes all prior or contemporaneous oral statements as well as any other written materials relating to the covered bonds, including preliminary or indicative pricing terms, correspondence, trade ideas, structures for implementation, sample structures, brochures or other educational materials. In the event of any inconsistency or conflict between the terms set forth in this prospectus supplement and the accompanying prospectus, the terms contained in this prospectus supplement will control.
An investment in the covered bonds entails significant risks relating to the covered bonds that are not associated with similar investments in a
conventional debt security, including those described below. You should carefully consider, among other things, the matters set forth under the heading “Risk Factors” beginning on page 17 of the accompanying prospectus dated June 25, 2015. Before investing in the covered bonds, we urge you to consult your investment, legal, tax, accounting and other advisors.
In this prospectus supplement, unless the context otherwise indicates, the “Bank” means Royal Bank of Canada and “Guarantor LP” means RBC
Covered Bond Guarantor Limited Partnership, and “we,” “us” or “our” means the Bank and Guarantor LP collectively. In this prospectus supplement, currency amounts are stated in Canadian dollars (“$”), unless specified otherwise. Capitalized terms used in this prospectus supplement and not otherwise defined herein have the meanings given to such terms in the accompanying prospectus.
Issuer: Royal Bank of Canada Guarantor LP: RBC Covered Bond Guarantor Limited Partnership U.S. Registrar, Paying Agent, Transfer Agent and Exchange Agent:
The Bank of New York Mellon acting through its offices located at 101 Barclay Street, 4th Floor, New York, NY 10286, USA
Specified Currency: (Condition 1.10)
U.S. dollars (“U.S.$”)
Aggregate Principal Amount: U.S.$1,750,000,000 Series: CB31 Tranche: Not applicable Issue Price: 99.930% of the Aggregate Principal Amount Specified Denominations: U.S.$1,000 (Condition 1.08 or 1.09) Calculation Amount: U.S. $1,000 Issue Date: March 22, 2016 Interest Commencement Date March 22, 2016 Final Maturity Date: March 22, 2021 Extended Due for Payment Date of Guaranteed Amounts corresponding to the Final Redemption Amount under the covered bond Guarantee: March 22, 2022
S-2

Interest Rate: 2.300% Fixed Rate payable semi-annually in arrears from and including the Interest Commencement Date to but excluding the Final Maturity Date 1-month USD LIBOR + 106 bps per annum Floating Rate payable monthly in arrears from and including the Final Maturity Date to but excluding the Extended Due for Payment Date (further particulars specified below)
Redemption/Payment Basis: Redemption at par
Change of Interest of Redemption/ Payment Basis: Not Applicable Put/Call Options: Not Applicable
Outstanding Series of Covered Bonds: Series Principal Amount
Maturity Date
Coupon Rate
CB2 € 1,250,000,000 01/22/2018 4.63% CB6 C$1,100,000,000 03/30/2018 3.77% CB7 CHF 500,000,000 04/21/2021 2.25% CB8 U.S.$2,500,000,000 9/19/2017 1.200% CB10 U.S.$1,750,000,000 7/22/2016 1.125% CB11 € 2,000,000,000 8/4/2020 1.625% CB12 AUD1,250,000,000 8/9/2016 Floating Rate CB13 U.S.$2,000,000,000 10/1/2018 2.000% CB14 € 1,500,000,000 10/29/2018 1.25% CB15 € 1,000,000,000 6/19/2019 0.75% CB16 AUD750,000,000 9/23/2019 Floating Rate CB17 U.S.$1,750,000,000 9/23/2019 2.200% CB18 U.S.$2,000,000,000 2/5/2020 1.875% CB19 C$1,500,000,000 3/23/2020 Floating Rate CB20 C$700,000,000 3/23/2020 1.59% CB21 € 1,000,000,000 6/17/2022 0.875% CB22 €279,500,000 7/21/2031 1.652% CB23 £400,000,000 7/20/2018 Floating Rate CB24 U.S.$500,000,000 7/23/2018 Floating Rate CB25 € 1,250,000,000 12/16/2020 0.500% CB26 U.S.$1,750,000,000 10/14/2020 2.100% CB27 € 410,500,000 12/15/2034 1.616% CB28 € 100,000,000 1/14/2036 1.625% CB29 £350,000,000 3/11/2019 Floating Rate CB30 € 1,500,000,000 3/11/2021 0.125%
The Cover Pool: The Covered Bond Portfolio consists of C$51,352,589,575 of Loans on properties located in Canada as of January 31, 2016. See “Summary of Principal Documents – Mortgage Sale Agreement” in the accompanying prospectus and Annex A and Annex B of this prospectus supplement.
Status of the Covered Bonds: Senior Status of the Guarantee: Senior secured with recourse limited to the assets of Guarantor LP
S-3

PROVISIONS RELATING TO INTEREST (IF ANY) PAYABLE Fixed Rate Covered Bond Provisions (Condition 5.12)
Applicable
Rate of Interest: 2.300% per annum payable semi-annually in arrears Interest Payment Date: March 22 and September 22 in each year up to and including the Final Maturity Date Fixed Coupon Amount: U.S.$11.50 per Calculation Amount Day Count Basis: 30/360 Other terms relating to the method of calculating interest for Fixed Rate covered bonds: Not Applicable
PROVISIONS RELATING TO EXTENDED DUE FOR PAYMENT DATE Floating Rate Covered Bond Provisions (Condition 5.12)
If applicable, from and including the Final Maturity Date to but excluding the Extended Due for Payment Date
Interest Period(s): The period from and including each Specified Interest Payment Date, to but excluding the
following Specified Interest Payment Date with the first such period being the period from and including the Final Maturity Date to but excluding the first Specified Interest Payment Date
Specified Interest Payment Dates: The 22nd of each month from but excluding the Final Maturity Date to and including the
Extended Due for Payment Date Calculation Agent:
The Bank, acting through its offices located at Riverbank House, 2 Swan Lane, London EC4R 3BF
Business Day Convention: Modified Following Business Day Convention Business Day(s): New York and Toronto Manner in which the Rate of Interest is to be determined: Screen Rate Determination Reference Rate: 1 month USD LIBOR Interest Determination Date(s): Second London Business Day prior to the start of each Interest Period Relevant Screen Page: Reuters Screen Page LIBOR01 Relevant Time: 11:00 A.M. (London time) Reference Banks: Has the meaning given in the ISDA Definitions Day Count Basis: Actual/360 Margin(s): +106 bps per annum
S-4
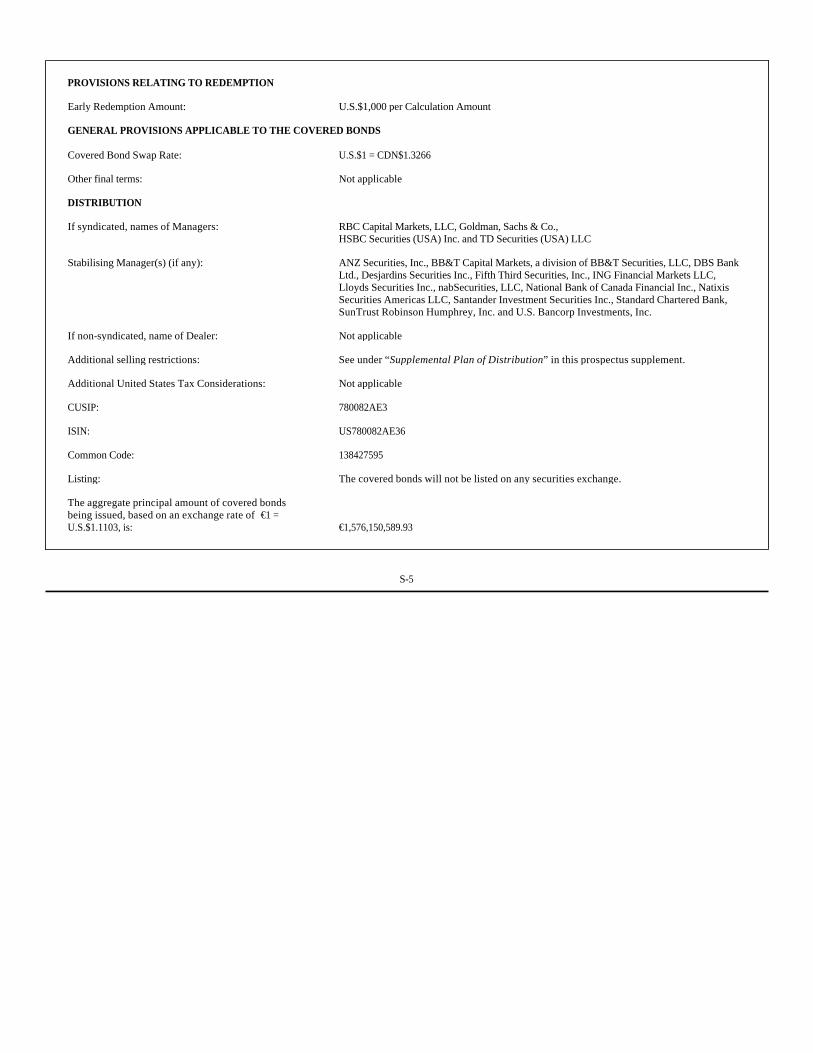
PROVISIONS RELATING TO REDEMPTION Early Redemption Amount: U.S.$1,000 per Calculation Amount
GENERAL PROVISIONS APPLICABLE TO THE COVERED BONDS Covered Bond Swap Rate: U.S.$1 = CDN$1.3266 Other final terms: Not applicable
DISTRIBUTION If syndicated, names of Managers: RBC Capital Markets, LLC, Goldman, Sachs & Co.,
HSBC Securities (USA) Inc. and TD Securities (USA) LLC Stabilising Manager(s) (if any):
ANZ Securities, Inc., BB&T Capital Markets, a division of BB&T Securities, LLC, DBS Bank Ltd., Desjardins Securities Inc., Fifth Third Securities, Inc., ING Financial Markets LLC, Lloyds Securities Inc., nabSecurities, LLC, National Bank of Canada Financial Inc., Natixis Securities Americas LLC, Santander Investment Securities Inc., Standard Chartered Bank, SunTrust Robinson Humphrey, Inc. and U.S. Bancorp Investments, Inc.
If non-syndicated, name of Dealer: Not applicable Additional selling restrictions: See under “Supplemental Plan of Distribution” in this prospectus supplement. Additional United States Tax Considerations: Not applicable CUSIP: 780082AE3 ISIN: US780082AE36 Common Code: 138427595 Listing: The covered bonds will not be listed on any securities exchange. The aggregate principal amount of covered bonds being issued, based on an exchange rate of €1 = U.S.$1.1103, is: €1,576,150,589.93
S-5

DESCRIPTION OF THE COVERED BONDS
In addition to the terms described in the “Summary” section above, the following general terms will apply to the covered bonds.
General
The covered bonds constitute deposit liabilities of the Bank for purposes of the Bank Act (Canada), however the covered bonds will not be insured under the Canada Deposit Insurance Act (Canada). The covered bonds will rank equally with other deposit liabilities of the Bank and all other unsubordinated and unsecured obligations of the Bank (except as otherwise prescribed by law).
The Bank is a registered issuer and this Programme is a registered program under Part I.1 of the National Housing Act (Canada) and the Guide published by CMHC, the administrator of the Canadian covered bond legal framework under Part I.1 of the of the National Housing Act (Canada). The covered bonds will be registered covered bonds under Part I.1 of the National Housing Act (Canada) and the Guide.
The aggregate principal amount of the covered bonds offered is U.S.$1,750,000,000. The covered bonds are issued in denominations of U.S.$1,000, and integral multiples of U.S.$1,000 in excess thereof. The covered bonds may only be transferred in amounts of U.S.$ 1,000 and increments of U.S.$1,000 thereafter.
We will pay interest on the covered bonds semi-annually on March 22 and September 22 of each year. We will make the first interest payment on the covered bonds on September 22, 2016. Guarantee
The covered bonds are unconditionally and irrevocably guaranteed as to payments by the Guarantor LP when such payments are due as described in the accompanying prospectus. The obligation of the Guarantor LP has been secured by a pledge by the Guarantor LP of the Covered Bond Portfolio in favor of the Bond Trustee pursuant to the terms of the Security Agreement. Currency
The covered bonds are denominated, and amounts due on the covered bonds will be paid, in U.S. dollars (“U.S.$”). Form of the Covered Bonds
The covered bonds will be issued only in the form of a global covered bond held by The Depository Trust Company. See “Ownership and Book-Entry Issuance” in the accompanying prospectus. No Listing
The covered bonds will not be listed on any securities exchange.
Please note that the information about the issuance, Issue Date, Issue Price, commissions and net proceeds to Royal Bank of Canada relates only to the initial issuance and sale of your covered bonds. If you have purchased your covered bonds in a market-making transaction after the initial issuance and sale, any such relevant information about the sale to you will be provided in a separate confirmation of sale. Final Maturity Date
The Final Maturity Date is March 22, 2021. The Final Maturity Date may be postponed under the Extended Due for Payment Date as further described in Condition 6 – Redemption and Purchase under “Description of the Covered Bonds – Terms and Conditions” in the accompanying prospectus.
S-6
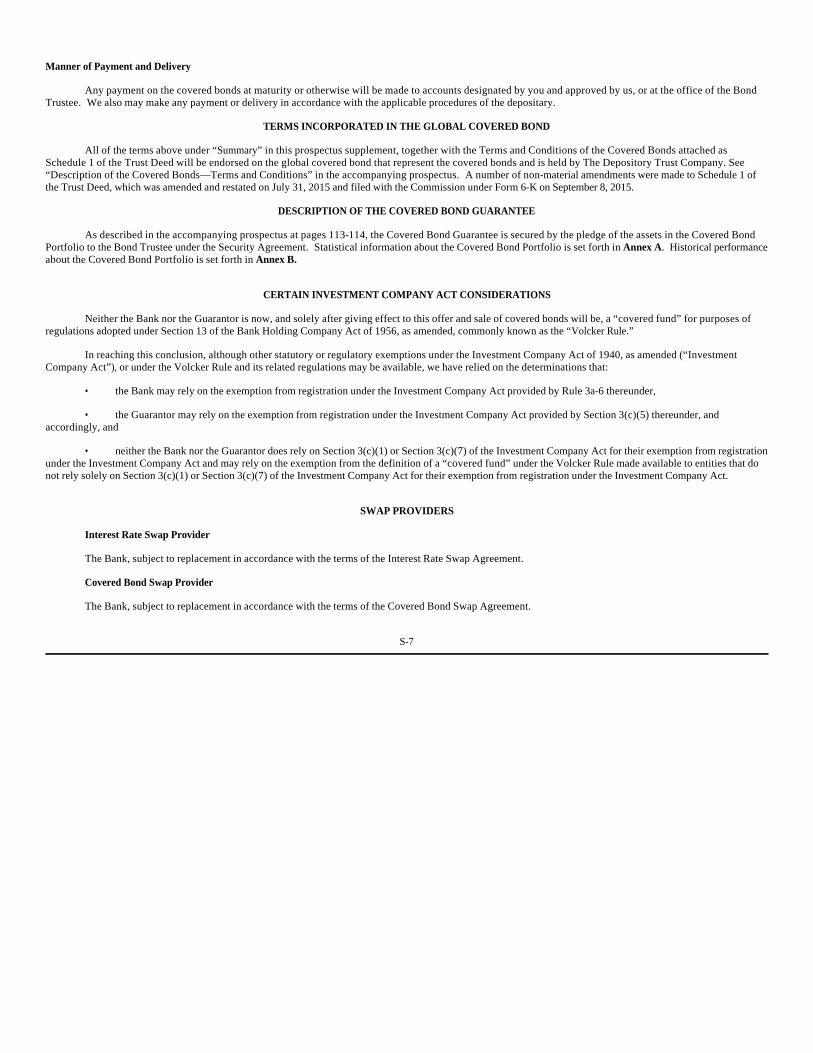
Manner of Payment and Delivery
Any payment on the covered bonds at maturity or otherwise will be made to accounts designated by you and approved by us, or at the office of the Bond Trustee. We also may make any payment or delivery in accordance with the applicable procedures of the depositary.
TERMS INCORPORATED IN THE GLOBAL COVERED BOND
All of the terms above under “Summary” in this prospectus supplement, together with the Terms and Conditions of the Covered Bonds attached as Schedule 1 of the Trust Deed will be endorsed on the global covered bond that represent the covered bonds and is held by The Depository Trust Company. See “Description of the Covered Bonds—Terms and Conditions” in the accompanying prospectus. A number of non-material amendments were made to Schedule 1 of the Trust Deed, which was amended and restated on July 31, 2015 and filed with the Commission under Form 6-K on September 8, 2015.
DESCRIPTION OF THE COVERED BOND GUARANTEE
As described in the accompanying prospectus at pages 113-114, the Covered Bond Guarantee is secured by the pledge of the assets in the Covered Bond Portfolio to the Bond Trustee under the Security Agreement. Statistical information about the Covered Bond Portfolio is set forth in Annex A. Historical performance about the Covered Bond Portfolio is set forth in Annex B.
CERTAIN INVESTMENT COMPANY ACT CONSIDERATIONS
Neither the Bank nor the Guarantor is now, and solely after giving effect to this offer and sale of covered bonds will be, a “covered fund” for purposes of regulations adopted under Section 13 of the Bank Holding Company Act of 1956, as amended, commonly known as the “Volcker Rule.”
In reaching this conclusion, although other statutory or regulatory exemptions under the Investment Company Act of 1940, as amended (“Investment Company Act”), or under the Volcker Rule and its related regulations may be available, we have relied on the determinations that:
• the Bank may rely on the exemption from registration under the Investment Company Act provided by Rule 3a-6 thereunder,
• the Guarantor may rely on the exemption from registration under the Investment Company Act provided by Section 3(c)(5) thereunder, and accordingly, and
• neither the Bank nor the Guarantor does rely on Section 3(c)(1) or Section 3(c)(7) of the Investment Company Act for their exemption from registration under the Investment Company Act and may rely on the exemption from the definition of a “covered fund” under the Volcker Rule made available to entities that do not rely solely on Section 3(c)(1) or Section 3(c)(7) of the Investment Company Act for their exemption from registration under the Investment Company Act.
SWAP PROVIDERS
Interest Rate Swap Provider
The Bank, subject to replacement in accordance with the terms of the Interest Rate Swap Agreement.
Covered Bond Swap Provider
The Bank, subject to replacement in accordance with the terms of the Covered Bond Swap Agreement.
S-7

SUPPLEMENTAL PLAN OF DISTRIBUTION
Royal Bank of Canada has agreed to sell to the Dealers and the Dealers have agreed to purchase from Royal Bank of Canada, the principal amount of the
covered bonds specified, at the price specified, on the cover page of this prospectus supplement. The Dealers intend to resell each covered bond they purchase at the price to the public set forth on the cover page of this prospectus supplement. In the future, the Dealers or one of their affiliates, may repurchase and resell the covered bonds in market-making transactions, with resales being made at prices related to prevailing market prices at the time of resale or at negotiated prices. For more information about the plan of distribution and possible market-making activities, see “Plan of Distribution” in the accompanying prospectus.
Dealers Principal Amount
The Dealers have advised the Issuer that the Dealers propose initially to offer the covered bonds to the public at the public offering price on the cover page
of this prospectus supplement, and to certain dealers at that public offering price less a commission not in excess of 0.15% of the principal amount of the covered bonds. The Dealers may allow, and those dealers may reallow to other dealers, a commission not in excess of 0.10% of the principal amount.
After the initial public offering of the covered bonds is completed, the public offering price and commissions may be changed by the Dealers.
In connection with the sale of the covered bonds, the Dealers may engage in:
• over-allotments, in which Dealers selling the covered bonds sell more covered bonds than the Issuer actually sold to the Dealers, creating a Dealer short position;
• stabilizing transactions, in which purchases and sales of the covered bonds may be made by the Dealers at prices that do not exceed a specified maximum in accordance with Rule 104 of Regulation M under the Securities Exchange Act of 1934; and
• Dealer covering transactions, in which Dealers purchase the covered bonds in the open market after the distribution has been completed in order to cover Dealer short positions.
RBC Capital Markets, LLC $391,615,000.00 Goldman, Sachs & Co. $391,545,000.00 HSBC Securities (USA) Inc. $391,545,000.00 TD Securities (USA) LLC $391,545,000.00 ANZ Securities, Inc. $13,125,000.00 BB&T Capital Markets, a division of BB&T Securities, LLC $13,125,000.00 DBS Bank Ltd. $13,125,000.00 Desjardins Securities Inc. $13,125,000.00 Fifth Third Securities Inc. $13,125,000.00 ING Financial Markets LLC $13,125,000.00 Lloyds Securities Inc. $13,125,000.00 nabSecurities, LLC $13,125,000.00 National Bank of Canada Financial Inc. $13,125,000.00 Natixis Securities Americas LLC $13,125,000.00 Santander Investment Securities Inc. $13,125,000.00 Standard Chartered Bank $13,125,000.00 SunTrust Robinson Humphrey, Inc. $13,125,000.00 U.S. Bancorp Investments, Inc. $13,125,000.00 Total U.S.$1,750,000,000.00
S-8

These stabilizing transactions and Dealer covering transactions may cause the price of the covered bonds to be higher than it would otherwise be. These
transactions, if commenced, may be discontinued at any time.
The Dealers and their affiliates are full service financial institutions engaged in various activities, which may include securities trading, commercial and investment banking, financial advisory, investment management, investment research, principal investment, hedging, financing and brokerage activities. In the ordinary course of their respective businesses, the Dealers and/or their affiliates have engaged, and may in the future engage, in commercial banking, investment banking, trust or investment management transactions with us and our affiliates for which they have received, and will in the future receive, customary compensation.
We will deliver the covered bonds against payment therefor in New York, New York on March 22, 2016, which is the sixth scheduled business day after the trade date. Under Rule 15c6-1 of the Securities Exchange Act of 1934, trades in the secondary market generally are required to settle in three business days, unless the parties to any such trade expressly agree otherwise. Accordingly, purchasers who wish to trade covered bonds on any date prior to three business days before delivery will be required, by virtue of the fact that the covered bonds will initially settle in six business days (T + 6), to specify alternative settlement arrangements to prevent a failed settlement.
None of DBS Bank Ltd., Desjardins Securities Inc. or Standard Chartered Bank will effect any offers or sales of any covered bonds in the United States unless it is through one or more U.S. registered broker-dealers as permitted by the regulations of FINRA. Selling Restrictions General
Other than in the United States, no action has been or will be taken in any country or jurisdiction by the Issuer, the Guarantor LP, the Dealers or the Bond Trustee that would permit a public offering of the covered bonds, or possession or distribution of any offering material in relation thereto, in such country or jurisdiction where action for that purpose is required and such action has not been taken. The Underwriting Agreement provides that each Dealer will (to the best of its knowledge and belief) comply with all applicable securities laws and regulations in each jurisdiction in which it purchases, offers, sells or delivers the covered bonds or has in its possession or distributes offering material, in all cases at their own expense. Public Offer Selling Restriction under the Prospectus Directive
In relation to each Member State of the European Economic Area which has implemented the Prospectus Directive (each, a “Relevant Member State”), each Dealer has represented and agreed that with effect from and including the date on which the Prospectus Directive is implemented in that Relevant Member State (the “Relevant Implementation Date”) it has not made and will not make an offer of the covered bonds to the public in that Relevant Member State except that it may, with effect from and including the Relevant Implementation Date, make an offer of the covered bonds to the public in that Relevant Member State:
provided that no such offer of the covered bonds referred to in (a) to (d) above shall require the publication by the Issuer or any Dealer(s) of a prospectus
pursuant to Article 3 of the Prospectus Directive or supplementary prospectus pursuant to Article 16 of the Prospectus Directive.
(a) at any time to any legal entity which is a qualified investor as defined in the Prospectus Directive;
(b) at any time to fewer than 150 natural or legal persons (other than qualified investors, as defined in the Prospectus Directive), subject to obtaining the prior consent of the relevant Dealer(s) nominated by the Issuer for any such offer;
(c) at any time if the denomination per covered bond being offered amounts to at least €100,000; or
(d) at any time in any other circumstances falling within Article 3(2) of the Prospectus Directive;
S-9
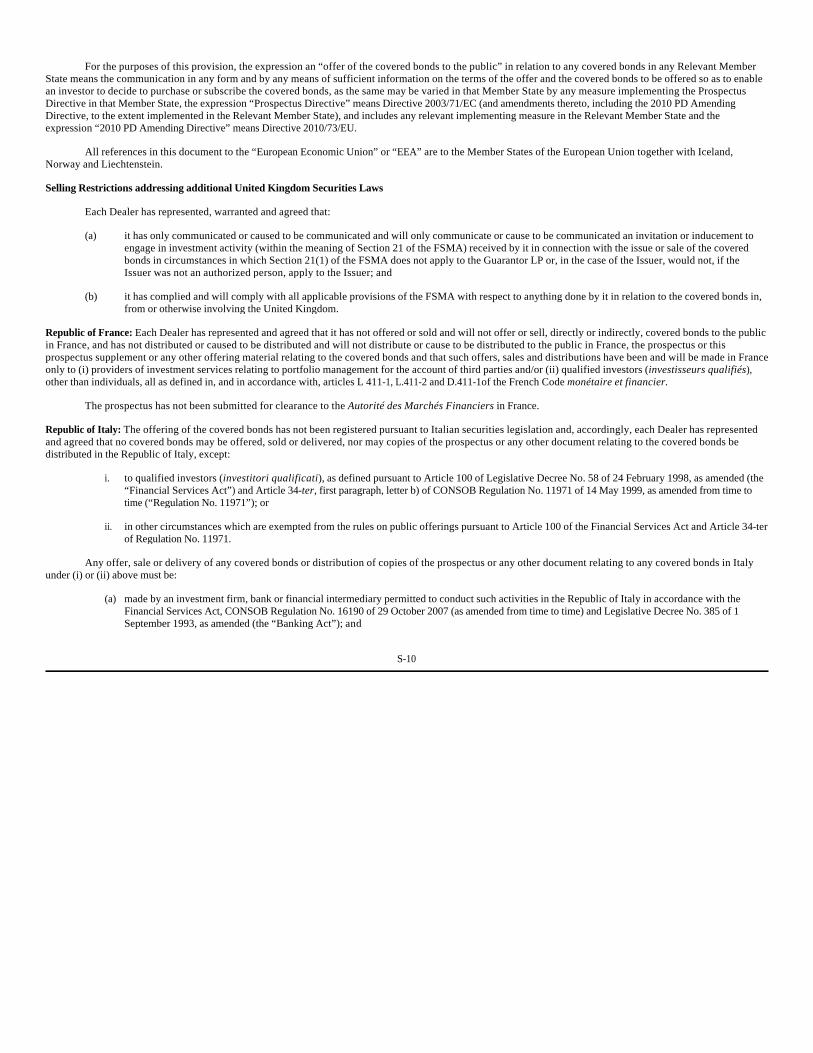
For the purposes of this provision, the expression an “offer of the covered bonds to the public” in relation to any covered bonds in any Relevant Member
State means the communication in any form and by any means of sufficient information on the terms of the offer and the covered bonds to be offered so as to enable an investor to decide to purchase or subscribe the covered bonds, as the same may be varied in that Member State by any measure implementing the Prospectus Directive in that Member State, the expression “Prospectus Directive” means Directive 2003/71/EC (and amendments thereto, including the 2010 PD Amending Directive, to the extent implemented in the Relevant Member State), and includes any relevant implementing measure in the Relevant Member State and the expression “2010 PD Amending Directive” means Directive 2010/73/EU.
All references in this document to the “European Economic Union” or “EEA” are to the Member States of the European Union together with Iceland, Norway and Liechtenstein. Selling Restrictions addressing additional United Kingdom Securities Laws
Each Dealer has represented, warranted and agreed that:
Republic of France: Each Dealer has represented and agreed that it has not offered or sold and will not offer or sell, directly or indirectly, covered bonds to the public in France, and has not distributed or caused to be distributed and will not distribute or cause to be distributed to the public in France, the prospectus or this prospectus supplement or any other offering material relating to the covered bonds and that such offers, sales and distributions have been and will be made in France only to (i) providers of investment services relating to portfolio management for the account of third parties and/or (ii) qualified investors (investisseurs qualifiés), other than individuals, all as defined in, and in accordance with, articles L 411-1, L.411-2 and D.411-1of the French Code monétaire et financier.
The prospectus has not been submitted for clearance to the Autorité des Marchés Financiers in France. Republic of Italy: The offering of the covered bonds has not been registered pursuant to Italian securities legislation and, accordingly, each Dealer has represented and agreed that no covered bonds may be offered, sold or delivered, nor may copies of the prospectus or any other document relating to the covered bonds be distributed in the Republic of Italy, except:
Any offer, sale or delivery of any covered bonds or distribution of copies of the prospectus or any other document relating to any covered bonds in Italy
under (i) or (ii) above must be:
(a) it has only communicated or caused to be communicated and will only communicate or cause to be communicated an invitation or inducement to engage in investment activity (within the meaning of Section 21 of the FSMA) received by it in connection with the issue or sale of the covered bonds in circumstances in which Section 21(1) of the FSMA does not apply to the Guarantor LP or, in the case of the Issuer, would not, if the Issuer was not an authorized person, apply to the Issuer; and
(b) it has complied and will comply with all applicable provisions of the FSMA with respect to anything done by it in relation to the covered bonds in, from or otherwise involving the United Kingdom.
i. to qualified investors (investitori qualificati), as defined pursuant to Article 100 of Legislative Decree No. 58 of 24 February 1998, as amended (the “Financial Services Act”) and Article 34-ter, first paragraph, letter b) of CONSOB Regulation No. 11971 of 14 May 1999, as amended from time to time (“Regulation No. 11971”); or
ii. in other circumstances which are exempted from the rules on public offerings pursuant to Article 100 of the Financial Services Act and Article 34-ter of Regulation No. 11971.
(a) made by an investment firm, bank or financial intermediary permitted to conduct such activities in the Republic of Italy in accordance with the Financial Services Act, CONSOB Regulation No. 16190 of 29 October 2007 (as amended from time to time) and Legislative Decree No. 385 of 1 September 1993, as amended (the “Banking Act”); and
S-10
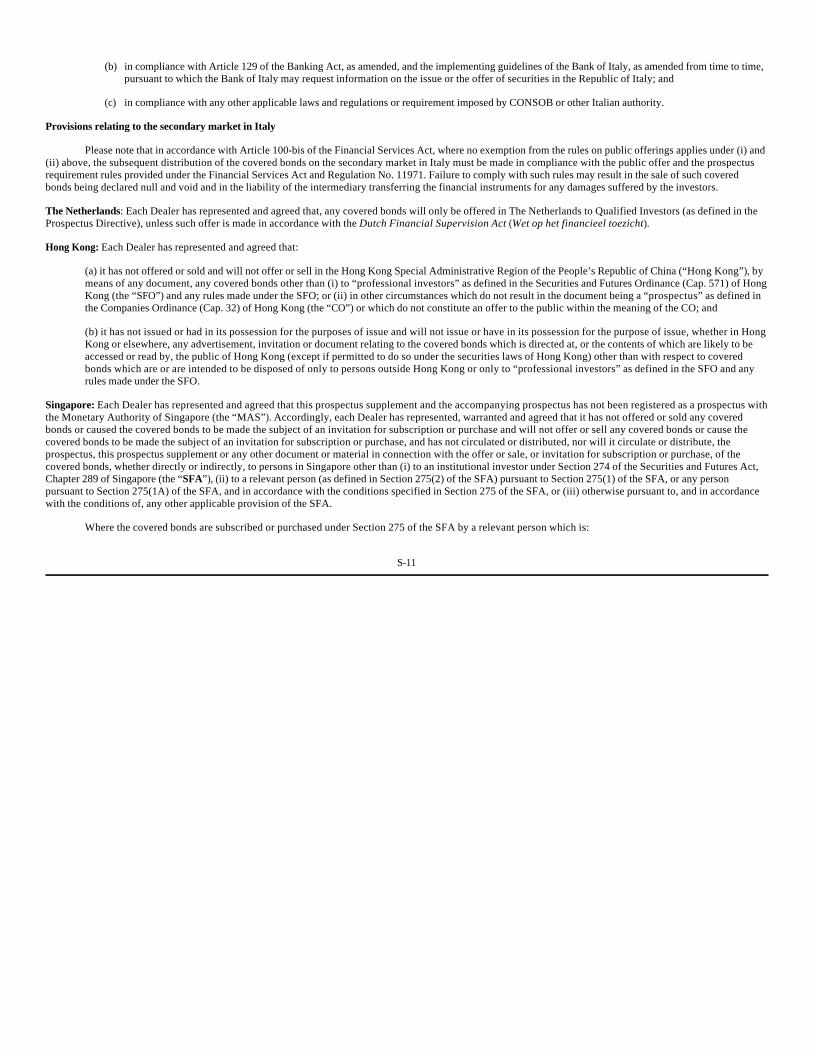
Provisions relating to the secondary market in Italy
Please note that in accordance with Article 100-bis of the Financial Services Act, where no exemption from the rules on public offerings applies under (i) and (ii) above, the subsequent distribution of the covered bonds on the secondary market in Italy must be made in compliance with the public offer and the prospectus requirement rules provided under the Financial Services Act and Regulation No. 11971. Failure to comply with such rules may result in the sale of such covered bonds being declared null and void and in the liability of the intermediary transferring the financial instruments for any damages suffered by the investors. The Netherlands: Each Dealer has represented and agreed that, any covered bonds will only be offered in The Netherlands to Qualified Investors (as defined in the Prospectus Directive), unless such offer is made in accordance with the Dutch Financial Supervision Act (Wet op het financieel toezicht). Hong Kong: Each Dealer has represented and agreed that:
(a) it has not offered or sold and will not offer or sell in the Hong Kong Special Administrative Region of the People’s Republic of China (“Hong Kong”), by means of any document, any covered bonds other than (i) to “professional investors” as defined in the Securities and Futures Ordinance (Cap. 571) of Hong Kong (the “SFO”) and any rules made under the SFO; or (ii) in other circumstances which do not result in the document being a “prospectus” as defined in the Companies Ordinance (Cap. 32) of Hong Kong (the “CO”) or which do not constitute an offer to the public within the meaning of the CO; and
(b) it has not issued or had in its possession for the purposes of issue and will not issue or have in its possession for the purpose of issue, whether in Hong Kong or elsewhere, any advertisement, invitation or document relating to the covered bonds which is directed at, or the contents of which are likely to be accessed or read by, the public of Hong Kong (except if permitted to do so under the securities laws of Hong Kong) other than with respect to covered bonds which are or are intended to be disposed of only to persons outside Hong Kong or only to “professional investors” as defined in the SFO and any rules made under the SFO.
Singapore: Each Dealer has represented and agreed that this prospectus supplement and the accompanying prospectus has not been registered as a prospectus with the Monetary Authority of Singapore (the “MAS”). Accordingly, each Dealer has represented, warranted and agreed that it has not offered or sold any covered bonds or caused the covered bonds to be made the subject of an invitation for subscription or purchase and will not offer or sell any covered bonds or cause the covered bonds to be made the subject of an invitation for subscription or purchase, and has not circulated or distributed, nor will it circulate or distribute, the prospectus, this prospectus supplement or any other document or material in connection with the offer or sale, or invitation for subscription or purchase, of the covered bonds, whether directly or indirectly, to persons in Singapore other than (i) to an institutional investor under Section 274 of the Securities and Futures Act, Chapter 289 of Singapore (the “SFA”), (ii) to a relevant person (as defined in Section 275(2) of the SFA) pursuant to Section 275(1) of the SFA, or any person pursuant to Section 275(1A) of the SFA, and in accordance with the conditions specified in Section 275 of the SFA, or (iii) otherwise pursuant to, and in accordance with the conditions of, any other applicable provision of the SFA.
Where the covered bonds are subscribed or purchased under Section 275 of the SFA by a relevant person which is:
(b) in compliance with Article 129 of the Banking Act, as amended, and the implementing guidelines of the Bank of Italy, as amended from time to time, pursuant to which the Bank of Italy may request information on the issue or the offer of securities in the Republic of Italy; and
(c) in compliance with any other applicable laws and regulations or requirement imposed by CONSOB or other Italian authority.
S-11
(a) a corporation (which is not an accredited investor (as defined in Section 4A of the SFA)) the sole business of which is to hold investments and the entire share capital of which is owned by one or more individuals, each of whom is an accredited investor; or
(b) a trust (where the trustee is not an accredited investor) whose sole purpose is to hold investments and each beneficiary of the trust is an individual who is an accredited investor,
securities (as defined in Section 239(1) of the SFA) of that corporation or the beneficiaries’ rights and interest (howsoever described) in that trust shall not be transferred within six months after that corporation or that trust has acquired the covered bonds pursuant to an offer made under Section 275 of the SFA except:
(i) to an institutional investor or to a relevant person defined in Section 275(2) of the SFA, or to any person arising from an offer referred to in Section 275(1A) or Section 276(4)(i)(B) of the SFA;
(ii) where no consideration is or will be given for the transfer;
(iii) where the transfer is by operation of law;
(iv) as specified in Section 276(7) of the SFA; or
(v) as specified in Regulation 32 of the Securities and Futures (Offer of Investments) (Shares and Debentures) Regulations 2005 of Singapore.
NOTICE REGARDING OFFERS IN THE EEA
If and to the extent that this prospectus supplement is communicated in, or the offer of the covered bonds to which it relates is made in, any EEA Member
State that has implemented the Prospectus Directive as defined below (a “Relevant Member State”), this prospectus supplement and the offer are only addressed to and directed at persons in that Relevant Member State who are qualified investors within the meaning of the Prospectus Directive (or who are other persons to whom the offer may lawfully be addressed) and must not be acted upon by other persons in that Relevant Member State.
This prospectus supplement is not a prospectus approved under the Prospectus Directive. A prospectus is not required under the Prospectus Directive as this prospectus supplement has been prepared on the basis that any offers of covered bonds in any Relevant Member State will be made pursuant to an exemption under the Prospectus Directive, as implemented in that Relevant Member State, from the requirement to publish a prospectus for offers of the covered bonds. Accordingly, any person making or intending to make any offer in that Relevant Member State of the covered bonds which are the subject of the placement referred to in this prospectus supplement must only do so in circumstances in which no obligation arises for us or the Dealers to publish a prospectus pursuant to Article 3 of the Prospectus Directive or supplement a prospectus pursuant to Article 16 of the Prospectus Directive, in each case, in relation to such offer. Neither we nor the Dealers have authorized, nor do we or they authorize, the making of any offer of the covered bonds in circumstances in which an obligation arises for us or the Dealers to publish a prospectus supplement or prospectus for such offer.
In this prospectus supplement, the expression “Prospectus Directive” means Directive 2003/71/EC (and amendments thereto, including the 2010 PD Amending Directive to the extent implemented in the Relevant Member State) and includes any relevant implementing measures in the Relevant Member State and the expression “2010 PD Amending Directive” means Directive 2010/73/EU.
This prospectus supplement is only being distributed to and is only directed at (i) persons who are outside the United Kingdom or (ii) to investment professionals falling within Article 19(5) of the Financial Services and Markets Act 2000 (Financial Promotion) Order 2005, as amended (the “Order”) or (iii) high net worth entities, and other persons to whom it may lawfully be communicated, falling within Article 49(2)(a) to (d) of the Order (all such persons together being referred to as “relevant persons”). The covered bonds are only available to, and any invitation, offer or agreement to subscribe, purchase or otherwise acquire such covered bonds will be engaged in only with, relevant persons. Any person who is not a relevant person should not act or rely on this document or any of its contents.
S-12

Annex A
COVERED BOND PORTFOLIO
The statistical and other information contained herein under the heading “Overall Pool Statistics” has been compiled by reference to the Loans in the Covered Bond Portfolio securing the covered bonds as of January 31, 2016 (the “cut-off date”). The exchange rate of Canadian dollars into U.S. dollars on the cut-off date used in this prospectus supplement was CDN$1 = U.S.$0. 73904. Columns stating percentage amounts may not add to 100% due to rounding. The Loans in the Covered Bond Portfolio are selected on the basis of the seller's Eligibility Criteria set forth in the Mortgage Sale Agreement. The material aspects of such Eligibility Criteria are described under “Summary of Principal Documents – Mortgage Sale Agreement – Eligibility Criteria” in the accompanying prospectus. One significant indicator of Borrower credit quality is arrears and losses. The information presented below under “Loss Information” reflects the arrears and losses experience of the Covered Bond Portfolio as at the dates indicated. Any material change to the Eligibility Criteria, which could lead to arrears and losses deviating from the historical experience presented in the table under “Loss Information,” will be reported by the Guarantor LP on periodic reports filed with the SEC on Form 10-D. It is not expected that the characteristics of the Covered Bond Portfolio as of the closing date will differ materially from the characteristics of the Covered Bond Portfolio as of the cut-off date.
The Covered Bond Portfolio as at the cut-off date comprised 330,033 Loans having an aggregate current balance of $51,352,589,575. The Bank originated or renewed the Loans in the Covered Bond Portfolio between March 1, 1991 and January 31, 2016.
229,796 Loans in the cut-off date Covered Bond Portfolio (or 67.04% of the aggregate current balance of the Loans as of the cut-off date) were fixed rate Loans. The remaining 100,237 Loans in the cut-off date Covered Bond Portfolio (or 32.96% of the aggregate current balance of the Loans as of the cut-off date) were standard variable rate Loans and discounted variable rate Loans, as described below.
In the prior three years, there have been no repurchases or replacements of Loans in the Covered Bond Portfolio as a result of breaches of representations or warranties and no demands for repurchase or replacement of any Loan.
No Loan in the Covered Bond Portfolio failed to meet the Bank’s Lending Criteria.
The Bank most recently filed a Form ABS-15G on March 11, 2016.
As of the cut-off date, the Bank's posted rate for a five year variable rate for existing and new borrowers was 4.00% (rate for “open,” or prepayable loans) or 2.60% (rate for “closed,” or non-prepayable loans) per annum.
After issuance of the covered bonds, the Asset Coverage Test will continue to be satisfied. Review of Covered Bond Portfolio
The Bank has performed a review of the Loans in the Covered Bond Portfolio and a review of the disclosure regarding the Loans in this prospectus supplement and the accompanying prospectus as required by Item 1111 of Regulation AB (such disclosure, the “Rule 193 Information”). This review was designed and effected to provide the Bank with reasonable assurance that the Rule 193 Information is accurate in all material respects.
One aspect of the review consisted of a comparison of the statistical information contained in Annex A and Annex B hereto to statistical information relating to the Loans contained in the Bank’s data files. The data files are electronic records maintained by the Bank. For this comparison, the data files from the Bank’s loan servicing system, including relevant data elements, were extracted from the Bank’s information repository system. No material exceptions were found between the statistical information contained in Annex A and Annex B and the data files extracted from the Bank’s system.
A second aspect of the review consisted of a sampling of physical loan files. In accordance with CMHC requirements, in July 2015 a third party at the request of the Bank completed a comparison of certain Loan characteristics as required by the CMHC Guide, such as amount financed, current balance, location of the property and property valuation, in a sampling of 60 randomly selected Loan files, to the applicable information in the data files. No material exceptions were found between the Loan files and the data extracted from the Bank’s system. Subsequently, approximately $25.89 billion of additional Eligible Loans were added to the Covered Bond Portfolio on July 24, 2015. The addition of new Loans is reflected in the Monthly Investor Reports beginning with the period ended July 31, 2015. The next pool audit required by the CMHC Guide is scheduled to be performed prior to July 23, 2016. No separate sample of Loan files for the additional Loans added to the Covered Bond Portfolio in July 2015 has been conducted to date.
S-13

A third aspect of the review of the Rule 193 Information related to descriptions of the transaction documents in this prospectus supplement and the
accompanying prospectus. For this part of the review, the Bank and its legal counsel reviewed the Rule 193 Information consisting of descriptions of portions of the transaction documents and compared that Rule 193 Information to the related transaction documents. The Bank and its legal counsel also reviewed the Rule 193 Information consisting of descriptions of legal and regulatory provisions that may materially affect the performance of the Loans or payments on the covered bonds.
In addition to the elements of the review of the Rule 193 Information that were specifically conducted for purposes of this transaction as described above, with respect to Rule 193 Information relating to credit approvals and exceptions to credit policies, the Bank has observed the regular, ongoing application of its internal control procedures. These include quality assurance audits and portfolio level analyses on origination to ensure that Loans comply with the Bank’s underwriting policies. These audits and portfolio level analyses are reviewed by the Policy Review Committee as well as Group Risk Management and other partners on a quarterly basis.
All Rule 193 Information consisting of textual disclosures of factual information and not otherwise described above was reviewed and approved by the Bank.
After undertaking the elements of the review described above, the Bank has found and concluded that it has reasonable assurance that the Rule 193 Information in this prospectus supplement and the accompanying prospectus is accurate in all material respects.
The review of disclosure relating to the description of the transaction documents and legal and regulatory matters and the reviews of statistical information and certain Loans characteristics were performed with the assistance of third parties engaged by the Bank. The Bank determined the nature, extent and timing of the review and the level of assistance provided by the third parties and by the Bank. The Bank has ultimate authority and control over, and assumes all responsibility for, the review and the findings and conclusions of the review. The Bank attributes all findings and conclusions of the review to itself.
Overall Pool Statistics (Data as at January 31, 2016)
Cover Pool Delinquency Distribution Aging Summary Number of Loans Percentage Principal Balance Percentage Current and less than 30 days past due 329,415 99.81 $51,249,226,242 99.80 30 to 59 days past due 264 0.08 $47,012,012 0.09 60 to 89 days past due 100 0.03 $17,883,304 0.03 90 or more days past due 254 0.08 $38,468,017 0.07
Total 330,033 100.00 $51,352,589,575 100.00
S-14
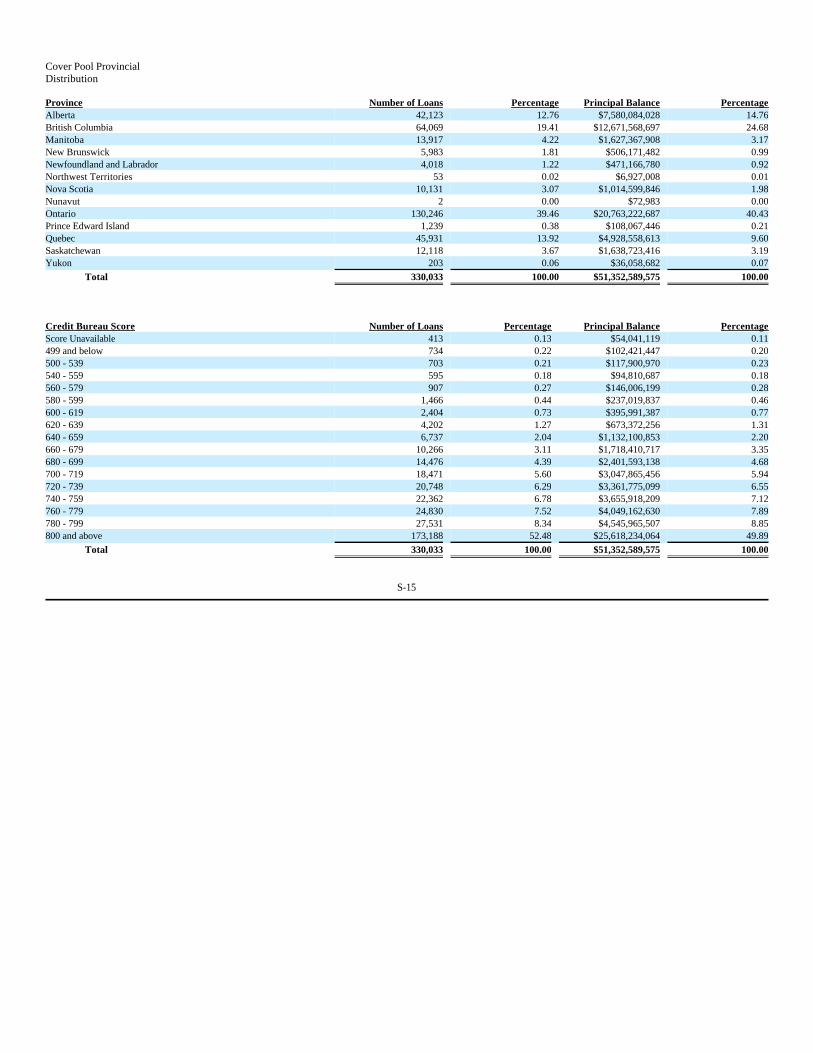
Cover Pool Provincial Distribution
Province Number of Loans Percentage Principal Balance Percentage Alberta 42,123 12.76 $7,580,084,028 14.76 British Columbia 64,069 19.41 $12,671,568,697 24.68 Manitoba 13,917 4.22 $1,627,367,908 3.17 New Brunswick 5,983 1.81 $506,171,482 0.99 Newfoundland and Labrador 4,018 1.22 $471,166,780 0.92 Northwest Territories 53 0.02 $6,927,008 0.01 Nova Scotia 10,131 3.07 $1,014,599,846 1.98 Nunavut 2 0.00 $72,983 0.00 Ontario 130,246 39.46 $20,763,222,687 40.43 Prince Edward Island 1,239 0.38 $108,067,446 0.21 Quebec 45,931 13.92 $4,928,558,613 9.60 Saskatchewan 12,118 3.67 $1,638,723,416 3.19 Yukon 203 0.06 $36,058,682 0.07
Total 330,033 100.00 $51,352,589,575 100.00
Credit Bureau Score Number of Loans Percentage Principal Balance Percentage Score Unavailable 413 0.13 $54,041,119 0.11 499 and below 734 0.22 $102,421,447 0.20 500 - 539 703 0.21 $117,900,970 0.23 540 - 559 595 0.18 $94,810,687 0.18 560 - 579 907 0.27 $146,006,199 0.28 580 - 599 1,466 0.44 $237,019,837 0.46 600 - 619 2,404 0.73 $395,991,387 0.77 620 - 639 4,202 1.27 $673,372,256 1.31 640 - 659 6,737 2.04 $1,132,100,853 2.20 660 - 679 10,266 3.11 $1,718,410,717 3.35 680 - 699 14,476 4.39 $2,401,593,138 4.68 700 - 719 18,471 5.60 $3,047,865,456 5.94 720 - 739 20,748 6.29 $3,361,775,099 6.55 740 - 759 22,362 6.78 $3,655,918,209 7.12 760 - 779 24,830 7.52 $4,049,162,630 7.89 780 - 799 27,531 8.34 $4,545,965,507 8.85 800 and above 173,188 52.48 $25,618,234,064 49.89
Total 330,033 100.00 $51,352,589,575 100.00
S-15

Cover Pool Rate Type Distribution Rate Type Number of Loans Percentage Principal Balance Percentage Fixed 229,796 69.63 $34,424,449,347 67.04 Variable 100,237 30.37 $16,928,140,228 32.96
Total 330,033 100.00 $51,352,589,575 100.00
Mortgage Asset Type Distribution Number of Loans Percentage Principal Balance Percentage Conventional Mortgage 62,485 18.93 $11,683,576,066 22.75 Homeline Mortgage Segment 267,548 81.07 $39,669,013,510 77.25
Total 330,033 100.00 $51,352,589,575 100.00
Cover Pool Occupancy Type Distribution Occupancy Type Number of Loans Percentage Principal Balance Percentage Not Owner Occupied 29,150 8.83 $4,689,931,554 9.13 Owner Occupied 300,883 91.17 $46,662,658,021 90.87
Total 330,033 100.00 $51,352,589,575 100.00
S-16

Cover Pool Mortgage Rate Distribution Mortgage Rate (%) Number of Loans Percentage Principal Balance Percentage 1.9999% and below 13,800 4.18 $2,748,171,632 5.35 2.0000% - 2.4999% 86,829 26.31 $14,681,135,278 28.59 2.5000% - 2.9999% 135,304 41.00 $21,961,576,402 42.77 3.0000% - 3.4999% 59,241 17.95 $7,949,597,385 15.48 3.5000% - 3.9999% 29,978 9.08 $3,515,926,379 6.85 4.0000% - 4.4999% 2,715 0.82 $284,136,024 0.55 4.5000% - 4.9999% 302 0.09 $31,705,310 0.06 5.0000% - 5.4999% 472 0.14 $44,113,467 0.09 5.5000% - 5.9999% 325 0.10 $26,763,093 0.05 6.0000% - 6.4999% 674 0.20 $65,269,655 0.13 6.5000% - 6.9999% 393 0.12 $44,194,949 0.09
Total 330,033 100.00 $51,352,589,575 100.00
Cover Pool Remaining Term Distribution Remaining Term (Months) Number of Loans Percentage Principal Balance Percentage Less than 12.00 69,159 20.96 $9,967,555,037 19.41 12.00 - 23.99 72,661 22.02 $10,359,701,743 20.17 24.00 - 35.99 72,630 22.01 $11,814,676,283 23.01 36.00 - 47.99 67,379 20.42 $11,322,924,499 22.05 48.00 - 59.99 44,647 13.53 $7,334,646,589 14.28 60.00 - 71.99 2,224 0.67 $339,272,273 0.66 72.00 - 83.99 386 0.12 $59,901,610 0.12 84.00 and above 947 0.29 $153,911,540 0.30
Total 330,033 100.00 $51,352,589,575 100.00
S-17
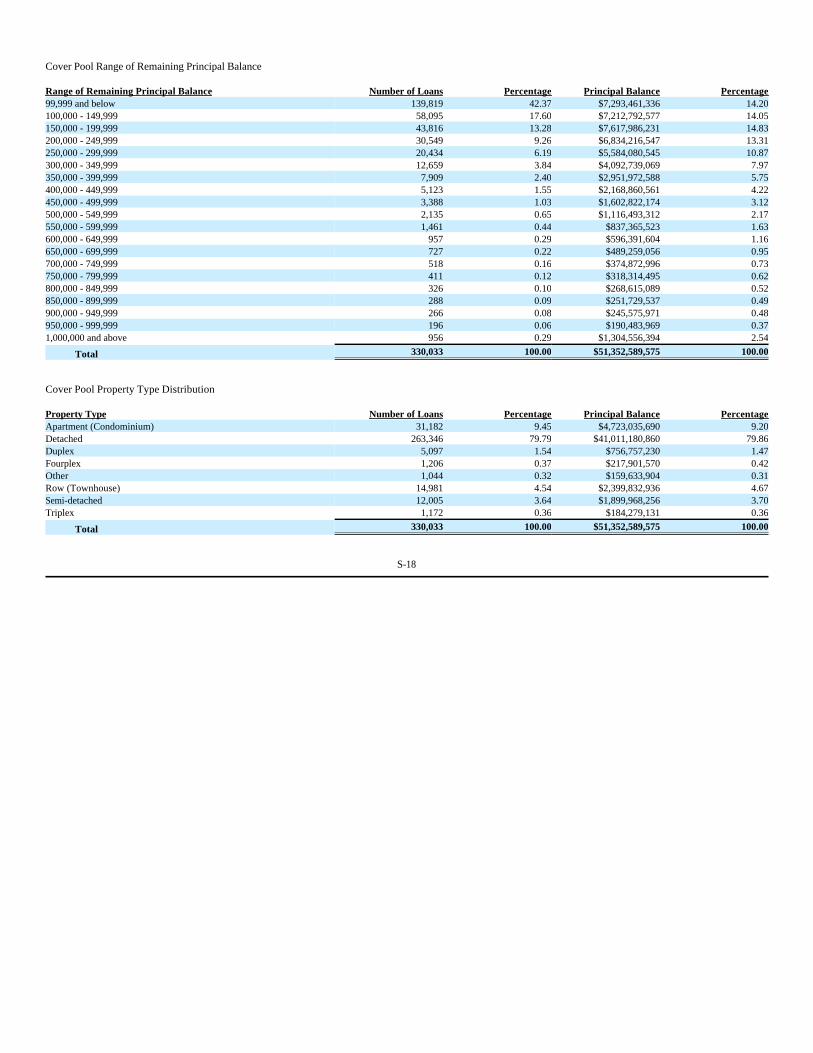
Cover Pool Range of Remaining Principal Balance Range of Remaining Principal Balance Number of Loans Percentage Principal Balance Percentage 99,999 and below 139,819 42.37 $7,293,461,336 14.20 100,000 - 149,999 58,095 17.60 $7,212,792,577 14.05 150,000 - 199,999 43,816 13.28 $7,617,986,231 14.83 200,000 - 249,999 30,549 9.26 $6,834,216,547 13.31 250,000 - 299,999 20,434 6.19 $5,584,080,545 10.87 300,000 - 349,999 12,659 3.84 $4,092,739,069 7.97 350,000 - 399,999 7,909 2.40 $2,951,972,588 5.75 400,000 - 449,999 5,123 1.55 $2,168,860,561 4.22 450,000 - 499,999 3,388 1.03 $1,602,822,174 3.12 500,000 - 549,999 2,135 0.65 $1,116,493,312 2.17 550,000 - 599,999 1,461 0.44 $837,365,523 1.63 600,000 - 649,999 957 0.29 $596,391,604 1.16 650,000 - 699,999 727 0.22 $489,259,056 0.95 700,000 - 749,999 518 0.16 $374,872,996 0.73 750,000 - 799,999 411 0.12 $318,314,495 0.62 800,000 - 849,999 326 0.10 $268,615,089 0.52 850,000 - 899,999 288 0.09 $251,729,537 0.49 900,000 - 949,999 266 0.08 $245,575,971 0.48 950,000 - 999,999 196 0.06 $190,483,969 0.37 1,000,000 and above 956 0.29 $1,304,556,394 2.54
Total 330,033 100.00 $51,352,589,575 100.00
Cover Pool Property Type Distribution Property Type Number of Loans Percentage Principal Balance Percentage Apartment (Condominium) 31,182 9.45 $4,723,035,690 9.20 Detached 263,346 79.79 $41,011,180,860 79.86 Duplex 5,097 1.54 $756,757,230 1.47 Fourplex 1,206 0.37 $217,901,570 0.42 Other 1,044 0.32 $159,633,904 0.31 Row (Townhouse) 14,981 4.54 $2,399,832,936 4.67 Semi-detached 12,005 3.64 $1,899,968,256 3.70 Triplex 1,172 0.36 $184,279,131 0.36
Total 330,033 100.00 $51,352,589,575 100.00
S-18
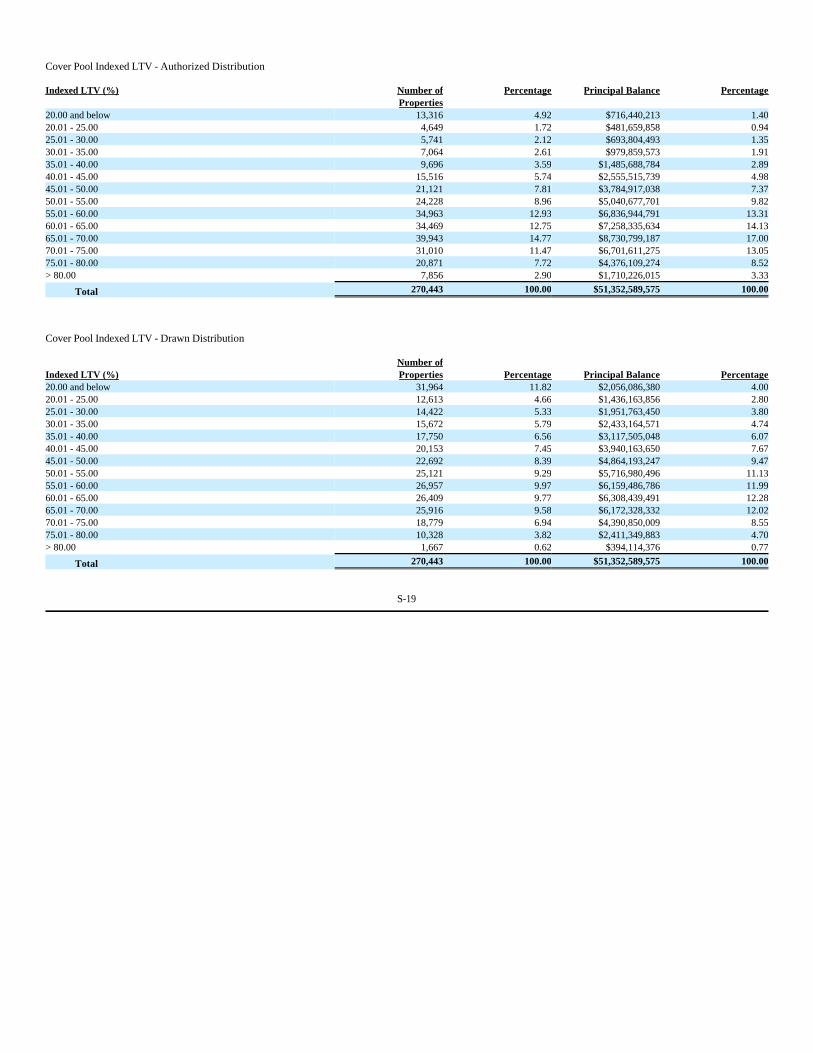
Cover Pool Indexed LTV - Authorized Distribution
Cover Pool Indexed LTV - Drawn Distribution
Indexed LTV (%) Number of Properties
Percentage Principal Balance Percentage
20.00 and below 13,316 4.92 $716,440,213 1.40 20.01 - 25.00 4,649 1.72 $481,659,858 0.94 25.01 - 30.00 5,741 2.12 $693,804,493 1.35 30.01 - 35.00 7,064 2.61 $979,859,573 1.91 35.01 - 40.00 9,696 3.59 $1,485,688,784 2.89 40.01 - 45.00 15,516 5.74 $2,555,515,739 4.98 45.01 - 50.00 21,121 7.81 $3,784,917,038 7.37 50.01 - 55.00 24,228 8.96 $5,040,677,701 9.82 55.01 - 60.00 34,963 12.93 $6,836,944,791 13.31 60.01 - 65.00 34,469 12.75 $7,258,335,634 14.13 65.01 - 70.00 39,943 14.77 $8,730,799,187 17.00 70.01 - 75.00 31,010 11.47 $6,701,611,275 13.05 75.01 - 80.00 20,871 7.72 $4,376,109,274 8.52 > 80.00 7,856 2.90 $1,710,226,015 3.33
Total 270,443 100.00 $51,352,589,575 100.00
Indexed LTV (%) Number of Properties Percentage Principal Balance Percentage
20.00 and below 31,964 11.82 $2,056,086,380 4.00 20.01 - 25.00 12,613 4.66 $1,436,163,856 2.80 25.01 - 30.00 14,422 5.33 $1,951,763,450 3.80 30.01 - 35.00 15,672 5.79 $2,433,164,571 4.74 35.01 - 40.00 17,750 6.56 $3,117,505,048 6.07 40.01 - 45.00 20,153 7.45 $3,940,163,650 7.67 45.01 - 50.00 22,692 8.39 $4,864,193,247 9.47 50.01 - 55.00 25,121 9.29 $5,716,980,496 11.13 55.01 - 60.00 26,957 9.97 $6,159,486,786 11.99 60.01 - 65.00 26,409 9.77 $6,308,439,491 12.28 65.01 - 70.00 25,916 9.58 $6,172,328,332 12.02 70.01 - 75.00 18,779 6.94 $4,390,850,009 8.55 75.01 - 80.00 10,328 3.82 $2,411,349,883 4.70 > 80.00 1,667 0.62 $394,114,376 0.77
Total 270,443 100.00 $51,352,589,575 100.00
S-19

Overall Pool Performance
For collection purposes, a Loan is considered delinquent when a scheduled payment is 30 days or more past due. In the tables below, a Loan for which a scheduled payment is less than 30 days past due is categorized as “Current.”
Pool Performance – Overall Delinquency Status – Current Balance of Loans in Arrears ($)
As at Date 31-Jan-11 31-Jan-12 31-Jan-13 31-Jan-14 31-Jan-15 31-Jan-16 Current Balance of Loans Outstanding
No. Days Past Due $ % $ % $ % $ % $ % $ % Current <30 Days 14,703,953,023 99.29% 18,327,461,406 99.51% 21,563,346,396 99.63% 35,544,152,723 99.85% 36,412,249,663 99.79% 51,249,226,242 99.80% 1-2 Months ≥30 and <60 Days 32,080,486 0.22% 27,963,061 0.15% 29,968,622 0.14% 29,388,809 0.09% 32,608,872 0.09% 47,012,012 0.09% 2-3 Months ≥60 and <90 Days 19,738,200 0.13% 18,338,508 0.10% 14,109,927 0.07% 11,916,916 0.04% 15,068,151 0.04% 17,883,304 0.03% 3-4 Months ≥90 and <120 Days 10,874,053 0.07% 7,132,480 0.04% 7,073,989 0.03% 6,154,804 0.02% 5,647,534 0.02% 6,869,448 0.02% 4-5 Months ≥120 and <150 Days 5,332,319 0.04% 5,217,854 0.03% 3,934,310 0.02% 1,599,156 0.00% 2,840,406 0.01% 3,252,257 0.01% 5-6 Months ≥150 and <180 Days 3,911,238 0.03% 5,097,330 0.03% 2,266,124 0.01% 1,193,809 0.00% 2,774,143 0.01% 4,869,012 0.01% 6-7 Months ≥180 and <210 Days 5,111,156 0.03% 2,135,950 0.01% 1,354,471 0.01% 806,088 0.00% 1,298,882 0.00% 3,192,291 0.01% 7-8 Months ≥210 and <240 Days 5,341,169 0.04% 2,642,789 0.01% 436,519 0.00% 263,331 0.00% 2,553,199 0.01% 1,874,581 0.00% 8-9 Months ≥240 and <270 Days 4,440,469 0.03% 1,128,868 0.01% 253,018 0.00% 710,635 0.00% 1,096,138 0.00% 2,356,011 0.01% 9-10 Months ≥270 and <300 Days 2,672,376 0.02% 1,188,446 0.01% 2,003,198 0.01% 883,314 0.00% 1,870,817 0.01% 338,902 0.00% 10-11 Months ≥300 and <330 Days 1,446,544 0.01% 1,123,269 0.01% 1,857,377 0.01% 167,157 0.00% 2,758,714 0.01% 1,672,766 0.00% 11-12 Months ≥330 and <360 Days 792,469 0.01% 885,232 0.00% 1,977,107 0.01% 0 0.00% 2,003,580 0.01% 1,096,303 0.00% 12-13 Months ≥360 and <390 Days 1,906,733 0.01% 680,666 0.00% 456,805 0.00% 16,609 0.00% 1,077,428 0.00% 1,805,811 0.00% 13-14 Months ≥390 and <420 Days 554,549 0.00% 1,265,467 0.01% 2,439,039 0.01% 73,036 0.00% 921,542 0.00% 521,245 0.00% 14-15 Months ≥420 and <450 Days 1,410,980 0.01% 2,135,341 0.01% 2,585,069 0.01% 0 0.00% 539,439 0.00% 2,045,657 0.01% 15-16 Months ≥450 and <480 Days 178,225 0.00% 1,202,497 0.01% 475,882 0.00% 206,028 0.00% 1,665,596 0.00% 1,182,426 0.00% 16-17 Months ≥480 and <510 Days 442,625 0.00% 1,525,974 0.01% 1,205,833 0.01% 0 0.00% 262,902 0.00% 622,172 0.00% 17-18 Months ≥510 and <540 Days 2,247,581 0.02% 890,369 0.00% 894,067 0.00% 0 0.00% 382,908 0.00% 1,775,410 0.00% 18 Months and more ≥540 Days 6,666,540 0.04% 9,824,457 0.05% 6,815,411 0.03% 1,542,933 0.00% 1,435,452 0.00% 4,993,725 0.01%
Total 14,809,100,735 100.00% 18,417,839,964 100.00% 21,643,453,164 100.00% 35,599,075,348 100.00% 36,489,055,366 100.00% 51,352,589,575 100.00%
Delinquency Status - Number of Loans in Arrears As at Date 31-Jan-11 31-Jan-12 31-Jan-13 31-Jan-14 31-Jan-15 31-Jan-16 Total Number of Loans Outstanding No. Days Past Due # % # % # % # % # % # % Current <30 Days 123,524 99.49% 139,428 99.61% 145,622 99.69% 235,454 99.87% 239,606 99.82% 329,415 99.81% 1-2 Months ≥30 and <60 Days 207 0.17% 168 0.12% 168 0.12% 159 0.07% 190 0.09% 264 0.08% 2-3 Months ≥60 and <90 Days 112 0.09% 113 0.08% 82 0.06% 68 0.03% 93 0.04% 100 0.03% 3-4 Months ≥90 and <120 Days 65 0.05% 45 0.03% 41 0.03% 40 0.02% 31 0.01% 52 0.02% 4-5 Months ≥120 and <150 Days 42 0.03% 35 0.03% 20 0.01% 14 0.01% 15 0.01% 28 0.02% 5-6 Months ≥150 and <180 Days 21 0.02% 33 0.02% 16 0.01% 11 0.00% 16 0.01% 32 0.02% 6-7 Months ≥180 and <210 Days 22 0.02% 14 0.01% 13 0.01% 5 0.00% 11 0.00% 22 0.01% 7-8 Months ≥210 and <240 Days 29 0.02% 16 0.01% 6 0.00% 2 0.00% 13 0.01% 12 0.00% 8-9 Months ≥240 and <270 Days 21 0.02% 7 0.00% 5 0.00% 7 0.00% 7 0.00% 8 0.00% 9-10 Months ≥270 and <300 Days 19 0.01% 10 0.01% 8 0.01% 2 0.00% 9 0.00% 5 0.00% 10-11 Months ≥300 and <330 Days 9 0.01% 10 0.01% 11 0.01% 2 0.00% 12 0.00% 9 0.00% 11-12 Months ≥330 and <360 Days 8 0.01% 9 0.01% 9 0.01% 0 0.00% 17 0.01% 11 0.00% 12-13 Months ≥360 and <390 Days 14 0.01% 5 0.00% 3 0.00% 2 0.00% 10 0.00% 11 0.00% 13-14 Months ≥390 and <420 Days 6 0.00% 5 0.00% 9 0.01% 1 0.00% 3 0.00% 6 0.00% 14-15 Months ≥420 and <450 Days 8 0.01% 14 0.01% 11 0.01% 0 0.00% 5 0.00% 7 0.00% 15-16 Months ≥450 and <480 Days 3 0.00% 10 0.01% 5 0.00% 1 0.00% 9 0.00% 10 0.00% 16-17 Months ≥480 and <510 Days 3 0.00% 9 0.01% 6 0.00% 0 0.00% 1 0.00% 4 0.00% 17-18 Months ≥510 and <540 Days 11 0.01% 4 0.00% 7 0.00% 0 0.00% 4 0.00% 7 0.00% 18 Months and more ≥540 Days 36 0.03% 41 0.03% 35 0.02% 10 0.00% 9 0.00% 30 0.01% Total 124,160 100.00% 139,976 100.00% 146,077 100.00% 235,778 100.00% 240,061 100.00% 330,033 100.00%
S-20

Loss Information As at Date 31-Jan-11 31-Jan-12 31-Jan-13 31-Jan-14 31-Jan-15 31-Jan-16 # % # % # % # % # % # % Number of loans that have experienced a loss for the period / year ended 18 0.01% 87 0.06% 73 0.05% 20 0.01% 22 0.01% 49 0.01% Net loss amount for the period / year ended ($) 559,031 0.00% 3,335,919 0.02% 3,815,933 0.02% 1,358,128 0.00% 1,177,693 0.00% 2,488,515 0.00% Cumulative number of loans that have experienced a loss 18 0.01% 105 0.08% 178 0.12% 198 0.08% 220 0.09% 269 0.08% Cumulative net loss amount ($) 559,031 0.00% 3,894,950 0.02% 7,710,883 0.04% 9,069,012 0.03% 10,246,705 0.03% 12,735,220 0.02%
S-21

Annex B
HISTORICAL POOL DATA
Historical pool information regarding the performance of the Loans in the Covered Bond Portfolio is contained in this Annex. Historical pool information contained in this Annex that relates to the performance of the Loans for periods commencing prior to January 2008 does not form a part of this prospectus supplement, the accompanying prospectus or the registration statement relating to the covered bonds. Historical pool information about the Loans in the Covered Bond Portfolio for periods prior to January 2008 is not provided as such information is not available for such years and cannot be obtained without unreasonable effort and expense.
The following vintage tables present historical pool information about the Loans in the Covered Bond Portfolio in respect of arrears and cumulative losses
as at the dates specified in respect of Loans originated in specific years. “Vintage 2004,” for example, indicates all Loans in the Covered Bond Portfolio originated in the calendar year 2004. All of the Loans originated by the Bank are secured by a mortgage with first ranking priority on residential property in Canada. All such Loans are originated in accordance with the Bank's lending criteria at the time of offer of the Loan. Notwithstanding any change to the lending criteria or other terms applicable to new Loans, new Loans and their related security may only be assigned to the Covered Bond Portfolio if those new Loans comply with the Seller's representations and warranties set out in the Mortgage Sale Agreement, including a representation that those new Loans were originated in accordance with the Seller's lending criteria applicable at the time of their origination. The Seller is obliged to repurchase Loans that are in breach of these representations and warranties. See “Summary of Principal Documents – Mortgage Sale Agreement — Repurchase of Loans” in the accompanying prospectus.
Historical pool information on prepayments on the Loans is not being provided because prepayment and repayment rates should not affect the maturities of the covered bonds. The single pool of Loans held by the Guarantor LP supports an ongoing issuance of covered bonds by the Bank. As Loans repay or prepay, reducing the size of the cover pool, the Seller is required to add Loans to the cover pool in order to maintain compliance with the Asset Coverage Test. See “Summary of Principal Documents – Guarantor LP Agreement — Asset Coverage Test” in the accompanying prospectus. Any new Loans may only be assigned to the Covered Bond Portfolio if those new Loans comply with the Seller's lending criteria, the material aspects of which are described under “Loan Origination and Lending Criteria” in the accompanying prospectus.
For collection purposes, a Loan is considered delinquent when a scheduled payment is 30 days or more past due. In the tables below, a Loan for which a scheduled payment is less than 30 days past due is categorized as “Current.”
Historically, the Bank has applied the same underwriting standards to its uninsured and insured loans. Some of these underwriting standards (such as maximum amortization period) are established by the Canadian federal government for all mortgage insurers (both private mortgage insurers and CMHC) and have varied from time to time. These underwriting standards include Guideline B-20 issued by OSFI, which became effective November 1, 2012. See “Risk Factors – Canadian Regulatory Guidelines on Residential Mortgage Underwriting Practices and Procedures could adversely affect the value of the Covered Bond Portfolio” in the accompanying prospectus.
The following tables set forth the delinquency and loss experience of Loans in the cover pool by year of origination as at January 31 of the year indicated. Although underwriting standards have changed from time-to-time, annual losses for any year of origination are consistently in the low single basis point range. Loans originated in 2005, 2006 and 2007 show elevated annual losses for the twelve-month periods ending January 31, 2012 and 2013. During these origination years, the Bank extended its maximum amortization period for its newly originated mortgage loans to 40 years from 25 years consistent with underwriting standards imposed by the Canadian federal government on insured loans. In 2008, the Bank reduced the maximum amortization period to 35 years, in 2011 to 30 years, and in 2012 to 25 years, in each case consistent with the underwriting standards imposed by the Canadian federal government on insured loans.
Pre-2004 Vintage
Pool Performance – Pre-2004 Vintage Delinquency Status – Current Balance of Loans in Arrears ($) As at Date 31-Jan-11 31-Jan-12 31-Jan-13 31-Jan-14 31-Jan-15 31-Jan-16 Current Balance of Loans Outstanding No. Days Past Due $ % $ % $ % $ % $ % $ % Current <30 Days 1,656,488,842 99.61% 1,386,563,704 99.60% 1,129,487,897 99.77% 1,258,081,915 99.84% 961,370,797 99.56% 823,256,182 99.73% 1-2 Months ≥30 and <60 Days 2,503,052 0.15% 2,079,870 0.15% 1,352,930 0.12% 1,244,755 0.10% 2,457,318 0.25% 1,235,892 0.15% 2-3 Months ≥60 and <90 Days 689,393 0.04% 735,142 0.05% 607,461 0.05% 496,230 0.04% 670,805 0.07% 283,681 0.03% 3-4 Months ≥90 and <120 Days 646,422 0.04% 1,091,881 0.08% 93,896 0.01% 203,591 0.02% 0 0.00% 270,111 0.03%
S-22

4-5 Months ≥120 and <150 Days 674,394 0.04% 273,062 0.02% 68,685 0.01% 0 0.00% 533,370 0.06% 178,289 0.02% 5-6 Months ≥150 and <180 Days 37,478 0.00% 686,395 0.05% 57,893 0.01% 39,581 0.00% 94,161 0.01% 49,159 0.01% 6-7 Months ≥180 and <210 Days 50,748 0.00% 73,313 0.01% 18,836 0.00% 0 0.00% 117,073 0.01% 0 0.00% 7-8 Months ≥210 and <240 Days 76,491 0.01% 190,949 0.01% 42,974 0.00% 0 0.00% 119,795 0.01% 0 0.00% 8-9 Months ≥240 and <270 Days 642,578 0.04% 0 0.00% 16,987 0.00% 0 0.00% 30,138 0.00% 0 0.00% 9-10 Months ≥270 and <300 Days 317,054 0.02% 0 0.00% 0 0.00% 0 0.00% 33,762 0.00% 0 0.00% 10-11 Months ≥300 and <330 Days 0 0.00% 0 0.00% 0 0.00% 0 0.00% 39,343 0.00% 0 0.00% 11-12 Months ≥330 and <360 Days 0 0.00% 0 0.00% 188,001 0.02% 0 0.00% 158,485 0.02% 0 0.00% 12-13 Months ≥360 and <390 Days 232,475 0.02% 0 0.00% 0 0.00% 0 0.00% 18,497 0.00% 0 0.00% 13-14 Months ≥390 and <420 Days 321,745 0.02% 0 0.00% 0 0.00% 0 0.00% 0 0.00% 0 0.00% 14-15 Months ≥420 and <450 Days 0 0.00% 130,744 0.01% 32,271 0.00% 0 0.00% 79,122 0.01% 0 0.00% 15-16 Months ≥450 and <480 Days 0 0.00% 259,884 0.02% 0 0.00% 0 0.00% 0 0.00% 0 0.00% 16-17 Months ≥480 and <510 Days 0 0.00% 0 0.00% 0 0.00% 0 0.00% 0 0.00% 2,663 0.00% 17-18 Months ≥510 and <540 Days 0 0.00% 0 0.00% 0 0.00% 0 0.00% 0 0.00% 76,422 0.01% 18 Months and more ≥540 Days 211,017 0.01% 43,449 0.00% 170,249 0.01% 25,505 0.00% 0 0.00% 139,488 0.02% Total 1,662,891,689 100.00% 1,392,128,393 100.00% 1,132,138,080 100.00% 1,260,091,577 100.00% 965,722,666 100.00% 825,491,887 100.00%
Delinquency Status - Number of Loans in Arrears As at Date 31-Jan-11 31-Jan-12 31-Jan-13 31-Jan-14 31-Jan-15 31-Jan-16 Total Number of Loans Outstanding No. Days Past Due # % # % # % # % # % # % Current <30 Days 22,960 99.71% 19,250 99.70% 16,263 99.76% 20,359 99.87% 15,995 99.75% 14,310 99.74% 1-2 Months ≥30 and <60 Days 26 0.11% 21 0.11% 16 0.10% 17 0.09% 14 0.08% 16 0.11% 2-3 Months ≥60 and <90 Days 11 0.05% 10 0.05% 8 0.05% 4 0.02% 8 0.05% 7 0.05% 3-4 Months ≥90 and <120 Days 8 0.04% 7 0.04% 2 0.01% 3 0.01% 0 0.00% 3 0.02% 4-5 Months ≥120 and <150 Days 7 0.03% 5 0.03% 2 0.01% 0 0.00% 4 0.02% 2 0.01% 5-6 Months ≥150 and <180 Days 1 0.00% 4 0.02% 2 0.01% 2 0.01% 3 0.02% 2 0.01% 6-7 Months ≥180 and <210 Days 2 0.01% 1 0.01% 1 0.01% 0 0.00% 2 0.01% 0 0.00% 7-8 Months ≥210 and <240 Days 3 0.01% 3 0.02% 1 0.01% 0 0.00% 1 0.01% 0 0.00% 8-9 Months ≥240 and <270 Days 1 0.00% 0 0.00% 1 0.01% 1 0.00% 1 0.01% 0 0.00% 9-10 Months ≥270 and <300 Days 4 0.02% 0 0.00% 0 0.00% 0 0.00% 1 0.01% 0 0.00% 10-11 Months ≥300 and <330 Days 0 0.00% 0 0.00% 0 0.00% 0 0.00% 1 0.01% 0 0.00% 11-12 Months ≥330 and <360 Days 0 0.00% 0 0.00% 2 0.01% 0 0.00% 2 0.01% 1 0.01% 12-13 Months ≥360 and <390 Days 2 0.01% 0 0.00% 0 0.00% 1 0.00% 1 0.01% 0 0.00% 13-14 Months ≥390 and <420 Days 1 0.00% 0 0.00% 0 0.00% 0 0.00% 0 0.00% 0 0.00% 14-15 Months ≥420 and <450 Days 0 0.00% 1 0.01% 2 0.01% 0 0.00% 1 0.01% 0 0.00% 15-16 Months ≥450 and <480 Days 0 0.00% 4 0.02% 0 0.00% 0 0.00% 0 0.00% 0 0.00% 16-17 Months ≥480 and <510 Days 0 0.00% 0 0.00% 0 0.00% 0 0.00% 0 0.00% 1 0.01% 17-18 Months ≥510 and <540 Days 0 0.00% 0 0.00% 0 0.00% 0 0.00% 0 0.00% 1 0.01% 18 Months and more ≥540 Days 2 0.01% 1 0.01% 2 0.01% 1 0.00% 0 0.00% 4 0.03% Total 23,028 100.00% 19,307 100.00% 16,302 100.00% 20,388 100.00% 16,034 100.00% 14,347 100.00%
Loss Information As at Date 31-Jan-11 31-Jan-12 31-Jan-13 31-Jan-14 31-Jan-15 31-Jan-16 # % # % # % # % # % # % Number of loans that have experienced a loss for the period / year ended 1 0.00% 6 0.03% 6 0.04% 1 0.00% 2 0.01% 0 0.00% Net loss amount for the period / year ended ($) 32,485 0.00% 230,665 0.02% 158,374 0.01% 13,420 0.00% 83,536 0.01% 0 0.00% Cumulative number of loans that have experienced a loss 1 0.00% 7 0.04% 13 0.08% 14 0.07% 16 0.10% 16 0.11% Cumulative net loss amount ($) 32,485 0.00% 263,150 0.02% 421,524 0.04% 434,944 0.03% 518,480 0.05% 518,480 0.06%
S-23
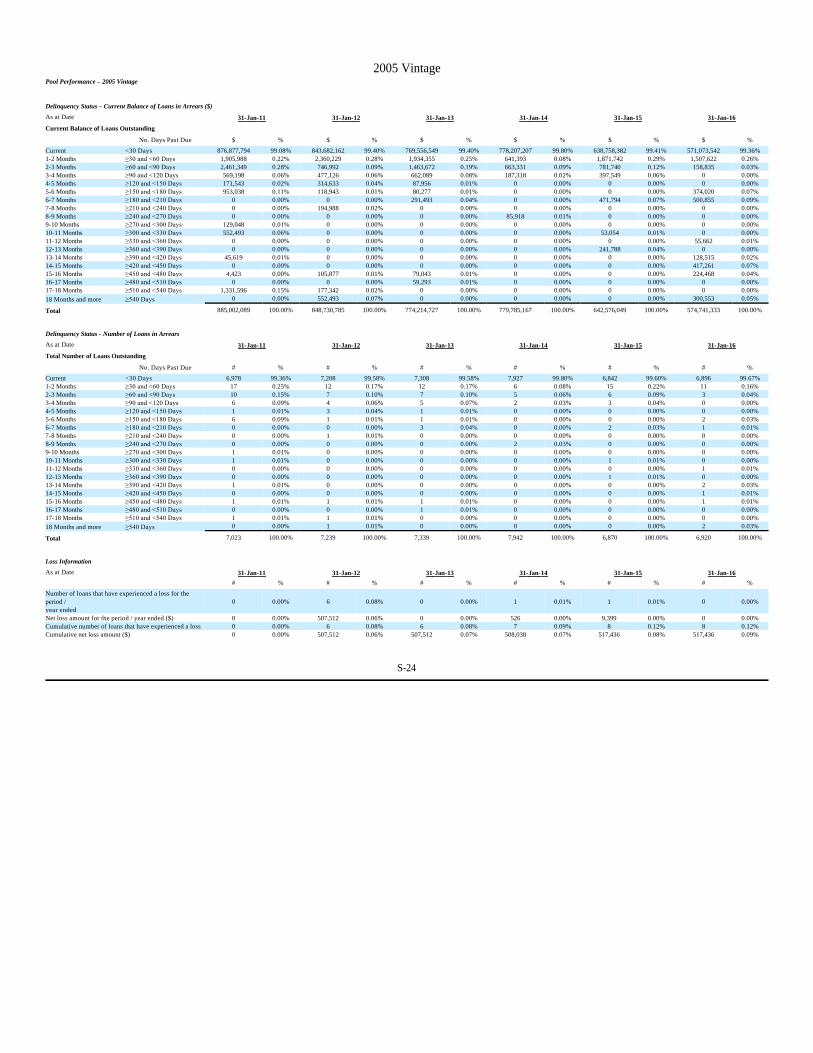
2005 Vintage
Pool Performance – 2005 Vintage Delinquency Status – Current Balance of Loans in Arrears ($) As at Date 31-Jan-11 31-Jan-12 31-Jan-13 31-Jan-14 31-Jan-15 31-Jan-16 Current Balance of Loans Outstanding No. Days Past Due $ % $ % $ % $ % $ % $ % Current <30 Days 876,877,794 99.08% 843,682,162 99.40% 769,556,549 99.40% 778,207,207 99.80% 638,758,382 99.41% 571,073,542 99.36% 1-2 Months ≥30 and <60 Days 1,905,988 0.22% 2,360,229 0.28% 1,934,355 0.25% 641,393 0.08% 1,871,742 0.29% 1,507,622 0.26% 2-3 Months ≥60 and <90 Days 2,461,349 0.28% 746,992 0.09% 1,463,672 0.19% 663,331 0.09% 781,740 0.12% 158,835 0.03% 3-4 Months ≥90 and <120 Days 569,198 0.06% 477,126 0.06% 662,089 0.08% 187,318 0.02% 397,549 0.06% 0 0.00% 4-5 Months ≥120 and <150 Days 171,543 0.02% 314,633 0.04% 87,956 0.01% 0 0.00% 0 0.00% 0 0.00% 5-6 Months ≥150 and <180 Days 953,038 0.11% 118,943 0.01% 80,277 0.01% 0 0.00% 0 0.00% 374,020 0.07% 6-7 Months ≥180 and <210 Days 0 0.00% 0 0.00% 291,493 0.04% 0 0.00% 471,794 0.07% 500,855 0.09% 7-8 Months ≥210 and <240 Days 0 0.00% 194,988 0.02% 0 0.00% 0 0.00% 0 0.00% 0 0.00% 8-9 Months ≥240 and <270 Days 0 0.00% 0 0.00% 0 0.00% 85,918 0.01% 0 0.00% 0 0.00% 9-10 Months ≥270 and <300 Days 129,048 0.01% 0 0.00% 0 0.00% 0 0.00% 0 0.00% 0 0.00% 10-11 Months ≥300 and <330 Days 552,493 0.06% 0 0.00% 0 0.00% 0 0.00% 53,054 0.01% 0 0.00% 11-12 Months ≥330 and <360 Days 0 0.00% 0 0.00% 0 0.00% 0 0.00% 0 0.00% 55,662 0.01% 12-13 Months ≥360 and <390 Days 0 0.00% 0 0.00% 0 0.00% 0 0.00% 241,788 0.04% 0 0.00% 13-14 Months ≥390 and <420 Days 45,619 0.01% 0 0.00% 0 0.00% 0 0.00% 0 0.00% 128,515 0.02% 14-15 Months ≥420 and <450 Days 0 0.00% 0 0.00% 0 0.00% 0 0.00% 0 0.00% 417,261 0.07% 15-16 Months ≥450 and <480 Days 4,423 0.00% 105,877 0.01% 79,043 0.01% 0 0.00% 0 0.00% 224,468 0.04% 16-17 Months ≥480 and <510 Days 0 0.00% 0 0.00% 59,293 0.01% 0 0.00% 0 0.00% 0 0.00% 17-18 Months ≥510 and <540 Days 1,331,596 0.15% 177,342 0.02% 0 0.00% 0 0.00% 0 0.00% 0 0.00% 18 Months and more ≥540 Days 0 0.00% 552,493 0.07% 0 0.00% 0 0.00% 0 0.00% 300,553 0.05% Total 885,002,089 100.00% 848,730,785 100.00% 774,214,727 100.00% 779,785,167 100.00% 642,576,049 100.00% 574,741,333 100.00%
Delinquency Status - Number of Loans in Arrears As at Date 31-Jan-11 31-Jan-12 31-Jan-13 31-Jan-14 31-Jan-15 31-Jan-16 Total Number of Loans Outstanding No. Days Past Due # % # % # % # % # % # % Current <30 Days 6,978 99.36% 7,208 99.58% 7,308 99.58% 7,927 99.80% 6,842 99.60% 6,896 99.67% 1-2 Months ≥30 and <60 Days 17 0.25% 12 0.17% 12 0.17% 6 0.08% 15 0.22% 11 0.16% 2-3 Months ≥60 and <90 Days 10 0.15% 7 0.10% 7 0.10% 5 0.06% 6 0.09% 3 0.04% 3-4 Months ≥90 and <120 Days 6 0.09% 4 0.06% 5 0.07% 2 0.03% 3 0.04% 0 0.00% 4-5 Months ≥120 and <150 Days 1 0.01% 3 0.04% 1 0.01% 0 0.00% 0 0.00% 0 0.00% 5-6 Months ≥150 and <180 Days 6 0.09% 1 0.01% 1 0.01% 0 0.00% 0 0.00% 2 0.03% 6-7 Months ≥180 and <210 Days 0 0.00% 0 0.00% 3 0.04% 0 0.00% 2 0.03% 1 0.01% 7-8 Months ≥210 and <240 Days 0 0.00% 1 0.01% 0 0.00% 0 0.00% 0 0.00% 0 0.00% 8-9 Months ≥240 and <270 Days 0 0.00% 0 0.00% 0 0.00% 2 0.03% 0 0.00% 0 0.00% 9-10 Months ≥270 and <300 Days 1 0.01% 0 0.00% 0 0.00% 0 0.00% 0 0.00% 0 0.00% 10-11 Months ≥300 and <330 Days 1 0.01% 0 0.00% 0 0.00% 0 0.00% 1 0.01% 0 0.00% 11-12 Months ≥330 and <360 Days 0 0.00% 0 0.00% 0 0.00% 0 0.00% 0 0.00% 1 0.01% 12-13 Months ≥360 and <390 Days 0 0.00% 0 0.00% 0 0.00% 0 0.00% 1 0.01% 0 0.00% 13-14 Months ≥390 and <420 Days 1 0.01% 0 0.00% 0 0.00% 0 0.00% 0 0.00% 2 0.03% 14-15 Months ≥420 and <450 Days 0 0.00% 0 0.00% 0 0.00% 0 0.00% 0 0.00% 1 0.01% 15-16 Months ≥450 and <480 Days 1 0.01% 1 0.01% 1 0.01% 0 0.00% 0 0.00% 1 0.01% 16-17 Months ≥480 and <510 Days 0 0.00% 0 0.00% 1 0.01% 0 0.00% 0 0.00% 0 0.00% 17-18 Months ≥510 and <540 Days 1 0.01% 1 0.01% 0 0.00% 0 0.00% 0 0.00% 0 0.00% 18 Months and more ≥540 Days 0 0.00% 1 0.01% 0 0.00% 0 0.00% 0 0.00% 2 0.03% Total 7,023 100.00% 7,239 100.00% 7,339 100.00% 7,942 100.00% 6,870 100.00% 6,920 100.00%
Loss Information As at Date 31-Jan-11 31-Jan-12 31-Jan-13 31-Jan-14 31-Jan-15 31-Jan-16 # % # % # % # % # % # % Number of loans that have experienced a loss for the period / year ended
0 0.00% 6 0.08% 0 0.00% 1 0.01% 1 0.01% 0 0.00%
Net loss amount for the period / year ended ($) 0 0.00% 507,512 0.06% 0 0.00% 526 0.00% 9,399 0.00% 0 0.00% Cumulative number of loans that have experienced a loss 0 0.00% 6 0.08% 6 0.08% 7 0.09% 8 0.12% 8 0.12% Cumulative net loss amount ($) 0 0.00% 507,512 0.06% 507,512 0.07% 508,038 0.07% 517,436 0.08% 517,436 0.09%
S-24

2006 Vintage
Pool Performance – 2006 Vintage Delinquency Status – Current Balance of Loans in Arrears ($) As at Date 31-Jan-11 31-Jan-12 31-Jan-13 31-Jan-14 31-Jan-15 31-Jan-16 Current Balance of Loans Outstanding No. Days Past Due $ % $ % $ % $ % $ % $ % Current <30 Days 3,227,312,505 99.14% 2,276,917,335 99.20% 1,785,497,342 99.36% 1,677,798,073 99.76% 1,293,054,045 99.65% 1,021,431,799 99.47% 1-2 Months ≥30 and <60 Days 8,687,081 0.27% 4,380,403 0.19% 2,924,383 0.16% 1,512,044 0.09% 2,609,473 0.21% 2,535,517 0.25% 2-3 Months ≥60 and <90 Days 5,063,111 0.15% 2,087,563 0.09% 2,677,824 0.15% 904,665 0.05% 163,300 0.01% 1,278,595 0.13% 3-4 Months ≥90 and <120 Days 3,620,178 0.11% 1,475,972 0.07% 902,474 0.05% 659,325 0.04% 267,128 0.02% 247,528 0.02% 4-5 Months ≥120 and <150 Days 1,167,120 0.04% 1,223,814 0.05% 351,831 0.02% 88,151 0.01% 0 0.00% 43,306 0.00% 5-6 Months ≥150 and <180 Days 651,433 0.02% 2,098,492 0.09% 379,568 0.02% 151,613 0.01% 0 0.00% 560,886 0.05% 6-7 Months ≥180 and <210 Days 3,285,276 0.10% 243,732 0.01% 90,087 0.00% 0 0.00% 102,668 0.01% 106,961 0.01% 7-8 Months ≥210 and <240 Days 1,353,650 0.04% 307,061 0.01% 119,936 0.01% 0 0.00% 100,592 0.01% 22,653 0.00% 8-9 Months ≥240 and <270 Days 1,198,561 0.04% 544,913 0.03% 141,090 0.01% 30,932 0.00% 0 0.00% 0 0.00% 9-10 Months ≥270 and <300 Days 665,778 0.02% 318,309 0.01% 0 0.00% 0 0.00% 0 0.00% 0 0.00% 10-11 Months ≥300 and <330 Days 0 0.00% 551,679 0.03% 388,062 0.02% 25,287 0.00% 570,816 0.04% 0 0.00% 11-12 Months ≥330 and <360 Days 235,422 0.01% 221,441 0.01% 494,981 0.03% 0 0.00% 298,257 0.02% 0 0.00% 12-13 Months ≥360 and <390 Days 52,932 0.00% 467,486 0.02% 0 0.00% 0 0.00% 0 0.00% 127,530 0.01% 13-14 Months ≥390 and <420 Days 34,269 0.00% 0 0.00% 55,575 0.00% 0 0.00% 0 0.00% 9,659 0.00% 14-15 Months ≥420 and <450 Days 305,137 0.01% 0 0.00% 40,627 0.00% 0 0.00% 0 0.00% 0 0.00% 15-16 Months ≥450 and <480 Days 0 0.00% 751,540 0.03% 95,822 0.01% 206,028 0.01% 0 0.00% 90,322 0.01% 16-17 Months ≥480 and <510 Days 135,199 0.00% 471,806 0.02% 30,752 0.00% 0 0.00% 0 0.00% 0 0.00% 17-18 Months ≥510 and <540 Days 386,513 0.01% 132,398 0.01% 453,821 0.03% 0 0.00% 17,348 0.00% 0 0.00% 18 Months and more ≥540 Days 1,154,917 0.04% 3,005,707 0.13% 2,414,433 0.13% 447,069 0.03% 447,069 0.03% 499,938 0.05% Total 3,255,309,082 100.00% 2,295,199,651 100.00% 1,797,058,608 100.00% 1,681,823,187 100.00% 1,297,630,696 100.00% 1,026,954,694 100.00%
Delinquency Status - Number of Loans in Arrears As at Date 31-Jan-11 31-Jan-12 31-Jan-13 31-Jan-14 31-Jan-15 31-Jan-16 Total Number of Loans Outstanding No. Days Past Due # % # % # % # % # % # % Current <30 Days 28,292 99.36% 20,733 99.44% 16,916 99.48% 16,834 99.80% 13,691 99.76% 11,729 99.67% 1-2 Months ≥30 and <60 Days 60 0.21% 35 0.17% 28 0.17% 10 0.06% 19 0.14% 16 0.13% 2-3 Months ≥60 and <90 Days 26 0.09% 18 0.09% 16 0.09% 10 0.06% 3 0.02% 4 0.03% 3-4 Months ≥90 and <120 Days 23 0.08% 11 0.05% 8 0.05% 2 0.01% 2 0.01% 3 0.03% 4-5 Months ≥120 and <150 Days 12 0.04% 7 0.03% 4 0.02% 2 0.01% 0 0.00% 1 0.01% 5-6 Months ≥150 and <180 Days 5 0.02% 9 0.05% 4 0.02% 2 0.01% 0 0.00% 2 0.02% 6-7 Months ≥180 and <210 Days 9 0.03% 2 0.01% 2 0.01% 0 0.00% 1 0.01% 2 0.02% 7-8 Months ≥210 and <240 Days 8 0.03% 2 0.01% 2 0.01% 0 0.00% 1 0.01% 1 0.01% 8-9 Months ≥240 and <270 Days 9 0.03% 3 0.01% 2 0.01% 1 0.01% 0 0.00% 0 0.00% 9-10 Months ≥270 and <300 Days 6 0.02% 4 0.02% 0 0.00% 0 0.00% 0 0.00% 0 0.00% 10-11 Months ≥300 and <330 Days 0 0.00% 4 0.02% 3 0.02% 1 0.01% 1 0.01% 0 0.00% 11-12 Months ≥330 and <360 Days 5 0.02% 2 0.01% 2 0.01% 0 0.00% 2 0.01% 0 0.00% 12-13 Months ≥360 and <390 Days 2 0.01% 3 0.01% 0 0.00% 0 0.00% 0 0.00% 3 0.03% 13-14 Months ≥390 and <420 Days 1 0.00% 0 0.00% 2 0.01% 0 0.00% 0 0.00% 1 0.01% 14-15 Months ≥420 and <450 Days 2 0.01% 0 0.00% 1 0.01% 0 0.00% 0 0.00% 0 0.00% 15-16 Months ≥450 and <480 Days 0 0.00% 4 0.02% 1 0.01% 1 0.01% 0 0.00% 1 0.01% 16-17 Months ≥480 and <510 Days 1 0.00% 2 0.01% 1 0.01% 0 0.00% 0 0.00% 0 0.00% 17-18 Months ≥510 and <540 Days 6 0.02% 1 0.00% 4 0.02% 0 0.00% 1 0.01% 0 0.00% 18 Months and more ≥540 Days 7 0.03% 10 0.05% 8 0.05% 3 0.02% 3 0.02% 4 0.03% Total 28,474 100.00% 20,850 100.00% 17,004 100.00% 16,866 100.00% 13,724 100.00% 11,767 100.00%
Loss Information As at Date 31-Jan-11 31-Jan-12 31-Jan-13 31-Jan-14 31-Jan-15 31-Jan-16 # % # % # % # % # % # % Number of loans that have experienced a loss for the period / year ended
10 0.04% 19 0.09% 12 0.07% 3 0.02% 1 0.01% 2 0.02%
Net loss amount for the period / year ended ($) 272,599 0.01% 576,265 0.03% 523,551 0.03% 166,917 0.01% 44,786 0.00% 9,712 0.00% Cumulative number of loans that have experienced a loss 10 0.04% 29 0.14% 41 0.24% 44 0.26% 45 0.33% 47 0.40% Cumulative net loss amount ($) 272,599 0.01% 848,864 0.04% 1,372,415 0.08% 1,539,332 0.09% 1,584,118 0.12% 1,593,830 0.16%
S-25

2007 Vintage
Pool Performance – 2007 Vintage Delinquency Status – Current Balance of Loans in Arrears ($) As at Date 31-Jan-11 31-Jan-12 31-Jan-13 31-Jan-14 31-Jan-15 31-Jan-16 Current Balance of Loans Outstanding No. Days Past Due $ % $ % $ % $ % $ % $ % Current <30 Days 4,759,461,383 99.07% 3,834,663,249 99.07% 2,477,522,280 98.91% 2,550,055,066 99.69% 2,104,704,681 99.56% 1,847,293,809 99.51% 1-2 Months ≥30 and <60 Days 11,054,684 0.23% 9,160,879 0.24% 8,401,507 0.34% 3,031,956 0.11% 2,970,356 0.15% 2,549,185 0.14% 2-3 Months ≥60 and <90 Days 8,012,377 0.17% 9,199,957 0.24% 2,781,030 0.11% 2,666,098 0.10% 1,270,554 0.06% 2,286,294 0.13% 3-4 Months ≥90 and <120 Days 4,520,981 0.09% 2,664,541 0.07% 2,762,003 0.11% 138,472 0.01% 307,537 0.01% 977,721 0.05% 4-5 Months ≥120 and <150 Days 2,828,868 0.06% 2,242,298 0.06% 2,608,090 0.10% 605,525 0.02% 67,268 0.00% 105,175 0.01% 5-6 Months ≥150 and <180 Days 1,411,194 0.03% 1,636,684 0.04% 485,009 0.02% 408,506 0.02% 222,612 0.01% 60,274 0.00% 6-7 Months ≥180 and <210 Days 860,128 0.02% 1,178,335 0.03% 185,646 0.01% 171,570 0.01% 30,700 0.00% 193,412 0.01% 7-8 Months ≥210 and <240 Days 2,652,128 0.05% 1,362,966 0.04% 26,249 0.00% 0 0.00% 740,337 0.04% 370,259 0.02% 8-9 Months ≥240 and <270 Days 1,936,902 0.04% 0 0.00% 20,014 0.00% 171,699 0.01% 507,478 0.02% 31,511 0.00% 9-10 Months ≥270 and <300 Days 1,412,650 0.03% 348,548 0.01% 1,061,589 0.04% 0 0.00% 362,224 0.02% 28,675 0.00% 10-11 Months ≥300 and <330 Days 774,368 0.02% 394,466 0.01% 921,060 0.04% 0 0.00% 1,238,058 0.06% 43,602 0.00% 11-12 Months ≥330 and <360 Days 296,852 0.01% 620,536 0.02% 260,426 0.01% 0 0.00% 181,410 0.01% 407,468 0.02% 12-13 Months ≥360 and <390 Days 1,384,213 0.03% 213,177 0.00% 198,653 0.01% 16,609 0.00% 235,991 0.01% 0 0.00% 13-14 Months ≥390 and <420 Days 102,678 0.00% 421,925 0.01% 785,499 0.03% 0 0.00% 702,311 0.03% 232,992 0.01% 14-15 Months ≥420 and <450 Days 1,105,844 0.02% 1,148,638 0.03% 2,512,171 0.10% 0 0.00% 191,576 0.01% 0 0.00% 15-16 Months ≥450 and <480 Days 173,801 0.00% 85,197 0.00% 58,258 0.00% 0 0.00% 47,202 0.00% 238,508 0.01% 16-17 Months ≥480 and <510 Days 307,426 0.01% 591,591 0.01% 894,241 0.04% 0 0.00% 0 0.00% 0 0.00% 17-18 Months ≥510 and <540 Days 529,472 0.01% 191,564 0.00% 300,709 0.01% 0 0.00% 0 0.00% 0 0.00% 18 Months and more ≥540 Days 5,300,606 0.11% 4,552,012 0.12% 3,046,260 0.12% 692,265 0.03% 272,416 0.01% 1,587,444 0.09% Total 4,804,126,555 100.00% 3,870,676,563 100.00% 2,504,830,694 100.00% 2,557,957,766 100.00% 2,114,052,711 100.00% 1,856,406,329 100.00%
Delinquency Status - Number of Loans in Arrears As at Date 31-Jan-11 31-Jan-12 31-Jan-13 31-Jan-14 31-Jan-15 31-Jan-16 Total Number of Loans Outstanding No. Days Past Due # % # % # % # % # % # % Current <30 Days 37,071 99.33% 31,220 99.30% 20,045 99.34% 20,890 99.80% 17,907 99.67% 16,858 99.58% 1-2 Months ≥30 and <60 Days 64 0.17% 56 0.18% 44 0.22% 18 0.09% 20 0.11% 27 0.15% 2-3 Months ≥60 and <90 Days 48 0.13% 50 0.16% 19 0.09% 12 0.06% 7 0.04% 18 0.10% 3-4 Months ≥90 and <120 Days 21 0.05% 16 0.05% 10 0.05% 3 0.01% 2 0.01% 6 0.03% 4-5 Months ≥120 and <150 Days 18 0.05% 12 0.04% 8 0.04% 3 0.01% 1 0.01% 1 0.01% 5-6 Months ≥150 and <180 Days 5 0.01% 15 0.05% 2 0.01% 2 0.01% 1 0.01% 1 0.01% 6-7 Months ≥180 and <210 Days 6 0.02% 8 0.02% 3 0.02% 1 0.00% 1 0.01% 2 0.01% 7-8 Months ≥210 and <240 Days 13 0.03% 7 0.02% 1 0.00% 0 0.00% 5 0.03% 3 0.02% 8-9 Months ≥240 and <270 Days 10 0.02% 0 0.00% 1 0.00% 1 0.00% 4 0.02% 1 0.01% 9-10 Months ≥270 and <300 Days 6 0.02% 3 0.01% 3 0.02% 0 0.00% 1 0.01% 1 0.01% 10-11 Months ≥300 and <330 Days 7 0.02% 4 0.01% 6 0.03% 0 0.00% 3 0.02% 1 0.01% 11-12 Months ≥330 and <360 Days 2 0.01% 6 0.02% 1 0.00% 0 0.00% 1 0.01% 2 0.01% 12-13 Months ≥360 and <390 Days 8 0.02% 2 0.01% 2 0.01% 1 0.00% 2 0.01% 0 0.00% 13-14 Months ≥390 and <420 Days 1 0.00% 2 0.01% 3 0.02% 0 0.00% 2 0.01% 1 0.01% 14-15 Months ≥420 and <450 Days 6 0.02% 9 0.03% 8 0.04% 0 0.00% 2 0.01% 0 0.00% 15-16 Months ≥450 and <480 Days 2 0.01% 1 0.00% 1 0.00% 0 0.00% 1 0.01% 1 0.01% 16-17 Months ≥480 and <510 Days 2 0.01% 4 0.01% 2 0.01% 0 0.00% 0 0.00% 0 0.00% 17-18 Months ≥510 and <540 Days 4 0.01% 1 0.00% 2 0.01% 0 0.00% 0 0.00% 0 0.00% 18 Months and more ≥540 Days 27 0.07% 25 0.08% 18 0.09% 4 0.02% 2 0.01% 5 0.03% Total 37,321 100.00% 31,441 100.00% 20,179 100.00% 20,935 100.00% 17,962 100.00% 16,928 100.00%
Loss Information As at Date 31-Jan-11 31-Jan-12 31-Jan-13 31-Jan-14 31-Jan-15 31-Jan-16 # % # % # % # % # % # % Number of loans that have experienced a loss for the period / year ended 5 0.01% 46 0.15% 38 0.19% 7 0.03% 2 0.01% 8 0.05% Net loss amount for the period / year ended ($) 187,793 0.00% 1,533,110 0.04% 2,055,893 0.08% 422,375 0.02% 198,761 0.01% 524,686 0.03% Cumulative number of loans that have experienced a loss 5 0.01% 51 0.16% 89 0.44% 96 0.46% 98 0.55% 106 0.63% Cumulative net loss amount ($) 187,793 0.00% 1,720,903 0.04% 3,776,797 0.15% 4,199,172 0.16% 4,397,933 0.21% 4,922,619 0.27%
S-26

2008 Vintage
Pool Performance – 2008 Vintage Delinquency Status – Current Balance of Loans in Arrears ($) As at Date 31-Jan-11 31-Jan-12 31-Jan-13 31-Jan-14 31-Jan-15 31-Jan-16 Current Balance of Loans Outstanding No. Days Past Due $ % $ % $ % $ % $ % $ % Current <30 Days 2,187,205,304 99.67% 2,683,218,199 99.62% 2,277,870,187 99.65% 2,701,750,628 99.75% 2,554,261,498 99.62% 2,429,281,865 99.45% 1-2 Months ≥30 and <60 Days 3,325,784 0.15% 3,513,965 0.13% 2,359,166 0.10% 3,732,062 0.14% 3,477,437 0.14% 4,971,680 0.21% 2-3 Months ≥60 and <90 Days 1,492,396 0.07% 3,177,160 0.12% 1,844,303 0.08% 1,590,027 0.06% 2,811,490 0.11% 2,952,585 0.12% 3-4 Months ≥90 and <120 Days 563,658 0.03% 748,390 0.03% 888,606 0.04% 742,824 0.03% 861,356 0.03% 679,788 0.03% 4-5 Months ≥120 and <150 Days 69,688 0.00% 776,822 0.03% 343,486 0.02% 285,172 0.01% 0 0.00% 317,627 0.01% 5-6 Months ≥150 and <180 Days 648,592 0.03% 132,239 0.01% 149,648 0.01% 162,676 0.01% 527,030 0.02% 250,170 0.01% 6-7 Months ≥180 and <210 Days 661,969 0.03% 640,570 0.02% 441,582 0.02% 125,629 0.00% 0 0.00% 259,336 0.01% 7-8 Months ≥210 and <240 Days 236,939 0.01% 102,836 0.00% 86,310 0.00% 0 0.00% 64,263 0.00% 236,115 0.01% 8-9 Months ≥240 and <270 Days 0 0.00% 304,522 0.01% 74,927 0.00% 0 0.00% 515,194 0.02% 1,099,054 0.04% 9-10 Months ≥270 and <300 Days 0 0.00% 0 0.00% 0 0.00% 0 0.00% 0 0.00% 0 0.00% 10-11 Months ≥300 and <330 Days 0 0.00% 177,123 0.01% 87,354 0.00% 0 0.00% 216,325 0.01% 427,430 0.02% 11-12 Months ≥330 and <360 Days 0 0.00% 43,254 0.00% 847,782 0.04% 0 0.00% 0 0.00% 260,124 0.01% 12-13 Months ≥360 and <390 Days 237,112 0.01% 0 0.00% 258,152 0.01% 0 0.00% 403,372 0.02% 0 0.00% 13-14 Months ≥390 and <420 Days 50,236 0.00% 109,554 0.00% 114,884 0.01% 73,036 0.00% 0 0.00% 0 0.00% 14-15 Months ≥420 and <450 Days 0 0.00% 0 0.00% 0 0.00% 0 0.00% 0 0.00% 563,400 0.02% 15-16 Months ≥450 and <480 Days 0 0.00% 0 0.00% 0 0.00% 0 0.00% 647,678 0.03% 0 0.00% 16-17 Months ≥480 and <510 Days 0 0.00% 0 0.00% 77,376 0.00% 0 0.00% 0 0.00% 0 0.00% 17-18 Months ≥510 and <540 Days 0 0.00% 389,064 0.01% 139,537 0.01% 0 0.00% 0 0.00% 527,030 0.02% 18 Months and more ≥540 Days 0 0.00% 222,217 0.01% 206,985 0.01% 0 0.00% 0 0.00% 996,944 0.04% Total 2,194,491,678 100.00% 2,693,555,915 100.00% 2,285,790,285 100.00% 2,708,462,054 100.00% 2,563,785,643 100.00% 2,442,823,148 100.00%
Delinquency Status - Number of Loans in Arrears As at Date 31-Jan-11 31-Jan-12 31-Jan-13 31-Jan-14 31-Jan-15 31-Jan-16 Total Number of Loans Outstanding No. Days Past Due # % # % # % # % # % # % Current <30 Days 15,524 99.74% 18,931 99.72% 15,932 99.71% 18,936 99.81% 18,831 99.72% 19,749 99.60% 1-2 Months ≥30 and <60 Days 22 0.14% 15 0.08% 15 0.08% 15 0.07% 19 0.10% 32 0.15% 2-3 Months ≥60 and <90 Days 5 0.03% 13 0.07% 9 0.05% 8 0.04% 16 0.08% 11 0.05% 3-4 Months ≥90 and <120 Days 3 0.02% 4 0.02% 3 0.02% 5 0.03% 4 0.02% 6 0.03% 4-5 Months ≥120 and <150 Days 1 0.01% 5 0.02% 2 0.01% 3 0.02% 0 0.00% 4 0.02% 5-6 Months ≥150 and <180 Days 2 0.01% 2 0.01% 1 0.01% 2 0.01% 1 0.01% 1 0.01% 6-7 Months ≥180 and <210 Days 3 0.02% 3 0.01% 2 0.01% 1 0.01% 0 0.00% 3 0.02% 7-8 Months ≥210 and <240 Days 2 0.01% 1 0.01% 1 0.01% 0 0.00% 2 0.01% 1 0.01% 8-9 Months ≥240 and <270 Days 0 0.00% 2 0.01% 1 0.01% 0 0.00% 1 0.01% 1 0.01% 9-10 Months ≥270 and <300 Days 0 0.00% 0 0.00% 0 0.00% 0 0.00% 0 0.00% 0 0.00% 10-11 Months ≥300 and <330 Days 0 0.00% 2 0.01% 1 0.01% 0 0.00% 2 0.01% 3 0.02% 11-12 Months ≥330 and <360 Days 0 0.00% 1 0.01% 3 0.02% 0 0.00% 0 0.00% 3 0.02% 12-13 Months ≥360 and <390 Days 2 0.01% 0 0.00% 1 0.01% 0 0.00% 4 0.02% 0 0.00% 13-14 Months ≥390 and <420 Days 2 0.01% 2 0.01% 1 0.01% 1 0.01% 0 0.00% 0 0.00% 14-15 Months ≥420 and <450 Days 0 0.00% 0 0.00% 0 0.00% 0 0.00% 0 0.00% 3 0.02% 15-16 Months ≥450 and <480 Days 0 0.00% 0 0.00% 0 0.00% 0 0.00% 4 0.02% 0 0.00% 16-17 Months ≥480 and <510 Days 0 0.00% 0 0.00% 1 0.01% 0 0.00% 0 0.00% 0 0.00% 17-18 Months ≥510 and <540 Days 0 0.00% 1 0.01% 1 0.01% 0 0.00% 0 0.00% 1 0.01% 18 Months and more ≥540 Days 0 0.00% 1 0.01% 3 0.02% 0 0.00% 0 0.00% 5 0.03% Total 15,566 100.00% 18,983 100.00% 15,977 100.00% 18,971 100.00% 18,884 100.00% 19,823 100.00%
Loss Information As at Date 31-Jan-11 31-Jan-12 31-Jan-13 31-Jan-14 31-Jan-15 31-Jan-16 # % # % # % # % # % # % Number of loans that have experienced a loss for the period / year ended 2 0.01% 6 0.03% 7 0.04% 5 0.03% 2 0.01% 4 0.02% Net loss amount for the period / year ended ($) 66,155 0.00% 371,990 0.01% 581,780 0.03% 231,787 0.01% 97,181 0.00% 269,567 0.01% Cumulative number of loans that have experienced a loss 2 0.01% 8 0.04% 15 0.09% 20 0.11% 22 0.12% 26 0.13% Cumulative net loss amount ($) 66,155 0.00% 438,145 0.02% 1,019,925 0.04% 1,251,712 0.05% 1,348,892 0.05% 1,618,460 0.07%
S-27

2009 Vintage
Pool Performance – 2009 Vintage Delinquency Status – Current Balance of Loans in Arrears ($) As at Date 31-Jan-11 31-Jan-12 31-Jan-13 31-Jan-14 31-Jan-15 31-Jan-16 Current Balance of Loans Outstanding No. Days Past Due $ % $ % $ % $ % $ % $ % Current <30 Days 1,988,575,723 99.47% 3,125,522,049 99.56% 3,248,573,165 99.55% 4,062,074,369 99.79% 3,079,982,750 99.79% 2,892,189,055 99.67% 1-2 Months ≥30 and <60 Days 4,603,898 0.23% 5,685,476 0.18% 5,093,758 0.16% 4,613,337 0.11% 2,532,504 0.08% 2,000,574 0.07% 2-3 Months ≥60 and <90 Days 2,019,574 0.10% 1,889,245 0.06% 3,099,910 0.09% 1,400,631 0.03% 1,192,013 0.04% 2,693,859 0.09% 3-4 Months ≥90 and <120 Days 953,617 0.05% 674,570 0.02% 1,562,535 0.05% 638,771 0.02% 166,999 0.01% 820,568 0.03% 4-5 Months ≥120 and <150 Days 420,706 0.02% 387,225 0.01% 74,096 0.00% 268,376 0.01% 133,620 0.00% 191,160 0.01% 5-6 Months ≥150 and <180 Days 209,503 0.01% 424,579 0.01% 915,941 0.03% 0 0.00% 191,586 0.01% 816,828 0.03% 6-7 Months ≥180 and <210 Days 253,035 0.01% 0 0.00% 228,843 0.01% 254,753 0.01% 177,362 0.01% 171,173 0.01% 7-8 Months ≥210 and <240 Days 1,021,962 0.05% 483,990 0.02% 0 0.00% 263,331 0.01% 229,822 0.01% 31,816 0.00% 8-9 Months ≥240 and <270 Days 662,428 0.03% 279,434 0.01% 0 0.00% 0 0.00% 0 0.00% 557,412 0.02% 9-10 Months ≥270 and <300 Days 147,847 0.01% 521,588 0.02% 380,631 0.01% 483,859 0.01% 29,691 0.00% 208,659 0.01% 10-11 Months ≥300 and <330 Days 119,681 0.01% 0 0.00% 460,901 0.01% 0 0.00% 407,361 0.01% 335,452 0.01% 11-12 Months ≥330 and <360 Days 260,196 0.01% 0 0.00% 185,917 0.01% 0 0.00% 114,242 0.00% 0 0.00% 12-13 Months ≥360 and <390 Days 0 0.00% 0 0.00% 0 0.00% 0 0.00% 161,092 0.01% 794,683 0.03% 13-14 Months ≥390 and <420 Days 0 0.00% 733,988 0.02% 1,483,081 0.05% 0 0.00% 219,232 0.01% 122,580 0.00% 14-15 Months ≥420 and <450 Days 0 0.00% 855,959 0.03% 0 0.00% 0 0.00% 0 0.00% 0 0.00% 15-16 Months ≥450 and <480 Days 0 0.00% 0 0.00% 100,660 0.00% 0 0.00% 0 0.00% 0 0.00% 16-17 Months ≥480 and <510 Days 0 0.00% 462,576 0.01% 144,171 0.00% 0 0.00% 0 0.00% 0 0.00% 17-18 Months ≥510 and <540 Days 0 0.00% 0 0.00% 0 0.00% 0 0.00% 189,928 0.01% 0 0.00% 18 Months and more ≥540 Days 0 0.00% 1,448,580 0.05% 977,484 0.03% 284,137 0.01% 293,881 0.01% 570,778 0.02% Total 1,999,248,170 100.00% 3,139,369,259 100.00% 3,263,281,093 100.00% 4,070,281,564 100.00% 3,086,022,083 100.00% 2,901,504,597 100.00%
Delinquency Status - Number of Loans in Arrears As at Date 31-Jan-11 31-Jan-12 31-Jan-13 31-Jan-14 31-Jan-15 31-Jan-16 Total Number of Loans Outstanding No. Days Past Due # % # % # % # % # % # % Current <30 Days 12,647 99.61% 19,314 99.68% 20,010 99.66% 26,437 99.84% 20,498 99.83% 20,947 99.72% 1-2 Months ≥30 and <60 Days 18 0.14% 25 0.12% 23 0.12% 21 0.08% 17 0.09% 19 0.10% 2-3 Months ≥60 and <90 Days 12 0.09% 10 0.05% 15 0.08% 7 0.03% 9 0.05% 13 0.07% 3-4 Months ≥90 and <120 Days 4 0.03% 3 0.02% 12 0.06% 7 0.03% 1 0.00% 5 0.02% 4-5 Months ≥120 and <150 Days 3 0.02% 3 0.02% 1 0.00% 3 0.01% 1 0.00% 2 0.01% 5-6 Months ≥150 and <180 Days 2 0.02% 2 0.01% 5 0.03% 0 0.00% 2 0.01% 6 0.03% 6-7 Months ≥180 and <210 Days 2 0.02% 0 0.00% 1 0.00% 1 0.00% 1 0.00% 1 0.00% 7-8 Months ≥210 and <240 Days 3 0.02% 2 0.01% 0 0.00% 2 0.01% 1 0.00% 1 0.00% 8-9 Months ≥240 and <270 Days 1 0.01% 2 0.01% 0 0.00% 0 0.00% 0 0.00% 2 0.01% 9-10 Months ≥270 and <300 Days 2 0.02% 3 0.02% 2 0.01% 1 0.00% 1 0.00% 3 0.01% 10-11 Months ≥300 and <330 Days 1 0.01% 0 0.00% 1 0.00% 0 0.00% 2 0.01% 2 0.01% 11-12 Months ≥330 and <360 Days 1 0.01% 0 0.00% 1 0.00% 0 0.00% 1 0.00% 0 0.00% 12-13 Months ≥360 and <390 Days 0 0.00% 0 0.00% 0 0.00% 0 0.00% 1 0.00% 2 0.01% 13-14 Months ≥390 and <420 Days 0 0.00% 1 0.00% 3 0.02% 0 0.00% 1 0.00% 1 0.00% 14-15 Months ≥420 and <450 Days 0 0.00% 4 0.02% 0 0.00% 0 0.00% 0 0.00% 0 0.00% 15-16 Months ≥450 and <480 Days 0 0.00% 0 0.00% 1 0.00% 0 0.00% 0 0.00% 0 0.00% 16-17 Months ≥480 and <510 Days 0 0.00% 3 0.02% 1 0.00% 0 0.00% 0 0.00% 0 0.00% 17-18 Months ≥510 and <540 Days 0 0.00% 0 0.00% 0 0.00% 0 0.00% 1 0.00% 0 0.00% 18 Months and more ≥540 Days 0 0.00% 3 0.02% 4 0.02% 1 0.00% 2 0.01% 3 0.01% Total 12,696 100.00% 19,375 100.00% 20,080 100.00% 26,480 100.00% 20,539 100.00% 21,007 100.00%
Loss Information As at Date 31-Jan-11 31-Jan-12 31-Jan-13 31-Jan-14 31-Jan-15 31-Jan-16 # % # % # % # % # % # % Number of loans that have experienced a loss for the period / year ended 0 0.00% 4 0.02% 9 0.04% 2 0.01% 2 0.01% 7 0.03% Net loss amount for the period / year ended ($) 0 0.00% 116,376 0.00% 486,168 0.01% 500,921 0.01% 66,170 0.00% 539,453 0.02% Cumulative number of loans that have experienced a loss 0 0.00% 4 0.02% 13 0.06% 15 0.06% 17 0.08% 24 0.11% Cumulative net loss amount ($) 0 0.00% 116,376 0.00% 602,544 0.02% 1,103,465 0.03% 1,169,635 0.04% 1,709,088 0.06%
S-28

2010 Vintage
Pool Performance – 2010 Vintage Delinquency Status – Current Balance of Loans in Arrears ($) As at Date 31-Jan-11 31-Jan-12 31-Jan-13 31-Jan-14 31-Jan-15 31-Jan-16 Current Balance of Loans Outstanding No. Days Past Due $ % $ % $ % $ % $ % $ % Current <30 Days 7,274,447 100.00% 2,800,774,159 99.98% 4,002,551,090 99.85% 5,741,645,591 99.89% 5,752,862,230 99.83% 4,141,684,607 99.69% 1-2 Months ≥30 and <60 Days 0 0.00% 411,732 0.01% 4,497,878 0.11% 3,062,473 0.05% 4,214,105 0.08% 4,445,572 0.10% 2-3 Months ≥60 and <90 Days 0 0.00% 296,709 0.01% 691,778 0.02% 1,640,099 0.03% 1,220,661 0.02% 2,580,125 0.06% 3-4 Months ≥90 and <120 Days 0 0.00% 0 0.00% 0 0.00% 1,581,466 0.03% 1,542,393 0.03% 1,121,259 0.03% 4-5 Months ≥120 and <150 Days 0 0.00% 0 0.00% 0 0.00% 242,153 0.00% 9,050 0.00% 700,048 0.02% 5-6 Months ≥150 and <180 Days 0 0.00% 0 0.00% 0 0.00% 143,434 0.00% 533,356 0.01% 295,475 0.01% 6-7 Months ≥180 and <210 Days 0 0.00% 0 0.00% 97,984 0.00% 185,993 0.00% 88,767 0.00% 282,316 0.01% 7-8 Months ≥210 and <240 Days 0 0.00% 0 0.00% 161,049 0.00% 0 0.00% 0 0.00% 889,522 0.02% 8-9 Months ≥240 and <270 Days 0 0.00% 0 0.00% 0 0.00% 96,563 0.00% 43,329 0.00% 99,347 0.00% 9-10 Months ≥270 and <300 Days 0 0.00% 0 0.00% 560,978 0.02% 0 0.00% 231,347 0.00% 101,567 0.00% 10-11 Months ≥300 and <330 Days 0 0.00% 0 0.00% 0 0.00% 0 0.00% 0 0.00% 634,550 0.02% 11-12 Months ≥330 and <360 Days 0 0.00% 0 0.00% 0 0.00% 0 0.00% 516,703 0.01% 245,826 0.01% 12-13 Months ≥360 and <390 Days 0 0.00% 0 0.00% 0 0.00% 0 0.00% 0 0.00% 0 0.00% 13-14 Months ≥390 and <420 Days 0 0.00% 0 0.00% 0 0.00% 0 0.00% 0 0.00% 0 0.00% 14-15 Months ≥420 and <450 Days 0 0.00% 0 0.00% 0 0.00% 0 0.00% 268,741 0.00% 0 0.00% 15-16 Months ≥450 and <480 Days 0 0.00% 0 0.00% 0 0.00% 0 0.00% 908,426 0.02% 119,228 0.00% 16-17 Months ≥480 and <510 Days 0 0.00% 0 0.00% 0 0.00% 0 0.00% 262,902 0.00% 341,726 0.01% 17-18 Months ≥510 and <540 Days 0 0.00% 0 0.00% 0 0.00% 0 0.00% 155,221 0.00% 306,157 0.01% 18 Months and more ≥540 Days 0 0.00% 0 0.00% 0 0.00% 0 0.00% 96,563 0.00% 447,563 0.01% Total 7,274,447 100.00% 2,801,482,600 100.00% 4,008,560,757 100.00% 5,748,597,772 100.00% 5,762,953,794 100.00% 4,154,294,888 100.00%
Delinquency Status - Number of Loans in Arrears As at Date 31-Jan-11 31-Jan-12 31-Jan-13 31-Jan-14 31-Jan-15 31-Jan-16 Total Number of Loans Outstanding No. Days Past Due # % # % # % # % # % # % Current <30 Days 49 100.00% 15,598 99.97% 21,718 99.90% 34,228 99.91% 35,039 99.85% 26,550 99.73% 1-2 Months ≥30 and <60 Days 0 0.00% 2 0.01% 14 0.07% 13 0.04% 24 0.07% 23 0.09% 2-3 Months ≥60 and <90 Days 0 0.00% 3 0.02% 4 0.02% 10 0.03% 8 0.02% 17 0.07% 3-4 Months ≥90 and <120 Days 0 0.00% 0 0.00% 0 0.00% 7 0.02% 7 0.02% 9 0.03% 4-5 Months ≥120 and <150 Days 0 0.00% 0 0.00% 0 0.00% 1 0.00% 1 0.00% 5 0.02% 5-6 Months ≥150 and <180 Days 0 0.00% 0 0.00% 0 0.00% 1 0.00% 3 0.01% 3 0.01% 6-7 Months ≥180 and <210 Days 0 0.00% 0 0.00% 1 0.00% 1 0.00% 1 0.00% 1 0.00% 7-8 Months ≥210 and <240 Days 0 0.00% 0 0.00% 1 0.00% 0 0.00% 0 0.00% 2 0.01% 8-9 Months ≥240 and <270 Days 0 0.00% 0 0.00% 0 0.00% 1 0.00% 1 0.00% 1 0.00% 9-10 Months ≥270 and <300 Days 0 0.00% 0 0.00% 3 0.01% 0 0.00% 1 0.00% 1 0.00% 10-11 Months ≥300 and <330 Days 0 0.00% 0 0.00% 0 0.00% 0 0.00% 0 0.00% 2 0.01% 11-12 Months ≥330 and <360 Days 0 0.00% 0 0.00% 0 0.00% 0 0.00% 3 0.01% 2 0.01% 12-13 Months ≥360 and <390 Days 0 0.00% 0 0.00% 0 0.00% 0 0.00% 0 0.00% 0 0.00% 13-14 Months ≥390 and <420 Days 0 0.00% 0 0.00% 0 0.00% 0 0.00% 0 0.00% 0 0.00% 14-15 Months ≥420 and <450 Days 0 0.00% 0 0.00% 0 0.00% 0 0.00% 2 0.01% 0 0.00% 15-16 Months ≥450 and <480 Days 0 0.00% 0 0.00% 0 0.00% 0 0.00% 3 0.01% 2 0.01% 16-17 Months ≥480 and <510 Days 0 0.00% 0 0.00% 0 0.00% 0 0.00% 1 0.00% 1 0.00% 17-18 Months ≥510 and <540 Days 0 0.00% 0 0.00% 0 0.00% 0 0.00% 1 0.00% 1 0.00% 18 Months and more ≥540 Days 0 0.00% 0 0.00% 0 0.00% 0 0.00% 1 0.00% 2 0.01% Total 49 100.00% 15,603 100.00% 21,741 100.00% 34,262 100.00% 35,096 100.00% 26,622 100.00%
Loss Information As at Date 31-Jan-11 31-Jan-12 31-Jan-13 31-Jan-14 31-Jan-15 31-Jan-16 # % # % # % # % # % # % Number of loans that have experienced a loss for the period / year ended 0 0.00% 0 0.00% 1 0.00% 1 0.00% 5 0.01% 8 0.03% Net loss amount for the period / year ended ($) 0 0.00% 0 0.00% 10,167 0.00% 22,183 0.00% 251,716 0.00% 311,676 0.01% Cumulative number of loans that have experienced a loss 0 0.00% 0 0.00% 1 0.00% 2 0.01% 7 0.02% 15 0.06% Cumulative net loss amount ($) 0 0.00% 0 0.00% 10,167 0.00% 32,350 0.00% 284,066 0.00% 595,742 0.01%
S-29
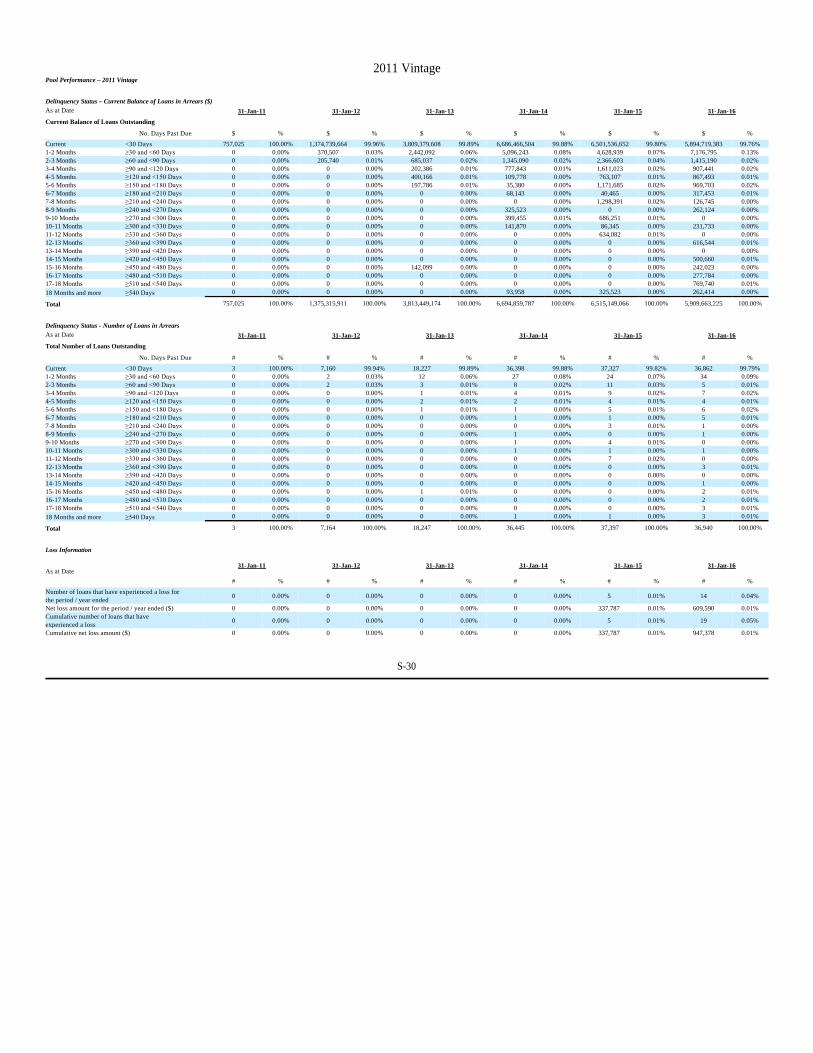
2011 Vintage
Pool Performance – 2011 Vintage Delinquency Status – Current Balance of Loans in Arrears ($) As at Date 31-Jan-11 31-Jan-12 31-Jan-13 31-Jan-14 31-Jan-15 31-Jan-16 Current Balance of Loans Outstanding No. Days Past Due $ % $ % $ % $ % $ % $ % Current <30 Days 757,025 100.00% 1,374,739,664 99.96% 3,809,379,608 99.89% 6,686,466,504 99.88% 6,501,536,652 99.80% 5,894,719,383 99.76% 1-2 Months ≥30 and <60 Days 0 0.00% 370,507 0.03% 2,442,092 0.06% 5,096,243 0.08% 4,628,939 0.07% 7,176,795 0.13% 2-3 Months ≥60 and <90 Days 0 0.00% 205,740 0.01% 685,037 0.02% 1,345,090 0.02% 2,366,603 0.04% 1,415,190 0.02% 3-4 Months ≥90 and <120 Days 0 0.00% 0 0.00% 202,386 0.01% 777,843 0.01% 1,611,023 0.02% 907,441 0.02% 4-5 Months ≥120 and <150 Days 0 0.00% 0 0.00% 400,166 0.01% 109,778 0.00% 763,107 0.01% 867,493 0.01% 5-6 Months ≥150 and <180 Days 0 0.00% 0 0.00% 197,786 0.01% 35,380 0.00% 1,171,685 0.02% 969,703 0.02% 6-7 Months ≥180 and <210 Days 0 0.00% 0 0.00% 0 0.00% 68,143 0.00% 40,465 0.00% 317,453 0.01% 7-8 Months ≥210 and <240 Days 0 0.00% 0 0.00% 0 0.00% 0 0.00% 1,298,391 0.02% 126,745 0.00% 8-9 Months ≥240 and <270 Days 0 0.00% 0 0.00% 0 0.00% 325,523 0.00% 0 0.00% 262,124 0.00% 9-10 Months ≥270 and <300 Days 0 0.00% 0 0.00% 0 0.00% 399,455 0.01% 686,251 0.01% 0 0.00% 10-11 Months ≥300 and <330 Days 0 0.00% 0 0.00% 0 0.00% 141,870 0.00% 86,345 0.00% 231,733 0.00% 11-12 Months ≥330 and <360 Days 0 0.00% 0 0.00% 0 0.00% 0 0.00% 634,082 0.01% 0 0.00% 12-13 Months ≥360 and <390 Days 0 0.00% 0 0.00% 0 0.00% 0 0.00% 0 0.00% 616,544 0.01% 13-14 Months ≥390 and <420 Days 0 0.00% 0 0.00% 0 0.00% 0 0.00% 0 0.00% 0 0.00% 14-15 Months ≥420 and <450 Days 0 0.00% 0 0.00% 0 0.00% 0 0.00% 0 0.00% 500,660 0.01% 15-16 Months ≥450 and <480 Days 0 0.00% 0 0.00% 142,099 0.00% 0 0.00% 0 0.00% 242,023 0.00% 16-17 Months ≥480 and <510 Days 0 0.00% 0 0.00% 0 0.00% 0 0.00% 0 0.00% 277,784 0.00% 17-18 Months ≥510 and <540 Days 0 0.00% 0 0.00% 0 0.00% 0 0.00% 0 0.00% 769,740 0.01% 18 Months and more ≥540 Days 0 0.00% 0 0.00% 0 0.00% 93,958 0.00% 325,523 0.00% 262,414 0.00% Total 757,025 100.00% 1,375,315,911 100.00% 3,813,449,174 100.00% 6,694,859,787 100.00% 6,515,149,066 100.00% 5,909,663,225 100.00%
Delinquency Status - Number of Loans in Arrears As at Date 31-Jan-11 31-Jan-12 31-Jan-13 31-Jan-14 31-Jan-15 31-Jan-16 Total Number of Loans Outstanding No. Days Past Due # % # % # % # % # % # % Current <30 Days 3 100.00% 7,160 99.94% 18,227 99.89% 36,398 99.88% 37,327 99.82% 36,862 99.79% 1-2 Months ≥30 and <60 Days 0 0.00% 2 0.03% 12 0.06% 27 0.08% 24 0.07% 34 0.09% 2-3 Months ≥60 and <90 Days 0 0.00% 2 0.03% 3 0.01% 8 0.02% 11 0.03% 5 0.01% 3-4 Months ≥90 and <120 Days 0 0.00% 0 0.00% 1 0.01% 4 0.01% 9 0.02% 7 0.02% 4-5 Months ≥120 and <150 Days 0 0.00% 0 0.00% 2 0.01% 2 0.01% 4 0.01% 4 0.01% 5-6 Months ≥150 and <180 Days 0 0.00% 0 0.00% 1 0.01% 1 0.00% 5 0.01% 6 0.02% 6-7 Months ≥180 and <210 Days 0 0.00% 0 0.00% 0 0.00% 1 0.00% 1 0.00% 5 0.01% 7-8 Months ≥210 and <240 Days 0 0.00% 0 0.00% 0 0.00% 0 0.00% 3 0.01% 1 0.00% 8-9 Months ≥240 and <270 Days 0 0.00% 0 0.00% 0 0.00% 1 0.00% 0 0.00% 1 0.00% 9-10 Months ≥270 and <300 Days 0 0.00% 0 0.00% 0 0.00% 1 0.00% 4 0.01% 0 0.00% 10-11 Months ≥300 and <330 Days 0 0.00% 0 0.00% 0 0.00% 1 0.00% 1 0.00% 1 0.00% 11-12 Months ≥330 and <360 Days 0 0.00% 0 0.00% 0 0.00% 0 0.00% 7 0.02% 0 0.00% 12-13 Months ≥360 and <390 Days 0 0.00% 0 0.00% 0 0.00% 0 0.00% 0 0.00% 3 0.01% 13-14 Months ≥390 and <420 Days 0 0.00% 0 0.00% 0 0.00% 0 0.00% 0 0.00% 0 0.00% 14-15 Months ≥420 and <450 Days 0 0.00% 0 0.00% 0 0.00% 0 0.00% 0 0.00% 1 0.00% 15-16 Months ≥450 and <480 Days 0 0.00% 0 0.00% 1 0.01% 0 0.00% 0 0.00% 2 0.01% 16-17 Months ≥480 and <510 Days 0 0.00% 0 0.00% 0 0.00% 0 0.00% 0 0.00% 2 0.01% 17-18 Months ≥510 and <540 Days 0 0.00% 0 0.00% 0 0.00% 0 0.00% 0 0.00% 3 0.01% 18 Months and more ≥540 Days 0 0.00% 0 0.00% 0 0.00% 1 0.00% 1 0.00% 3 0.01% Total 3 100.00% 7,164 100.00% 18,247 100.00% 36,445 100.00% 37,397 100.00% 36,940 100.00%
Loss Information As at Date 31-Jan-11 31-Jan-12 31-Jan-13 31-Jan-14 31-Jan-15 31-Jan-16
# % # % # % # % # % # % Number of loans that have experienced a loss for the period / year ended 0 0.00% 0 0.00% 0 0.00% 0 0.00% 5 0.01% 14 0.04% Net loss amount for the period / year ended ($) 0 0.00% 0 0.00% 0 0.00% 0 0.00% 337,787 0.01% 609,590 0.01% Cumulative number of loans that have experienced a loss 0 0.00% 0 0.00% 0 0.00% 0 0.00% 5 0.01% 19 0.05% Cumulative net loss amount ($) 0 0.00% 0 0.00% 0 0.00% 0 0.00% 337,787 0.01% 947,378 0.01%
S-30

2012 Vintage
Pool Performance – 2012 Vintage Delinquency Status – Current Balance of Loans in Arrears ($) As at Date 31-Jan-12 31-Jan-13 31-Jan-14 31-Jan-15 31-Jan-16 Current Balance of Loans Outstanding No. Days Past Due $ % $ % $ % $ % $ % Current <30 Days 1,380,887 100.00% 2,061,580,772 99.94% 6,801,380,733 99.91% 6,515,688,820 99.82% 7,394,810,533 99.81% 1-2 Months ≥30 and <60 Days 0 0.00% 962,554 0.05% 4,423,338 0.06% 5,701,888 0.09% 7,905,472 0.11% 2-3 Months ≥60 and <90 Days 0 0.00% 258,914 0.01% 1,210,745 0.02% 3,781,041 0.06% 2,359,567 0.04% 3-4 Months ≥90 and <120 Days 0 0.00% 0 0.00% 626,568 0.01% 493,548 0.01% 971,177 0.01% 4-5 Months ≥120 and <150 Days 0 0.00% 0 0.00% 0 0.00% 1,269,406 0.02% 314,806 0.00% 5-6 Months ≥150 and <180 Days 0 0.00% 0 0.00% 252,619 0.00% 33,712 0.00% 1,373,299 0.02% 6-7 Months ≥180 and <210 Days 0 0.00% 0 0.00% 0 0.00% 143,739 0.00% 828,042 0.01% 7-8 Months ≥210 and <240 Days 0 0.00% 0 0.00% 0 0.00% 0 0.00% 0 0.00% 8-9 Months ≥240 and <270 Days 0 0.00% 0 0.00% 0 0.00% 0 0.00% 306,563 0.00% 9-10 Months ≥270 and <300 Days 0 0.00% 0 0.00% 0 0.00% 0 0.00% 0 0.00% 10-11 Months ≥300 and <330 Days 0 0.00% 0 0.00% 0 0.00% 147,411 0.00% 0 0.00% 11-12 Months ≥330 and <360 Days 0 0.00% 0 0.00% 0 0.00% 100,401 0.00% 0 0.00% 12-13 Months ≥360 and <390 Days 0 0.00% 0 0.00% 0 0.00% 0 0.00% 267,054 0.00% 13-14 Months ≥390 and <420 Days 0 0.00% 0 0.00% 0 0.00% 0 0.00% 0 0.00% 14-15 Months ≥420 and <450 Days 0 0.00% 0 0.00% 0 0.00% 0 0.00% 307,537 0.00% 15-16 Months ≥450 and <480 Days 0 0.00% 0 0.00% 0 0.00% 62,290 0.00% 53,217 0.00% 16-17 Months ≥480 and <510 Days 0 0.00% 0 0.00% 0 0.00% 0 0.00% 0 0.00% 17-18 Months ≥510 and <540 Days 0 0.00% 0 0.00% 0 0.00% 20,411 0.00% 96,060 0.00% 18 Months and more ≥540 Days 0 0.00% 0 0.00% 0 0.00% 0 0.00% 62,290 0.00% Total 1,380,887 100.00% 2,062,802,240 100.00% 6,807,894,003 100.00% 6,527,442,667 100.00% 7,409,655,617 100.00%
Delinquency Status - Number of Loans in Arrears As at Date 31-Jan-12 31-Jan-13 31-Jan-14 31-Jan-15 31-Jan-16 Total Number of Loans Outstanding No. Days Past Due # % # % # % # % # % Current <30 Days 14 100.00% 9,196 99.95% 35,261 99.92% 37,140 99.85% 44,071 99.83% 1-2 Months ≥30 and <60 Days 0 0.00% 4 0.04% 22 0.06% 28 0.08% 36 0.08% 2-3 Months ≥60 and <90 Days 0 0.00% 1 0.01% 4 0.01% 19 0.05% 11 0.02% 3-4 Months ≥90 and <120 Days 0 0.00% 0 0.00% 5 0.01% 3 0.01% 7 0.02% 4-5 Months ≥120 and <150 Days 0 0.00% 0 0.00% 0 0.00% 3 0.01% 4 0.01% 5-6 Months ≥150 and <180 Days 0 0.00% 0 0.00% 1 0.00% 1 0.00% 8 0.02% 6-7 Months ≥180 and <210 Days 0 0.00% 0 0.00% 0 0.00% 1 0.00% 5 0.01% 7-8 Months ≥210 and <240 Days 0 0.00% 0 0.00% 0 0.00% 0 0.00% 0 0.00% 8-9 Months ≥240 and <270 Days 0 0.00% 0 0.00% 0 0.00% 0 0.00% 2 0.00% 9-10 Months ≥270 and <300 Days 0 0.00% 0 0.00% 0 0.00% 0 0.00% 0 0.00% 10-11 Months ≥300 and <330 Days 0 0.00% 0 0.00% 0 0.00% 1 0.00% 0 0.00% 11-12 Months ≥330 and <360 Days 0 0.00% 0 0.00% 0 0.00% 1 0.00% 0 0.00% 12-13 Months ≥360 and <390 Days 0 0.00% 0 0.00% 0 0.00% 0 0.00% 3 0.01% 13-14 Months ≥390 and <420 Days 0 0.00% 0 0.00% 0 0.00% 0 0.00% 0 0.00% 14-15 Months ≥420 and <450 Days 0 0.00% 0 0.00% 0 0.00% 0 0.00% 1 0.00% 15-16 Months ≥450 and <480 Days 0 0.00% 0 0.00% 0 0.00% 1 0.00% 1 0.00% 16-17 Months ≥480 and <510 Days 0 0.00% 0 0.00% 0 0.00% 0 0.00% 0 0.00% 17-18 Months ≥510 and <540 Days 0 0.00% 0 0.00% 0 0.00% 1 0.00% 1 0.00% 18 Months and more ≥540 Days 0 0.00% 0 0.00% 0 0.00% 0 0.00% 1 0.00% Total 14 100.00% 9,201 100.00% 35,293 100.00% 37,199 100.00% 44,151 100.00%
Loss Information As at Date 31-Jan-12 31-Jan-13 31-Jan-14 31-Jan-15 31-Jan-16 # % # % # % # % # % Number of loans that have experienced a loss for the period / year ended 0 0.00% 0 0.00% 0 0.00% 1 0.00% 4 0.01% Net loss amount for the period / year ended ($) 0 0.00% 0 0.00% 0 0.00% 44,441 0.00% 74,737 0.00% Cumulative number of loans that have experienced a loss 0 0.00% 0 0.00% 0 0.00% 1 0.00% 5 0.01% Cumulative net loss amount ($) 0 0.00% 0 0.00% 0 0.00% 44,441 0.00% 119,178 0.00%
S-31

2013 Vintage
Pool Performance – 2013 Vintage Delinquency Status – Current Balance of Loans in Arrears ($) As at Date 31-Jan-13 31-Jan-14 31-Jan-15 31-Jan-16
Current Balance of Loans Outstanding No. Days Past Due $ % $ % $ % $ % Current <30 Days 1,327,506 100.00% 3,284,950,594 99.92% 4,833,129,091 99.94% 9,590,447,533 99.91% 1-2 Months ≥30 and <60 Days 0 0.00% 2,031,206 0.06% 1,302,644 0.03% 5,068,018 0.06% 2-3 Months ≥60 and <90 Days 0 0.00% 0 0.00% 809,945 0.02% 1,472,815 0.02% 3-4 Months ≥90 and <120 Days 0 0.00% 598,628 0.02% 0 0.00% 554,193 0.01% 4-5 Months ≥120 and <150 Days 0 0.00% 0 0.00% 64,583 0.00% 233,608 0.00% 5-6 Months ≥150 and <180 Days 0 0.00% 0 0.00% 0 0.00% 0 0.00% 6-7 Months ≥180 and <210 Days 0 0.00% 0 0.00% 126,315 0.00% 0 0.00% 7-8 Months ≥210 and <240 Days 0 0.00% 0 0.00% 0 0.00% 197,470 0.00% 8-9 Months ≥240 and <270 Days 0 0.00% 0 0.00% 0 0.00% 0 0.00% 9-10 Months ≥270 and <300 Days 0 0.00% 0 0.00% 527,542 0.01% 0 0.00% 10-11 Months ≥300 and <330 Days 0 0.00% 0 0.00% 0 0.00% 0 0.00% 11-12 Months ≥330 and <360 Days 0 0.00% 0 0.00% 0 0.00% 127,222 0.00% 12-13 Months ≥360 and <390 Days 0 0.00% 0 0.00% 16,688 0.00% 0 0.00% 13-14 Months ≥390 and <420 Days 0 0.00% 0 0.00% 0 0.00% 27,498 0.00% 14-15 Months ≥420 and <450 Days 0 0.00% 0 0.00% 0 0.00% 256,799 0.00% 15-16 Months ≥450 and <480 Days 0 0.00% 0 0.00% 0 0.00% 214,659 0.00% 16-17 Months ≥480 and <510 Days 0 0.00% 0 0.00% 0 0.00% 0 0.00% 17-18 Months ≥510 and <540 Days 0 0.00% 0 0.00% 0 0.00% 0 0.00% 18 Months and more ≥540 Days 0 0.00% 0 0.00% 0 0.00% 126,315 0.00% Total 1,327,506 100.00% 3,287,580,428 100.00% 4,835,976,808 100.00% 9,598,726,130 100.00%
Delinquency Status - Number of Loans in Arrears As at Date 31-Jan-13 31-Jan-14 31-Jan-15 31-Jan-16
Total Number of Loans Outstanding No. Days Past Due # % # % # % # % Current <30 Days 7 100.00% 18,174 99.94% 26,321 99.94% 54,744 99.91% 1-2 Months ≥30 and <60 Days 0 0.00% 10 0.05% 8 0.04% 25 0.05% 2-3 Months ≥60 and <90 Days 0 0.00% 0 0.00% 6 0.02% 8 0.02% 3-4 Months ≥90 and <120 Days 0 0.00% 2 0.01% 0 0.00% 4 0.01% 4-5 Months ≥120 and <150 Days 0 0.00% 0 0.00% 1 0.00% 2 0.00% 5-6 Months ≥150 and <180 Days 0 0.00% 0 0.00% 0 0.00% 0 0.00% 6-7 Months ≥180 and <210 Days 0 0.00% 0 0.00% 1 0.00% 0 0.00% 7-8 Months ≥210 and <240 Days 0 0.00% 0 0.00% 0 0.00% 3 0.01% 8-9 Months ≥240 and <270 Days 0 0.00% 0 0.00% 0 0.00% 0 0.00% 9-10 Months ≥270 and <300 Days 0 0.00% 0 0.00% 1 0.00% 0 0.00% 10-11 Months ≥300 and <330 Days 0 0.00% 0 0.00% 0 0.00% 0 0.00% 11-12 Months ≥330 and <360 Days 0 0.00% 0 0.00% 0 0.00% 2 0.00% 12-13 Months ≥360 and <390 Days 0 0.00% 0 0.00% 1 0.00% 0 0.00% 13-14 Months ≥390 and <420 Days 0 0.00% 0 0.00% 0 0.00% 1 0.00% 14-15 Months ≥420 and <450 Days 0 0.00% 0 0.00% 0 0.00% 1 0.00% 15-16 Months ≥450 and <480 Days 0 0.00% 0 0.00% 0 0.00% 2 0.00% 16-17 Months ≥480 and <510 Days 0 0.00% 0 0.00% 0 0.00% 0 0.00% 17-18 Months ≥510 and <540 Days 0 0.00% 0 0.00% 0 0.00% 0 0.00% 18 Months and more ≥540 Days 0 0.00% 0 0.00% 0 0.00% 1 0.00% Total 7 100.00% 18,186 100.00% 26,339 100.00% 54,793 100.00%
Loss Information As at Date 31-Jan-13 31-Jan-14 31-Jan-15 31-Jan-16 # % # % # % # % Number of loans that have experienced a loss for the period / year ended 0 0.00% 0 0.00% 1 0.00% 2 0.00% Net loss amount for the period / year ended ($) 0 0.00% 0 0.00% 43,916 0.00% 149,093 0.00% Cumulative number of loans that have experienced a loss 0 0.00% 0 0.00% 1 0.00% 3 0.01% Cumulative net loss amount ($) 0 0.00% 0 0.00% 43,916 0.00% 193,009 0.00%
S-32

2014 Vintage
Pool Performance – 2014 Vintage Delinquency Status – Current Balance of Loans in Arrears ($) As at Date 31-Jan-14 31-Jan-15 31-Jan-16 Current Balance of Loans Outstanding No. Days Past Due $ % $ % $ % Current <30 Days 1,742,044 100.00% 2,175,037,968 99.96% 11,726,079,487 99.93% 1-2 Months ≥30 and <60 Days 0 0.00% 842,467 0.04% 7,141,937 0.07% 2-3 Months ≥60 and <90 Days 0 0.00% 0 0.00% 401,759 0.00% 3-4 Months ≥90 and <120 Days 0 0.00% 0 0.00% 53,260 0.00% 4-5 Months ≥120 and <150 Days 0 0.00% 0 0.00% 300,745 0.00% 5-6 Months ≥150 and <180 Days 0 0.00% 0 0.00% 0 0.00% 6-7 Months ≥180 and <210 Days 0 0.00% 0 0.00% 532,743 0.00% 7-8 Months ≥210 and <240 Days 0 0.00% 0 0.00% 0 0.00% 8-9 Months ≥240 and <270 Days 0 0.00% 0 0.00% 0 0.00% 9-10 Months ≥270 and <300 Days 0 0.00% 0 0.00% 0 0.00% 10-11 Months ≥300 and <330 Days 0 0.00% 0 0.00% 0 0.00% 11-12 Months ≥330 and <360 Days 0 0.00% 0 0.00% 0 0.00% 12-13 Months ≥360 and <390 Days 0 0.00% 0 0.00% 0 0.00% 13-14 Months ≥390 and <420 Days 0 0.00% 0 0.00% 0 0.00% 14-15 Months ≥420 and <450 Days 0 0.00% 0 0.00% 0 0.00% 15-16 Months ≥450 and <480 Days 0 0.00% 0 0.00% 0 0.00% 16-17 Months ≥480 and <510 Days 0 0.00% 0 0.00% 0 0.00% 17-18 Months ≥510 and <540 Days 0 0.00% 0 0.00% 0 0.00% 18 Months and more ≥540 Days 0 0.00% 0 0.00% 0 0.00% Total 1,742,044 100.00% 2,175,880,435 100.00% 11,734,509,931 100.00%
Delinquency Status - Number of Loans in Arrears As at Date 31-Jan-14 31-Jan-15 31-Jan-16 Total Number of Loans Outstanding No. Days Past Due # % # % # % Current <30 Days 10 100.00% 10,004 99.98% 61,069 99.96% 1-2 Months ≥30 and <60 Days 0 0.00% 2 0.02% 22 0.04% 2-3 Months ≥60 and <90 Days 0 0.00% 0 0.00% 3 0.00% 3-4 Months ≥90 and <120 Days 0 0.00% 0 0.00% 1 0.00% 4-5 Months ≥120 and <150 Days 0 0.00% 0 0.00% 3 0.00% 5-6 Months ≥150 and <180 Days 0 0.00% 0 0.00% 0 0.00% 6-7 Months ≥180 and <210 Days 0 0.00% 0 0.00% 2 0.00% 7-8 Months ≥210 and <240 Days 0 0.00% 0 0.00% 0 0.00% 8-9 Months ≥240 and <270 Days 0 0.00% 0 0.00% 0 0.00% 9-10 Months ≥270 and <300 Days 0 0.00% 0 0.00% 0 0.00% 10-11 Months ≥300 and <330 Days 0 0.00% 0 0.00% 0 0.00% 11-12 Months ≥330 and <360 Days 0 0.00% 0 0.00% 0 0.00% 12-13 Months ≥360 and <390 Days 0 0.00% 0 0.00% 0 0.00% 13-14 Months ≥390 and <420 Days 0 0.00% 0 0.00% 0 0.00% 14-15 Months ≥420 and <450 Days 0 0.00% 0 0.00% 0 0.00% 15-16 Months ≥450 and <480 Days 0 0.00% 0 0.00% 0 0.00% 16-17 Months ≥480 and <510 Days 0 0.00% 0 0.00% 0 0.00% 17-18 Months ≥510 and <540 Days 0 0.00% 0 0.00% 0 0.00% 18 Months and more ≥540 Days 0 0.00% 0 0.00% 0 0.00% Total 10 100.00% 10,006 100.00% 61,100 100.00%
Loss Information As at Date 31-Jan-14 31-Jan-15 31-Jan-16 # % # % # % Number of loans that have experienced a loss for the period / year ended 0 0.00% 0 0.00% 0 0.00% Net loss amount for the period / year ended ($) 0 0.00% 0 0.00% 0 0.00% Cumulative number of loans that have experienced a loss 0 0.00% 0 0.00% 0 0.00% Cumulative net loss amount ($) 0 0.00% 0 0.00% 0 0.00%
S-33

2015 Vintage
Pool Performance – 2015 Vintage Delinquency Status – Current Balance of Loans in Arrears ($) As at Date 31-Jan-15 31-Jan-16 Current Balance of Loans Outstanding No. Days Past Due $ % $ % Current <30 Days 1,862,750 100.00% 2,913,362,938 99.97% 1-2 Months ≥30 and <60 Days 0 0.00% 473,751 0.02% 2-3 Months ≥60 and <90 Days 0 0.00% 0 0.00% 3-4 Months ≥90 and <120 Days 0 0.00% 266,402 0.01% 4-5 Months ≥120 and <150 Days 0 0.00% 0 0.00% 5-6 Months ≥150 and <180 Days 0 0.00% 119,198 0.00% 6-7 Months ≥180 and <210 Days 0 0.00% 0 0.00% 7-8 Months ≥210 and <240 Days 0 0.00% 0 0.00% 8-9 Months ≥240 and <270 Days 0 0.00% 0 0.00% 9-10 Months ≥270 and <300 Days 0 0.00% 0 0.00% 10-11 Months ≥300 and <330 Days 0 0.00% 0 0.00% 11-12 Months ≥330 and <360 Days 0 0.00% 0 0.00% 12-13 Months ≥360 and <390 Days 0 0.00% 0 0.00% 13-14 Months ≥390 and <420 Days 0 0.00% 0 0.00% 14-15 Months ≥420 and <450 Days 0 0.00% 0 0.00% 15-16 Months ≥450 and <480 Days 0 0.00% 0 0.00% 16-17 Months ≥480 and <510 Days 0 0.00% 0 0.00% 17-18 Months ≥510 and <540 Days 0 0.00% 0 0.00% 18 Months and more ≥540 Days 0 0.00% 0 0.00% Total 1,862,750 100.00% 2,914,222,289 100.00%
Delinquency Status - Number of Loans in Arrears As at Date 31-Jan-15 31-Jan-16 Total Number of Loans Outstanding No. Days Past Due # % # % Current <30 Days 11 100.00% 15,613 99.96% 1-2 Months ≥30 and <60 Days 0 0.00% 3 0.02% 2-3 Months ≥60 and <90 Days 0 0.00% 0 0.00% 3-4 Months ≥90 and <120 Days 0 0.00% 1 0.01% 4-5 Months ≥120 and <150 Days 0 0.00% 0 0.00% 5-6 Months ≥150 and <180 Days 0 0.00% 1 0.01% 6-7 Months ≥180 and <210 Days 0 0.00% 0 0.00% 7-8 Months ≥210 and <240 Days 0 0.00% 0 0.00% 8-9 Months ≥240 and <270 Days 0 0.00% 0 0.00% 9-10 Months ≥270 and <300 Days 0 0.00% 0 0.00% 10-11 Months ≥300 and <330 Days 0 0.00% 0 0.00% 11-12 Months ≥330 and <360 Days 0 0.00% 0 0.00% 12-13 Months ≥360 and <390 Days 0 0.00% 0 0.00% 13-14 Months ≥390 and <420 Days 0 0.00% 0 0.00% 14-15 Months ≥420 and <450 Days 0 0.00% 0 0.00% 15-16 Months ≥450 and <480 Days 0 0.00% 0 0.00% 16-17 Months ≥480 and <510 Days 0 0.00% 0 0.00% 17-18 Months ≥510 and <540 Days 0 0.00% 0 0.00% 18 Months and more ≥540 Days 0 0.00% 0 0.00% Total 11 100.00% 15,618 100.00%
Loss Information As at Date 31-Jan-15 31-Jan-16 # % # % Number of loans that have experienced a loss for the period / year ended 0 0.00% 0 0.00% Net loss amount for the period / year ended ($) 0 0.00% 0 0.00% Cumulative number of loans that have experienced a loss 0 0.00% 0 0.00% Cumulative net loss amount ($) 0 0.00% 0 0.00%
S-34

2016 Vintage
Pool Performance – 2016 Vintage Delinquency Status – Current Balance of Loans in Arrears ($) As at Date 31-Jan-16 Current Balance of Loans Outstanding No. Days Past Due $ % Current <30 Days 3,595,508 100.00% 1-2 Months ≥30 and <60 Days 0 0.00% 2-3 Months ≥60 and <90 Days 0 0.00% 3-4 Months ≥90 and <120 Days 0 0.00% 4-5 Months ≥120 and <150 Days 0 0.00% 5-6 Months ≥150 and <180 Days 0 0.00% 6-7 Months ≥180 and <210 Days 0 0.00% 7-8 Months ≥210 and <240 Days 0 0.00% 8-9 Months ≥240 and <270 Days 0 0.00% 9-10 Months ≥270 and <300 Days 0 0.00% 10-11 Months ≥300 and <330 Days 0 0.00% 11-12 Months ≥330 and <360 Days 0 0.00% 12-13 Months ≥360 and <390 Days 0 0.00% 13-14 Months ≥390 and <420 Days 0 0.00% 14-15 Months ≥420 and <450 Days 0 0.00% 15-16 Months ≥450 and <480 Days 0 0.00% 16-17 Months ≥480 and <510 Days 0 0.00% 17-18 Months ≥510 and <540 Days 0 0.00% 18 Months and more ≥540 Days 0 0.00% Total 3,595,508 100.00%
Delinquency Status - Number of Loans in Arrears As at Date 31-Jan-16 Total Number of Loans Outstanding No. Days Past Due # % Current <30 Days 17 100.00% 1-2 Months ≥30 and <60 Days 0 0.00% 2-3 Months ≥60 and <90 Days 0 0.00% 3-4 Months ≥90 and <120 Days 0 0.00% 4-5 Months ≥120 and <150 Days 0 0.00% 5-6 Months ≥150 and <180 Days 0 0.00% 6-7 Months ≥180 and <210 Days 0 0.00% 7-8 Months ≥210 and <240 Days 0 0.00% 8-9 Months ≥240 and <270 Days 0 0.00% 9-10 Months ≥270 and <300 Days 0 0.00% 10-11 Months ≥300 and <330 Days 0 0.00% 11-12 Months ≥330 and <360 Days 0 0.00% 12-13 Months ≥360 and <390 Days 0 0.00% 13-14 Months ≥390 and <420 Days 0 0.00% 14-15 Months ≥420 and <450 Days 0 0.00% 15-16 Months ≥450 and <480 Days 0 0.00% 16-17 Months ≥480 and <510 Days 0 0.00% 17-18 Months ≥510 and <540 Days 0 0.00% 18 Months and more ≥540 Days 0 0.00% Total 17 100.00%
Loss Information As at Date 31-Jan-16 # % Number of loans that have experienced a loss for the period / year ended 0 0.00% Net loss amount for the period / year ended ($) 0 0.00% Cumulative number of loans that have experienced a loss 0 0.00% Cumulative net loss amount ($) 0 0.00%
S-35

Table of Contents
Prospectus Supplement SUMMARY S-2 DESCRIPTION OF THE COVERED BONDS S-6 TERMS INCORPORATED IN THE GLOBAL COVERED BOND S-7 DESCRIPTION OF THE COVERED BOND GUARANTEE S-7 CERTAIN INVESTMENT COMPANY ACT CONSIDERATIONS S-7 SWAP PROVIDERS S-7 SUPPLEMENTAL PLAN OF DISTRIBUTION S-8 NOTICE REGARDING OFFERS IN THE EEA S-12
Annex A COVERED BOND PORTFOLIO S-13 Overall Pool Statistics S-14 Overall Pool Performance S-20
Annex B HISTORICAL POOL DATA S-22
Prospectus dated June 25, 2015 DOCUMENTS INCORPORATED BY REFERENCE 3 WHERE YOU CAN FIND MORE INFORMATION 4 FURTHER INFORMATION 4 CAUTION REGARDING FORWARD-LOOKING STATEMENTS 4 ABOUT THIS PROSPECTUS 6 GLOBAL COVERED BOND PROGRAMME 7
Programme Structure Overview 7 SUMMARY 9 RISK FACTORS 17 ROYAL BANK OF CANADA 43 RBC COVERED BOND GUARANTOR LIMITED PARTNERSHIP 43
Ownership Structure of the Guarantor LP 44 Ownership Structure of the Managing GP 44 Ownership Structure of the Liquidation GP 44
PRESENTATION OF FINANCIAL INFORMATION 45 USE OF PROCEEDS 45 CONSOLIDATED RATIOS OF EARNINGS TO FIXED CHARGES 46 CONSOLIDATED CAPITALIZATION AND INDEBTEDNESS 47 DESCRIPTION OF THE COVERED BONDS 47
General 47 Loan-Level Disclosure 48 Asset Coverage Test, Valuation Calculation and Amortization Test 48 Terms and Conditions 49
TERMS AND CONDITIONS OF THE COVERED BONDS 51 DESCRIPTION OF THE CANADIAN REGULATED COVERED BOND REGIME 86 OWNERSHIP AND BOOK-ENTRY ISSUANCE 88 CASHFLOWS 92 COVERED BOND PORTFOLIO 102 LOAN ORIGINATION AND LENDING CRITERIA 103 THE SERVICER 106 SUMMARY OF PRINCIPAL DOCUMENTS 111 TAX CONSEQUENCES 158
United States Taxation 158 Canadian Taxation 165
BENEFIT PLAN INVESTOR CONSIDERATIONS 167 PLAN OF DISTRIBUTION 169
Market-Making Resales By Affiliates 170 Conflicts of Interest 171
LIMITATIONS ON ENFORCEMENT OF U.S. LAWS AGAINST THE BANK, OUR MANAGEMENT AND OTHERS 172
LEGALITY OF COVERED BONDS 172 EXPERTS 173 OTHER EXPENSES OF ISSUANCE AND DISTRIBUTION 173 GLOSSARY 174
S-36
U.S.$1,750,000,000 2.300% Covered
Bonds Due 2021 unconditionally and
irrevocably guaranteed as to payments by
RBC Covered Bond Guarantor Limited
Partnership
Royal Bank of Canada
Covered Bonds
March 14, 2016
PROSPECTUS SUPPLEMENT
Programme Arranger
RBC Capital Markets
Joint Book-Running Managers
RBC Capital Markets Goldman, Sachs & Co. HSBC TD Securities Co-Managers
ANZ Securities BB&T Capital Markets DBS Bank Ltd. Desjardins Securities Fifth Third Securities ING Lloyds Securities nabSecurities, LLC National Bank of Canada Financial Markets Natixis Santander Standard Chartered Bank SunTrust Robinson Humphrey US Bancorp