Roy Endré Dahl Dynamic price relationship in crude oil markets · · 2017-09-27This paper...
13
Roy Endré Dahl Dynamic price relationship in crude oil markets Roy Endré Dahl, University of Stavanger, 4036 Stavanger, Norway e-mail: [email protected] Crude oil is a diverse commodity and supply varies in quality and location with Dubai, WTI and Brent providing benchmarks for crude oil prices. This paper studies the price relationship between crude oil benchmarks and a set of regional crude oil including Asian, Arab, African, North Sea and US oil producing regions. Using a rolling window analysis, the results suggest time-varying influence from the benchmarks on global oil price. Still, Brent crude oil has most influence on the global oil price while Dubai crude oil has the least impact. For regional crude oils, in particular the African and European crude oils show a relatively high cointegration with Brent, while African, Arab and US oil is less cointegrated with their closest (geographically) benchmark.
Transcript of Roy Endré Dahl Dynamic price relationship in crude oil markets · · 2017-09-27This paper...

Roy Endré Dahl Dynamic price relationship in crude oil markets
Roy Endré Dahl, University of Stavanger,
4036 Stavanger, Norway e-mail: [email protected]
Crude oil is a diverse commodity and supply varies in quality and location with Dubai, WTI and Brent
providing benchmarks for crude oil prices. This paper studies the price relationship between crude oil
benchmarks and a set of regional crude oil including Asian, Arab, African, North Sea and US oil
producing regions. Using a rolling window analysis, the results suggest time-varying influence from the
benchmarks on global oil price. Still, Brent crude oil has most influence on the global oil price while
Dubai crude oil has the least impact. For regional crude oils, in particular the African and European
crude oils show a relatively high cointegration with Brent, while African, Arab and US oil is less
cointegrated with their closest (geographically) benchmark.
1. Introduction Although often considered one commodity, the crude oil market offers a wide variety in quality and
location. The three major benchmarks, Brent, WTI and Dubai oil, provide standards for different sets
of crude oils due to their quality variation. Density and sulfur defines the most important
characteristics for refiners and controlling for transportation cost, crude oil prices should be equal. In
particular, Brent and WTI are considered sweet due to their low sulfur content, while Dubai oil has a
higher sulfur content and is sour. For refineries, sweet oil has a higher value compared to sour oil.
Moreover, Brent and WTI have a higher crude oil density compared to Dubai oil, increasing the price
difference further.
Due to the high volatility in crude oil prices (Pindyck, 2004) and its impact on global economic activity,
the benchmarks are often quoted and studied together with other financial derivatives, like
commodity and stock prices. Its influence is debated, from Hamilton (1983) finding relationship
between crude oil price and recessions in US economy to Pinno and Serletis (2013) explaining the
industrial production using oil prices and oil price uncertainty. Hamilton (2009), Kilian (2009), Kilian
(2014) and Baumeister and Kilian (2016) all try to explain shocks in the crude oil market, highlighting
the considerable uncertainty.
With a high level of daily volumes and transactions, together with standardized quality specifications,
the futures markets for crude oil fulfill the requirements of a well-functioning futures markets as
proposed by Brorsen and Fofana (2001), and the futures markets are utilized by both the industry and
speculators. Brent, WTI and Dubai oil have different characteristics, providing benchmarks for different
sets of crude oils. In particular, Brent and WTI are considered sweet due to their low sulfur content,
while Dubai oil has a higher sulfur content and is sour. For refinery, sweet oil has a higher value
compared to sour oil. Moreover, Brent and WTI have a higher crude oil density compared to Dubai oil,
increasing the price difference further. These characteristics together with regional differences, helps
putting the price on a diverse commodity.
In this paper, we test integration between a set of crude oil prices. We perform the test in two parts.
First, we consider integration between the three majors: Brent, WTI and Dubai oil. Second, we do tests
for the minor crude oils against the majors, and show both individual and aggregated results to assess
the relationship between minor and major crude oils. The paper contributes with time-varying analysis
on crude oil markets and the results indicate a time-varying relationship between the three major
benchmarks, in addition to variations for the minor crude oils. This is important to the industry and
speculators utilizing the crude oil futures markets, which depends on reliable and stable relationship
between prices and standards.

The paper is organized as follows. Part 2 introduces the data for the benchmarks and regional crude
oil prices. In addition, the method used to estimate the price relationship between crude oil markets
is presented. Part 3 provides the empirical analysis and results, and finally, the conclusions is provided
in part 4.
2. Data and methodology
The data considered is daily prices for a set of 18 crude oil prices from May 1996 until March 2017,
providing 4 820 observations per price series. The series include the three major benchmarks (Dubai,
Brent and WTI) and 15 other prices covering Asian (Tapis, Minas, Duri and Australia), Arab (Murban
and Oman), African (Forcados, Bonny), European (Urals), North Sea (Oseberg, Ekofisk and Statfjord)
and American (Louisiana, West Texas and Alaskan) oil producing regions.
Table 1 provides a summary of the crude oil prices in our sample and their geographical location and
quality in terms of API gravity and sulfur content. A high quality crude oil experience a high API gravity
(a Light crude oil), and a low sulfur content (a Sweet crude oil), as this ensures easier refining of the
crude oil into high quality products. Consequently, there is a price premium for light and sweet crude
oils, compared to heavy and sour crude oils. In addition, geographical location and availability matters
for refineries when purchasing crude oil. Generally, quality variations explains differences in price
levels. E.g. Tapis crude oil is a higher quality compared to Duri crude oil.
Table 2 reviews the descriptive statistics for the price series, and at first glance, the statistics indicates
a relatively homogenous commodity, with price levels and price ranges close to equal for all series.
The table also include correlation between regional markets and their regional benchmark, and for all
cases, they are close to perfectly correlated. These observations indicate efficient markets. In Table 3,
the log-returns of the price series are reported. As expected, all crude oils experience extreme log-
returns, typically ranging between +/-20%. However, both average and median daily return are close
to zero. The descriptive statistics also indicate considerable volatility, with relatively high standard
deviations. Finally, while the price levels are highly correlated, daily returns have lower correlation,
indicating a delay in price transmission between regional markets and the benchmarks. In particular,
the Dubai benchmark and the Asian regional crude oils experience the lowest correlations (around
0.25), while Brent and the European and African regional crude oils have a relatively high correlation
(0.70). The US market is an exception, as regional log-returns are highly correlated with the WTI
benchmark. This may be a result of efficient infrastructure removing arbitrage-opportunities, and also
may be partially due to the crude oil export ban that, with a few exceptions, prohibited exports of US
crude oil between 1977 and 2015.

Note the extreme log-returns of North Western Australian crude oil, occurring between September
2008 and January 2009. During this period, a major processing facility in this region experienced an
explosion, causing a gas crisis, which may have led to the extreme price movements for crude oil.
Table 2 and Table 3 also report the Augmented Dickey Fuller (ADF) unit root test for the price and log-
return series. We find unit root in price levels, but reject it for the log-returns, thus indicating that all
time series are I(1), i.e. stationary in first differences.
Table 1: Field location, API Gravity and sulfur content for benchmark and regional crude oils sorted by its closest (geographically) benchmark.
Field location API gravity Sulfur content
Brent UK 38.3° 0.37%
Ekofisk Norway 37.5° 0.23%
Oseberg Norway 37.8° 0.27%
Statfjord Norway 39.1° 0.22%
Urals Russia 31.7° 1.35%
Bonny Nigeria 33.4° 0.16%
Forcados Nigeria 30.8° 0.16%
Dubai UAE 31.0° 2.00%
Murban UAE 40.2° 0.79%
Tapis Malaysia 45.2° 0.03%
Minas Indonesia 35.3° 0.09%
Duri Indonesia 20.8° 0.20%
Oman Oman 34.0° 2.00%
North West Australian Australia 61.2° 0.01%
WTI US 39.6° 0.24%
Louisiana Light Sweet US 35.6° 0.37%
West Texas Sour US 31.7° 1.28%
Alaskan US 31.9° 0.93%

Table 2: Descriptive statistics of price data. Regional crude oils per closest (geographically) benchmark, and correlation estimated to closest benchmark. The ADF test is the Augmented Dickey Fuller test for a null of unit root. * indicates rejection at 1% critical value.
Min Mean Median Max Std.dev Correlation* ADF
Brent 9.71 55.91 49.41 146.26 34.05 N/A -1.75
Ekofisk 9.19 55.97 48.75 146.30 34.62 0.999 -1.69
Oseberg 9.35 56.24 49.25 147.43 34.69 0.999 -1.70
Statfjord 9.25 56.47 49.65 148.70 34.85 0.999 -1.72
Urals 8.48 53.74 46.33 139.88 33.97 0.999 -1.63
Bonny 9.10 56.60 49.62 148.60 34.98 0.998 -1.73
Forcados 9.13 56.68 49.24 148.60 35.36 0.998 -1.68
Dubai 9.39 53.06 45.65 140.56 33.27 N/A -1.69
Murban 10.10 55.65 49.09 146.54 34.25 0.999 -1.69
Tapis 10.53 58.80 51.01 152.38 36.07 0.997 -1.67
Minas 9.55 56.76 51.69 152.83 35.71 0.995 -1.82
Duri 8.55 52.77 45.05 135.03 34.00 0.989 -2.11
Oman 9.28 53.61 46.67 139.89 33.48 0.999 -1.76
North West Australian 10.53 55.49 48.76 140.16 33.66 0.989 -2.36
WTI 10.82 53.95 48.51 145.31 30.15 N/A -1.93
Louisiana Light Sweet 10.64 57.07 50.15 149.42 33.81 0.998 -1.69
West Texas Sour 9.31 51.19 46.46 142.64 29.32 0.987 -2.15
Alaskan 8.72 55.00 47.56 144.72 33.98 0.998 -1.78

Table 3: Descriptive statistics of first difference log-level data. Regional crude oils per closest (geographically) benchmark, and correlation estimated to closest benchmark. The ADF test is the Augmented Dickey Fuller test for a null of unit root. * indicates rejection at 1% critical value.
Min (%) Mean (%) Median (%) Max (%) Std.dev (%) Correlation* ADF
Brent -14.93 0.02 0.00 15.10 2.45 N/A -15.39*
Ekofisk -20.11 0.02 0.05 18.01 2.44 0.634 -16.35*
Oseberg -20.20 0.02 0.04 17.88 2.41 0.638 -16.37*
Statfjord -20.07 0.02 0.04 17.81 2.42 0.634 -16.37*
Urals -20.62 0.02 0.07 18.63 2.58 0.733 -16.61*
Bonny -19.75 0.02 0.04 17.29 2.38 0.746 -15.96*
Forcados -19.83 0.02 0.04 16.98 2.38 0.746 -15.94*
Dubai -16.60 0.02 0.04 18.28 2.52 N/A -15.27*
Murban -16.29 0.02 0.00 14.29 2.38 0.303 -15.16*
Tapis -14.07 0.02 0.00 14.14 2.17 0.244 -15.26*
Minas -39.47 0.02 0.00 38.02 2.49 0.188 -16.22*
Duri -35.36 0.02 0.00 34.09 2.81 0.184 -16.25*
Oman -19.53 0.02 0.01 15.05 2.53 0.297 -15.15*
North West Australian -34.13 0.02 0.00 78.49 3.00 0.219 -15.62*
WTI -21.59 0.02 0.06 19.14 2.61 N/A -16.50*
Louisiana Light Sweet -18.94 0.02 0.06 14.86 2.55 0.921 -16.00*
West Texas Sour -15.91 0.02 0.03 17.70 2.86 0.908 -16.67*
Alaskan -21.39 0.02 0.07 20.86 2.75 0.917 -15.82*

Figure 1 provides a visual inspection of the co-integration between the three benchmarks. From the
figure, it is difficult to differentiate the prices, and moreover, it is difficult to assess if and how the
benchmarks affect the global oil price.
Figure 1 – Crude oil prices for the three benchmarks (Dubai, Brent, WTI) considered from January
1996 to March 2017.
Since all time series are stationary in first differences, we can apply a vector error correction model
(VECM) to test the long-run and short-run relationship between the series. In particular, we assess to
what degree the three major benchmarks are linked, and further, how the minor crude oil prices are
reflected by the majors. We use a VECM of order p to identify long-run and short-run relations:
∆𝑋𝑋𝑡𝑡 = ΠX𝑡𝑡−1 + �Γ𝑖𝑖∆𝑋𝑋𝑡𝑡−1
𝑝𝑝−1
𝑖𝑖=1
+ 𝜀𝜀𝑡𝑡
With cointegration, we can define Π as Π = αβ′ where β is an n x r cointegration coefficients matrix
and α is an n x r matrix of speed adjustments matrix. We estimate α over time, creating α(𝑡𝑡) by rolling
the cointegration analysis with a time incremented observation window of 250 observations. This
allows us to identify time-variations in the co-integration between markets.
3. Empirical results
We start by testing the co-integration between markets and their relative influence on one another.
In order to run the VECM-model we apply a Johansen test to confirm that the number of co-integrating
vectors are less than the number of price series. Table 4 provides the result of the Johansen test, and
we find two linearly independent cointegrating vectors. Figure 2 presents the rolling alpha for Dubai,
0
20
40
60
80
100
120
140
160
USD
/ bb
l
Dubai Brent WTI

Brent and WTI for the period considered. A positive number indicates influence on the other markets.
The results indicate that Brent crude oil has the highest influence on the global crude oil market. WTIs
influence resembles Brent, although at lower levels throughout the sample period. For Dubai oil, its
influence was particularly low between 1999 and 2005, and since 2010. Notice that Dubai oil, for the
sample period considered, has experienced negative influence.
Table 4: Johansen test for co-integration between the three benchmark crude oils. *number of co-integrating vectors under null hypothesis.
Critical values
r* Test statistic 10% 5% 1%
0 121.82 28.71 31.52 37.22
1 24.82 15.66 17.95 23.52
2 2.15 6.50 8.18 11.65
Figure 2 – Rolling speed of adjustment (α(t)) for Dubai, Brent and WTI crude oil 1997 – 2017.
We continue by evaluating the regional markets’ dependence on its closest crude oil benchmark. Every
regional crude oil is considered together with the three benchmarks, making a co-integrated model
with four price series. According to the Johansen trace test, we find three linearly independent co-
integrating vectors for all models tested. Table 5 presents the Johansen test for Ekofisk, which is
representable for all regional crudes.
-0,3
-0,2
-0,1
0
0,1
0,2
0,3
1998 2000 2002 2004 2006 2008 2010 2012 2014 2016
Dubai Brent WTI

Table 5: Johansen test for co-integration between Ekofisk crude oil and the three benchmark crude oils. *number of co-integrating vectors under null hypothesis.
Critical values
r* Test statistic 10% 5% 1%
0 490.43 45.23 48.28 55.43
1 115.71 28.71 31.52 37.22
2 24.86 15.66 17.95 23.52
3 2.17 6.50 8.18 11.65
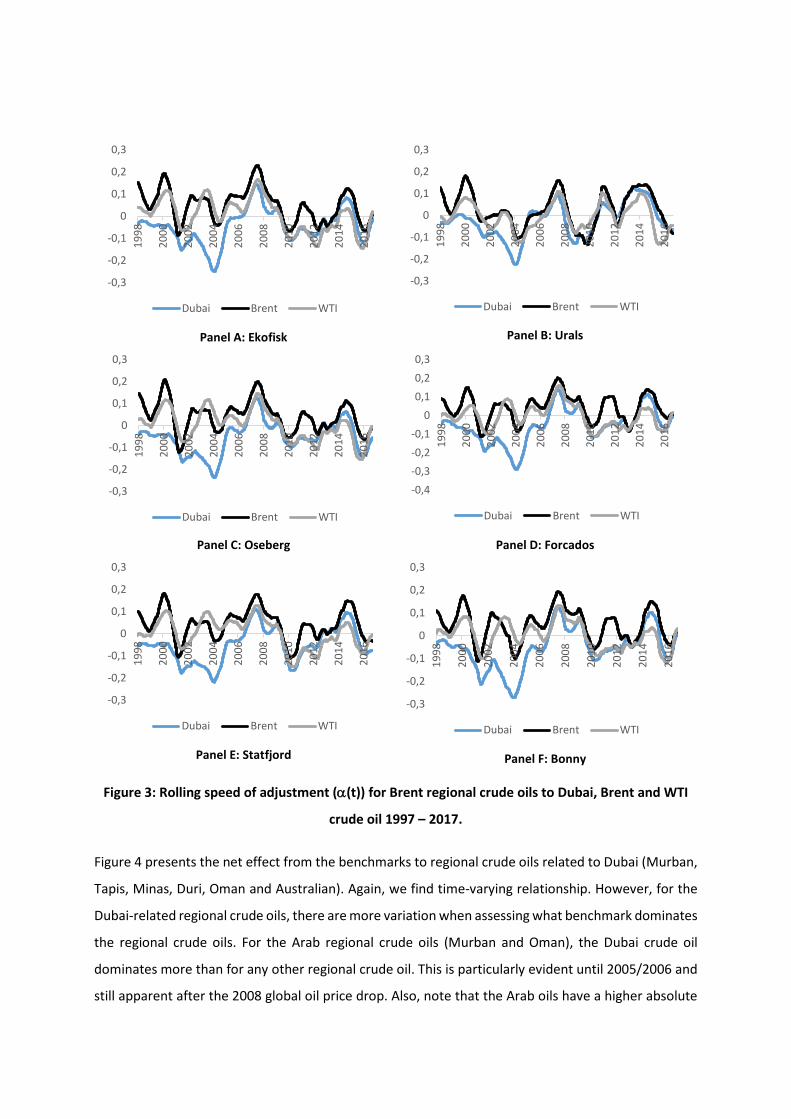
Figure 3 presents the net effect from the three benchmarks to regional crude oil related to Brent
(Ekofisk, Statfjord, Oseberg, Urals, Bonny and Forcados). From the figure, it is evident that the
relationship is time-variant, i.e. the influence from the different benchmark crude oils on regional
crude oils varies over time. However, we also see that, for the majority of the time, crude oil related
to Brent is more influenced by its regional benchmark Brent than Dubai and WTI. This is intuitive, as
the crudes are closer in both quality and location. Finally, Dubai crude oil seems least co-integrated
with the regional crude oils, although since 2005, Dubai, WTI and Brent have had similar influence on
the regional benchmark, supporting the results in Figure 2.
Panel A: Ekofisk
Panel B: Urals
Panel C: Oseberg
Panel D: Forcados
Panel E: Statfjord
Panel F: Bonny
Figure 3: Rolling speed of adjustment (α(t)) for Brent regional crude oils to Dubai, Brent and WTI
crude oil 1997 – 2017.
Figure 4 presents the net effect from the benchmarks to regional crude oils related to Dubai (Murban,
Tapis, Minas, Duri, Oman and Australian). Again, we find time-varying relationship. However, for the
Dubai-related regional crude oils, there are more variation when assessing what benchmark dominates
the regional crude oils. For the Arab regional crude oils (Murban and Oman), the Dubai crude oil
dominates more than for any other regional crude oil. This is particularly evident until 2005/2006 and
still apparent after the 2008 global oil price drop. Also, note that the Arab oils have a higher absolute
-0,3
-0,2
-0,1
0
0,1
0,2
0,319
98
2000
2002
2004
2006
2008
2010
2012
2014
2016
Dubai Brent WTI
-0,3
-0,2
-0,1
0
0,1
0,2
0,3
1998
2000
2002
2004
2006
2008
2010
2012
2014
2016
Dubai Brent WTI
-0,3
-0,2
-0,1
0
0,1
0,2
0,3
1998
2000
2002
2004
2006
2008
2010
2012
2014
2016
Dubai Brent WTI
-0,4-0,3-0,2-0,1
00,10,20,3
1998
2000
2002
2004
2006
2008
2010
2012
2014
2016
Dubai Brent WTI
-0,3
-0,2
-0,1
0
0,1
0,2
0,3
1998
2000
2002
2004
2006
2008
2010
2012
2014
2016
Dubai Brent WTI
-0,3
-0,2
-0,1
0
0,1
0,2
0,3
1998
2000
2002
2004
2006
2008
2010
2012
2014
2016
Dubai Brent WTI

alpha, i.e. the Arab oils adjust more to shocks in the benchmark oil prices. For the Indonesian,
Malaysian and Australian crude oils (Tapis, Minas, Duri and Northwest Australia), the adjustment to
shocks are at its lowest compared to all other regional crude oils, and it is difficult to differentiate what
benchmark dominates.
Panel A: Murban
Panel B: Tapis
Panel C: Minas
Panel D: Duri
Panel E: Oman
Panel F: Australia
Figure 4: Rolling speed of adjustment (α(t)) for Dubai regional crude oils to Dubai, Brent and WTI
crude oil 1997 – 2017.
Finally, Figure 5 shows the US regional crude oils related to the three benchmark (Louisiana Light
Sweet, West Texas Sour and Alaskan). Louisiana Light Sweet crude oil was dominated by WTI and Brent
until 2006, and since all three benchmarks have had similar influence. This is true for both West Texas
-0,4
-0,2
0
0,2
0,4
1998
2000
2002
2004
2006
2008
2010
2012
2014
2016
Dubai Brent WTI
-0,2
-0,1
0
0,1
0,2
1998
2000
2002
2004
2006
2008
2010
2012
2014
2016
Dubai Brent WTI
-0,2
-0,1
0
0,1
0,2
1998
2000
2002
2004
2006
2008
2010
2012
2014
2016
Dubai Brent WTI
-0,2
-0,1
0
0,1
0,219
98
2000
2002
2004
2006
2008
2010
2012
2014
2016
Dubai Brent WTI
-0,4
-0,2
0
0,2
0,4
1998
2000
2002
2004
2006
2008
2010
2012
2014
2016
Dubai Brent WTI
-0,2
-0,1
0
0,1
0,2
1998
2000
2002
2004
2006
2008
2010
2012
2014
2016
Dubai Brent WTI

Sour and Alaskan oil for the entire sample period, with only minor exceptions. Consequently, it seems
US regional crude oils are influenced by the global oil price, more than the WTI crude oil benchmark.
Panel A: Louisiana Light Sweet
Panel B: West Texas Sour
Panel A: Alaskan
Figure 5: Rolling speed of adjustment (α(t)) for US regional crude oils to Dubai, Brent and WTI
crude oil 1997 – 2017.
4. Conclusion In this paper, we investigate price relationship between three crude oil benchmarks (Brent, Dubai and
WTI) and a set of 15 regional crude oils covering a wide range of oil field locations and crude oil quality.
First, we show that Brent is the dominating crude oil among the benchmark throughout the sample
period considered (1997 – 2017). In particular, during 2000 – 2005 and since 2007, Brent has shown I
high level of influence on the other benchmarks. However, since 2015, its influence is lower and other
both Dubai and WTI has increased their relative importance on global oil prices. In addition, we find
that Dubai oil had relatively low impact on the global crude oil price in the beginning of the 2000s and
at the start of the decade in 2010, but are now gaining influence. WTI seems to follow Brent, although
at lower levels.
-0,4
-0,2
0
0,2
0,4
1998
2000
2002
2004
2006
2008
2010
2012
2014
2016
Dubai Brent WTI
-0,4
-0,2
0
0,2
0,4
1998
2000
2002
2004
2006
2008
2010
2012
2014
2016
Dubai Brent WTI
-0,4
-0,2
0
0,2
0,4
1998
2000
2002
2004
2006
2008
2010
2012
2014
2016
Dubai Brent WTI

Regional crude oils show similar results over time, with Brent the most important influence. This is
particularly true for the European and African crude oils. In addition, Arab oils are highly influenced by
Dubai benchmark, as expected. For other regional crude oils, we find less differences between the
three benchmarks as no benchmark dominates its influence.
In sum, the study shows time-varying relationship in the co-integration between crude oil benchmarks
and regional crude oils. The results indicate that Brent is the most important benchmark, although less
important the last years.
References Baumeister, C., & Kilian, L. (2016). Understanding the Decline in the Price of Oil since June 2014. Journal
of the Association of Environmental and Resource Economists, 3(1), 131-158.
Hamilton, J.D. (2009). Understanding crude oil prices. The Energy Journal, 30, 179-206.
Hamilton, J. D. (1983). Oil and the macroeconomy since World War II. Journal of political
economy, 91(2), 228-248.
Kilian, L. (2009). Not all oil price shocks are alike: Disentangling demand and supply shocks in the crude
oil market. American Economic Review, 99(3), 1053–1069.
Kilian, L. (2014), “Oil Price Shocks: Causes and Consequences,” Annual Review of Resource Economics,
6, 133-154.
Pindyck, R. S. (2004). Volatility in natural gas and oil markets. The Journal of Energy and Development,
30 (1).
Pinno, K. and A. Serletis. (2013). "Oil price uncertainty and industrial production." The Energy Journal
34(3): 191-210