
Routine Renal Scintigraphy with Sequential Injections of...
6
Routine Renal Scintigraphy with Sequential Injections of Technetium·99m·DTPA and Technetlum·99m·MAG3 Susan Carpenter and Vicente J. Carlde Nuclear Medicine Section, Department of Radiology, The Hospital of Saint Raphael, New Haven, Connecticut Objective: To evaluate the use of sequential injections of 99 "'Tc-diethylene-triaminepentaacetic acid (DTPA) and 99 "'Tc-mercaptoacetyltriglycine (MAG3) for routine renal scintigraphy. Method: Seventy-two sequential renograms were performed on 49 patients. After administration of 1 mCi of 99 "'Tc-DTPA, data were collected for 7 min and 10 mCi of 99 "'Tc-MAG3 were then injected. In 28 patients, furosemide was injected before 99 mTc-MAG3. The time to reach peak activity, frac- tional renal function and retained cortical activity were calcu- lated from the renogram curves. The total duration of the study was 30 min. The studies were analyzed by two inde- pendent observers. The GFR and ERPF were calculated using the RUPV method. Results: There were six discrepant results for time to peak activity determination due to improper selection of the initial time (time = 0) or the peak activity. The discrepancies were corrected by setting the time = 0 to the first appearance of activity in the abdominal aorta above the kidneys and by selecting the last point in flat renogram curves or in curves with no distinguishable peak activity. The use of a diuretic prior to the administration of 99 mTc-MAG3 resulted in further improvement of the interobserver agreement. Conclusion: The sequential renogram is simple to perform, and provides excellent scintigraphic images and accurate functional evaluation of the kidneys using conventional gamma camera techniques. Key Words: renal scintigraphy; technetium-99m-DTPA; technetium-99m-MAG3 J Nucl Med Techno/ 1994; 22:213-217 At our institution renal scintigraphy has been performed with simultaneous injections of 99 mTc-diethylene-triaminepen- taacetic acid (DTPA) and 131 1-hippuran e 31 I-OIH) allowing a more complete evaluation of renal function and concurrent estimation of glomerular filtration rate (GFR) and effective renal plasma flow (ERPF). The introduction of 99 mTc-mercaptoacetyltriglycine (99mTc-MAG3), a technetium-labeled substitute for radiohip- For reprints contact: Susan Carpenter, BS, Nuclear Medicine Section, Hospital of Saint Raphael, 1450 Chapel St., New Haven, Cf 06511. VOLUME 22, NUMBER 4, DECEMBER 1994 puran offering superior quality images and lower radiation dose to the patient {1,2), led us to re-evaluate our procedures for renal scintigraphy. This paper discusses the use of the sequen- tial administrations of 99mTc-DTPA and 9 9mTc-MAG3 for rou- tine renography and for the calculation of GFR and ERPF. MATERIALS AND METHODS This evaluation included 72 studies performed in 49 pa- tients (31 females and 18 males; 31-81 yr in age) referred for the evaluation of hypertension. All patients were studied supine with the gamma camera positioned underneath the imaging table. Data were col- lected at a rate of 1 frame every 15 sec for the 30-min study, using a Picker SX300 gamma camera interfaced to a PCS-512 computer (Picker International, Highland Heights, OH). The patients were hydrated and instructed to void prior to the exam. Intravenous access was established in an antecu- bital or peripheral vein with tubing connected to a three-way stopcock. After positioning, the patients were injected with a 0.5-ml bolus of 1.0 mCi of 99 mTc-DTPA (MPI, DTPA Kit Chelate Multidose), followed by a 10-ml saline flush. This initial 99 mTc-DTPA phase lasted 7 min and was followed by the administration of 10 mCi of 99 mTc-MAG3 (Mallinkrodt, 99mTc Mertiatide) in 44 studies. In the other 28 patients, 40 mg of furosemide was administered by slow injection at the end of the 99mTc-DTPA phase prior to the injection of the second radiotracer. If the position of the patient had to be changed, it was done prior to the 99 mTc-MAG3 injection. All these steps were performed without interrupting the com- puter collection. During the procedure, in addition to the computer acqui- sition, two 3-min camera images were obtained of the 99 mTc- DTPA phase. A dynamic study was imaged at one frame every 5 sec for 90 sec while injecting 9 9mTc-MAG3 and was followed by five static images at 5-min intervals. Two hours later, the kidneys were re-scanned for residual activity and the information stored in the computer. Data Analysis For quantitation purposes, the camera sensitivity was de- termined using 1 mCi of 99 mTc-DTPA in a 10-ml saline- loaded syringe placed on the imaging table maintaining the 213 by on April 10, 2020. For personal use only. tech.snmjournals.org Downloaded from
Transcript of Routine Renal Scintigraphy with Sequential Injections of...
Routine Renal Scintigraphy with Sequential Injections of Technetium·99m·DTPA and Technetlum·99m·MAG3
Susan Carpenter and Vicente J. Carl de
Nuclear Medicine Section, Department of Radiology, The Hospital of Saint Raphael, New Haven, Connecticut
Objective: To evaluate the use of sequential injections of 99"'Tc-diethylene-triaminepentaacetic acid (DTPA) and 99"'Tc-mercaptoacetyltriglycine (MAG3) for routine renal scintigraphy. Method: Seventy-two sequential renograms were performed on 49 patients. After administration of 1 mCi of 99"'Tc-DTPA, data were collected for 7 min and 10 mCi of 99"'Tc-MAG3 were then injected. In 28 patients, furosemide was injected before 99mTc-MAG3. The time to reach peak activity, fractional renal function and retained cortical activity were calculated from the renogram curves. The total duration of the study was 30 min. The studies were analyzed by two independent observers. The GFR and ERPF were calculated using the RUPV method. Results: There were six discrepant results for time to peak activity determination due to improper selection of the initial time (time = 0) or the peak activity. The discrepancies were corrected by setting the time = 0 to the first appearance of activity in the abdominal aorta above the kidneys and by selecting the last point in flat renogram curves or in curves with no distinguishable peak activity. The use of a diuretic prior to the administration of 99mTc-MAG3 resulted in further improvement of the interobserver agreement. Conclusion: The sequential renogram is simple to perform, and provides excellent scintigraphic images and accurate functional evaluation of the kidneys using conventional gamma camera techniques. Key Words: renal scintigraphy; technetium-99m-DTPA; technetium-99m-MAG3
J Nucl Med Techno/ 1994; 22:213-217
At our institution renal scintigraphy has been performed with simultaneous injections of 99mTc-diethylene-triaminepentaacetic acid (DTPA) and 1311-hippuran e31I-OIH) allowing a more complete evaluation of renal function and concurrent estimation of glomerular filtration rate (GFR) and effective renal plasma flow (ERPF).
The introduction of 99mTc-mercaptoacetyltriglycine (99mTc-MAG3), a technetium-labeled substitute for radiohip-
For reprints contact: Susan Carpenter, BS, Nuclear Medicine Section, Hospital of Saint Raphael, 1450 Chapel St., New Haven, Cf 06511.
VOLUME 22, NUMBER 4, DECEMBER 1994
puran offering superior quality images and lower radiation dose to the patient {1,2), led us to re-evaluate our procedures for renal scintigraphy. This paper discusses the use of the sequential administrations of 99mTc-DTPA and 99mTc-MAG3 for routine renography and for the calculation of GFR and ERPF.
MATERIALS AND METHODS
This evaluation included 72 studies performed in 49 patients (31 females and 18 males; 31-81 yr in age) referred for the evaluation of hypertension.
All patients were studied supine with the gamma camera positioned underneath the imaging table. Data were collected at a rate of 1 frame every 15 sec for the 30-min study, using a Picker SX300 gamma camera interfaced to a PCS-512 computer (Picker International, Highland Heights, OH).
The patients were hydrated and instructed to void prior to the exam. Intravenous access was established in an antecubital or peripheral vein with tubing connected to a three-way stopcock.
After positioning, the patients were injected with a 0.5-ml bolus of 1.0 mCi of 99mTc-DTPA (MPI, DTPA Kit Chelate Multidose), followed by a 10-ml saline flush. This initial 99mTc-DTPA phase lasted 7 min and was followed by the administration of 10 mCi of 99mTc-MAG3 (Mallinkrodt, 99mTc Mertiatide) in 44 studies. In the other 28 patients, 40 mg of furosemide was administered by slow injection at the end of the 99mTc-DTPA phase prior to the injection of the second radiotracer. If the position of the patient had to be changed, it was done prior to the 99mTc-MAG3 injection. All these steps were performed without interrupting the computer collection.
During the procedure, in addition to the computer acquisition, two 3-min camera images were obtained of the 99mTcDTPA phase. A dynamic study was imaged at one frame every 5 sec for 90 sec while injecting 99mTc-MAG3 and was followed by five static images at 5-min intervals. Two hours later, the kidneys were re-scanned for residual activity and the information stored in the computer.
Data Analysis For quantitation purposes, the camera sensitivity was de
termined using 1 mCi of 99mTc-DTPA in a 10-ml salineloaded syringe placed on the imaging table maintaining the
213
by on April 10, 2020. For personal use only. tech.snmjournals.org Downloaded from

FIGURE 1. Regions of interest are drawn around each kidney. A second ROI is drawn to include the kidney and background. The background contribution is calculated by subtracting the renal activity from the larger ROI and after normalization for renal size is sub-tracted from the renal ROI.
same geometry as the patient study. This information was
converted to counts per minute per microcurie. The total injected doses, in microcuries, for 99mTc-DTPA
and for 99mTc-MAG3 were calculated with a dose calibrator
by measuring the activity before injection and then subtract-ing the activity remaining in the syringe after injection.
A - 3 minute 99mTc-DTPA point 8 - Initial MAG3 point C - 1 minute 99mTc-MAG
3 point
B·D- Time to peak EID - Retained cortical activity
FIGURE 2. Time-activity curve obtained after the sequential injection of 99"'Tc-DTPA and 99"'Tc-MAG3. A point at 3 min after injection of 99"'Tc-DTPA (A) is selected for GFR calculation. The initial 99"'TcMAG3 point can be selected at the inflexion site (B) or over the abdominal aorta (see text).
214
These values are converted into total counts by multiplying
the microcuries injected times the camera sensitivity ex
pressed in counts per minute per microcurie.
The images were analyzed by drawing regions of interest
(ROis) over the left and right kidneys and concentric ROis
around both kidneys to correct for the contribution of back
ground activity (Fig. 1). Another ROI was placed over the
proximal abdominal aorta above the kidneys.
The background-corrected renogram showed an elevation
of 99mTc-DTPA radioactivity during the first 10 min followed
A 30 y 0.32955 + 0.93725x R = 0.82 n
N
~ 20 > ~ Ill .ll •• 0
c ! ~ 10 ., Gl Q.
0 1-
Gl E j::
0 0 1 0 20
Time To Peak (min) Observer
8 30 y = • 0.23007 + 0.965Six R = 0.92 n
N
~
~ 20 -----·- -·-·····- -·· . . .. - -·· ~ Ill
.1:1 0
c ! ~ 10 - ·-·-·-• Q.
0 1-
" E j::
0 1 0
Time To Peak (min)
• 2 0
Observer 1
88
30
56
3 0
FIGURE 3. (A) Plot of the time to peak (min) for individual kidneys (n = 88), calculated by two independent observers. Studies performed without the administration of furosemide. (B) Plot of the time to peak activity (min) for individual kidneys (n = 56), calculated by two independent observers. Studies performed with the administration of furosemide.
.JOURNAL OF NUCLEAR MEDICINE TECHNOLOGY
by on April 10, 2020. For personal use only. tech.snmjournals.org Downloaded from
by a sharp increase in activity corresponding to the 99mTcMAG3 renogram section (Fig. 2). A point at 3-min into the 99mTc-DTPA curve was selected to calculate the GFR.
The time-activity plot for the abdominal aorta was displayed to select the point just before the sharp increase in 99mTc-MAG3 activity at the beginning of the renogram, i.e., zero time. The 99mTc-MAG3 renogram was then displayed and the time to peak activity, relative uptake for each kidney and retained cortical activity at 20 min expressed as the fraction of the maximum renal activity were calculated by selecting the peak activity point, a point 1 min into the study and the last point on the curve, respectively. The clearance of MAG3 (ERPF) was calculated using the point at 1 min in the renogram curve. The fractional activity can also be derived from these points.
We used the rate of renal uptake-plasma volume method (RUPV) to calculate the GFR (3) and ERPF (4). Briefly, the rate of renal uptake (U) was calculated from the cumulative renal activity at 3 min for GFR and at 1 min for ERPF and from the net injected activity. The plasma volume (PV) was calculated from the following equation (5):
PV = 84.5W0·80635
where W is the patient's body weight in kilograms. The GFR (or ERPF) was then obtained from:
GFR(ERPF) = RU "' PV
where RU is the rate of renal uptake, U/t, and t is the time over which the observation is carried out.
The tenfold increase in activity between the 99mTc-DTPA and 99mTc-MAG3 injections make it unnecessary to correct for interference of the 99mTc-DTPA counts.
RESULTS
There were no discrepancies in the determination of fractional function and retained cortical activity.
Figure 3 summarizes the results obtained independently by the two observers for the determination of the time to peak activity for each kidney. Significant discrepancies were seen in six cases. The reasons for disagreements included the wrong selection of the first point in the renogram curve in four cases, and in the other two cases, poor renal function that caused scattered points in the time-activity curves and continuous accumulation of activity without a discernible inflexion point identifiable as the peak activity. A repeat analysis using zero time as the data point preceding the first significant increase in counts from an ROI placed over the abdominal aorta, corrected the discrepancies in every case. When the discrepancy between the observers was due to the attempt to select a nonexistent renogram peak, selecting the last point in the curve solved the problem.
Patients who did not receive furosemide prior to the administration of 99mTc-MAG3 showed larger interobserver discrepancies than the furosemide-treated patients. The beneficial effect of furosemide is clearly shown by comparing the regression equation obtained in the nondiuretic group: y =
0.33 + 0.94 x (r = 0.82; n = 88) with the diuretic group: y = 0.23 + 0.96 x (r = 0.92; n = 56) (Fig. 3).
When the discrepancies were reanalyzed using the appropriate zero time and the last point on the renogram curves when there was poor renal function, the correlation coefficients were r = 0.93 for the nondiuretic group and r = 0.99 for the diuretic group.
DISCUSSION
The nuclear medicine practitioner has to decide on the best selection of techniques and radiotracers for the evalua-
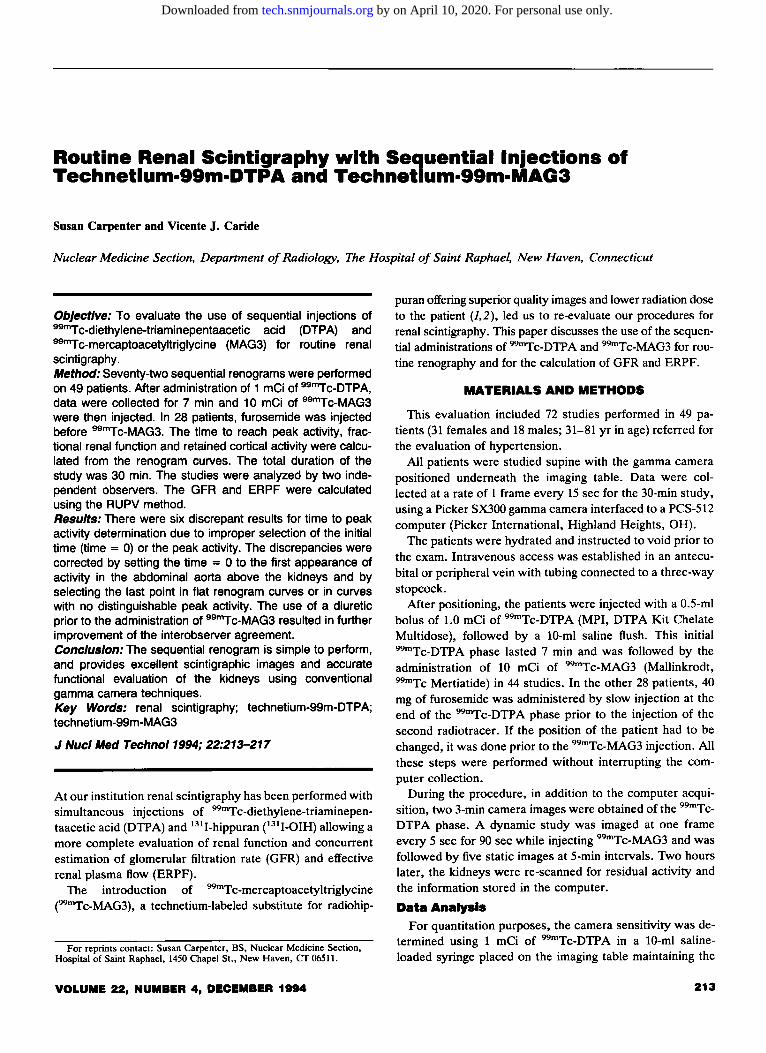
FIGURE 4. Normal 99"'Tc-DTPA and 99"'Tc-MAG3 study. (A) The first six frames correspond to the 99"'Tc-DTPA phase. The 99"'Tc-MAG3 images show normal parenchymal and excretory phase. (B) Time-activity curves. The time to peak (P3, P6), fractional function (P2, R2) and retained cortical activity (R3, R6) are shown at the bottom of the curves. The counts at a selected time on the 99"'Tc-MAG3 curve are also shown (P1, R1).
VOLUME 22, NUMBER 4 1 DECEMBER 1994 215
by on April 10, 2020. For personal use only. tech.snmjournals.org Downloaded from
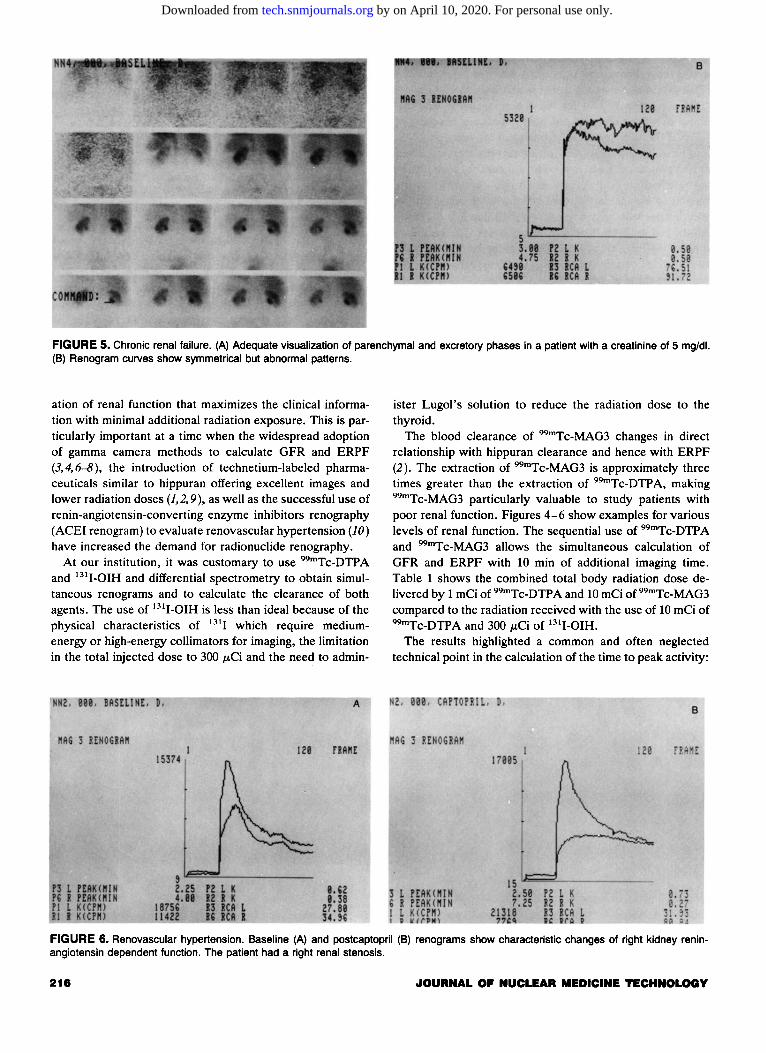
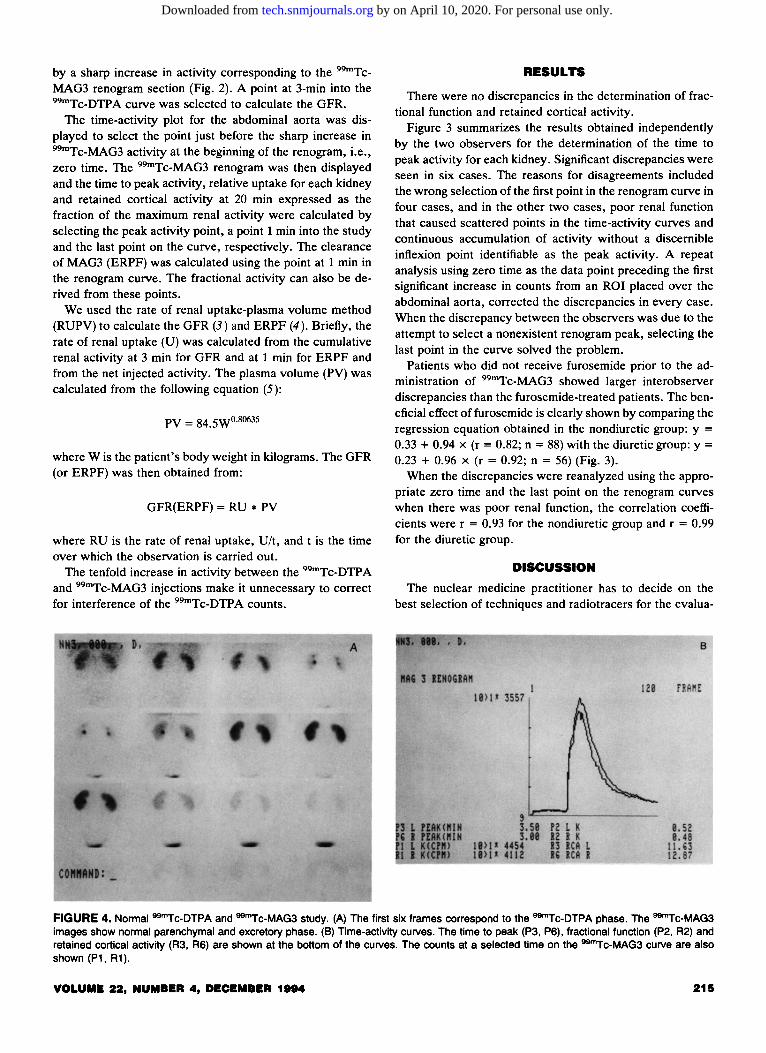
FIGURE 5. Chronic renal failure. (A) Adequate visualization of parenchymal and excretory phases in a patient with a creatinine of 5 mg/dl. (B) Renogram curves show symmetrical but abnormal patterns.
ation of renal function that maximizes the clinical information with minimal additional radiation exposure. This is particularly important at a time when the widespread adoption of gamma camera methods to calculate GFR and ERPF (3,4,6-8), the introduction of technetium-labeled pharmaceuticals similar to hippuran offering excellent images and lower radiation doses (1,2, 9), as well as the successful use of renin-angiotensin-converting enzyme inhibitors renography (ACEI renogram) to evaluate renovascular hypertension (10) have increased the demand for radionuclide renography.
At our institution, it was customary to use 99mTc-DTPA and 1311-0IH and differential spectrometry to obtain simultaneous renograms and to calculate the clearance of both agents. The use of 1311-0IH is less than ideal because of the physical characteristics of 131 I which require mediumenergy or high-energy collimators for imaging, the limitation in the total injected dose to 300 ILCi and the need to admin-
ister Lugol's solution to reduce the radiation dose to the thyroid.
The blood clearance of 99mTc-MAG3 changes in direct relationship with hippuran clearance and hence with ERPF (2). The extraction of 99mTc-MAG3 is approximately three times greater than the extraction of 99mTc-DTPA, making 99mTc-MAG3 particularly valuable to study patients with poor renal function. Figures 4-6 show examples for various levels of renal function. The sequential use of 99mTc-DTPA and 99mTc-MAG3 allows the simultaneous calculation of GFR and ERPF with 10 min of additional imaging time. Table 1 shows the combined total body radiation dose delivered by 1 mCi of 99mTc-DTPA and 10 mCi of 99mTc-MAG3 compared to the radiation received with the use of 10 mCi of 99mTc-DTPA and 300 ILCi of 1311-0IH.
The results highlighted a common and often neglected technical point in the calculation of the time to peak activity:
FIGURE 6. Renovascular hypertension. Baseline (A) and postcaptopril (B) renograms show characteristic changes of right kidney reninangiotensin dependent function. The patient had a right renal stenosis.
216 JOURNAL OF NUCLEAR MEDICINE TECHNOLOGY
by on April 10, 2020. For personal use only. tech.snmjournals.org Downloaded from
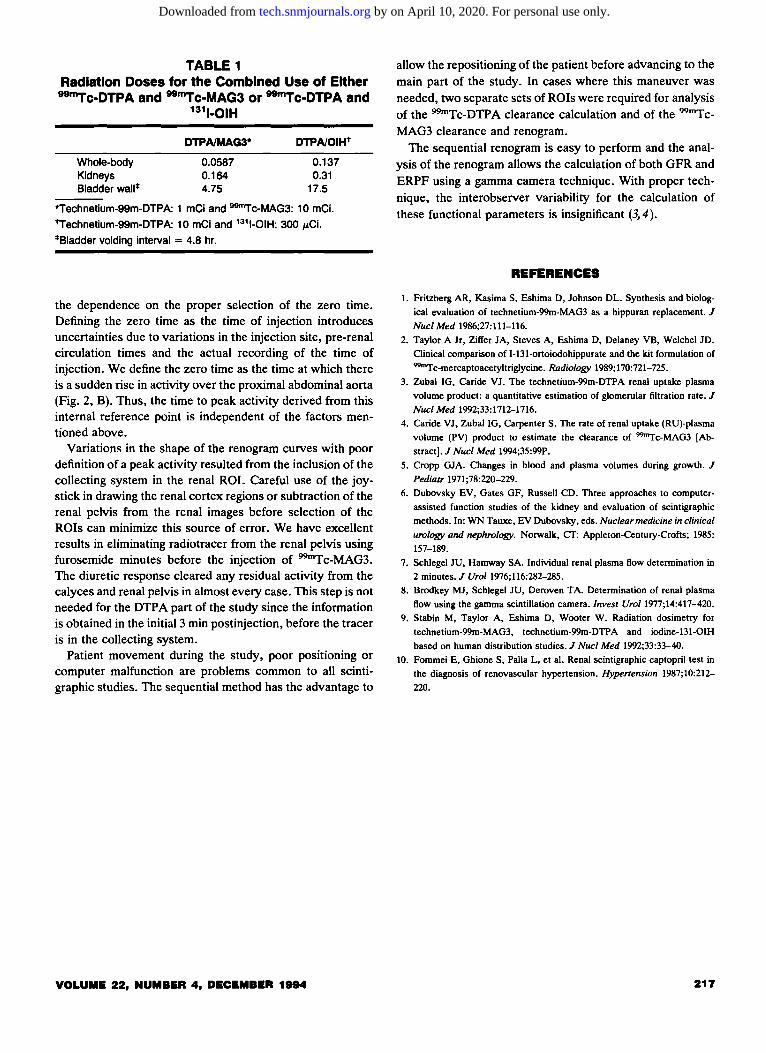
TABLE 1 Radiation Doses for the Combined Use of Either
991n"fc-DTPA and 991nfc-MAG3 or "rnrc-DTPA and 1311-0IH
Whole-body Kidneys Bladder wall*
DTPAIMAG3*
0.0587 0.164 4.75
DTPA/OIHt
0.137 0.31
17.5
*Technetium-99m-DTPA: 1 mCi and !l!lmyc-MAG3: 10 mCi.
trechnetium-99m-DTPA: 10 mCi and 131 1-0IH: 300 ~Ci.
*Bladder voiding interval = 4.8 hr.
the dependence on the proper selection of the zero time. Defining the zero time as the time of injection introduces uncertainties due to variations in the injection site, pre-renal circulation times and the actual recording of the time of injection. We define the zero time as the time at which there is a sudden rise in activity over the proximal abdominal aorta (Fig. 2, B). Thus, the time to peak activity derived from this internal reference point is independent of the factors mentioned above.
Variations in the shape of the renogram curves with poor definition of a peak activity resulted from the inclusion of the collecting system in the renal ROI. Careful use of the joystick in drawing the renal cortex regions or subtraction of the renal pelvis from the renal images before selection of the ROis can minimize this source of error. We have excellent results in eliminating radiotracer from the renal pelvis using furosemide minutes before the injection of 99mTc-MAG3. The diuretic response cleared any residual activity from the calyces and renal pelvis in almost every case. This step is not needed for the DTP A part of the study since the information is obtained in the initial 3 min postinjection, before the tracer is in the collecting system.
Patient movement during the study, poor positioning or computer malfunction are problems common to all scintigraphic studies. The sequential method has the advantage to
VOLUME 22, NUMBER 4, DECEMBER 1994
allow the repositioning of the patient before advancing to the main part of the study. In cases where this maneuver was needed, two separate sets of ROis were required for analysis of the 99mTc-DTPA clearance calculation and of the 99mTcMAG3 clearance and renogram.
The sequential renogram is easy to perform and the analysis of the renogram allows the calculation of both GFR and ERPF using a gamma camera technique. With proper technique, the interobserver variability for the calculation of these functional parameters is insignificant (3, 4 ).
REFERENCES
1. Fritzberg AR, Kasima S, Eshima D, Johnson DL. Synthesis and biolog
ical evaluation of technetium-99m-MAG3 as a hippuran replacement. J
Nucl Med 1986;27:111-116.
2. Taylor A Jr, Ziller JA, Steves A, Eshima D, Delaney VB, Welchel JD. Clinical comparison of 1-131-ortoiodohippurate and the kit formulation of
99mTc-mercaptoacetyltriglycine. Radiology 1989; 170:721-725.
3. Zubal IG, Caride VJ. The technetium-99m-DTPA renal uptake plasma
volume product: a quantitative estimation of glomerular filtration rate. J
Nucl Med 1992;33:1712-1716.
4. Caride VJ, ZuballG, Carpenter S. The rate of renal uptake (RU)-plasma
volume (PV) product to estimate the clearance of ~c-MAG3 (Abstract]. J Nucl Med 1994;35:99P.
5. Cropp GJA. Changes in blood and plasma volumes during growth. J
Pediatr 1971;78:220-229. 6. Dubovsky EV, Gates GF, Russell CD. Three approaches to computer
assisted function studies of the kidney and evaluation of scintigraphic
methods. In: WN Tauxe, EV Dubovsky, eds. Nuclear medicine in clinical
urology and nephrology. Norwalk, CT: Appleton-Century-Crofts; 1985:
157-189. 7. Schlegel JU, Hamway SA. Individual renal plasma flow determination in
2 minutes. J Urol1976;116:282-285.
8. Brodkey MJ, Schlegel JU, Deroven TA. Determination of renal plasma
flow using the gamma scintillation camera. Invest Uro11977;14:417-420. 9. Stabin M, Taylor A, Eshima D, Wooter W. Radiation dosimetry for
technetium-99m-MAG3, technetium-99m-DTPA and iodine-131-0IH
based on human distribution studies. J Nucl Med 1992;33:33-40. 10. Fommei E, Ghione S, Palla L, et al. Renal scintigraphic captopril test in
the diagnosis of renovascular hypertension. Hypertension 1987;10:212-
220.
217
by on April 10, 2020. For personal use only. tech.snmjournals.org Downloaded from
1994;22:213-217.J. Nucl. Med. Technol. Susan Carpenter and Vicente J. Caride and Technetium-99m-MAG3Routine Renal Scintigraphy with Sequential Injections of Technetium-99m-DTPA
http://tech.snmjournals.org/content/22/4/213This article and updated information are available at:
http://tech.snmjournals.org/site/subscriptions/online.xhtml
Information about subscriptions to JNMT can be found at:
http://tech.snmjournals.org/site/misc/permission.xhtmlInformation about reproducing figures, tables, or other portions of this article can be found online at:
(Print ISSN: 0091-4916, Online ISSN: 1535-5675)1850 Samuel Morse Drive, Reston, VA 20190.SNMMI | Society of Nuclear Medicine and Molecular Imaging
is published quarterly.Journal of Nuclear Medicine Technology
© Copyright 1994 SNMMI; all rights reserved.
by on April 10, 2020. For personal use only. tech.snmjournals.org Downloaded from


![Thyroid pathophysiology scintigraphy[1]](https://static.fdocuments.net/doc/165x107/588a7dc81a28abad628b4ebd/thyroid-pathophysiology-scintigraphy1.jpg)