Improved Utilization of Small-Diameter Ponderosa Pine in Glued-Laminated Timber

VTT PUBLICATIONS 383
TECHNICAL RESEARCH CENTRE OF FINLANDESPOO 1999
Round small-diametertimber for construction
Final report of projectFAIR CT 95-0091
Edited byAlpo Ranta-Maunus
VTT Building Technology

ISBN 951–38–5387–X (soft back ed.)ISSN 1235–0621 (soft back ed.)
ISBN 951–38-5388–8 (URL:http://www.inf.vtt.fi/pdf)ISSN 1455–0849 (URL:http://www.inf.vtt.fi/pdf)
Copyright © Valtion teknillinen tutkimuskeskus (VTT) 1999
JULKAISIJA – UTGIVARE – PUBLISHER
Valtion teknillinen tutkimuskeskus (VTT), Vuorimiehentie 5, PL 2000, 02044 VTTpuh. vaihde (09) 4561, faksi (09) 456 4374
Statens tekniska forskningscentral (VTT), Bergsmansvägen 5, PB 2000, 02044 VTTtel. växel (09) 4561, fax (09) 456 4374
Technical Research Centre of Finland (VTT),Vuorimiehentie 5, P.O.Box 2000, FIN–02044 VTT, Finlandphone internat. + 358 9 4561, fax + 358 9 456 4374
VTT Rakennustekniikka, Rakennusmateriaalit ja -tuotteet sekä puutekniikka,Puumiehenkuja 2 A, PL 1806, 02044 VTTpuh. vaihde (09) 4561, faksi (09) 456 7027
VTT Byggnadsteknik, Byggnadsmaterial och -produkter, träteknik,Träkarlsgränden 2 A, PB 1806, 02044 VTTtel. växel (09) 4561, fax (09) 456 7027
VTT Building Technology, Building Materials and Products, Wood Technology,Puumiehenkuja 2 A, P.O.Box 1806, FIN–02044 VTT, Finlandphone internat. + 358 9 4561, fax + 358 9 456 7027
Technical editing Leena Ukskoski
Libella Painopalvelu Oy, Espoo 1999
3
Ranta-Maunus, Alpo (ed.). Round small-diameter timber for construction. Final report of projectFAIR CT 95-0091. Espoo 1999, Technical Research Centre of Finland, VTT Publications 383.191 p. + app. 19 p.
Keywords construction, structural timber, wooden structures, harvesting, drying, methods,costs, joints, durability, woodworking, strength, testing, grading
Abstract
The use of small-diameter timber in construction has been investigated. The aimof the work is to increase the use of the wood harvested in forest thinning inconstruction applications. The work has covered a wide range of aspects, fromavailability of the material to design of the structures. This publicationsummarizes the results in following areas: availability, dimensions and qualityof conifers harvested in forest thinning, cost of harvesting and woodworking,comparison of drying methods: seasoning, warm-temperature and high-temperature kiln-drying, improving durability, strength of round small-diameterconifers, potential types of structures to be built from round timber and newmechanical joints.
The tree species that were included in the study are Scots pine, Norway spruce,Sitka spruce, Larch and Douglas fir.
The main reasons why round timber is rarely used in construction can besummarized as: the material is not available via the normal commercial routes,the roundness requires special methods and systems that are not known byarchitects and carpenters, the strength values of timber connections are notavailable for engineers, the lack of standards and models.
This research aims to produce information needed in the use of smallroundwood in load-bearing structures in order to remove the obstaclesmentioned above.
Results concerning availability of construction-quality round timber in the firstcommercial thinning reveal that the resource itself is vast: millions of cubicmeters in Finland alone. The yield per hectare is, however, limited anddependent on the dimensions required. When the diameter of the final product is

4
adequate at less than 100 mm, the first commercial thinning is also economic forthe harvesting of construction timber. The economics of manual and mechanicalharvesting have been compared. When larger dimensions are needed, the secondthinning is more likely to produce the required material.
The cost of producting round timber is primarily dependent on the surfacequality needed: timber peeled cylindrical is twice as expensive as material thatis only debarked. Both of these have their own market. The cost of constructionis dependent on labour costs, which at the moment is higher for round timberthan for sawn timber because conventional systems are not suited for the use ofround timber. Additional costs may arise from the deviations of cylindricalform.
Drying is a critical phase of production, which determines how much checkingis observed. In this respect, high-temperature drying gives much better qualitythan normal, commercial warm-temperature kiln-drying or natural seasoning.Accordingly, the drying method should be chosen based on the surfacerequirements. End-cracking also affects the capacity of joints.
The strength of small-diameter timber was observed to be higher than expected.Characteristic values are presented as well as a proposal for visual strength-grading. A method for non-destructive mechanical strength-grading based on X-ray is also proposed. A statistical analysis is presented which indicates thedependence of strength and stiffness on different factors such as density, knots,moisture content, diameter and age.
New mechanical connections have been designed and tested. For engineeredstructures, a round form enables the use of steel lacing around the wood, whichconsiderably increases the load capacity of the joints.
The largest quantities of round timber are used, and can be used, in non-structural applications and in small, traditional-type buildings. Smaller involume but important for the image of roundwood is its application in thearchitecture of medium-sized leisure industry buildings in which the load-bearing structure is visible. As part of the project, designs for a footbridge and awatchtower have been made.

5
Preface
The project "Round small-diameter timber for construction" is part of the EC´s4th framework programme (FAIR-CT95-0091), which was completed by the endof 1998. The EC contact person was Dr A. Arabatzis. The project participantsare listed below as follows:
Technical Research Centre of Finland,
VTT Building Technology, Espoo, Finland
as co-ordinator
A. Ranta-Maunus,
A. Kevarinmäki, A.-L. Perälä
U. Saarelainen, V. Tarvainen
Agricultural Research Centre of Finland (MTT),
Institute of Agriculture Engineering, Vihti, Finland
J. Pietilä, H. Boren
T. Kivinen
Technological University Delft (TU-Delft), Civil
Engineering Department, Delft, The Netherlands
C. Groot, P. Huybers
R. Houtman, E.W.P. Sluis
P. de Vries
University of Surrey, Department of Civil
Engineering, Guildford, UK
D. R. Griffiths, G. Barnard
Lekopa Oy, Lehtimäki, Finland
O. Rissanen
Universität für Bodenkultur (BOKU), Institut für
Holzforschung, Vienna, Austria
H. Resch, M. Patzelt
Centre Technique du Bois et de l’Ameublement
(CTBA), Division Structure, Bordeaux, France
G. Adjanohoun, J.-D. Lanvin
Fr. Rouger, J.-L. Guillot
R. Cholat
This publication is the final report of the project, which summarizes the mainresearch results. The report has been writen by the editor with the help of all theparticipating teams. Major contributions from the following persons areacknowledged: Mr Jukka Pietilä (MTT) for Chapters 2.1 and 2.2 on harvesting; Mr Antti Nurmi(VTT) for Chapter 2.4 on oil impregnation; Mr Hannu Boren (MTT) for theanalysis of mechanical and physical properties of Finnish timber; Dr Caspar

6
Groot (TUDelft) for Chapter 4 on mechanical connections, and Dr RobertGriffiths (U Surrey) for Chapter 5 on roundwood structures.
More detailed results are published in the papers given in the references. Themain documents for facilitating building design are the design guidelines forround timber structures, which have been made separately for engineered (Groot1999) and non-engineered structures (Griffits et al. 1999).
I would like to express my sincere thanks to all persons involved for theircommitment to the work.
Espoo June 1, 1999
Alpo Ranta-Maunus

7
Contents
Abstract 3
Preface 5
1. Introduction 11
2. Harvesting, quality and manufacturing 142.1 Economy of harvesting 14
2.1.1 Introduction 142.1.2 Material and methods of time and productivity study 182.1.3 Results 212.1.4 Conclusions 27
2.2 Yield and quality in the first thinning 292.2.1 Introduction 292.2.2 Material 302.2.3 Methods 322.2.4 Results 342.2.5 Discussion 40
2.3 Drying 412.3.1 Seasoning 412.3.2 Kiln-drying at 70°C 442.3.3 Discussion on drying 51
2.4 Oil impregnation and drying 54
3. Strength of small-diameter timber 593.1 Testing methods 59
3.1.1 Bending tests 603.1.2 Compression test 613.1.3 Buckling test 633.1.4 Tension test 653.1.5 Dynamic modulus of elasticity 663.1.6 X-ray density measurement 67
3.2 Materials and statistical methods 713.2.1 Sampling 713.2.2 Measured features of material 72

8
3.2.3 Statistical methods 773.2.4 Hypotheses of the mechanical properties of round timber 80
3.3 Strength results 813.3.1 Overview of results 813.3.2 Correlation analysis 843.3.3 Effect of machine rounding and sawing 863.3.4 Differences between species 913.3.5 Effect of diameter 923.3.6 Buckling strength 95
3.4 Strength-grading 973.4.1 Visual grading 98
3.4.1.1 Determination of visual grades 983.4.1.2 Characteristic values for grades and species 993.4.1.3 Strength classes for grades 100
3.4.2 Dynamic modulus of elasticity as a grading parameter 1023.4.3 Grading by X-ray 104
4. Mechanical connections 1064.1 Potential roundwood connections 1064.2 Laced joints 107
4.2.1 Description of laced joints 1074.2.2 Estimation of load capacity of wire-laced joints 108
4.3 The Block Joint 1164.3.1 Description of the joint 1164.3.2 Test results 1234.3.3 Design criteria for the joint 125
4.4 Forced plate joint 1264.4.1 Introduction 1264.4.2 Calculation 127
5. Roundwood Structures 1305.1 Introduction 1305.2 Historical influences 1325.3 The present situation 1375.4 Market study 139
5.4.1 Overview 1395.4.2 Results by country 140

9
5.4.3 Conclusions 1465.5 Structure of programme 1495.6 Overview of uses 150
5.6.1 Playground and leisure equipment 1505.6.2 Commercial landscaping 1525.6.3 Loghouses 1535.6.4 Pole buildings and pole barns 1565.6.5 Space frame and specialist roofs 1585.6.6 Towers and domes 1615.6.7 Bridges 162
5.7 Case studies related to round-pole group visits 1645.7.1 Holland 1645.7.2 England 1705.7.3 Finland 1735.7.4 Austria 174
6. Summary 176
REFERENCES 184
APPENDICESAppendix A: Voluntary Product Standard VPS-SRT-1Appendix B: Voluntary Product Standard VPS-SRT-2Appendix C: Voluntary Product Standard VPS-SRT-3


11
1. Introduction
Small-diameter roundwood was traditionally used in construction in olden times.It is still used though to small extent in areas where wood, as a building material iscommon. Often, roundwood is used by do-it-yourself men in rural areas. Thecommercial construction business very seldom uses small-diameter round timber.On the other hand, small-diameter wood is available from forest thinning, whichprovides a surplus of such material. Good management of forests cannot beperformed without proper thinning. Delayed thinning is a common problem inEurope, because of the lack of demand, and the low price. Such wood can also beused for energy production, but at the moment it is not competitive with otherenergy sources. As a result, new uses of timber are being sought in theconstruction industry, which would make forest thinning economical. As buildingmaterial, round timber is considered environmentally friendly, especially ifprocessing and transportation are minimal.
The objective of this research was to study how small-diameter timber could beused in construction. The work includes critical issues of material production,such as harvesting, processing, drying, strength and durability. Issues related tostructural development are also focused upon: feasible types of buildings that canbe built from round timber, the development of mechanical connections, and thedrafting of design guidelines for roundwood structures. The content of the workreported in this publication is summarized in Table 1.1.
The aim in harvesting research is to find out what the harvesting costs are ofstructural quality small-diameter timber when manual or mechanical harvesting isused. One problem to be dealt with is related to the fact that only a part of thetimber harvested in the first commercial thinning is suitable for construction. Therequired quality is characterized in terms of dimensions, straightness and knots. Adraft for visual strength-grading has been produced. Non-destructive methods havealso been studied to determine whether they can be used for strength-grading.
Natural seasoning is the traditional method of wood drying. The quality and finalmoisture content of seasoned roundwood have been studied and compared withavailable industrial kiln-drying methods. The important issues in wood drying arethe moisture content and checking of wood, which is important for visualappearance, durability and strength of the mechanical connections.

12
7DEOH������:RUN�FRQWHQW�
7DVN 2EMHFWLYH
0DWHULDO�SURGXFWLRQDQG�UHVHDUFK
������+DUYHVWLQJ $VVHVVPHQW�RI�HFRQRPLF�KDUYHVWLQJ�PHWKRGV�DQG�URXQGZRRG�UHVRXUFHVDYDLODEOH��+DUYHVWLQJ�RI�PDWHULDO�IRU�H[SHULPHQWV�
������4XDOLW\������FKDUDFWHUL]DWLRQ
0HDVXUHPHQW�RI�WKH�TXDOLW\�RI�URXQGZRRG�KDUYHVWHG��DQG�HVWLPDWLRQ�RI� WKHDYDLODELOLW\� RI� WKH� VWUXFWXUDO� TXDOLW\� RI� URXQGZRRG�� 4XDOLW\� FODVVLILFDWLRQV\VWHP�
������'U\LQJ &RPSDULVRQ� RI� WKH� TXDOLW\� RI� NLOQ�GULHG� DQG� VHDVRQHG� URXQGZRRG�6FKHGXOHV�IRU�NLOQ�GU\LQJ�
������6WUHQJWK &KDUDFWHULVWLF�VWUHQJWK�YDOXHV�QHHGHG�LQ�GHVLJQ�RI�EXLOGLQJV�
'HYHORSPHQW�RIVWUXFWXUHV
������0DUNHW�VWXG\ (VWLPDWLRQ�RI�WKH�SRWHQWLDO�W\SHV�RI�EXLOGLQJV�IRU�WKH�XVH�RI�URXQGZRRG��DQGHVWLPDWLRQ�RI�WKH�URXQGZRRG�PDUNHW�
������6WUXFWXUDO�V\VWHPV������DQG�GHWDLOV
6WUXFWXUDO�V\VWHPV�DQG�GHWDLOV�IRU�EXLOGLQJV�7KHRUHWLFDO�PRGHOV�IRU�FRQQHFWLRQV�'HVLJQ�UXOHV�IRU�FRQQHFWLRQV�DQG�GHWDLOV�
������'HVLJQ�JXLGHOLQHV 'HVLJQ� JXLGHOLQHV� LQ� UHODWLRQ� WR� (XURFRGH� �� LQFOXGLQJ� VWUHQJWK�JUDGLQJV\VWHP�IRU�URXQG�WLPEHU�
������%XLOGLQJV 0RGHO�GUDZLQJV�DQG�GHPRQVWUDWLRQ�EXLOGLQJ�WR�EH�EXLOW�
Today, roundwood is mainly used outdoors, exposed to rain, in non-structuralapplications. Often, natural durability is not adequate and it is improved byimpregnation with preservatives. The trend is to avoid toxic preservatives, andtherefore there has been another EU-funded project on the use of naturalpreservatives (FAIR-CT95-0089). Some results on oil impregnation aresummarized in this report.
The strength of small-diameter round timber has not previously been tested. It isthought that the strength of small wood might be low for two reasons. Firstly, itis to large extent juvenile wood, and the knot sizes can be relatively large. Onthe other hand, it is known that the bending strength of adult round timber is

13
higher than that of sawn timber of a similar cross-section size, and small cross-sections are known to have higher strength than large ones based on the Weibulltheory. The objective of strength testing is to find out which of these effects isstrongest, and to determine characteristic values for the species and gradesstudied.
Potential types of structures that can be built from round timber have beendetermined. Design guidelines have been written both for engineered structuresin conjunction with Eurocode 5, and for simpler non-engineered structures. Inthis publication the use of small-diameter roundwood in structures is illustrated,and the design guidelines have been produced separately. A key-issue inengineered structures is the connections. The work includes the development ofnew types of joints applicable for round timber.

14
2. Harvesting, quality and manufacturing
2.1 Economy of harvesting
The main sources for the results presented in this chapter are taken from MrHenrik Heräjärvi’s thesis for the master of forestry degree (Heräjärvi 1998). Theinformation on harvesting economy in Austria and UK is based on the work ofthe project partners. Mr Jukka Pietilä made the roundwood production costcalculations and he also combined and modified the aforementioned texts.
Most of the work is focused on Finland because we have a bigger study inwhich we compared different kinds of harvesting methods in the same stand. InAustria and in the UK our results are based on one harvest case where weharvested strength sample trees. However, we believe those results are based onup-to-date technology and they are rather average ones. In addition, as seenlater, the main results do not differ too much in other countries. The conditionsdiffer between countries, but so they do within one country and therefore wealways have to adapt our results, conclusions, rules and advice to meet localcircumstances and needs.
2.1.1 Introduction
Harvesting construction timber
The first step in round construction timber production is gaining the rawmaterial for roundwood. A large and under-utilized resource for constructiontimber is derived from the first commercial thinnings of forests, which wereselected as the scope of this study. Thinning is one of the normal processescarried out during forestry management since it allows the better quality trees togrow for later use. Choosing the most suitable felling method is dependent onvarious parameters (Barnard 1997, Heräjärvi 1998), which include: - terrain - accessibility to the forest - distance to roadside for collection - volume of timber to be felled - location of forest in relation to other felling operations
15
- scale of operation - experience of the logger - density of the stand - amount of undergrowth.
For example, in Austria, Scotland and Wales the main factor in determining thechoice of felling operation method is the terrain. The cut-to-length method iswidely used on low lands, and in Finland nearly exclusively. In this method,tree stems are cut for pulpwood and construction timber lengths are already cutin the forest during felling. A logger or harvester may perform this harvesting.For large stands a harvester and forwarder would be the most likely methodchosen. Harvesters are now being developed to operate on difficult terrain, sotheir use on steep sites is becoming more widespread. Commercially, mostsoftwood felling operations are now carried out using a harvester, although incertain situations manual felling may be used.
For sites where the topography makes mechanical harvesting impossible manualmethods are used. In this situation, the logs are either transported off the hillsideusing cables and winches or by a forwarder if access roads have been made intothe forest.
Transportation of the roundwood can increase the costs if accessibility to thesite is difficult and the distance to the roadside from the felling area involveslong transport times to deliver the logs. The distance that the logs have to betransported by the forwarder should be considered, since long distances will addtime and costs to the operation. The preferred option is for the collection pointsto be accessible for the haulage lorries, and for a short distance from the fellingarea to the roadside.
A further consideration in determining which harvesting method to use is thequantity of timber to be felled. For large operations it is commercially viable touse a harvester and forwarder; however, if the stand of timber is small andaccess to the site for large plant is difficult, then it may be more practical toharvest the timber manually. This practice is common if the stand or amount ofharvested trees is small. Additionally the competitiveness of manual harvestingcompared to using a harvester increases when the size of stems to be removed issmaller.
16
Harvesting small roundwood for construction does not require the developmentof any new harvesting technology. Tree felling can be carried out as part of thenormal harvesting process. Similarly, no changes are needed to transport thelogs. The main differences lie in the method of selecting the timber and how thiscan be integrated with existing harvesting methods.
When using cut-to-length method, there are two main strategies. The first is toselect timber from harvested pulpwood, and the second is to harvest theroundwood specifically for roundwood construction timber. Both strategies havetheir advantages and disadvantages and they both have different methods ofimplementation. They both affect the costs and benefits and that is why bothmethods were tested.
In the selection method, the potential construction timbers are graded bolt bybolt from a pulpwood pile and those bolts which best fulfil the quality anddimension demands are selected. In the harvesting method, the constructiontimber is harvested as one specific assortment, e.g. pine pulpwood. Harvestingincludes selecting and felling the trees, cutting them into suitable length-diameter -combinations and then transporting them to the roadside.
Nearly all of the small-diameter construction timber is harvested in the firstcommercial thinnings. The quality demands concerning, e.g. straightness andwood quality, set on that timber are higher than those for pulpwood. Forconstruction timber harvesting, the problem when harvesting the first thinningsis in leaving the best quality stems to grow. The future quality of the forestsmust not be jeopardized and a quality-thinning principle must be followed byleaving the best trees. Thus, the raw material for construction timber is takenfrom the best stems of the removed ones.
It is important to separate pulpwood and construction timber already during theforest operations in order to achieve the best economical efficiency. Laterseparation of the pulpwood and construction timber material will cause extrawork and costs. The problems have been in not having studies on this kind ofintegrated harvesting pulpwood and construction timber are harvested together.However, there has been plenty of research work concerning integrated pulp andfuel-wood harvesting, e.g. Imponen (1995), Hakkila et al. (1995), Mäkelä &Ryynänen (1994). During this work it has been possible to compare our results

17
with those concerning time consumption, productivity and costs of pulpwoodharvesting e.g. Imponen & Kuitto (1986), Kuitto et al. (1994), Lilleberg (1990),Liikkanen (1992), Mäkelä (1989 and 1990). But construction timber harvestingdiffers from pulpwood harvesting especially in felling, with construction timberharvesting we have to observe the quality demands, which debase productivity.
Up to now, entrepreneurs have bought all the pulpwood coming from one standand they have subsequently sorted the trees into pulpwood and constructiontimber. This has caused extra work and a problem for pulpwood marketing.Thus, it has reduced the economical profitability of roundwood constructions.
Aim of the study
The aim of this study is to introduce a harvesting method for integratedconstruction timber and pulpwood harvesting. The idea is that the trees aresorted during harvesting in the forest into pulpwood and construction timber.
During this work we developed and studied four cut-to-length harvestingsystems for integrated pulp and construction timber harvesting. These weremanual harvesting, manual pre-harvesting of mechanical harvesting andmechanical harvesting. The fourth method was selecting pulpwood andconstruction timber on a roadside. We also studied how well these differentmethods could meet the quality demands set on construction timber.
The productivity and costs for these four methods were measured and analyzed,and the productivity of the harvesting work was calculated as a function of treesize. In addition, calculations and estimations were made of the production costsfor small-diameter construction timber, debarked and peeled.
Concepts
A construction timber stem is a tree stem whose quality and dimensions aresuitable for cutting at least one construction timber bolt.
A pulpwood stem is a tree stem whose quality or dimension is suitable only forpulpwood.

18
A construction timber is a debarked or peeled construction product that is roundand dimensioned.
With time-study data the working times (W0) (effective time + breaks +auxiliary time) and effective times needed were calculated. In the time-studies,the most commonly effective time (E0) and operating time (E15) were used. Withoperating time means working times without breaks longer than 15 minutes,effective time is working time without breaks (Harstela 1991). When estimatingproductivity in forestry operations, operating times are usually used (e.g.Brunberg 1988, Kuitto et al. 1994, Asikainen 1995) but also effective time isused (e.g. Sirén 1990, Kuitto et al. 1994, Nurmi 1994). In this study, workingtimes and effective times have been used because the amount of small breakswas so small.
Felling means felling, debranching and cutting a stem for timber assortments.Forwarding means transportation of the timber to the roadside. Harvesting isfelling and forwarding together.
2.1.2 Material and methods of time and productivity study
Harvesting methods
In the Finnish time-study the logger, forwarder and harvester operators wereprofessional and used to harvesting work. Because they were not used to theharvesting method employed in this study they trained on one plot, which wassimilar to those used in the time-study. The forwarder and harvester weremedium-size ones that are commonly used in harvesting work. Both logger andmachines worked on a piecework wage according to which their work wasmeasured.
The harvested pulpwood bolts fulfilled the usual pulpwood quality demands.The top diameter for a pulpwood stem was 7 cm. For construction timber stemsthe quality demands were (Borén 1999):
- maximum knot diameter 3 cm, - minimum distance of two knot whorls at least 15 cm and - the stems should not have curving, scar, or fissures.

19
The following harvesting methods were used in the study:
1) Manual harvesting. Logger and forwarder. The logger harvested using anordinary manual-thinning work method. If he noticed that the pulpwood stemfulfilled the construction timber quality demands, he performed a cleandelimbing and cut the stem into construction timber lengths, and then piled itseparate from the pulpwood. The forwarder transported the bolts on separatesides of a load bunk (Figure 2.1).
2) Manual pre-harvesting of mechanical-harvesting. Logger, harvester andforwarder. With manual pre-harvesting we tried to improve the productivity ofmechanical harvesting. In this method, the logger cut undersized trees and heharvested for pulpwood or construction timber from all the removed trees whosebreast-height diameter was less than 10 cm. He also planned and marked thecarriage roads. After that the harvester cut the trees on the carriage roads andother trees by making two assortments. The haulage was done with a forwarder.
3) Mechanized harvesting. Harvester and forwarder. The harvester harvestedboth the construction timber and pulpwood at the same time, but put them inseparate piles for hauling. The most important factor distinguishing the twoassortments was the different length of construction timber (3 m) compared topulpwood (2.9, 3.7 and 4.7 m). Forest forwarding as in 2).
4) Selecting construction timber on a roadside. The harvester felled thepulpwood. From these bolts, the forwarder operator selected those logs whosequality was suitable for construction purposes. The selection took place eitherwhen a) loading, by loading the logs on different sides of a load bunk or b) while unloading on a roadside.
After forwarding, on a roadside, the construction timber selection quality ofeach method was studied. The aim of this evaluation was to find out if thequalities of construction timber fulfilled the demands and whether there werebolts in the wrong piles.

20
)LJXUH�������0DQXDO�ORJJLQJ�DQG�WLPEHU�RQ�URDGVLGH�
Stand
The data for this work-study was collected from the first commercial thinning ofa mixed Norway spruce and Scots pine stand in which spruce was dominant.Only spruce was harvested for construction timber, and pine was harvested forpulpwood. Before harvesting preliminary estimations were made about thevolume of trees.
When the cost calculations were made, it was assumed that the logger cost was16.7 euro/h, the machine cost for the harvester was 66.7 euro/h, and for theforwarder 37.5 euro/h (note that these are derived from piecework wages). Inthis paper, the harvesting times also includes the harvesting time for pine. Thecosts were divided for timber assortments according to the formula (Oijala &Terävä 1994):
TCSOa
STaCA = (2.1)
where CA = harvesting cost of assortment (euro/m3) STa = assortment's share of total harvesting time (%) SOa = assortment's share of out turn (%) TC = total cost (euro/m3).

21
Table 2.1 shows the number of harvested construction timber and pulpwoodstems per plot. The share of construction timber stems is also shown. Out of allthe harvested stems, the share of construction timber stems was 25 %.
7DEOH�������1XPEHU�RI�KDUYHVWHG�VWHPV�SHU�HDFK�SORW�DQG�VKDUH�RI�FRQVWUXFWLRQ�WLPEHU�
0HWKRG 1XPEHU�RISXOSZRRG�VWHPV
1XPEHU�RIFRQVWUXFWLRQ�VWHPV
6KDUH�RIFRQVWUXFWLRQ�WLPEHU
���
0DQXDO
0DQXDO�SUH�KDUY�
0HFKDQL]HG
���
���
���
��
��
��
����
����
����
2.1.3 Results
Productivity and costs
The felling productivity and costs are given in Table 2.2. If the share of thosestems which did not fulfil the quality demands of construction timber are takeninto account, the costs of manual pre-harvesting and mechanized harvesting ofconstruction timber will increase by 20 %.
7DEOH������3URGXFWLYLW\�RI�IHOOLQJ�RQ�HIIHFWLYH�WLPH��(���EDVLV�DQG�IHOOLQJ�FRVWV�E\�DVVRUWPHQWV�ZLWK�YDULRXV
KDUYHVWLQJ�PHWKRGV�
0HWKRG 3URGXFWLYLW\���P��(�� &RVWV��HXUR�P��
0DQXDOO\
3UH�KDUYHVW
0HFKDQL]HG
3XOSZRRG
����
����
����
&RQVWUXFWLRQ
����
����
����
3XOSZRRG
���
����
���
&RQVWUXFWLRQ
����
����
����
In Austria, felling costs were about 18 euro/m3. The main reason for this was thehilly terrain.
The costs for the harvesting (felling and forwarding) are given in Table 2.3. Ifthe costs alone are taken into account, the most profitable logging method forconstruction timber is by selecting from roadside piles.

22
7DEOH������+DUYHVWLQJ�FRVWV�E\�ORJJLQJ�PHWKRG�
0HWKRG &RVWV��HXUR�P��
0DQXDOO\
3UH�KDUYHVWLQJ
0HFKDQL]HG
6HOHFWLRQ�E\�URDG�D�E
����
����
����
���������
For tree delivery of small entrepreneur or private use, also the harvesting costsper meter and per bolt were calculated. The results are shown in Table 2.4.
7DEOH������+DUYHVWLQJ�FRVWV�SHU�FRQVWUXFWLRQ�WLPEHU�EROW�DQG�PHWHU�
0HWKRG +DUYHVWLQJ�FRVWV �HXUR�EROW�
+DUYHVWLQJ�FRVWV �HXUR�P�
0DQXDOO\
3UH�KDUYHVWLQJ
0HFKDQL]HG
6HOHFWLRQ�E\�URDG�D�E
���
���
���
���������
����
����
����
���������
If the bolt volume increased by 10 dm3, the logging costs increased by about0.17 euro. The trend was the same as the volume decreased. With increased boltvolume the relative productivity of harvesting work decreased. The reason forthis is, e.g. close delimbing which is needed for construction timber.
Results by methods/Method 1: Manual harvesting
Table 2.5 gives the mean breast-height diameters and the volumes of pulpwoodand construction timber stems.

23
7DEOH������$YHUDJH�EUHDVW�KHLJKW�GLDPHWHUV�DQG�YROXPHV�RI�SXOSZRRG�DQG�FRQVWUXFWLRQ�WLPEHU�VWHPV�
3XOSZRRG &RQVWUXFWLRQWLPEHU
%UHDVW�KHLJKW�GLDPHWHU��FP
0HDQ�YROXPH��GP�
����
��
����
��
Every construction timber bolt that was logger-felled fulfilled the qualitydemands for construction timber. Felling a construction timber stem took about20 % more time compared with a pulpwood stem. This was because of the stemsize. Stage delimbing and bucking took clearly longer for construction timberthan for pulpwood. The relative difference was about 40 %. This arises from theneed for the exact measuring of bolt dimensions and close delimbing. Transitiontimes between the stems were 15 to 20 s. Figure 2.2 shows regression betweenstem diameter and harvesting time.
0
50
100
150
200
250
300
350
400
7 9 11 13 15 17 19 21
D1,3
Eff
ecti
ve t
ime,
s/s
tem
Pulp wood
Constr.timber
)LJXUH�������+DUYHVWLQJ�WLPH�GHSHQGHQFH�RQ�EUHDVW�KHLJKW�GLDPHWHU�G����LQ�PDQXDO�KDUYHVWLQJ�
Method 2: Manual pre-harvesting
In manual pre-harvesting, the transition times of the logger were long. Onaverage it took 47 s to move from one felled tree to another. Table 2.6 gives themean diameters and volumes of the trees which the harvester felled in method 2.
24
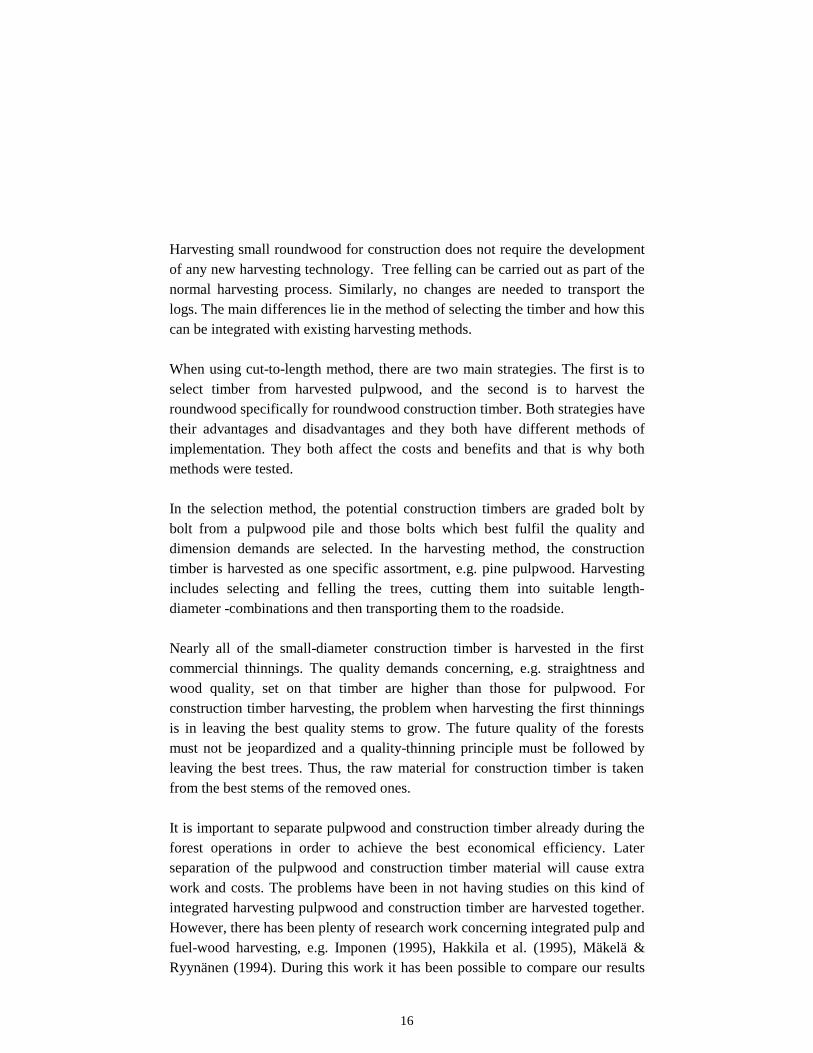
7DEOH������$YHUDJH�EUHDVW�KHLJKW�GLDPHWHUV�DQG�YROXPHV�RI�SXOSZRRG�DQG�FRQVWUXFWLRQ�WLPEHU�VWHPV��ZKLFKWKH�KDUYHVWHU�IHOOHG�LQ�WKH�PDQXDO�SUH�KDUYHVWLQJ�PHWKRG�
3XOSZRRG &RQVWUXFWLRQ WLPEHU
%UHDVW�KHLJKW�GLDPHWHU��FP
0HDQ�YROXPH��GP�
7LPH�FRQVXPSWLRQ��V�VWHP�
��
��
��
��
��
��
Concerning time consumption, felling a construction timber stem took about 1.3times longer than felling a pulpwood stem. Figure 2.3 shows the regressionbetween the stem diameter and harvesting time.
The construction timber bolts, that were logger-felled, fulfilled the qualitydemands, but with the harvester 20 % of the bolts did not. The main reasonswere the vertical branches that the harvester operator did not see.
0
10
20
30
40
50
60
70
7 9 11 13 15 17 19 21
D1,3
Pro
cess
ing
tim
e, s
/ste
m
Pulpwood
Constr.timbero
)LJXUH������+DUYHVWHU¶V�IHOOLQJ�WLPH�GHSHQGHQFH�RQ�EUHDVW�KHLJKW�GLDPHWHU�G����ZLWK�PDQXDO�SUH�KDUYHVWLQJ�
Method 3: Mechanized harvesting
Table 2.7 gives the mean values of the trees harvested on the mechanizedharvesting plot. The construction timber stems were bigger than the pulpwoodstems and that is reason for the longer time consumption.

25
7DEOH������0HDQ�YDOXHV�RI�SXOSZRRG�DQG�FRQVWUXFWLRQ�WLPEHU�VWHPV�WKDW�ZHUH�KDUYHVWHG�ZLWK�WKH�KDUYHVWHU�
0HWKRG 3XOSZRRG &RQVWUXFWLRQ WLPEHU
%UHDVW�KHLJKW�GLDPHWHU��FP
0HDQ�YROXPH��GP�
7LPH�FRQVXPSWLRQ��V�VWHP�
��
��
��
��
��
��
On average it took 12 % longer to harvest a construction timber stem than toharvest a pulpwood stem. Figure 2.4 shows the regression between stemdiameter and felling time. The variation between felling times was greater thanwith the pre-harvesting method because there were smaller stems.
Again, 20 % of the construction timber bolts did not fulfil the quality demands.The main reasons were again the vertical branches, which were not seen, butalso branches and twist were defects. In addition the harvester’s head rollers hadspoiled the bolts.
0
5
10
15
20
25
30
35
40
45
50
7 9 11 13 15 17 19 21
D1,3
Pro
cess
ing
tim
e, s
/ste
m
Pulp wood
Constr.timber
)LJXUH������)HOOLQJ�WLPH�GHSHQGHQFH�RQ�EUHDVW�KHLJKW�GLDPHWHU�G����LQ�PHFKDQL]HG�KDUYHVWLQJ�
Forwarding with methods 1, 2 and 3
Between the methods, there were no big differences in transportation, loadingand unloading times when forwarding construction timber. In general, the

26
forwarding time increased slightly compared to pulpwood forwarding becauseconstruction timber and pulpwood had to be separated during unloading. Theproductivity and costs of forwarding are shown in Table 2.8. In manualharvesting, the plot productivity was better because the bolts were longer than inother plots.
7DEOH������3URGXFWLYLW\�DQG�FRVWV�RI�IRUZDUGLQJ�E\�SORW�
0HWKRG 3URGXFWLYLW\��P��K� &RVWV��HXUR�P��
0DQXDOO\
3UH�KDUYHVWLQJ
0HFKDQL]HG
����
���
���
���
���
���
In Austria, on more hilly terrain, the forwarding costs after harvesting were 8.6euro.
The forwarder operator’s mistakes during unloading are given in Table 2.9. Thepercentages show how well an operator managed to keep the bolts, which hadbeen grouped by the feller, separate. The figures do not include those bolts, thatdid not fulfil the quality demands after harvesting.
7DEOH������0LVWDNHV�LQ�VRUWLQJ�WKH�EROWV�ZKHQ�XQORDGLQJ�WKH�IRUZDUGHU�
0HWKRG &RQVWUXFWLRQ�WLPEHU�LQSXOSZRRG�SLOH
����
3XOSZRRG�LQ�FRQVWUXFWLRQWLPEHU�SLOH
����
0DQXDOO\
3UH�KDUYHVWLQJ
0HFKDQL]HG
��
��
�
�
�
�
Method 4: Road side selection of construction timber
With both methods the problem was that it was mentally very hard to separatethe bolts one by one with a crane. With sorting method a) it took about 2 min/m3
to unload, compared to 1.2 min/m3 with method b). Sorting timber when
27
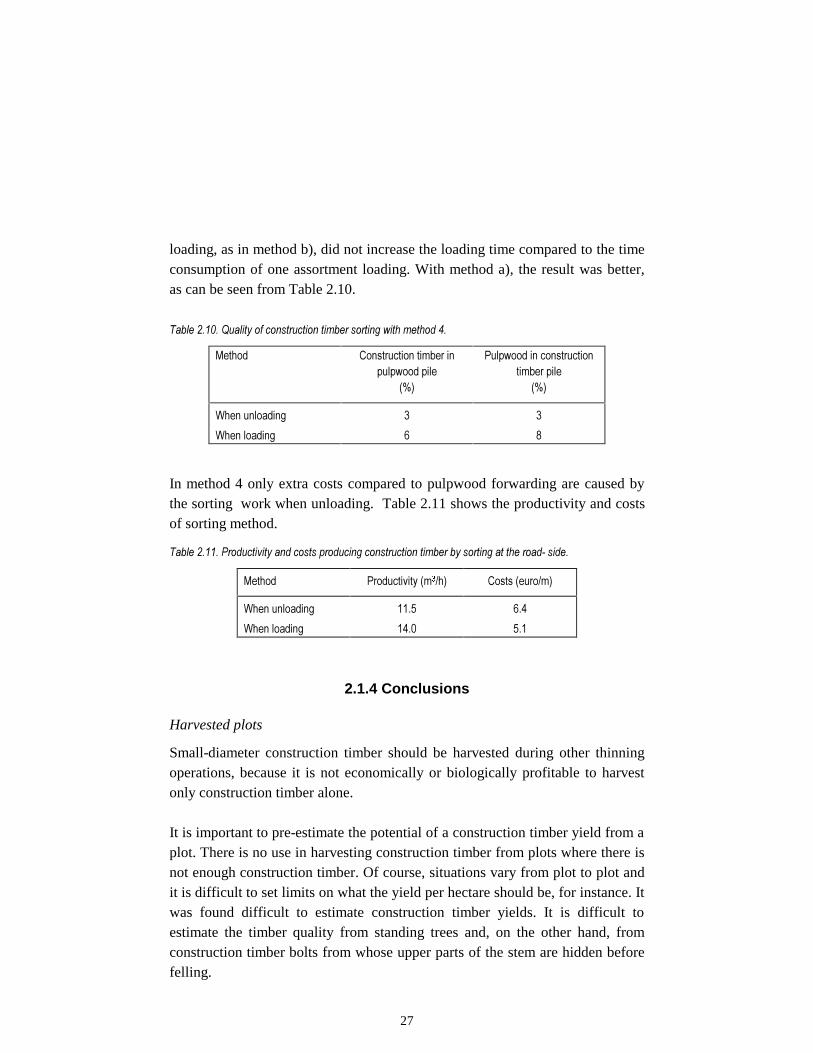
loading, as in method b), did not increase the loading time compared to the timeconsumption of one assortment loading. With method a), the result was better,as can be seen from Table 2.10.
7DEOH�������4XDOLW\�RI�FRQVWUXFWLRQ�WLPEHU�VRUWLQJ�ZLWK�PHWKRG���
0HWKRG &RQVWUXFWLRQ�WLPEHU�LQSXOSZRRG�SLOH
���
3XOSZRRG�LQ�FRQVWUXFWLRQWLPEHU�SLOH
���
:KHQ�XQORDGLQJ
:KHQ�ORDGLQJ
�
�
�
�
In method 4 only extra costs compared to pulpwood forwarding are caused bythe sorting work when unloading. Table 2.11 shows the productivity and costsof sorting method.
7DEOH�������3URGXFWLYLW\�DQG�FRVWV�SURGXFLQJ�FRQVWUXFWLRQ�WLPEHU�E\�VRUWLQJ�DW�WKH�URDG��VLGH�
0HWKRG 3URGXFWLYLW\��P��K� &RVWV��HXUR�P�
:KHQ�XQORDGLQJ
:KHQ�ORDGLQJ
����
����
���
���
2.1.4 Conclusions
Harvested plots
Small-diameter construction timber should be harvested during other thinningoperations, because it is not economically or biologically profitable to harvestonly construction timber alone.
It is important to pre-estimate the potential of a construction timber yield from aplot. There is no use in harvesting construction timber from plots where there isnot enough construction timber. Of course, situations vary from plot to plot andit is difficult to set limits on what the yield per hectare should be, for instance. Itwas found difficult to estimate construction timber yields. It is difficult toestimate the timber quality from standing trees and, on the other hand, fromconstruction timber bolts from whose upper parts of the stem are hidden beforefelling.

28
Comparing results with earlier research
In general, the harvesting costs of our study were about the same magnitude asdetermined in previous studies. Logger-felling costs in our study were about thesame as the average in Finnish pulpwood first thinnings (Mattila 1995). The realfelling and forwarding costs were also compared with simulated ones (Oijala &Örn 1995). The deviations in harvesting costs were very small, although theforwarding costs were smaller in this study.
Harvesting methods
It is difficult to say which method is best for construction timber harvestingbecause the best solution varies from case to case.
If we select the suitable trees from pulpwood piles, our costs are lower than withother methods and quality-price ratio is good. Harvesting costs are the samethan for pulpwood and only extra cost is bolt selection. On the other hand wecannot produce special dimensions and lengths. This is not a problem if ourdimension demand is about the same than pulpwood dimensions. Whenselecting, we have also to handle a lot of bolts that may be mentally andphysically hard work at least if we have a lot of selection work to do.
With manual harvesting the harvesting costs are the highest but also the boltquality is the best. Nearly every bolt fulfilled the quality demand. With manualharvesting it is also possible to grade the timber already when felling withsimple grading rules concerning knot size and radial growth. In order to preventpulpwood and construction timber from being mixed during transportationconstruction timber bolts should be marked on both ends, e.g. with chalk.
Manual pre-harvesting turned out to be unsuccessful according to this study.The reason for this was that, in the sample plot, there were not that many under-growing small trees that pre-harvesting would have been profitably. It alsoturned out that the method in which all construction timber is felled by a loggerand pulpwood by the harvester is unsure. The reason is that, before felling, it isdifficult to estimate whether the stem is construction timber quality or not.

29
If only the yields and costs are taken into account, mechanized harvesting seemsto be the most profitable way to harvest pulpwood and construction timberintegrally. But if good selection of construction timber is one criterion, the caseis different. Less than 80 % of the bolts fulfilled quality demands, whichincreased the price of suitable trees. The reason for the rejections was that theharvester operator could not see the tree quality from the cabin. Additionally,the tree-moving rollers of the harvester head destroyed the bolts. Pile selectionmay, of course, be done for mechanically harvested bolts.
2.2 Yield and quality in the first thinning
2.2.1 Introduction
Harvesting first thinnings is important but it has also encountered problems(Hakkila 1996, Heräjärvi 1998, Lämsä et al. 1990, Maa- ja metsätalous-ministeriö 1988, Vuokila 1976). Using pulpwood also for other products thanpulp may increase the profitability of first thinning. This may increase forestowners' willingness to harvest in their own forests. The problem withmechanical exploitation of pulpwood is that the selection for raw material mustbe made from the removed trees, whose quality is often bad.
The aim of this study is to find out how much small-diameter constructiontimber is available from first commercial thinnings in Finland. The tree speciesstudied were Scots pine (Pinus sylvestris) and Norway spruce (Picea abies).
When estimating the construction timber yield, the minimum length for thetimber was 2.4 m and the minimum diameter 5 cm. In addition, the stem had tolook straight. No rot, scars or vertical branches were allowed. For constructiontimber, the maximum diameter for knots was 30 mm and the minimum distancebetween knot whorls should be at least 15 cm.
This study is based on Ms Reeta Stöd's report submittted for her master's thesisat the University of Joensuu. Mr Jukka Pietilä reviewed the report and translatedit into English.

30
2.2.2 Material
Field inventory
We did our inventory in Southern-, Eastern- and Western-Finland. There areabout 56 % of young thinning stands in Finland and about 65 % of their volume.In each part we measured 20 stands, 60 all together. We carried out the fieldinventory in autumn 1997.
Our presumption was that the dominant tree species and ground fertility effectthe construction timber yield. Thus, we partitioned young thinning stands intosub-groups with the dominant tree species on the plot (pine or spruce) and thefertility division of Finnish forest tax-classes. The tax-classes are IA, IB, II, IIIand IV. In class IA sites fertility and tree growths are best and in class IV sitethe poorest. In sampling we put classes IA and IB together into one fertilitygroup and the rest of the classes into another group. Based on this division, wemade relative sampling of the sample plots in each region, according toPahkinen and Lehtonen (1989).
Plot measurements
Primarily we selected plots for measurements with data from forestrymanagement plans. The minimum area for a measured compartment was 0.5hectare. A main criterion was the need for first commercial thinning. Weinventoried only those compartments where there was a biological need forthinning.
Figure 2.5 shows the sample tree specia distribution of our field inventory.

31
Spruce28 %
Pine 68 %
Broad-leaved trees4 %
)LJXUH������6DPSOH�WUHH�VSHFLHV�GLVWULEXWLRQ�
In addition, we tried to select those compartments where the volume share of thedominant tree species was as high as possible.
We measured 3–8 sample plots in each compartment. The distance between theplots was 20 m. The sample plot was circular with a radius 3.99 m and area ofthus 50 m2. If the sample plot was treeless, broad-leaf dominant, rocky orotherwise unordinary for the site, the sample plot was deviated from as little aspossible.
All the stands we measured in Eastern-Finland were young thinning stands.Three of the stands in Southern-Finland were advanced thinning stands but theywere not thinned during past times. In Western-Finland we measured onemature stand whose tree stand was dense and diameter small and it had not beenthinned. In order to estimate the construction timber yield and quality, all pinesand spruces on the sample plots, whose breast-height diameter was 7 cm ofmore, were measured and estimated. The measured and estimated propertieswere
- breast-height diameter (diameter on 1.3 m high) - tree length - diameter of thickest knot

32
- quality of thickest knot - length of stem part suitable for construction timber - length of tree crown - height of lowest dead branch - heights for defect beginning and end. In addition we measured defects, and their heights, which have an effect on thetechnical quality of the stem. These are listed below: - twist - crook - corkscrew - vertical branches - rot - scar - knot whorls whose distance is less than 15 cm.
The length of stem twist was recorded. If the stem had small branch angles or otherdefects than mentioned before, they were written down. In order to help the furtheranalysis of tree quality data, we recorded those trees, which should be felled duringharvesting for quality reasons.
2.2.3 Methods
Thinning of sample plots
With the data we collected during the inventory, we selected those trees that shouldbe removed in an ordinary first thinning. Thus, we did not carry out the thinnings inreality. During thinning we did not try to maximize the yield of the constructiontimber, but the removed trees were selected as in an ordinary first thinning. Becausewe did not measure the trees’ co-ordinates on sample plots we could not identify theirlocations respective of each other during our theoretical thinning. Into the inventoryresults we marked those trees, that were in dense groups, so we could remove someof them in our theoretical thinning.
We selected the trees for thinning according to the quality-thinning principle.Whereby the trees removed should be not only the smallest ones but also trees withbig knots and low stem quality. In quality thinning, we did not pay too muchattention to yield but we tried to improve the quality of the stand for the future(Niemistö 1994, Lilleberg 1995).

33
Thinning model
We thinned our sample plots theoretically with thinning models presented byNiemistö (1992). In the thinning models, which are based on stem number as inNiemistö (1992), the mean diameter is the mean diameter of the stemsremaining after thinning. Because that was difficult to estimate before thinning,we harvested in several stages. After each stage we estimated whether thenumber of remaining trees fulfilled the thinning model demand or not.
In the first stage we harvested those trees that should be harvested for somemajor defect found in the field inventory. In the next stage we harvested stemsfor minor quality reasons and we paid attention to the combination of defectslike straightness, twisted butt and crook. Because the aim was quality thinningwe tried to leave those trees that had small branches growing.
If the two first stages were not enough to achieve the stem number of thethinning model, in the third stage we removed so many minor trees that the stemnumber was low enough.
Scaling of felled trees for cross-cutting and yield estimating
The heights of the 5, 7 and 9-cm top-diameter points were estimated from all theharvested stems with the taper curve of Laasasenaho (1982). The curve is basedon the breast-height diameter and tree length.
With crosscutting points and defect heights, we estimated those parts of thestems, that fulfilled the quality and dimensional demands of construction timber.If the construction timber was longer than the minimum 2.4-m length, weincreased its length by steps of 0.3 m if possible. Thus, possible bolt lengthswere 2.7, 3.0, 3.3-m etc. In this stage we tried to achieve a maximum yield forconstruction timber. Bolts other than construction timber bolts were graded forpulpwood if they fulfilled pulpwood quality and dimension demands, accordingto Tapion Taskukirja (1997).
All the stem parts, that fulfilled the construction timber quality demands wereincluded in the construction timber yield. We estimated the yield bycompartments and by tree species in cubic metres per hectare. The yield in cubic

34
metres was estimated with the volume estimates of Laasasenaho (1982). Thepulpwood yield was estimated in the same way. In the results we also show theyield for construction timber bolts whose lengths were 3, 4, 5 and 6 m, perhectare.
Total amount of construction timber
We estimated the total yield of construction timber by multiplying the area ofyoung thinning stands by the estimated yield per hectare. These calculationswere based on the dominant tree species and region. The Finnish ForestResearch Institute calculated the area of young thinning stands that should beharvested during the next 10 years. Their calculation is based on the nationalforest inventories.
2.2.4 Results
Thinning grade and quality of removed trees
In all the stands we obtained the stem numbers and mean diameters of theharvesting models. Before harvesting, the average stem number per hectare was2 000. In the south, the density was 2 000 stem/ha on average, in the east 2 200,and in the west 1 600 stem/ha. During harvesting we removed on average 800stems per hectare, in the south 1 000, in the east 1 200 and in the west 600 stemsper hectare.
Table 2.12 gives mean volumes and their minimum and maximum values ofunthinned compartments and also the volumes of unharvested and remainingtrees with their minimum and maximum values.

35
7DEOH��������7UHH�YROXPH�RI�FRPSDUWPHQWV�EHIRUH�WKLQQLQJ��\LHOG�DQG�YROXPH�RI�UHPDLQLQJ�WUHHV��P��KD�PHDQ��PLQLPXP��PD[LPXP�E\�GRPLQDQW�WUHH�VSHFLHV��WD[�FODVV��JHRJUDSKLFDOO\�DQG�E\�UHJHQHUDWLRQ�PHWKRG�
%HIRUH�WKLQQLQJ <LHOG 5HPDLQLQJ�WUHHV
3LQH �������������������� ������������������ ��������������������
6SUXFH �������������������� ������������������ ��������������������
,$�,% �������������������� ������������������ ��������������������
,,�,9 �������������������� ������������������ ��������������������
6RXWK �������������������� ������������������� ��������������������
(DVW �������������������� ������������������� ��������������������
:HVW �������������������� ����������������� ��������������������
&XOWLYDWLRQ �������������������� ������������������ ��������������������
1DWXUDO �������������������� ������������������ ��������������������
7RWDO �������������������� ������������������ ��������������������
Yield of round construction timber All samples
34 % of sample trees had a stem-part whose quality was suitable forconstruction timber. 23 % of removed trees fulfilled both the quality anddimensional demands for at least one construction timber bolt. Only from veryfew, 0.7 % of stems, was it possible to harvest two construction timber bolts.
The following tables show the results from all compartments. Tables 2.14–2.19show the yield of round construction timber by dominant tree species (pine,spruce), regeneration method (sawing, natural regeneration), tax-class (IA–IB,II–IV) and by region (South-, East- and West-Finland, see Figure 2.6). Tables

36
2.13 and 2.14 show the average share of construction timber yields from totaltree harvest and their minimum and maximum values.
)LJXUH�������'LYLVLRQ�RI�)LQODQG�LQWR�6RXWK���:HVW���(DVW��DQG�1RUWK�)LQODQG�
7DEOH��������$YHUDJH�\LHOGV�RI�URXQG�FRQVWUXFWLRQ�WLPEHU��P��KD��DQG�WKHLU�PLQLPXP�DQG�PD[LPXP�YDOXHV�E\GRPLQDQW�WUHH�VSHFLHV��WKH�PLQLPXP�GLDPHWHUV�IRU�FRQVWUXFWLRQ�WLPEHU�DUH������DQG���FP�
3LQH
������$Y�����������0LQLPXP��������0D[LPXP
6SUXFH
�������$Y�������������0LQLPXP�������0D[LPXP
��FP ��� � ���� ���� � ����
��FP ��� � ���� ���� � ����
��FP ��� � ���� ��� � ����

37
7DEOH��������6KDUH�RI�URXQG�FRQVWUXFWLRQ�WLPEHU�����IURP�WRWDO�KDUYHVW�\LHOG��PHDQ��PD[LPXP��PLQLPXP��E\WD[�FODVV��UHJHQHUDWLRQ�PHWKRG��GRPLQDQW�WUHH�VSHFLHV�DQG�UHJLRQ��0LQLPXP�GLDPHWHU�IRU�FRQVWUXFWLRQ�WLPEHULV���FP�
3LQH 6SUXFH 7RWDO
,$�,% ���������������� ����������������� ����������������
,,�,9 ����������������� ���������������� ����������������
6RXWK�)LQODQG ���������������� ���������������� ����������������
(DVW�)LQODQG ���������������� ���������������� ����������������
:HVW�)LQODQG ����������������� ����������������� �����������������
&XOWLYDWHG ���������������� ���������������� ����������������
1DWXUDO ����������������� ���������������� �����������������
7RWDO ���������������� ���������������� ����������������
The main reason for the unsuitability of the removed spruce stems forconstruction timber was butt sweep. This defect was found in 35 % of theremoved spruce stems. For pine stems one individual defect was not thatdominant.
The effect of site fertility and regeneration method on the yield was alsoanalyzed. Average yields (m3/ha) and standard errors for round constructiontimber by site fertility, regeneration method and volume (m3/ha) are illustratedin Figures 2.7–2.9 for all samples, but separately for pine and spruce. For pinethe best yields of round construction timber was gained from poor fertility and -naturally regenerated stands, where the volume was over 150 (m3/ha). Forspruce, the regeneration method does not have such a significant effect on theyield of round construction timber. The best yield of round spruce constructiontimber was found from a stand with rich fertility site and a high volume oftimber (> 200 m3/ha).

38
Richfertility
Poorfertility
0
5
10
15
20C
onst
ruct
ion
timbe
r(m
3 /ha) Pine
Spruce
Site fertility
)LJXUH�������7KH�HIIHFW�RI�VLWH�IHUWLOLW\�RQ�\LHOGV�RI�URXQG�FRQVWUXFWLRQ�WLPEHU�
Planted Natural0
5
10
15
20
25
Regenerationmethod
Con
stru
ctio
n tim
ber
(m3 /h
a) Pine
Spruce
)LJXUH�������7KH�HIIHFW�RI�UHJHQHUDWLRQ�RQ�\LHOGV�RI�URXQG�FRQVWUXFWLRQ�WLPEHU�
>250150-250<1500
5
10
15
20
25
30
Volume (m 3/ha)
Con
stru
ctio
n tim
ber
(m3/h
a) Pine
Spruce
)LJXUH�������7KH�HIIHFW�RI�YROXPH�RI�VWDQG�RQ�\LHOGV�RI�URXQG�FRQVWUXFWLRQ�WLPEHU�

39
Yield from best quarter of compartments
We grouped the inventoried compartments into four groups according to theirconstruction timber yield. We took the best quarter for further estimations. Inthe best compartments, the average share of construction timber was 32 % oftotal yield, with a variation of between 16–82 %. The average tree volume onthose compartments was 221.9 m3/ha (variation 80.8–353.0 m3/ha) prior toharvest, the harvest yield was 101.9 m3/ha (variation 28.0–187.0 m3/ha) onaverage, and after harvesting the tree volume was 125.3 m3/ha (variation 52.8–196.5 m3/ha).
Table 2.15 presents the construction timber yield in the best quarter ofcompartments (stem/ha) with three different minimum diameters. The tableshows how yield varies with changing minimum diameters.
7DEOH��������$YHUDJH�\LHOG�RI�FRQVWUXFWLRQ�WLPEHU�LQ�WKH�EHVW�FRPSDUWPHQWV��EROW�KD��ZLWK�HDFK�OHQJWK�GLDPHWHU�FRPELQDWLRQ��PLQLPXP�EROW�GLDPHWHU�LV���FP�
/HQJWK��P 'LDPHWHU��PP �� �� ��� ��� ��� ���
� � �� � � � �
� � �� �� � �� �
� � �� � � � �
� � �� � � � �
� � �� � � � �
� � �� � � � �
� � � � � � �
� � � � � � �
�� � � � � � �
�� � � � � � �
�� � � � � � �
Total amount of construction timber
Table 2.16 presents the total estimates for construction timber, which isavailable in Finland, excluding Lapland.

40
7DEOH��������(VWLPDWH�IRU�FRQVWUXFWLRQ�WLPEHU�\LHOG�IURP�)LQQLVK�\RXQJ�WKLQQLQJ�VWDQGV��H[FOXGLQJ�/DSODQG��*URXSLQJ�E\�UHJLRQ��GRPLQDQW�WUHH�VSHFLHV�DQG�WD[�FODVV��0LQLPXP�GLDPHWHU���FP��9DOXHV�DUH�LQ�������FXELFPHWUHV�
,$±,% ,,±,9
3LQH 6SUXFH 3LQH 6SUXFH
6RXWK ����� ������ ������ �����
(DVW ����� ����� ������ ����
:HVW ���� ����� ����� ����
Thus, the total amount of construction timber is about 7.7 million m3, 4.4million m3 pine, and 3.3 million m3 spruce with 5 cm minimum diameter. For aminimum diameter of 7 cm, these yields will decrease by about 15 %, that is, to3.7 million m3 for pine and to 2.8 million m3 with spruce. Further more, if weassumed that only the best quarter of compartments was worth harvesting, thecorresponding figures would be about 1.2 million m3 for pine and 0.9 million m3
for spruce.
2.2.5 Discussion
On average, the largest construction timber yields are found in compartments, inSouthern-Finland on fresh mineral soil forest sites, where spruce is dominantand which are naturally regenerated. But most of the compartments, whichbelonged to the best quarter concerning construction timber yield, were foundon poor mineral soils where pine was the dominant tree species. Concerning tax-classes, on sites IA–IB the yield was better on spruce-dominant sites and onsites II–IV on pine-dominant sites.
The technical quality of construction timber in tax classes II–IV was better thanin the other tax class. From compartments where natural regeneration has takenplace, we get better quality construction timber. The best stocks of constructiontimber were found on spruce stands on luxuriant mineral soils and pine standson oligotropic mineral soils, which are naturally suitable for these tree species.When comparing these naturally suitable stands, the yield from spruce stands isbigger compared with pine but there is a great risk of defects, like crooks andbutt twist. With pine stands on naturally suitable soil, the share of seriouslydefected, e.g. crooks and butt twist, stems is lower. Stand selecting has a great

41
effect on construction timber yield. In the best stands, our average constructiontimber yield is double compared with average yield. The problem is that wecould not find any good factors to determine the best ones, e.g. from forestryplans. The best way to determine the best ones is through some kind of fieldinventory.
We presume the estimated yield of construction timber to be about 8 million m3.We do not know how much of this is available when we also take into accountthe economic and logistic factors, but it is at least over 2 million m3 if weassume that the best quarter is worth harvesting.
With regard to the design of roundwood constructions, we favour the use ofbolts whose lengths are 3 m with a diameter of 10, 12.5 or 15 cm. If a span of 4m is needed, then the maximum diameters could be 10 or 12.5 cm. From theresults it seems that there are also some bolts available, whose diameter is 10 cmand length even 7 m available. These could be used for special purposes. Thesedimension combinations are naturally available without delivery problems.
2.3 Drying
The objective of drying research is to determine how adequate drying can beachieved, and what is the quality of dried wood. Experimental wood-dryingresearch was carried out in Austria (spruce) and Finland (spruce and pine).Natural seasoning and kiln-drying at two different temperatures were tested. Inaddition, other participants made observations concerning drying whenpreparing material for strength testing. Traditional techniques to determine thelocation of check by sawing a slit was used, but not as a research topic. Twistingwas measured on seasoned logs.
2.3.1 Seasoning
Finnish pine and spruce logs were harvested in April 1996 and piled in stacks atVAKOLA in an open place. The stacks were clear of the ground (first logsabout 50 cm above the ground). The logs were piled crosswise in layers andabout 5–10 cm apart from each other.
42
It was expected that the seasoning of thicker logs (140 mm < D < 160 mm) to18 % MC would be completed in August, and the seasoning of thinner logs (80< D < 100 mm) at end of June. Because of the exceptionally wet summer untilthe middle of July, the MC in most logs was over 20 % at the end of July.Therefore, the scheduled seasoning period was extended. August was warm anddry in Finland (the driest August for 160 years), and most of the logs had amoisture content of below 18 % at the end of August (26.8.96). Finally the logswere conditioned to the target moisture content.
All the logs had a wide crack (min. 5 mm) all along the length of the pole.
In Austria 150 spruce logs were seasoned, and finally stored inside a buildingfor 2 months in order to achieve the target moisture content of 10 %. The resultsare discussed in relation to high-temperature drying (Section 2.3.3).
Twisting
The Finnish logs were marked with parallel lines at both ends before drying, andthe twisting angle was measured after drying and conditioning.
Figure 2.10 shows the mean and standard error values for twisting (°/m)calculated for age-classes within samples separately for Norway spruce andScots pine. In addition, the mean moisture content of the sample is presented.Within the presented samples, the moisture content is constant along the agedistribution. Figure 2.10 clearly shows that twisting in older specimens issmaller both for Norway spruce and Scots pine. The data of Norway sprucesamples 1–150, with two moisture content levels (u = 14.8 % and 19.4 %),specially indicates that moisture content has a significant effect on twisting, i.e.a lower moisture content increases twisting.

43
0,5
1,0
1,5
2,0
2,5
3,0
3,5
5 10 15 20 25 30 35 40
Age (a)
Tw
istin
g (o
/m)
Spruce 1-150, u = 14,8 % Spruce 1-150, u = 19,4 %
Spruce 151-175, u = 20,5 %
0,5
1,0
1,5
2,0
2,5
3,0
3,5
5 10 15 20 25 30 35 40Age (a)
Tw
istin
g (o
/m)
Pine 1-25 and Pine 26-100, u = 20,0 % Pine 26-100, u = 14,3 %
Pine 101-125, u = 18,5 % Pine 126-150, u = 18,6 %
Pine 151-175, u = 20,3 % Pine 176-200, u = 19,3 %
Pine 201-225, u = 18,5 %
)LJXUH��������0HDQ�DQG�VWDQGDUG�HUURU�YDOXHV�IRU�WZLVWLQJ��LQ�GHJUHHV�SHU�PHWHU��FDOFXODWHG�IRU�DJH�FODVVHVZLWKLQ�VDPSOHV�RI�1RUZD\�VSUXFH��OHIW��DQG�6FRWV�SLQH��ULJKW��%RUHQ�������
The hypothesis for statistical analysis is that twisting is induced by both a youngage and a low moisture content. Regression models for twisting were madeseparately for Norway spruce and Scots pine. As a result, it is concluded thatform, processing method or origin of specimen do not have an effect on thetwisting, but as expected, age, grossgrain and moisture content do influencetwisting. The variables used were:
• a = age (a)• G = gross grain (mm/m)• T = twisting (o/m)• u = moisture content (%)
The linear regression model for Norway spruce is:
auGT /)28)(1(007604.0253.0)1lg( −++=+ (2.2)
The multiple coefficient of determination for the model (adjusted R2) is 0.20and the standard error (s) = 0.18.
The linear regression model for Scots pine is:
u
GaT
lg576.0
000774.0)1lg(116.0lg226.0926.0)1lg( 12
−+++−=+ ρ
(2.3)

44
The multiple coefficient of determination for the model (adjusted R2) is 0.26and the standard error (s) 0.18.
Below is shown the effect of age, gross grain and moisture content on twistingfor Norway spruce and Scots pine calculated by model (2.2) and (2.3),respectively.
0,5
1,0
1,5
2,0
2,5
3,0
3,5
4,0
5 10 15 20 25 30 35 40
Age (year)
Tw
istin
g (o
/m)
Pine, G = 25 mm/m, p12 = 440 kg/m3 and u = 12%
Pine, G = 25 mm/m, p12 = 440 kg/m3 and u = 18%
Spruce, G = 25 mm/m and u = 12%
Spruce, G = 25 mm/m and u = 18%
0,5
1,0
1,5
2,0
2,5
3,0
3,5
4,0
0 10 20 30 40 50
Gross grain (mm)
Tw
istin
g (o
/m)
Pine, a = 10 year, p12 = 440 kg/m3 and u = 18%
Pine, a = 25 year, p12 = 440 kg/m3 and u = 18%
Spruce, a = 10 year and u = 18%
Spruce, a = 25 year and u = 18%
0,5
1,0
1,5
2,0
2,5
3,0
3,5
4,0
10 12 14 16 18 20 22
Moisture content (%)
Tw
istin
g (o
/m)
Pine, a = 10 year, p12 = 440 kg/m3 and g = 25 mm/m
Pine, a = 25 year, p12 = 440 kg/m3 and g = 25 mm/m
Spruce, a = 10 year and G = 25 mm/m
Spruce, a = 25 year and G = 25 mm/m
0,5
1,0
1,5
2,0
2,5
3,0
3,5
340 360 380 400 420 440 460 480 500 520 540
p12 (kg/m3)
Tw
istin
g (o
/m)
Pine, a = 10 year, p12 = 440 kg/m3 and g = 25 mm/m
Pine, a = 25 year, p12 = 440 kg/m3 and g = 25 mm/m
)LJXUH�������7KH�HIIHFW�RI�DJH��GHQVLW\��JURVV�JUDLQ�DQG�PRLVWXUH�FRQWHQW�RQ�WZLVWLQJ�RI�SLQH�DQG�VSUXFHFDOFXODWHG�E\�(TQV�������DQG�������UHVSHFWLYHO\��%RUHQ�������
2.3.2 Kiln-drying at 70°C
For Finnish kiln-drying tests, the harvested pine and spruce logs were 1.2 mlong. The density (dry mass / green volume) of the pine logs in the drying testswas low (370 kg/m3) but the density of spruce (380 kg/m3) was near the averagein Finland. The logs were barked manually with barking knives and stored in a

45
freezer before the drying tests. The ends of the logs were closed withpolyurethane sealant (Sikaflex) to avoid moisture evaporation at the ends.
For measuring the twisting of the logs in drying both ends were marked withpins and parallel lines before drying. After drying the twisting angle wasmeasured.
After drying the number and length of cracks were measured. The cracks wereclassified according to the width: less than 1 mm, 1–3 mm, 3–5 mm and over5 mm. The purpose was to convert the visual appearance of the logs into anumerical form.
In the first 2 tests, (Table 2.17) the aim was to completely avoid cracking with amild drying at the stage when the surface moisture content had reached the fibresaturation point. The schedules were based on optimizing the drying stresseswith a drying simulation model so that creep would keep the drying stress belowthe strength of the surface. The result was less good: cracking could not beavoided at this temperature.
In the last 4 tests, the idea was to dry rapidly, especially in the beginning andthus cause a large number of small cracks. For this purpose, it is advantageousthat the logs are as cold as possible at the beginning of the drying (wintertime).

46
7DEOH���������3ULQFLSDO�GLIIHUHQFHV�XVHG�LQ�GU\LQJ�VFKHGXOHV�
7HVW�QXPEHU 3ULQFLSOH�RI�WKH�VFKHGXOH
� 0LOG�GU\LQJ�XQWLO�WKH�0&�LV�EHORZ�)63�WKHQ�IDVW�GU\LQJ
� )DVW�GU\LQJ�DW�EHJLQQLQJ�DQG�PLOG�ZKHQ�0&�RI�VXUIDFH�QHDU�)63
� $W�EHJLQQLQJ�ORZ�WHPSHUDWXUH�DQG�5+�IRU�DFKLHYLQJ�PLFUR�FUDFNV��IDVW�GU\LQJ�DW����&��PLOG�GU\LQJ�WR�OHW�WKH�VXUIDFH�FUHHS��PLQLPL]LQJ�FUDFN�ZLGWK�
� )DVW�GU\LQJ�DW�����&�ZLWK�ORZ�5+�DW�EHJLQQLQJ�IRU�DFKLHYLQJ�PLFUR�FUDFNV��PLOGGU\LQJ�WR�OHW�WKH�VXUIDFH�FUHHS��IDVW�GU\LQJ
� )DVW�GU\LQJ
� )DVW�GU\LQJ��VORZHU�GU\LQJ��FRQGLWLRQLQJ
Quality of kiln-dried logs
The average twist varied between 1.4 and 6.7 °/m when dried from green to endmoisture content (Table 2.19). The length reduction in kiln-drying to 12 % MCafter two weeks air seasoning was 0.5 mm/m for spruce logs and 0.7 mm/m forpine logs.
The end cracking does not differ from cracking in the middle of the logs,probably because of the protection of the ends with polyurethane sealant. Themeasured properties of the logs before (diameter, density, initial MC) and afterdrying (MC, twisting and cracking) are summarized in Tables 2.18 and 2.19.

47
7DEOH��������0HDVXUHG�SURSHUWLHV�RI�WKH�ORJV�EHIRUH�GU\LQJ�WHVWV�DQG�PRLVWXUH�FRQWHQWV�DIWHU�GU\LQJ�
7HVW 6SHFLHV ' 'U\LQJ 'HQVLW\ ,QLWLDO (QG 6XUIDFH &HQWUH
PP WLPH�K NJ�P� 0&�� 0&�� 0&�� 0&��
� 3LQH ��� ��� ��� ��� ���� ��� ����
3LQH ��� ��� ��� ��� ���� ��� ����
� 3LQH ��� ��� ��� ��� ���� ���� ����
6SUXFH ��� ��� ��� ��� ���� ���� ����
� 3LQH ��� ��� ��� ��� ���� ���� ����
6SUXFH ��� ��� ��� ��� ���� ���� ����
� 3LQH ��� �� ��� ��� ���� ���� ����
6SUXFH �� �� ��� �� ���� ���� ����
� 3LQH ��� ��� a�� ���� ��� ����
6SUXFH �� ��� a�� ���� ��� ����
� 3LQH ��� �������� ��� ��� ���� ���� ����
6SUXFH �� �������� ��� �� ���� ��� ����
7DEOH��������7ZLVWLQJ�DQG�FUDFNLQJ�LQ�GU\LQJ�WHVWV�
7HVW 6SHFLHV ' (QG�0& 7ZLVW 3HUFHQWDJH�RI�ORJV�ZLWK�FUDFN�ZLGWK
PP � ����P !�PP �±��PP �±��PP ���PP
� 3LQH ��� ���� �� �� �� �
3LQH ��� ���� �� �� �� ��
� 3LQH ��� ���� ����������� �� �� �� ��
6SUXFH ��� ���� ������������ �� �� �� ��
� 3LQH ��� ���� ����������� � � �� ��
6SUXFH ��� ���� ������������ �� �� ��� ��
� 3LQH ��� ���� �� ��� ��� ��
6SUXFH �� ���� � �� ��� ��
� 3LQH ��� ���� ����������� �� �� ��� ���
6SUXFH �� ���� ����������� �� ��� ��� ���
� 3LQH ��� ���� ��������������� �� �� ��� ��
6SUXFH �� ���� ��������������� �� ��� �� ���

48
Mild kiln-drying schedules resulted in some logs completely without cracks,but most of the logs included at least one large crack. The visual appearance wasnot what was aimed at.
Rapid kiln-drying schedules resulted in many small cracks and the visualappearance was acceptable. Other advantages of these schedules were short thedrying time and low total costs. Also, by rapid kiln-drying, some logs developedone or two large cracks. To avoid these, it is recommended to slow down thedrying rate after a rapid beginning so that the surface has time to creep. Thispartly diminishes the widening of the cracks. An effective conditioning periodafter the drying phase does narrow the cracks.
Compared to seasoning in open air in springtime, the kiln-drying is normallyquite mild, i.e. the relative drying stresses are lower than in open air. Based onthis fact, in the fifth test the logs were firstly seasoned after debarking in openair in a windy and sunny location until the desired micro cracking of the surfacehad taken place. After that, the drying was continued in the drying kiln toachieve an acceptable total drying time and a low moisture content.
Kiln-drying at 110°C
About 150 spruce logs, harvested in Austria in February 1997, were used forhigh-temperature drying according to the drying schedules, as specified in Table2.20. The number and size of cracks were recorded before and after kiln-dryingand the result is compared with natural seasoning.
The logs had then been stacked into 4 steel-devices that offered a safe pilingsystem. Between every layer stickers made of steel or wood were used. Onestack was put on a load cell, to control the loss of water according to the loss ofweight.

49
7DEOH��������'U\LQJ�VFKHGXOH�LQ�KLJK�WHPSHUDWXUH�GU\LQJ�
'U\LQJ�SKDVH 7HPSHUDWXUH (TXLOLEULXPPRLVWXUH�FRQWHQW
�(0&�
'U\LQJ�JUDGLHQW
8QWLO�ILEUH�VDWXUDWLRQ�SRLQW��)63� ����& ��� �
8QGHU�)63 ����& ��� �
8QGHU������(0& ����& �����
Sensors were installed for measuring and logging the temperature inside the logs(20 mm, 60 mm), on the surface, the air temperature of the chamber and thetemperature of the distance sensor. Also the relative air humidity and themoisture content of 9 logs at various depths were measured.
0
20
40
60
80
100
120
140
17-May 18-May 19-May 20-May 21-May 22-May 23-May 24-May 25-May 26-May
0
2
4
6
8
10
12
14
16
Temp-wood-60mm [°C] Temp-wood-20mm [°C] RH [%] Temp-air (°C) MC [%] EMC [%] crack [mm]
Heating Drying Conditioning Cooling
Fibre saturation point (depth 20 mm)
crack[mm]
Temp.MCEMCRH[%,°C]
High Temperature Drying - Process Data
)LJXUH��������0HDVXUHPHQWV�LQ�D�ORJ�GXULQJ�KLJK�WHPSHUDWXUH�GU\LQJ�
The target moisture content was 10 %. The complete kiln run (includingheating, drying, conditioning, cooling) lasted exactly 8 days. Two critical stagescould be identified during the drying process:

50
• Reaching of Fibre Saturation Point: This is the moment, when the stresses get too high for the material and thefirst checks appear or existing checks become deeper and wider.
• Cooling phase: The wood is still at a high-temperature, while the surrounding air is coolingdown. On the contact surface between the air and wood, the air begins toreheat. It is now able to take up humidity again. This causes a postdryingeffect, i.e. after reaching the planned moisture content, the wood driesagain. This was the reason why the final moisture content in the experimentis lower than the target (average 7.6 vs. 10 % ).
In high-temperature drying there is a practical problem concerning stickers: steelstickers penetrate into the logs, while wooden stickers last only one kiln run,because they become plastic and deform.
Comparison of the quality of seasoned and kiln-dried wood
An obvious difference caused by a high drying temperature is the change ofcolour: high-temperature dried logs are darker. The most important difference isthat the number and dimensions of the cracks are very small in comparison toseasoned logs. Comparing the percentage of cracks before and after high-temperature drying, it was found, that the number of checks wider than 0.2 mmdid not increase on a large scale.
The size of cracks after high-temperature drying differs clearly from the size ofcracks after seasoning, which included also 2 months’ indoor storage. Seasoningcaused at least one big crack (~ 6 mm) along the log, accompanied by onaverage 6 cracks > 0.2 mm. On the other hand, high-temperature drying onlycaused cracks not larger than 1.7 mm. On average, less than 4 cracks, largerthan 0.2 mm in size, developed per log.
The bending strength of high-temperature-dried logs is about 10 % lower thanthat of seasoned logs, but this did not change the proposed strength classaccording to EN 338.

51
2.3.3 Discussion on drying
Natural seasoning can be recommended as a drying method when there are noprecise quality requirements concerning final moisture content and cracking. Itshould also be noticed that drying cracks did not affect the bending strength ofthe timber.
The results clearly indicate that cracking during drying can be minimized by the useof high-temperature drying. When drying at temperatures between 60–70 °C,checking can be reduced a little from that during natural seasoning, but not asmuch as by the use of higher temperatures. The numerical results on thecracking of Austrian spruce at 110 °C are summarized in Table 2.21. TheFinnish results for seasoning are quite similar, even if the final moisture contentwas higher. It can be concluded that the total width of drying cracks around thegirth can be reduced from 3 % to 1 % of the girth circumference, and themaximum crack width decreases even more when high-temperature drying isused and the final moisture content is around 10 %.
It was observed during the high-temperature tests that the cracks had alreadybeen initiated before kiln-drying and that the number of cracks did not increasesignificantly during high-temperature drying, but the size of the cracksincreased. This suggests that even less cracking on the surface of round timbermight occur, if the high-temperature drying started before the first cracks hadappeared in seasoning while waiting for kiln-drying.
7DEOH�������&RPSDULVRQ�RI�VHDVRQLQJ�DQG�KLJK�WHPSHUDWXUH�GU\LQJ�RI�$XVWULDQ�VSUXFH�
'U\LQJ�PHWKRG )LQDO�0&
���
$YHUDJH�GLDPHWHU
�PP�
$YHUDJHPD[LPXP�FUDFNZLGWK��PP�
7RWDO�FUDFNV���JLUWK
���
6HDVRQLQJ � ��� � ���
�� ��� � ���
.LOQ�����°& � ��� � ���
� ��� � ���

52
Proposal for drying schedules
When high temperature drying cannot be used, some drying schedulesuggestions are presented as follows on the basis of the test dryings. The mainprincipal steps in the drying schedules are:
1. very fast drying at the beginning to achieve very many micro cracks 2. mild drying to allow the surface to creep 3. effective drying 4. conditioning with high RH.
Suggested air velocity through the stack > 3 m/s. Examples of suggestedschedules are given in Table 2.22.

53
7DEOH��������'U\LQJ�VFKHGXOH�VXJJHVWLRQV�IRU�VPDOO�URXQG�WLPEHU�
'LDPHWHU�a�����PP 'LDPHWHU�a�����PP
7LPH���K 7���& :%'���& 5+���� 7LPH���K 7���& :%'���& 5+����
� DPELHQW DPELHQW �� � DPELHQW DPELHQW ��
�� �� �� �� �� �� �� ��
�� �� �� �� �� �� �� ��
�� �� �� �� �� �� �� ��
�� �� �� �� �� �� �� ��
�� �� �� �� �� �� �� ��
��� �� �� �� ��� �� �� ��
��� �� � �� ��� �� � ��
��� �� � �� ��� �� � ��
(QG�0&� 3LQH ���� (QG�0&� 3LQH ����
6SUXFH ���� 6SUXFH ����
:%'� �:HW�%XOE�'HSUHVVLRQ
54
2.4 Oil impregnation and drying
Introduction
In order to find methods to improve surface quality of round timber after dryingin terms of checking, drying in hot oil was seen as potential. In addition, oilimpregnation can improve durability in external use. Therefore, experimentswith oil were started. Earlier treatment trials with small and large-size sawnwood dimensions showed, that Tall oil-based resins can penetrate into woodquite easily when mixed with organic solvents, such as turpentine or mineral oil-based "white spirit". However, such solvents are not favoured by the wood-treating industry and may cause environmental problems. In addition, theEuropean VOC directive sets new requirements for such impregnation plants,including solvent recovery, etc.
Hot-oil treatments, such as Boultonizing, patented by Sir Boulton in 1879, gavean opportunity to utilize non-volatile Talloil-based compounds without organicsolvent. At elevated temperature, the viscosity of resin compounds is loweredand penetration into wood can be considerably improved. A process of this typeavoids the need for air- or kiln-drying, and is applicable to wet or green timbertoo.
Material and methods
Round small-diameter green timber was chosen for the trials. Both Scots pineand Norway spruce timber species were included in the trials. The diameter ofthe wood was chosen to be around 10 cm with a round-piled surface quality inorder to detect the drying defects.
The initial and final moisture contents as well as retention of oil afterimpregnation were determined by the toluene extraction method. Thetemperature in oil and in timber was measured.
After drying, air pressure was applied to the treatment cylinder to force the oilto penetrate deeper into the wood. After 1 h, working pressure, the oil wasevacuated from the cylinder and 0.5 h final vacuum was drawn to improve thesurface dryness of the wood. The apparatus is shown in Figure 2.13.

55
CONDENSATECOLLECTOR
CONDENSERUNIT
VACUUMPUMP
HEATABLETREATMENTCYLINDER
PRESSUREPUMP
)LJXUH�������6FKHPDWLF�GUDZLQJ�VKRZLQJ�WKH�IXQFWLRQ�RI�GU\LQJ�DQG�WUHDWPHQW�DSSDUDWXV�
Most oils with boiling points above 150 0C and which do not distil together withwater are suitable for the Boultonizing process. From several Tall oilcandidates, PS 046 H (modified TOR+ ester mixture) was selected for scalingup. Primarily the selection was based on its liquid nature and secondly on thetest results of biological screening. Its boiling point is above 200 0C and it holdsthe original viscosity very well after several heating cycles.
Results and discussion
Optimized drying schedules are given in Figure 2.14.

56
T R I A L n o . 4 : p i n e ; v a c u u m - 0 . 7 . . . - 0 . 8 b a r
2 0
2 5
3 0
3 5
4 0
4 5
5 0
5 5
6 0
6 5
7 0
7 5
8 0
8 5
0 2 4 6 8 1 0 1 2 1 4 1 6 1 8 2 0 2 2 2 4 2 6 2 8 3 0 3 2 3 4 3 6 3 8 4 0 4 2 4 4 4 6 4 8 5 0 5 2
T i m e ( h )
Tem
pera
ture
(°C
)
P 4 : 5 0 m mP 4 : 2 0 m mo i la i r o u t s i d e
)LJXUH��������2SWLPL]HG�GU\LQJ�VFKHGXOH�IRU�URXQG�VPDOO�GLDPHWHU�6FRWV�SLQH�
In the drying experiments the variables studied were the height of the vacuum,temperature in the drying oil and drying time. The studied parameters wereadjusted to meet the boiling point of water. A high vacuum/low temperature didnot result in very good surface quality. Longitudinal, sometimes quite deepchecks appeared on the surface in most of the blocks. On the other hand, inexperiments with a lower vacuum/higher temperature the surface quality of mostblocks was excellent and without cracks.
Optimum results were obtained in a vacuum of -0.7...-0.8 bar and in an oiltemperature of +75...+80 0C (see Figure 2.14). The oven-dry density andmoisture content of the blocks before and after drying are given in Table 2.23.

57
7DEOH��������0RLVWXUH�FRQWHQW��KHDUWZRRG�SURSRUWLRQ�RI�SLQH�DQG�VSHFLILF�JUDYLW\�RI�EORFNV�
Wood Log no. Heartwood Density Drying Initial moisture Final moisturespecies area owen-dry time content content1)
(%) (kg/m3) (h) (%) (%)pine 2 18 442 19 96 59pine 10 19 424 19 81 -
spruce 12 - 494 19 66 -spruce 20 - 419 19 65 20
pine 3 18 406 25 104 69pine 9 6 401 25 98 38
spruce 13 - 391 25 43 20spruce 19 - 425 25 103 29
pine 4 4 384 48 107 14pine 7 20 416 48 114 21pine 8 19 372 48 119 18
spruce 14 - 449 48 56 17spruce 15 - 344 48 68 18spruce 16 - 432 48 40 13
���E\�PHDQV�RI�H[WUDFWLRQ�ZLWK�WROXHQH
During the drying, the oil penetrated only to the surface of timber.
Pressure treatment trials were carried out in order to get deeper penetration inthe wood. Trials showed that Scots pine could easily be treated through thesapwood zone. In the case of Norway spruce only very limited penetration couldbe achieved. The retention of oil in Scots pine after a typical full cell processvaried from 340 to 480 kg/m3. The retention level of treatment oil is directlydependent on treatment process. Using Rüping or Lowry processes will cut theretention, which is generally known and used by the impregnation industry.Figure 2.15 shows the quality of treatments achieved by hot-oil drying followedby normal vacuum/pressure treatment.

58
)LJXUH�������6FRWV�SLQH�DIWHU�GU\LQJ�DQG�WUHDWPHQW�SURFHVV�
Conclusions
The combination of drying and impregnation with hot oils resulted in roundtimber with outstanding quality. Drying defects could be avoided almost totallyand the process resulted in Scots pine rounds with full sapwood penetration.However, Norway spruce did not show good treatability.

59
3. Strength of small-diameter timber
Small-diameter round timber contains a large proportion of juvenile wood andknots, and has not been tested widely. These are the basic reasons why 1400bending tests and a smaller number of compression and tension tests have beenundertaken in this research. The objective of the work was to determine thecharacteristic values needed in the design of load-bearing structures, to study thefeasibility of non-destructive methods in strength-grading, and to initiate aprocess for developing international standards for visual strength-grading ofround timber for structural use.
Special attention was given to the applicability of CEN standards, written forsawn timber, to round timber. The issues to be discussed include the strength-testing methods, strength classes and grading. Of particular interest is the effectof size on strength: a high proportion of juvenile wood in smaller sectionssuggests that strength could be lower when diameter is smaller, which iscontrary to the EN384 -size adjustment for sawn timber.
The research is summarized here. More detailed descriptions of the methods andresults can be found in other publications (Boren 1999, Boren & Barnard 1999,Gard et al. 1998, de Vries 1998, Patzelt 1998, Ranta-Maunus et al. 1998).
3.1 Testing methods
The strength test procedures were based as closely as practicable on EN 408:1995, which is intended for testing sawn timber. Some deviations from thestandard had to be adopted because of the round form and in some casesvariable diameter. With experience the test methods have been modified, and aproposal for the testing standard of round timber has been drafted (AppendixA). In the actual testing there were minor differences in the methods used by thedifferent participants. These differences are not believed to have significantlyinfluenced the results presented here and they are not detailed in this summary.

60
3.1.1 Bending tests
A four-point bending test was used to determine the modulus of elasticity (E)and the bending strength (fm) (Figure 3.2). In principle, the span was 18 timesthe diameter and the distance between two symmetrical loads was 6d. Localdeflection between the loads was measured for determining E. Someparticipants also measured global deflection to compare the values obtained forglobal and local E (Figure 3.1). Local E values are given in the results if nototherwise stated. The average diameter was used for the calculation of E. Forstrength determination the minimum diameter close to the failure location wasused for calculating of the bending stress.
6D 6D6D
5D
WL
F F
6D 6D6D
WG
F F
18D
)LJXUH������6FKHPDWLF�RI�EHQGLQJ�WHVW��/HIW��ORFDO�(��ULJKW��JOREDO�(�GHWHUPLQDWLRQ�
)LJXUH�������%HQGLQJ�VHW�XS�

61
3.1.2 Compression test
The compression test was also carried out in accordance with EN 408:1995, anda schematic layout is shown in Figure 3.3. Deformations for the determinationof E were measured using two LVDTs placed either side of the specimen in acentroidal plane. Two gauges were used in order that the centroidal movementcould be found in case of uneven load take-up or minor buckling.
The heavy loading equipment is shown in Figure 3.4. For determining thecompression strength, the load was increased until it started to drop. Often thefailure mode was local crushing, as illustrated in Figure 3.5.
LVDT4 d6 d
F
)LJXUH�������6FKHPDWLF�YLHZ�RI�FRPSUHVVLRQ�WHVW�

62
)LJXUH�������+HDY\�ORDGLQJ�HTXLSPHQW�LV�QHHGHG�LQ�FRPSUHVVLRQ�WHVWV�
)LJXUH�������/RFDO�FUXVKLQJ�LQ�FRPSUHVVLRQ�

63
3.1.3 Buckling test
When a slender column is loaded axially, there is a tendency for it to deflectsideways. This type of instability is called flexural buckling. The strength ofslender members depends not only on the strength of the material but also on thestiffness and initial curving of the column.
The buckling tests performed by CTBA aimed to verify whether the calculationmethod proposed by EC5 can be directly applied to roundwood.
In order to maintain an axial load during the test and to reach as far as possiblethe ideal case of a two-hinged column, a mechanical system was used to forcethe timber pole ends in a one degree of freedom displacement: axialdisplacement of the machine. This mechanical system can be described as twoboundary holders, see Figure 3.6.
When using such a system, the considered length of a pole for bucklingcalculations is equal to its real length l0 reduced by (2×150 mm). In fact, theequivalent length of a corresponding ideal two-hinged column is between l0 and(l0 - 2×150 mm).

64
)LJXUH�������3ULQFLSOH�RI�WKH�PHFKDQLFDO�DUUDQJHPHQWV�IRU�EXFNOLQJ�WHVWV�
For cylindrical logs, three lengths were used: 1500 – 2000 mm and 3000 mm,and at least six logs for each group of (length, diameter) were tested. A total of48 pieces were tested.
Buckling tests were performed at a constant displacement rate and during 400seconds at least before the logs broke. The load (stress) versus time curve wasrecorded. The critical (or buckling) stress corresponds to the point where thiscurve starts to decrease.

65
3.1.4 Tension test
The test pieces were of full structural cross-section and of sufficient length toprovide a test length clear of the testing machine grips of at least 9 times thelargest cross-sectional dimension. The critical points were marked on each polebased on NDT measurements (see section 3.1.6). CTBA then positioned thislocation, when possible, in the centre of the tested length. Special grips weredesigned for this test, an illustration of which is shown in Figure 3.7. The gripswere especially designed for use with cylindrical specimens. The principle ofgripping consists of increasing the grips pressure on the round timber as thetensile load increases. This ensures that no slipping appears during the test untilthe piece breaks.
The tensile strength and modulus of elasticity were calculated using the sameprinciples as proposed for the compression tests in EN408.
)LJXUH�������,OOXVWUDWLRQ�RI�WKH�JULSV�IRU�WHQVLRQ�WHVWV�E\�&7%$�

66
3.1.5 Dynamic modulus of elasticity
Most of the machine-graded timber available today is graded from bendingstiffness. The timber is centrally loaded between supports to cause a deformationfrom which the stiffness of the cross-section is calculated and used as a gradingparameter. An alternative way to determine the stiffness is based on therelationship between the frequency of a freely vibrating piece of timber and itsmodulus of elasticity. Since this method is independent of specific geometryproblems such as curvature and taper it may prove to be a suitable method for thegrading of small-diameter roundwood (de Vries 1998).
A relatively cheap and quick way of measuring the stiffness of timber is basedon the relationship between the eigenfrequency for the free-free condition of aspecimen and its elasticity. A lot of research work has already been done in thisarea (Görlacher 1984, Hearmon 1966, Hu and Hsu 1996, Perstorper 1994). Thismethod is based on the Euler beam theory for free flexural vibrations ofprismatic beams. The eigenfrequency of a material specimen is the basicvibration of the whole specimen at normal mode. The vibration can be initiatedby a longitudinal or transverse impact. Due to the geometry and mass of thesamples and test arrangement considered, the longitudinal vibration method wasapplied (Figure 3.8). Longitudinal vibrations of beams with small cross-sectionswith respect to length are not significantly influenced by shear and torsiondeformations.
The fundamental relationship is given by the differential equation
2
2
2
2
x
uE
t
u
∂∂=
∂∂ρ (3.1)
where u is longitudinal displacement, E the modulus of elasticity and ρ thedensity.
The modulus of elasticity may then be derived to be:
ρ224 flEdyn = (3.2)

67
where l is the length of specimen and f the eigenfrequency.
)LJXUH�������(�G\Q��WHVW�DUUDQJHPHQW�
High correlation between Edyn and Estat has been established for sawn timber(r=0.93) on the laboratory scale (Görlacher 1984). When applying the vibrationmethod under industrial conditions the correlation coefficient obtained is lower(Blass et al. 1995, Gard 1996). This method was used by TU Delft to larch polesas reported in Chapter 3.4.2.
3.1.6 X-ray density measurement
As part of a previous project, CTBA developed a continuous measurementsystem in order to grade structural sawn wood by means of an X-ray densitymeasurement along with a grading software (Figure 3.9). A high speed ofgrading (upto 200 m/min) can be achieved by this method. In this project, theequipment was used to grade small-diameter round timber and the software wasaccordingly modified. The method is based on the accurate measurement oflocal density: the end-resolution is ≈ 5 mm2 for a single data value.
The knots can be detected by this method since the knot density has an averagevalue of 2.5 higher than clear wood.

68
)LJXUH�������'HYLFH�RI�WKH�;�UD\�HTXLSPHQW�
The X-ray densimeter sets up a bi-dimensional cartography of a timber (Figure3.10) which allows the calculation of its density point by point. With thiscartography, a program calculates the densities and numbers of knots. In a firststage, a nodosity parameter allows us to assess the location of the more likelybending breaking point. With this calculation the software forecasts the locationof the centre of the bending trial.
The set of measured parameters allows us to assess the bending strength andstiffness of the beam by means of a correlation set up with the 1500 sawn timberbeams tested in an earlier project.
The sampling was composed of cylindrical Douglas fir poles from trees of anage from 10 to 17 years. Two diameters were studied : 80 and 120 mm, of 4 mlength. The X-ray machine performs a numerical radiography of the wood, so itprovides a cartography in which each point is linked to the wood mass for thisco-ordinate.

69
cm
)LJXUH��������0DS�RI�WKH�URXQGZRRG�GHQVLW\�

70
350
400
450
500
550
600
650
0 50 100 150 200 250 300 350 400
MV
BOIS
BRUT
Kg/m
cm
)LJXUH��������0HDQ�GHQVLW\�DORQJ�WKH�EHDP�IRU�D�URXQGZRRG�
350
400
450
500
550
600
650
0 50 100 150 200 250 300 350 400
MV BOIS
SAIN
0
10
20
30
40
50
60
0 50 100 150 200 250 300 350 400
KVR
cm
cm
%
Kg/m3
)LJXUH��������9DULDWLRQ�RI�WKH�GHQVLW\�RI�FOHDU�ZRRG�DQG�.95�SDUDPHWHU�DORQJ�WKH�URXQGZRRG�ORJ�
The cartography allows us to produce a curve of wood density centimetre bycentimetre, as if the log had been cut into discs of 1 cm in length and as if thedensity of each slice was measured (Figure 3.11). Based on this curve, thedensity information can be divided into two components: the clear wood density

71
(without knots) and the additional density caused by knots, which is used tocalculate the KVR (Knot Volume Ratio), the ratio of the volume of knots to thetotal wood volume, as illustrated in Figure 3.12. This method was applied byCTBA to Douglas fir (Chapter 3.4.3).
3.2 Materials and statistical methods
3.2.1 Sampling
Norway spruce (Picea abies), Sitka spruce (Picea sitchensis), Scots pine (Pinussylvestris), Larch (Larix kaempferi) and Douglas fir (Pseudotsuga menziesii F.),harvested in different countries and locations, were tested for the determinationof characteristic strength values. In Finland, Norway spruce samples wereharvested from two stands (fertile soils) located in Southern and EasternFinland. Scots pine samples were harvested from four stands in Southern andEastern Finland covering poor and fertile soils. In Holland, Larch was harvestedat a location in the eastern part of the Netherlands. In the UK Scots pine washarvested near Windsor; the sample is slightly atypical because the quality ofthe stems is particularly good. Sitka spruce was harvested from the KielderValley, close to the Scottish border and this sample is considered typical of theUK. In Austria, Norway spruce was harvested at two locations: in an alpine area(Salzkammergut, 650–850 m above sea level) and from a plain area (Innviertel,350–400 m). In France Douglas fir was harvested in the Limousin area(Platateau des Millevaches) 700 m above sea level.
From each stem, after debarking, milling and drying, a specimen for strengthtesting was prepared. When the length of stems allowed, bending andcompression specimens were made from the same stem. The numbers of round-pole specimens used for the bending, compression, buckling and tension testsare given in Table 3.1.

72
7DEOH�������7RWDO�QXPEHU�RI�URXQG�SROH�VSHFLPHQV�LQ�VWUHQJWK�WHVWV�
)LQODQG +ROODQG 8. $XVWULD )UDQFH %HQGLQJ
1RUZD\�VSUXFH 6LWND�VSUXFH
6FRWV�SLQH /DUFK
'RXJODV
���
���
���
��� ���
���
��� &RPSUHVVLRQ
1RUZD\�VSUXFH 6LWND�VSUXFH
6FRWV�SLQH /DUFK
'RXJODV
���
���
��
��� ���
���
7HQVLRQ 'RXJODV
��
%XFNOLQJ 'RXJODV
��
�2QO\�QDWXUDOO\�GULHG�VSHFLPHQV�DUH�LQFOXGHG�WKH�VWDWLVWLFDO�DQDO\VLV�SUHVHQWHG�LQ�WKLV�SDSHU� �)UHQFK�VWUHQJWK�WHVWLQJ�PDWHULDO�LV�QRW�LQFOXGHG�LQ�WKH�VWDWLVWLFDO�DQDO\VLV�SUHVHQWHG�LQ�WKLV�SDSHU�
3.2.2 Measured features of material
The quality of the tested timber was characterized by measurements. Suchvariables were recorded that could possibly affect the strength. These includedthe diameter, density, moisture content and several knot-related parameters. Thefollowing notations were used for the variables in the analysis:
• a = age (years), measured at or close to the failure point
• c = circumference of the specimen (mm), measured at or close to the failure point
• d = diameter of the specimen (mm), measured at or close to the failure point
• m = machine-processed timber surface (mm)
• ks = knot sum (mm), measured at or close to the failure point
• ks/c = KAR= knot sum per circumference (%), measured at or close to the failure
point
• ks/d = knot sum per diameter (%), measured at or close to the failure point
• mk = max. knot (mm), measured at or close to the failure point; measurement method
is shown in Figure 3.13.
• mk/d = max. knot per diameter (%), measured at or close to the failure point
• o = origin/species

73
• ob = over bark
• ρ12 = density at 12 % moisture content (kg/m3) at or close to the failure point
• ρ12, 0.05 = 5-percentile value of the sample for density at 12 % moisture content
(kg/m3)
• ρ12, k = characteristic value of the population for density at 12 % moisture content
(kg/m3) in accordance with CEN 384.
• p = processing method
• r = ring width (mm), measured at or close to the failure point
• s = length of sawn circumference (mm), measured at or close to the failure point
• s/c = length of sawn circumference per total circumference, measured at or close to
the failure point
• ss = sawn (plane) surface in compression and tension zone
• t = average taper (mm/m), tapering (to measure conical shape of specimen) only for
bending specimens
• u = moisture content, mass of water per dry mass (%), measured at or close to the
failure point
• ub = under bark, i.e. after processing.
For the calculated strength and stiffness values, the notations are used asfollows:
• Ec, 0 = modulus of elasticity in compression parallel to the grain (kN/mm2)
• Ec, 0, mean = mean value of the population for the modulus of elasticity in compression
parallel to the grain (kN/mm2)
• Em = modulus of elasticity in bending (kN/mm2)
• Em, mean = mean value of the population for the modulus of elasticity in bending
(kN/mm2)
• fc, 0 = compression strength parallel to the grain (N/mm2)
• fc, 0, 0.05 = 5-percentile value of the sample for compression strength parallel to the
grain (N/mm2)
• fc, 0, k = characteristic value of the population for compression strength parallel to the
grain (N/mm2)
• fm = bending strength (N/mm2)
• fm, 0.05 = 5-percentile value of the sample for the bending strength (N/mm2)
• fm, k = characteristic value of the population for the bending strength (N/mm2).

74
The diameter of the knots was measured around the circumference of the log i.e.at right-angles to the longitudinal direction of the specimen (Figure 3.13). Table3.2 summarizes the variables and values measured in the tested bending andcompression material. For Douglas fir, mainly X-ray measurements were made,and most of the features in Table 3.2 are not available.
Diameter of Specimen (mm)
Diameter of largest knot at the whorl (mm)
Point of failure at whorl
Test specimen
)LJXUH��������0HWKRG�XVHG�WR�PHDVXUH�NQRW�GLDPHWHU�

75
7DEOH�������0HDQV�DQG�VWDQGDUG�GHYLDWLRQV�RI�WKH�SURSHUW\�YDOXHV�LQ�URXQG�EHQGLQJ�PDWHULDO�
%HQGLQJ�PDWHULDO
0HDQ���VW��G�$XVWULDVSUXFH
)LQODQGSLQH�����������������VSUXFH
+ROODQGODUFK
8.�SLQH�����������������6LWND
1 �� ��� ��� ��� ��� ���
D ������� ������ ������� ������ ������
G �������� �������� �������� �������� �������� ��������
NV ������� ������� ������� ������� ������� �������
NV�G ������� ������� ������� ������� ������� �������
PN ������ ������ ������ ������� ������
S�� �������� �������� �������� �������� �������� ��������
U ��������� ������� ��������� ��������� ���������
W ����� ����� ����� ����� �����
X ���������� ���������� ���������� ���������� ����������&RPSUHVVLRQ�PDWHULDO
0HDQ���VW��G�$XVWULDVSUXFH
)LQODQGSLQH�������������VSUXFH
+ROODQGODUFK
8.SLQH��������6LWND
1 � ��� ��� �� ��� ���
D ������ ������ ������ ������ ������
G �������� �������� �������� �������� ��������
NV ������� ������� ������� �������
NV�G ������� ������� ������� �������
PN ������ ������ ������� ������
S�� �������� �������� �������� �������� ��������
U ��������� ��������� ��������� ��������� ���������
X ���������� ���������� ���������� ���������� ����������
The cumulative frequencies of the most important physical features for thebending and compression material are illustrated in Figures 3.14 and 3.15,respectively, in order to compare the tree species samples. Between the treespecies there is a large variation both in their mechanical and physicalproperties. In addition, a variation within the tree species samples is not equal.Even 5-percentile or mean values are not equal in most cases. Therefore, any

76
broad conclusions about similarities or differences between tree species cannotbe determined without proper statistical analysis. The Finnish material, bothNorway spruce and Scots pine, seems to be the most comprehensive covering alarge range and variation of the physical properties and including twice as manyspecimens as the others.
0
10
20
30
40
50
60
70
80
90
100
250 300 350 400 450 500 550 600 650
Density at 12% MC, kg/m3
Cu
mu
lati
ve f
req
uen
cy
FIN Scots pine UK Scots pine FIN Norway spruce
A Norway spruce UK Sitka spruce NL Larch
0
10
20
30
40
50
60
70
80
90
100
1,0 2,0 3,0 4,0 5,0 6,0 7,0
Ring width, mm
Cu
mu
lati
ve f
req
uen
cy
FIN Scots pine UK Scots pine FIN Norway spruce
UK Sitka spruce NL Larch
0
10
20
30
40
50
60
70
80
90
100
60 80 100 120 140 160 180
Diameter, mm
Cu
mu
lati
ve f
req
uen
cy
FIN Scots pine UK Scots pine FIN Norway spruce
A Norway spruce UK Sitka spruce NL Larch
0
10
20
30
40
50
60
70
80
90
100
0 25 50 75 100 125
Knot sum per diameter, %
Cu
mu
lati
ve f
req
uen
cy
FIN Scots pine UK Scots pine FIN Norway spruce
A Norway spruce UK Sitka spruce NL Larch
)LJXUH��������&XPXODWLYH�IUHTXHQFLHV�RI�URXQG�EHQGLQJ�PDWHULDO�E\�VSHFLHV�

77
0
10
20
30
40
50
60
70
80
90
100
250 300 350 400 450 500 550 600 650
Density at 12% MC, kg/m3
Cu
mu
lati
ve f
req
uen
cy
FIN Scots pine UK Scots pine FIN Norway spruce
UK Sitka spruce NL Larch
0
10
20
30
40
50
60
70
80
90
100
1 2 3 4 5 6 7 8
Ring width, mm
Cu
mu
lati
ve f
req
uen
cyFIN Scots pine UK Scots pine FIN Norway spruce
UK Sitka spruce NL Larch
0
10
20
30
40
50
60
70
80
90
100
60 80 100 120 140 160
Diameter, mm
Cu
mu
lati
ve f
req
uen
cy
FIN Scots pine UK Scots pine FIN Norway spruce
UK Sitka spruce NL Larch
0
10
20
30
40
50
60
70
80
90
100
0 25 50 75 100 125 150
Knot sum per diameter, %
Cu
mu
lati
ve f
req
uen
cy
FIN Scots pine UK Scots pine
FIN Norway spruce UK Sitka spruce
)LJXUH��������&XPXODWLYH�IUHTXHQFLHV�RI�URXQG�FRPSUHVVLRQ�PDWHULDO�E\�VSHFLHV�
3.2.3 Statistical methods
The main statistical method is regression analysis. Because a regression modelis not supposed to contain independent variables, which are strongly correlatedto each other (Bowerman and O’Connell 1990), a correlation analysis wasperformed before a linear regression analysis.
The standard, EN 384 (1995), states adjustment factors for the properties Ec,0,Em, fc,0 and fm with regard to moisture content and size, assuming no otherinformation is available. To validate these factors and to study the significanceof the various features for strength and stiffness of round timber, they have beenanalyzed by multiple regression analysis. This information was used as a basis

78
for visual strength-grading. In the multiple regression analysis Ec,0, Em, fc,0 and fm
were used as dependent variables. In addition, the multiple regression techniquewas used to study if there is an interaction between the variables, such as timbersize and the knots.
Linear regression analysis was performed in general such that the regressionequation was of the form
y c c xi i= + ∑ (3.3)
where y is the dependent variable, xi are the independent variables, c is theconstant of the model and ci are the multipliers of the independent variables. Insome cases it was observed that taking a logarithm of the dependent variableimproved the homoscedasticity of the model (Bowerman and O´Connell 1990).Accordingly, a second type of regression equation studied was
log10 y c c xi i= + ∑ (3.4)
When predicting values by the logarithmic model, the factor ε was added to theconstant c such that:
ε = 0.5×(s2×ln(10)) (3.5)
where s = the standard error of the logarithmic model. This improves theaccuracy of the model and eliminates possible systematic error (Meyer 1941).
As an example, the analysis of similarity of the bending strength of differentspecies is presented here in detail. Other statistical analyses have been made in asimilar way, and only the models are summarized in Chapter 3.3. More detailscan be found in the paper by Boren (1999).
From strength testing material it was tested whether tree species had differencesin their mechanical properties, when physical properties are similar, thehypothesis being that there are no differences; H0: multiplier for variable treespecies (o) is zero.
H0 can be tested by normal t-test. The effect of o was tested by the multiple

79
regression analysis for Ec, 0, Em, fc, 0 and fm, results for fm being as follows:
urd
ksBfm 63.0lg5.30104.0 −−−= (3.6)
where
B= 99.2 for larch86.3 for Norway and Sitka spruce81.9 for Scots pine
The F-value of Model is 222.5. The multiple coefficient of determination for themodel (adjusted R2) is 0.60 and the standard error (s) 9.826. All the multipliersincluded in the model are significant and the basic statistical assumptionsbehind the regression model are fulfilled. The regression model characteristicsare given in Table 3.3, and residual picture is shown in Figure 3.16.
7DEOH�������5HJUHVVLRQ�PRGHO�FKDUDFWHULVWLFV�IRU�EHQGLQJ�VWUHQJWK�
�����&RQILGHQFH�LQWHUYDO�IRU�%
9DULDEOH % 6WG��(UURU W 6LJ� /RZHU�%RXQG 8SSHU�%RXQG
FRQVWDQW ���� ��� ���� ���� ���� �����
NV�G ������ ����� ���� ���� ������ ������
OJ�U ����� ����� ����� ���� ����� �����
SLQH ����� ����� ����� ���� ����� �����
VSUXFH ����� ����� ����� ���� ����� �����
X ����� ����� ���� ���� ������ ������

80
Predicted Value
90807060504030
Res
idua
l
60
40
20
0
-20
-40
-60
Observed Cum Prob
1,00,75,50,250,00
Exp
ecte
d C
um P
rob
1,00
,75
,50
,25
0,00
)LJXUH��������5HVLGXDO�SLFWXUH�DQG�QRUPDO�SUREDELOLW\�SORW�IRU�PRGHO�IP
�
3.2.4 Hypotheses of the mechanical properties of round timber
The hypotheses to be tested in statistical analysis are as follows:
1. Mechanical properties and relations of different mechanical properties ofsmall-diameter round timber (pith included) are comparable to sawn timber.Therefore the same strength-related EN standards could be applied to theround timber as to the sawn timber.
2. When keeping the round shape in processing instead of rectangular, the knotangle (angle between specimens surface and knot) is optimum, so that theknot area is minimized on the specimen’s surface. Therefore, round timberhas a lower KAR on average than the sawn timber.
3. Because of the round form, the bending strength of round timber should behigher than that of sawn timber. Also, because of the unprocessed wood,hand-debarked timber should have better mechanical properties thanmachine-processed timber.
4. Regardless of species (conifer family), round timbers have similarmechanical properties, whilst their physical properties are the same.
5. Because of the large extent of juvenile wood, there is no negative size effecton the bending strength in small-diameter round timber. For the same reason,

81
age especially has an effect on the compression strength.
6. Strength-grading is possible to carry out by visually assessing the knot-related parameters and ring width.
The hypotheses have been verified by actual measured results of physical andmechanical properties and by statistical methods.
3.3 Strength results
3.3.1 Overview of results
The strength and stiffness values obtained in the bending and compression testsare summarized in Table 3.4, where the mean values and standard deviations aregiven. Cumulative distributions are shown in Figures 3.17 and 3.18. Bendingstrengths are high, lower 5th percentile ranging from 35 to 60 N/mm2, all themean values exceeding 50 N/mm2. Tension tests were made only for Douglasfir. The 50 tension tests resulted in a mean value of 29 N/mm2 and a 5thpercentile value of 16 N/mm2. There is strong evidence that the NL larch has thebest mechanical properties among the tested material.
7DEOH�������0HDQV�DQG�VWDQGDUG�GHYLDWLRQV�RI�EHQGLQJ�DQG�FRPSUHVVLRQ�YDOXHV�RI�WHVWHG�URXQG�WLPEHU�DW�WHVWPRLVWXUH�FRQWHQW�
6SHFLHV�FRXQWU\ IP
IF���
(P
(F���
6FRWV�SLQH),1 ����������� ���������� ���������� ���������8. ���������� ���������� ���������� ����������
1RUZD\�VSUXFH$� ����������� ����������),1 ����������� ���������� ���������� ����������
6LWND�VSUXFH8. ����������� ���������� ���������� ����������
/DUFK1/ ����������� ���������� ����������
'RXJODV) ��������� ���� ����������� ������
���1DWXUDOO\�VHDVRQHG�PDWHULDO���&\OLQGULFDO�VSHFLPHQV��G� �����PP

82
0
10
20
30
40
50
60
70
80
90
100
20,0 30,0 40,0 50,0 60,0 70,0 80,0 90,0 100,0
Bending strength, N/mm2
Cu
mu
lati
ve f
req
uen
cy
FIN Scots pine UK Scots pine FIN Norway spruce
A Norway spruce UK Sitka Spruce NL Larch
0
10
20
30
40
50
60
70
80
90
100
6,0 8,0 10,0 12,0 14,0 16,0 18,0 20,0
Modulus of elasticity, kN/mm2
Cu
mu
lati
ve f
req
uen
cyFIN Scots pine UK Scots pine FIN Norway spruce
A Norway spruce UK Sitka spruce NL Larch
)LJXUH��������&XPXODWLYH�IUHTXHQFLHV�RI��EHQGLQJ�VWUHQJWK�DQG�PRGXOXV�RI�HODVWLFLW\�E\�VSHFLHV�DW�WHVWPRLVWXUH�FRQWHQW�
0
10
20
30
40
50
60
70
80
90
100
14 16 18 20 22 24 26 28 30 32 34 36 38 40 42 44 46 48
Compression strength, N/mm2
Cu
mu
lati
ve f
req
uen
cy
FIN Scots pine UK pine FIN Norway spruceUK Sitka spruce NL Larch
0
10
20
30
40
50
60
70
80
90
100
3 4 5 6 7 8 9 10 11 12 13 14 15 16 17 18 19 20
Modulus of elasticity in compression, kN/mm2
Cu
mu
lativ
e fr
equ
ency
FIN Scots pine UK Scots pine
FIN Norway spruce UK Sitka spruce
)LJXUH��������&XPXODWLYH�IUHTXHQFLHV�RI�FRPSUHVVLRQ�VWUHQJWK�DQG�PRGXOXV�RI�HODVWLFLW\�E\�VSHFLHV�DW�WHVWPRLVWXUH�FRQWHQW�
The moisture content in the the tests was mainly in the range from 10 to 20 %.The obtained values were adjusted to 12 % moisture content in accordance withstandard EN384: fc values were adjusted by 3 % and E by 2 % for everypercentage point difference in moisture content. No size adjustment was made.The lower fifth percentile values for strength were determined by the rankingmethod. The lower fifth percentile for density was determined based on normaldistribution.

83
The characteristic values were first calculated for all the tested material of allspecies and later (3.4.1.2) for the graded samples. The characteristic values forunsorted material are given in Tables 3.5 and 3.6.
The strength values are higher than were expected before testing. In particular,bending strength is considerably higher than would be obtained from unsortedsawn timber.
7DEOH�������%HQGLQJ�FKDUDFWHULVWLFV�DGMXVWHG�WR������0&�LQ�DFFRUGDQFH�ZLWK�(1������6L]H�DGMXVWPHQW�QRWXVHG�
6SHFLHV��FRXQWU\� 6DPSOHVL]H
ρPHDQ
>NJ�P�@ρ
��
>NJ�P�@IP�PHDQ
>1�PP�@IP���
>1�PP�@E\�UDQN
(P�PHDQ
>N1�P�@
6FRWV�SLQH��),1� ��� ��� ��� �� �� ����
6FRWV�SLQH��8.� ��� ��� ��� �� �� ����
6FRWV�SLQH��),1�8.��� ��� ��� ��� �� �� ����
VSUXFH��),1� ��� ��� ��� �� �� ����
VSUXFH��$���� ��� ��� ��� �� �� ����
ODUFK��1/� ��� ��� ��� �� �� ����
'RXJODV��)��� ��� ��� ��� �� �� ����
6LWND�VSUXFH��8.� ��� ��� ��� �� �� ��������'U\LQJ�E\�VHDVRQLQJ����'� �����PP��F\OLQGULFDO��.$5���������&RPELQHG�%ULWLVK�DQG�)LQQLVK�PDFKLQH�URXQGHG�
7DEOH�������&RPSUHVVLRQ�DQG�WHQVLRQ�FKDUDFWHULVWLFV�DGMXVWHG�WR������0&�LQ�DFFRUGDQFH�ZLWK�(1������6L]HDGMXVWPHQW�QRW�XVHG�
6SHFLHV��FRXQWU\� 6DPSOHVL]H
IF�PHDQ
>1�PP�@IF���
>1�PP�@IW�PHDQ
>1�PP�@IW���
>1�PP�@
6FRWV�SLQH��),1� ��� ���� ����
6FRWV�SLQH��8.� ��� ���� ����
SLQH��),1�8.� ��� ���� ��
VSUXFH��),1� ��� ���� ����
ODUFK��1/� �� �� ��
'RXJODV��)� ��� �� ��
'RXJODV��)� �� �� ��
6LWND�VSUXFH��8.� ��� ���� ����
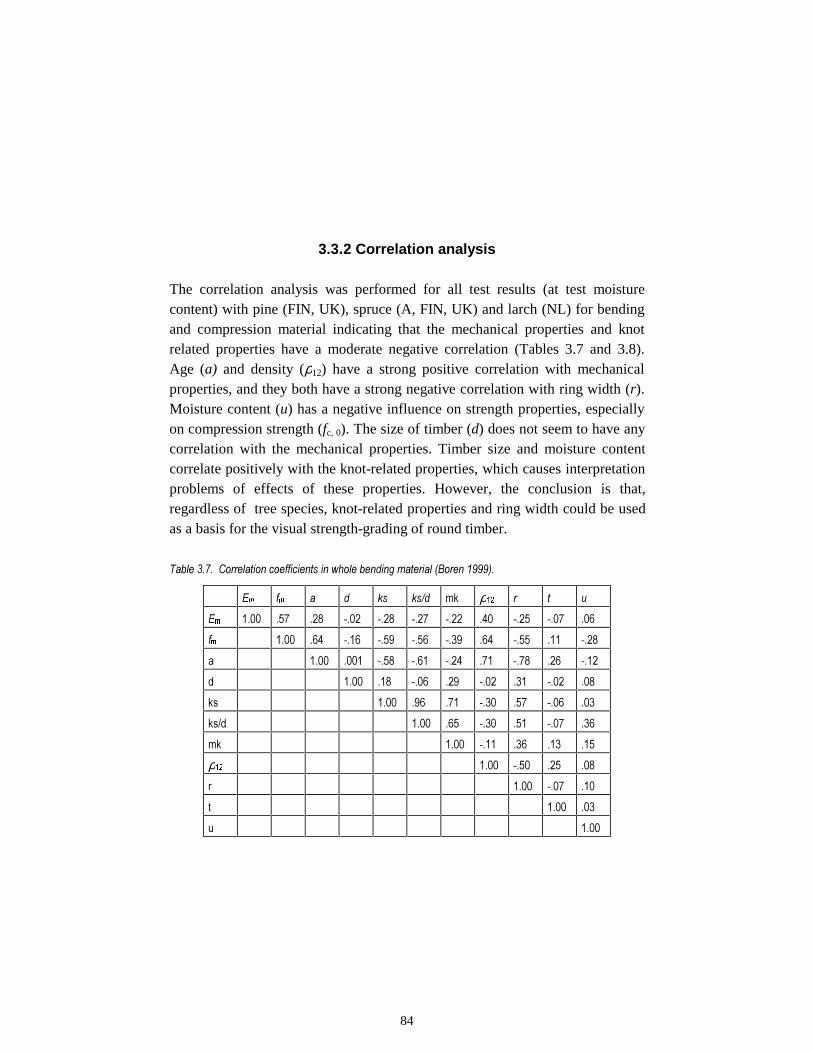
84
3.3.2 Correlation analysis
The correlation analysis was performed for all test results (at test moisturecontent) with pine (FIN, UK), spruce (A, FIN, UK) and larch (NL) for bendingand compression material indicating that the mechanical properties and knotrelated properties have a moderate negative correlation (Tables 3.7 and 3.8).Age (a) and density (ρ12) have a strong positive correlation with mechanicalproperties, and they both have a strong negative correlation with ring width (r).Moisture content (u) has a negative influence on strength properties, especiallyon compression strength (fc, 0). The size of timber (d) does not seem to have anycorrelation with the mechanical properties. Timber size and moisture contentcorrelate positively with the knot-related properties, which causes interpretationproblems of effects of these properties. However, the conclusion is that,regardless of tree species, knot-related properties and ring width could be usedas a basis for the visual strength-grading of round timber.
7DEOH�������&RUUHODWLRQ�FRHIILFLHQWV�LQ�ZKROH�EHQGLQJ�PDWHULDO��%RUHQ�������
(P
IP
D G NV NV�G PN ρ�� U W X
(P ���� ��� ��� ���� ���� ���� ���� ��� ���� ���� ���
IP ���� ��� ���� ���� ���� ���� ��� ���� ��� ����
D ���� ���� ���� ���� ���� ��� ���� ��� ����
G ���� ��� ���� ��� ���� ��� ���� ���
NV ���� ��� ��� ���� ��� ���� ���
NV�G ���� ��� ���� ��� ���� ���
PN ���� ���� ��� ��� ���
ρ�� ���� ���� ��� ���
U ���� ���� ���
W ���� ���
X ����

85
7DEOH�������&RUUHODWLRQ�FRHIILFLHQWV�LQ�ZKROH�FRPSUHVVLRQ�PDWHULDO�
(F���
IF���
D G NV NV�G PN ρ��
U X
(F���
���� ��� ��� ���� ���� ���� ���� ��� ���� ����
IF���
���� ��� ��� ���� ���� ���� ��� ���� ����
D ���� ��� ���� ���� ���� ��� ���� ����
G ���� ��� ���� ��� ��� ��� ����
NV ���� ��� ��� ���� ��� ���
NV�G ���� ��� ���� ��� ���
PN ���� ���� ��� ���
ρ��
���� ���� ����
U ���� ���
X ����
For sawn timber, the correlation coefficient between fm and Em is of interest,because mechanical strength-grading machines are based on that relationship.Although strength-grading machines do not exist for the round timbercorrelation between fm and lg Em for the whole tested material was calculated.The correlation coefficient is low (r2 = 0.38) compared to the correlationobtained for sawn timber (usually r2 = 0.6 - 0.8). A linear model between fm andEm has a little lower correlation (r2 = 0.32). These low correlations areinfluenced by mixed species, and also by the variability of test moisture contentand the inaccuracies of the dimensions of non-cylindrical specimens. Thecorrelation is higher for cylindrical, calibrated round specimens.
Figure 3.19 shows the scatter plot of density and ring width for the Finnishmaterial, and a fitted polynomial regression curve as a function of ring widthseparately for pine and spruce. When the ring width is higher than 5 mm thedensity does not seem to decrease any more. At a ring width 3 mm, the meandensity at MC 12 % is 480 kg/m3 for pine and 394 kg/m3 for spruce i.e. thedifference is 86 kg/m3. At a ring width 5 mm, the mean density at MC 12 % is431 kg/m3 for pine and 329 kg/m3 for spruce, i.e. the difference is about 102kg/m3.
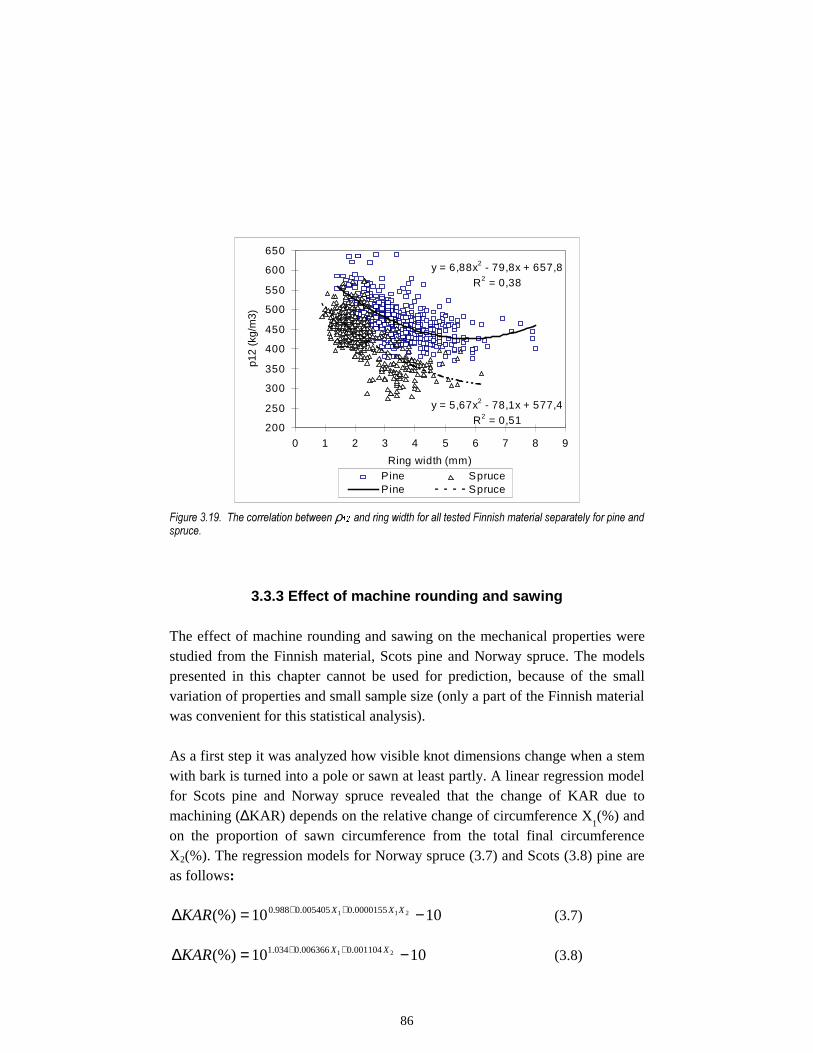
86
y = 6,88x2 - 79,8x + 657,8R2 = 0,38
y = 5,67x2 - 78,1x + 577,4R2 = 0,51
200
250
300
350
400
450
500
550
600
650
0 1 2 3 4 5 6 7 8 9
Ring width (mm)
p12
(kg/
m3)
P ine SprucePine Spruce
)LJXUH��������7KH�FRUUHODWLRQ�EHWZHHQ���DQG�ULQJ�ZLGWK�IRU�DOO�WHVWHG�)LQQLVK�PDWHULDO�VHSDUDWHO\�IRU�SLQH�DQGVSUXFH�
3.3.3 Effect of machine rounding and sawing
The effect of machine rounding and sawing on the mechanical properties werestudied from the Finnish material, Scots pine and Norway spruce. The modelspresented in this chapter cannot be used for prediction, because of the smallvariation of properties and small sample size (only a part of the Finnish materialwas convenient for this statistical analysis).
As a first step it was analyzed how visible knot dimensions change when a stemwith bark is turned into a pole or sawn at least partly. A linear regression modelfor Scots pine and Norway spruce revealed that the change of KAR due tomachining (∆KAR) depends on the relative change of circumference X
1(%) and
on the proportion of sawn circumference from the total final circumferenceX2(%). The regression models for Norway spruce (3.7) and Scots (3.8) pine areas follows:
1010(%) 211 0000155.0005405.0988.0 −=∆ ++ XXXKAR (3.7)
1010(%) 21 001104.0006366.0034.1 −=∆ ++ XXKAR (3.8)

87
The multiple coefficient of determination for the models (adjusted R2) is 0.25and 0.33, respectively.
The result is illustrated in Table 3.9, where it is shown that sawing results inhigher KAR than turning round, which corresponds to the expectations.
7DEOH������7KH�HIIHFW�RI�PDFKLQH�URXQGLQJ�DQG�VDZLQJ�RQ�.$5�RI�1RUZD\�VSUXFH�DQG�6FRWV�SLQH�
FRE
FXE
6 ∆.$5�����IRU�SLQH ∆.$5�����IRUVSUXFH
)RUP
��� ��� � ��� ��� 5RXQG
��� ��� ��� ��� 3DUWO\�VDZQ
��� ��� ��� ��� ��� 6TXDUHG�VDZQ
The change in the knot quality measured from dry, rotten or black knots over thebark to sound knots measured after processing for round timber is dependent onknot diameter, change of diameter of timber and rate of growth.
The effect of machine surface processing (machine debarking, sawing) incomparison to hand debarking was tested by multiple regression analysis for fm.The new variables used were:
• c = circumference at or close to the failure point (mm).• h = height (mm).• m = machine-processed circumference at or close to the failure point (mm).• KARm = knot sum of machine-processed surface per total circumference
(hand debarked: KARm = 0).• ss = sawn surface in compression and tension zone (round: ss = 0 and sawn:
ss = 1).• S = 1 for spruce, 0 for pine.
The model and result are shown below. Machine processing interacts with KAR,i.e. increasing the knot sum increases the negative effect of machine processing.The form of the specimen has affects the bending strength:

88
Sau
ssrKARhf mm
1212 0000519.00004686.0lg/008378.0
06238.0032.000262.0000874.084.1lg
ρρ +−−−−−−=
(3.9)
The F-value of the model is 159.5 and the multiple coefficient of determination(adjusted R2) is 0.70 .
Table 3.10 illustrates the effect of the form of the specimen, processing methodand tree species on the mechanical properties, when the same log is turned froma hand-debarked pole to squared sawn timber. Virtually, pine and spruce have adifferent density at similar ring widths. Therefore, the effects of form,processing method and tree species are presented for pine and spruce at thesame ring width value and different density (lower for spruce). The tableindicates that, at the same ring width, spruce is weaker because spruce has alower density.
7DEOH��������7KH�HIIHFW�RI�SURFHVVLQJ�PHWKRG�DQG�IRUP�RI�VSHFLPHQ�RQ�WKH�EHQGLQJ�VWUHQJWK��U� ���PP�DQGX ������DFFRUGLQJ�WR�(TQ�������
D K 7RWDO
F
7RWDO
NV
.$5P
3LQH�IP
ρ�� ���
NJ�P�
3LQH�IP
ρ�� ���
NJ�P�
6SUXFH�IP
ρ�� ���
NJ�P�
6SUXFH�IP
ρ�� ���
NJ�P�
�� ��� ��� �� ��� ���� ���� +DQG�GHEDUNHG �� ��� ��� �� ��� ���� ���� 3DUWO\�VDZQ�DQG�KDQG
GHEDUNHG�LQ�WHQVLRQ�]RQH
�� ��� ��� �� ���� ���� ���� ���� ���� 0DFKLQH�URXQG �� ��� ��� �� ��� ���� ���� 3DUWO\�VDZQ�LQ�WHQVLRQ�]RQH
DQG�KDQG�GHEDUNHG
�� ��� ��� �� ���� ���� ���� ���� ���� 6TXDUHG�VDZQ
The bending strength and stiffness of round Finnish spruce (N=200) was alsocompared to sawn timber (Norway spruce 42 x 145) as tested in a NordicIndustry Fund project. Here, the sample size was about 600, covering all ofFinland. For testing and analysis, EN 338, EN 384, EN 408 and EN 518 wereapplied. The cumulative distributions of bending strength, modulus of elasticityand density are given in Figure 3.20. The density distributions are similar exceptthe lower 30 % of round timber, which clearly has a lower density than sawn

89
timber, the lower 5th percentiles of the distributions being 306 and 376 kg/m3,respectively. However, the modulus of elasticity of these two sets of materialare fairly similar, and the bending strength of round timber is higher, the lower5th percentiles being 35.4 and 27.7 N/mm2. If the low density material of roundtimber is disregarded so that the density distributions of sawn and round timberare similar, then the 5th percentile value of bending strength for round spruce isdouble the value of sawn spruce.
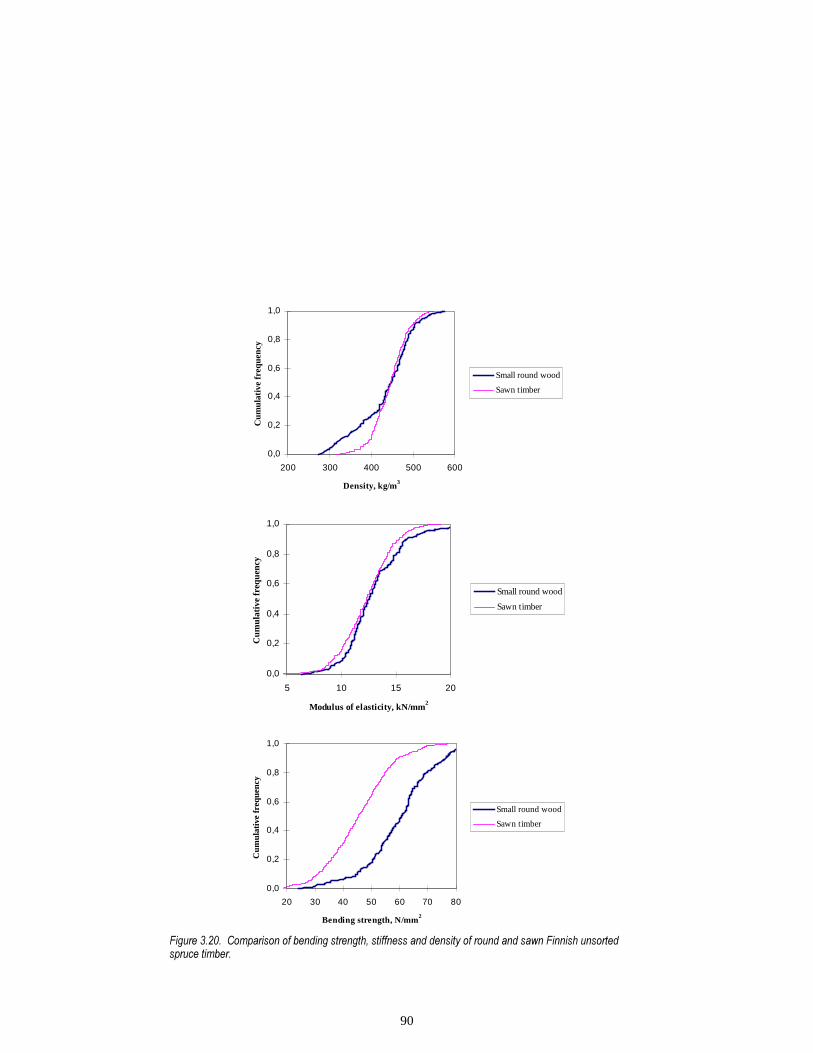
90
0,0
0,2
0,4
0,6
0,8
1,0
200 300 400 500 600
Density, kg/m3
Cum
ulat
ive
freq
uenc
y
Small round wood
Sawn timber
0,0
0,2
0,4
0,6
0,8
1,0
5 10 15 20
Modulus of elasticity, kN/mm2
Cum
ulat
ive
freq
uenc
y
Small round wood
Sawn timber
0,0
0,2
0,4
0,6
0,8
1,0
20 30 40 50 60 70 80
Bending strength, N/mm2
Cum
ulat
ive
freq
uenc
y
Small round wood
Sawn timber
)LJXUH��������&RPSDULVRQ�RI�EHQGLQJ�VWUHQJWK��VWLIIQHVV�DQG�GHQVLW\�RI�URXQG�DQG�VDZQ�)LQQLVK�XQVRUWHGVSUXFH�WLPEHU�

91
3.3.4 Differences between species
It was tested, whether the tree species had differences in their mechanicalproperties when their physical properties were similar, as described in Chapter3.2.2. The multipliers of the regression models are summarized in Table 3.11.The models for Em and fm cover larch, Scots pine, Norway spruce and Sitkaspruce, indicating that the bending strength of larch is 13 to 17 MPa higher thanthat of spruce or pine when the knot area ratio and annual ring width are similar.The models for Ec, 0 and fc, 0 cover Scots pine, Norway spruce and Sitka spruce.In compression, spruce is stronger than pine when density, knot area ratio andannual ring width are similar (see Figure 3.21).
7DEOH��������0XOWLSOLHUV�IRU�UHJUHVVLRQ�PRGHOV�LQFOXGLQJ�GLIIHUHQW�VSHFLHV�
9DULDEOH IP
OJ�(P
OJ�IF���
(F���
&RQVWDQW ���� ����� ���� ������ .$5 ������ �������� ��������� ������� OJ�U ����� ������ ������ ������ SLQH ����� �������
VSUXFH ����� VSUXFH �ρ��
��������� ������� ρ��
��������� ������� X ����� ����� 5� ���� ���� ���� ����
20253035404550556065707580
0 20 40 60KAR (%)
Str
eng
th (
N/m
m2)
fm pine fm spruce fm larch
fc, 0 pine fc, 0 spruce fc ,0 larch
2530354045
5055606570
758085
0 1 2 3 4 5 6Ring width (mm)
Str
eng
th (
N/m
m2)
fm pine fm spruce fm larch
fc,0 pine fc, 0 spruce fc, 0 larch
)LJXUH��������,OOXVWUDWLRQ�RI�WKH�HIIHFW�RI�.$5�DQG�ULQJ�ZLGWK�RQ�WKH�EHQGLQJ�DQG�FRPSUHVVLRQ�VWUHQJWK�RIVSHFLHV�ZKHQ�X� �������S
��
�����NJ�P��IRU�SLQH�DQG�VSUXFH�DQG�����NJ�P��ODUFK��U� ���PP�IRU�ODUFK�DQG��PP�IRU�SLQH�DQG�VSUXFH��RU�.$5� �������IRU�ODUFK�DQG�VSUXFH��DQG������IRU�SLQH�

92
3.3.5 Effect of diameter
The effect of diameter is also analyzed in tabulated form (Tables 3.12 and 3.13)in bending and compression. The mechanical properties are adjusted to 12 %moisture content in accordance with the EN 384 standard. For Em a clearpositive trend was observed, i.e. the values increase with the increasing diameterof round timber. For other mechanical properties, no positive or negative sizeeffect was observed, even when other physical properties were also taken intoaccount. The results of Douglas fir, not included in the statistical analysis,clearly show that bending strength and stiffness increases with increasingdiameter from 80 to 130 mm.
7DEOH��������7KH�HIIHFW�RI�GLDPHWHU�RQ��WKH�(P
�DQG�IP
��DGMXVWHG�WR������0&��RI�URXQG�WLPEHU�
G G IP
IP������
(P
X ρ��
NV PP PP 1�PP� 1�PP� N1�PP� � NJ�P� � UDQJH PHDQ PHDQ E\�UDQN PHDQ PHDQ PHDQ PHDQ
�6FRWV�SLQH 8.�),1
Q� ��� ������ �� ���� ���� ���� ���� ��� �� Q� ��� ��������� ��� ���� ���� ���� ���� ��� �� Q� ��� ������ ��� ���� ���� ���� ���� ��� �� 6SUXFH
$�),1�8.
Q� ��� ������ �� ���� ���� ���� ���� ��� �� Q� ���� ��������� ��� ���� ���� ���� ���� ��� �� Q� ���� ������ ��� ���� ���� ���� ���� ��� �� /DUFK Q� ��� ������ �� ���� ���� ���� ���� ��� �� Q� ��� ��������� ��� ���� ���� ���� ���� ��� �� Q� ��� ������ ��� ���� ���� ���� ���� ��� ��
'RXJODV Q� ��� �� �� �� ���� ��� ��� Q� ��� ��������� ��� �� ���� ���� ��� Q� ���� ��� ��� �� ���� ���� ��� Q� ���� ��������� ��� �� ���� ���� ���
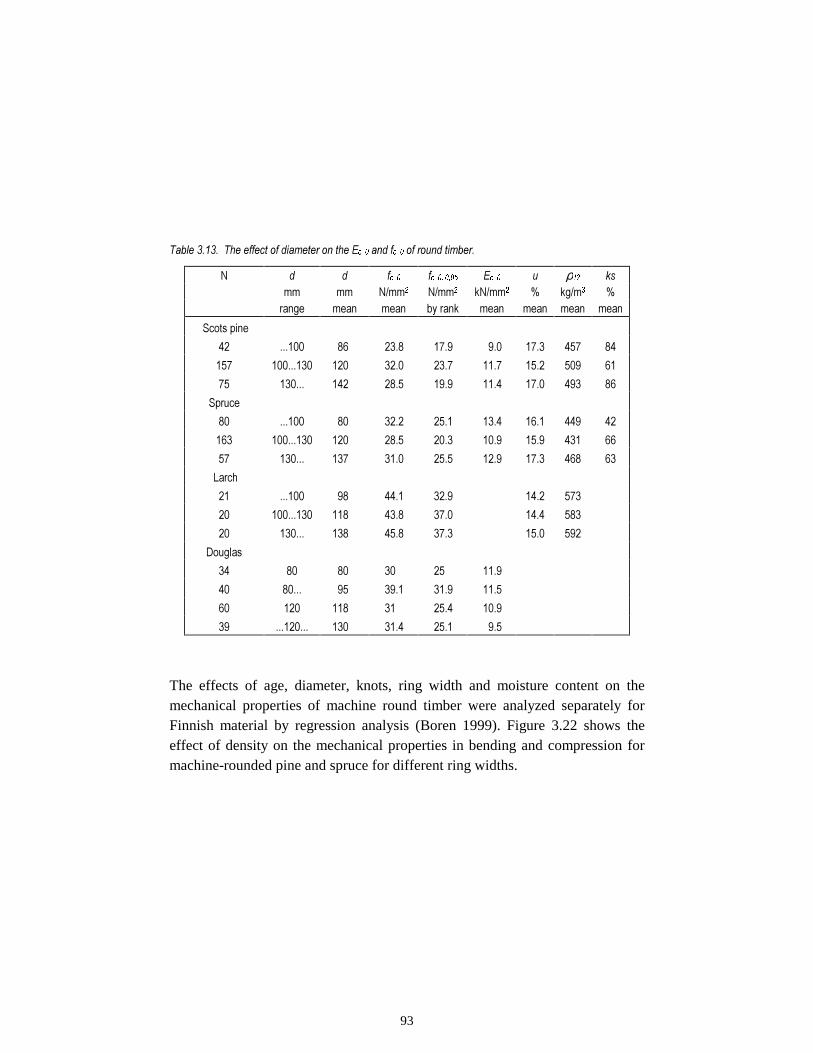
93
7DEOH��������7KH�HIIHFW�RI�GLDPHWHU�RQ�WKH�(F���
�DQG�IF���
�RI�URXQG�WLPEHU�
1 G G IF���
IF���������
(F���
X ρ��
NV PP PP 1�PP� 1�PP� N1�PP� � NJ�P� � UDQJH PHDQ PHDQ E\�UDQN PHDQ PHDQ PHDQ PHDQ
�6FRWV�SLQH �� ������ �� ���� ���� ��� ���� ��� �� ��� ��������� ��� ���� ���� ���� ���� ��� �� �� ������ ��� ���� ���� ���� ���� ��� ��
6SUXFH �� ������ �� ���� ���� ���� ���� ��� �� ��� ��������� ��� ���� ���� ���� ���� ��� �� �� ������ ��� ���� ���� ���� ���� ��� ��
�/DUFK �� ������ �� ���� ���� ���� ��� �� ��������� ��� ���� ���� ���� ��� �� ������ ��� ���� ���� ���� ���
'RXJODV �� �� �� �� �� ���� �� ����� �� ���� ���� ���� �� ��� ��� �� ���� ���� �� ��������� ��� ���� ���� ���
The effects of age, diameter, knots, ring width and moisture content on themechanical properties of machine round timber were analyzed separately forFinnish material by regression analysis (Boren 1999). Figure 3.22 shows theeffect of density on the mechanical properties in bending and compression formachine-rounded pine and spruce for different ring widths.

94
r=1mm
r=2mm
r=3mm
r=4mm
r=5mm
r=6mm
r=6mm
r=5mmr=4mm
r=3mm
r=2mm
r=1mm
4
6
8
10
12
14
16
250 300 350 400 450 500 550 600 650
Density (kg/m3)
Stif
fnes
s (k
N/m
m2)
Em (pine) Em (spruce)
Ec,0 (pine) Ec,0 (spruce)
r=6mmr=5mm
r=4mmr=3mm
r=2mm
r=1mmr=6mmr=5mm
r=4mm
r=3mm
r=2mm
r=1mm
10
15
20
25
30
35
40
45
50
55
60
65
70
250 300 350 400 450 500 550 600 650
Density (kg/m3)S
tren
gth
(N/m
m2)
fm (pine) fm (spruce)
fc,0 (pine) fc,0 (spruce)
)LJXUH��������7KH�HIIHFW�RI�GHQVLW\�RQ�WKH�PHFKDQLFDO�SURSHUWLHV�LQ�EHQGLQJ�DQG�FRPSUHVVLRQ�IRU�PDFKLQHURXQG�SLQH�DQG�VSUXFH�DW�GLDPHWHU�����PP��.$5�LV��������DQG�PRLVWXUH�FRQWHQW������
The effect of diameter could not be observed, because the effects of growth rateand diameter are interrelated. Therefore, the effect of age was studiedseparately. The effect on the characteristic compression strength for the Finnishmaterial is illustrated in Figure 3.23, which clearly shows that a higher age giveshigher characteristic compression strength.

95
3
4
5
6
7
8
9
10
11
12
0 5 10 15 20 25
Age (a)
Ec,
0 (
kN/m
m2)
Grade A limits and u = 12% Grade A limits and u = 18%
Grade B limits and u = 12% Grade B limits and u = 18%
3,0
4,0
5,0
6,0
7,0
8,0
9,0
10,0
11,0
12,0
0 5 10 15 20 25
Age (a)E
m (
kN/m
m2)
Grade A limits and u = 12% Grade A limits and u = 18%
Grade B limits and u = 12% Grade B limits and u = 18%
8
10
12
14
16
18
20
22
24
26
0 5 10 15 20 25
Age (a)
fc, 0
(N
/mm
2)
Grade A limits and u = 12% Grade A limits and u = 18%
Grade B limits and u = 12% Grade B limits and u = 18%
25
30
35
40
45
50
55
0 5 10 15 20 25
Age (a)
fm (
N/m
m2)
Grade A limits and u = 12% Grade A limits and u = 18%
Grade B limits and u = 12% Grade B limits and u = 18%
)LJXUH��������7KH�HIIHFW�RI�DJH�RQ�VWUHQJWK�DQG�VWLIIQHVV�FDOFXODWHG�E\�UHJUHVVLRQ�PRGHOV�IRU�PDFKLQHURXQGHG�SLQH��)RU�ERWK�JUDGHV�JUDGH�$�DQG�%�OLPLWV�DUH�XVHG�IRU�ULQJ�ZLGWK�DQG�NQRWV��GHQVLW\�LV�����NJ�P�
DQG�GLDPHWHU�UDQJHG���«����PP�
The figure indicates a clear age dependence on compression properties andmodulus of elasticity. Effect on bending strength is not so obvious.
3.3.6 Buckling strength
The buckling test results for French Douglas Fir species were compared to thedesign equation

96
σ π λc crit yE, .05² * / ²= 0(3.10 )
with the slenderness ratio ( )λ λ ρy z l mm= = −0 2 150* / and the radius ofgyration ( ) ( )ρ π φ π φ φ= =* / / * / /
/ /4 1 2 2 1 264 4 4 .
48 tests with cylindrical specimens were carried out. Experimental values of thecompression and buckling tests, as a function of the slenderness ratio, werecompared to the calculated buckling stress as follows:
1- Buckling strength is calculated based on values of strength class C24: E0.05
= 7400 N/mm2. If the predicted value of σc,crit exceeds fc,0,k for the C24strength class, this later value is retained (fc,0,k = 21 N/mm2).
2- Buckling strength is calculated also based on the material values obtainedin this research: fc,0,k = 25.1 N/mm2 and E0.05 = 7700 N/mm2.
A comparison of these three cases is illustrated in Figure 3.24, which shows thatthe predicted values of the critical stresses are conservative. The figure indicatesthat the safety of slender round compression members is higher than the safetyof members where buckling is prevented.

97
0
10
20
30
40
20 40 60 80 100 120 140 160
Slenderness ratio
Experimental
Calculated for C24
Calculated for thismaterial
Calibrated logsBuckling (slenderness ratio > 50) and Compressive (slenderness ratio < 50) results
Cri
tica
l Str
esse
s (
N/m
m2 )
)LJXUH��������5HVXOWV�RI�EXFNOLQJ�WHVWV�DQG�FDOFXODWHG�EXFNOLQJ�VWUHVVHV�
3.4 Strength-grading
During the last 10 years grading systems for sawn timber have been developedand improved in order to increase the yield with respect to strength. Areasonable relationship has been found between the modulus of elasticity, somevisual features (knots, growth ring data) and the bending strength. Both visualand machine strength-grading are established in the wood industry, and the trendis now towards machine strength-grading.
Clearly, for small-diameter roundwood visual strength-grading systems need tobe established first. This is because visual grading is the cheapest method andless investment is needed, which is essential for when starting small businesses.Machine grading becomes possible for small-diameter roundwood, when its useas load-bearing material has increased and enterprises exist who are willing toinvest in order to increase the yield of their production.

98
In this research, both short-term and long-term objectives have been focusedupon. As a short-term objective, simple visual rules have been developed inorder to enhance the commercial use of small-diameter round timber as buildingmaterial. As a long-term objective, NDT methods have been studied, and it hasbeen shown that NDT is especially applicable for grading round timber.
3.4.1 Visual grading
In principle, every visible timber property or feature is suitable for strength-grading, provided that a relationship exists between the property and the strengthand stiffness. Some examples are: slope of grain, annual ring width, knots, wane,distortions and decay caused by micro-organisms.
Grading rules that apply limits to visible properties enable the prediction of thestrength of a piece of timber based on established relationships between the visiblefeatures and the member strength. Visual strength-grading is therefore defined asclassifying timber according to its strength, based on statistical relationshipsbetween visible features and the load-carrying capacity.
Based on the experience with sawn timber, there are some disadvantages in visualgrading (Blass et al. 1995), for instance, the relatively weak relationship betweenthe measured parameters and the strength, e.g. correlation (r-value) factors forknots about 0.5, ring width 0.4 (Görlacher 1990). Extensive research is necessaryto determine visual grading parameters that will enable the wood industry toclassify small-diameter roundwood. Different species are likely to need differentlimits for grading parameters.
3.4.1.1 Determination of visual grades
Based on the statistical analysis of strength data performed by the differentparticipants, a selection of visual strength-grading parameters was made:maximum knot-size per diameter, knot sum per diameter and maximum growthring width, and preliminary limits for these parameters were set. A synopsis ofthe grading criteria based on this research is given in Table 3.14. A proposal fora grading standard was drafted and is published as Appendix B.

99
7DEOH��������3UHOLPLQDU\�YDOXHV�IRU�PDLQ�VWUHQJWK�JUDGLQJ�FULWHULD�RI�URXQG�6FRWV�SLQH��1RUZD\�VSUXFH�DQGODUFK�WLPEHU�
6WUHQJWK�JUDGLQJ�FULWHULD
*UDGH�$ *UDGH�% /DUFK *UDGH�$
.QRW�VXP�SHU�GLDPHWHU NV�G�>�@
�� ��� ��
0D[��NQRW�SHU�GLDPHWHU PN�G�>�@
�� �� ��
5LQJ�ZLGWK U�>PP@
� � �
�PN�G�� �U�>PP@ ���
3.4.1.2 Characteristic values for grades and species
The grading criteria specified above were applied to the tested samples of Scotspine and Finnish Norway spruce. Norway spruce had an initial sample size 200,of which 143 bending specimens and 149 compression specimens fulfilled thelimits of grade A. The unsorted material met strength class C30 requirementsexcept for density, which met C18. Obviously, density is the critical factorwhich determines the strength class. This material was divided into 3 samplesaccording to the moisture content of specimens. In Table 3.15 the results aresummarized: number of specimens meeting grading criteria, and mechanicalcharacteristics of the sample. Because so many specimens passed grade A limit,sorting was not carried out for grade B.
UK Scots pine material had 100 specimens in bending and compression. FinnishScots pine material had 150 machine-debarked specimens in bending andcompression. The unsorted material suggested that C30 is possible butcompression strength is difficult to achieve. Of this material, 70 UK and 52Finnish bending specimens, and 73 UK and 47 Finnish compression specimenspassed the limits of grade A, and 127 Finnish bending specimens and 119compression specimens passed the limits of grade B given in Table 3.14.
The 5-percentile values of the samples are determined by the followingmethods:
• For strength properties fc, 0 and fm a non-parametric method is used, i.e. it is a

100
test value for which 5 % of the values are lower. If this was not an actual testvalue, then interpolation between two adjacent values was permitted.
• For ρ it was calculated from a normal distribution: ρ05 = (Mean ρ12 - 1.65*s),where s is standard deviation for the sample.
7DEOH����������SHUFHQWLOH�YDOXHV�RI�JUDGHG�URXQG�SROH�VDPSOHV�LQ�EHQGLQJ��DGMXVWHG�WR������0&�LQDFFRUGDQFH�ZLWK�(1�����H[FHSW�IRU�VL]H�DGMXVWPHQW�
*UDGH 6DPSOH
0HDQ�G>PP@
0HDQ0&�>�@
6DPSOHVL]H
ρ��
>NJ�P�@
IP���
>1�PP�@E\�UDQN
(P�PHDQ
>N1�PP�@
$ ),1�VSUXFH�� ��� ���� �� ��� ���� ����
$ ),1�VSUXFH�� ��� ���� �� ��� ���� ����
$ ),1�VSUXFH�� ��� ���� �� ��� ���� ����
$ ),1�SLQH ��� ���� �� ��� ���� ����
$ 8.�SLQH ��� ���� �� ��� ���� ����
% ),1�SLQH ��� ���� ��� ��� ���� ����
7DEOH����������SHUFHQWLOH�YDOXHV�RI�JUDGHG�URXQG�SROH�FRPSUHVVLRQ�VDPSOHV��DGMXVWHG�WR������0&�LQDFFRUGDQFH�ZLWK�(1�����H[FHSW�IRU�VL]H�DGMXVWPHQW�
*UDGH 6DPSOH
0HDQ�G>PP@
0HDQ0&�>�@
6DPSOHVL]H
ρ��
>NJ�P�@
IF���
>1�PP�@E\�UDQN
$ ),1�VSUXFH�� ��� ���� �� ��� ����
$ ),1�VSUXFH�� ��� ���� �� ��� ����
$ ),1�VSUXFH�� ��� ���� �� ��� ����
$ ),1�SLQH ��� ���� �� ��� ����
$ 8.�SLQH ��� ���� �� ��� ����
% ),1�SLQH ��� ���� ��� ��� ����
3.4.1.3 Strength classes for grades
The equivalence between the visual grades and strength classes is considered onthe basis of the results summarized in Tables 3.15 and 3.16. The requirementsfor European C-strength classes (EN 338) are summarized in Table 3.17 belowfor poplar and conifer species. A timber population may be assigned to a

101
strength class, when characteristic values of Em, fm and ρ at 12 % moisturecontent are greater or equal to the limits given in Table 3.17. Compressionstrength is also included in Table 3.17, since it has been considered as a strengthclassification criterion, in addition to the requirements of CEN 384. As a result,it is concluded that grade A Scots pine and Norway spruce meet therequirements of C30 and grade B Scots pine C18 (Table 3.18).
The characteristic value of strength for a population in a grade, fk , is calculatedin accordance with CEN 384 to be:
f f k kk s v= 05 (3.11 )
where f05 is the weighted mean of the sample’s fifth percentile values, ks is afactor relative to the number of samples and their size, and kv = 1 for visualgrading.
The characteristic value of ρ is calculated as the mean of the sample’s fifthpercentile values weighted by sample sizes, and the mean value of E is the meanof the sample’s mean values weighted by sample sizes, without consideration ofEqn (3.11).
7DEOH��������&(1�VWUHQJWK�FODVVHV�DQG�VRPH�RI�WKH�FKDUDFWHULVWLF�YDOXHV�IRU�SRSODU�DQG�FRQLIHU�VSHFLHVDFFRUGLQJ�WR�WKH�(1�����VWDQGDUG�
&�� &�� &�� &�� &�� &�� &�� &�� &��
IP��N�
>1�PP�@ �� �� �� �� �� �� �� �� ��
IF�����N�
>1�PP�@ �� �� �� �� �� �� �� �� ��
(P��PHDQ�
>N1�PP�@ � � � �� �� �� �� �� ��
��N�
>NJ�P�@ ��� ��� ��� ��� ��� ��� ��� ��� ���
7DEOH��������&KDUDFWHULVWLF�YDOXHV�RI�JUDGHG�SRSXODWLRQV�DQG�ORFDWLRQ�DFFRUGLQJ�WR�VWUHQJWK�FODVVHV�
6SHFLHV
FRXQWU\
*UDGH NV
IP�N
>1�PP�@
IF�N
>1�PP�@
(P�PHDQ
>N1�PP�@
ρN
>NJ�P�@
6WUHQJWK
FODVV
1RUZD\�VSUXFH��),1� $ ���� ���� ���� ���� ��� &��
6FRWV�SLQH��),1��8.� $ ���� ���� ���� ���� ��� &��
6FRWV�SLQH��),1� % ���� ���� ���� ���� ��� &��
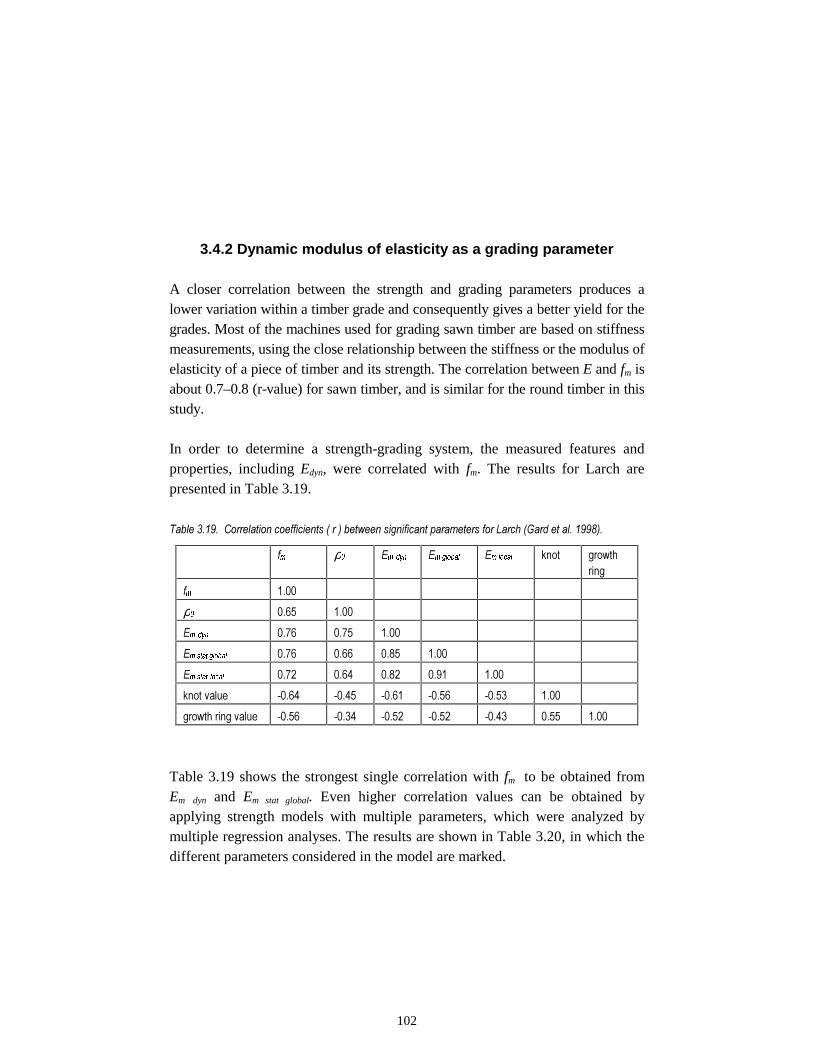
102
3.4.2 Dynamic modulus of elasticity as a grading parameter
A closer correlation between the strength and grading parameters produces alower variation within a timber grade and consequently gives a better yield for thegrades. Most of the machines used for grading sawn timber are based on stiffnessmeasurements, using the close relationship between the stiffness or the modulus ofelasticity of a piece of timber and its strength. The correlation between E and fm isabout 0.7–0.8 (r-value) for sawn timber, and is similar for the round timber in thisstudy.
In order to determine a strength-grading system, the measured features andproperties, including Edyn, were correlated with fm. The results for Larch arepresented in Table 3.19.
7DEOH��������&RUUHODWLRQ�FRHIILFLHQWV���U���EHWZHHQ�VLJQLILFDQW�SDUDPHWHUV�IRU�/DUFK��*DUG�HW�DO��������
IP
ρ�
(P
�G\Q
(P�JOREDO
(P�ORFDO
NQRW JURZWKULQJ
IP
����
ρ�
���� ����
(P
�G\Q
���� ���� ����
(P�VWDW�JOREDO
���� ���� ���� ����
(P�VWDW
�ORFDO
���� ���� ���� ���� ����
NQRW�YDOXH ����� ����� ����� ����� ����� ����
JURZWK�ULQJ�YDOXH ����� ����� ����� ����� ����� ���� ����
Table 3.19 shows the strongest single correlation with fm to be obtained fromEm dyn and Em stat global. Even higher correlation values can be obtained byapplying strength models with multiple parameters, which were analyzed bymultiple regression analyses. The results are shown in Table 3.20, in which thedifferent parameters considered in the model are marked.

103
7DEOH��������&RUUHODWLRQ�FRHIILFLHQWV���U���EHWZHHQ�IP
�DQG�SDUDPHWHUV�LQYROYHG�LQ�WKH�PRGHO��*DUG�HW�DO��������
0RGHO�SDUDPHWHUV 0RGHO &RUUHODWLRQ
FRHIILFLHQW ��U��
(P
�G\Q
(P�VWDW�JOREDO
'HQVLW\ .QRWV *URZWKULQJ
� ���� [
� ���� [ [
� ���� [ [
� ���� [ [
� ���� [
� ���� [ [
� ���� [ [
� ���� [ [
� ���� [ [ [ [
�� ���� [ [ [
�� ���� [ [ [ [
�� ���� [ [ [
�� ���� [ [
The best result for the prediction of bending strength (fm) was obtained withmodel 12, linking static bending stiffness with density and knot size.
Grading system for roundwood
One of the key strength properties concerning the strength classes is the bendingstrength. From the results obtained, the following conclusions can be drawn:
• The correlation coefficients of the regression models for larch roundwoodcorrespond very well with the models used for sawn timber in the woodindustry (Blass et al. 1995).
• Visual features such as knots and growth rings have a lower correlation withstrength than with the modulus of elasticity.
• The highest correlation can be achieved by models in which information onthe modulus of elasticity, knots and density is combined.

104
• Where roundwood is used in construction as an engineering material, itcould be economical to develop a grading machine. The particular problemsof a roundwood bending-test arrangement suggest that the vibrationmeasurement apparatus to determine modulus of elasticity will be of greatvalue.
3.4.3 Grading by X-ray
Linear regression analysis was used to analyze the feasibility of an X-raymethod as a strength-grading machine for round Douglas fir. Materialcharacteristics are given in Table 3.21. The methods compared included an X-ray method comprising 10 measured parameters, an ultrasonic (Sylvatest)method (12 parameters), annual ring widths and a knot criteria method. TheSylvatest measures only the speed of ultrasonic wave propagation in the wood.These speeds measured at different points constitute a first family ofparameters.
A theoretical formula provides the relationship between density, modulus ofelasticity and the speed of ultrasonic waves. Therefore a second family ofparameters corresponds to the modulus of elasticity, assessed with the formulabelow:
2usvE ρ= (3.12)
where vus is the velocity of ultrasonic wave.
This second family is, generally speaking, better related to the modulus ofelasticity, but it requires the knowledge of density, which means that anothermachine is necessary for its measurement.
X-ray and Sylvatest give practically the same accuracy for the prediction ofbending strength (R2 = 0.3) as indicated in Table 3.22.

105
7DEOH��������&KDUDFWHULVWLFV�RI�'RXJODV�ILU�XVHG�IRU�JUDGLQJ�VWXG\��1 �����G ����PP��
IP
03D ORFDO�(*3D
JOREDO�(*3D
.$5�
0RLVWXUHFRQWHQW
�
ρ NJ�P��
0HDQ
���YDOXH
VW��GHY�
����
����
���
����
���
���
���
���
���
����
����
���
��
����
���
���
���
��
7DEOH��������&RPSDULVRQ�RI�JUDGLQJ�PHWKRGV�DSSOLHG�WR�'RXJODV�ILU�
6RXUFH�RI�SDUDPHWHUV 1XPEHU�RISDUDPHWHUV
5ð�IRU�IP
�SUHGLFWLRQ 5ð�IRU�JOREDO�(SUHGLFWLRQ
;�UD\ �� ���� ����
6\OYDWHVW �� ���� ����
$QXDO�ULQJV � ����� �����
.QRWV��.$5�.95� � ���� ����
$OO �� ���� ����
X-rays grading benefits from several advantages in comparison with visualgrading:
• Measurement of the density is more precise (medium value of error 4 kg/m3).• The whole calculation is quicker than the measurement and location of KAR.• The location of the main defect is reliable (the location of bending failure is
predicted for 96 % of cases in a maximal nodosity location).• X-ray grading allows the grading to be automated and increases the
productivity.

106
4. Mechanical connections
4.1 Potential roundwood connections
The project focused its attention on a selected range of pole diameters: 8–16cm: thin roundwood. For structural purposes, nominal values of pole diameterswere applied: the lower boundary of a selected range of pole diameters. Theapplied nominal values are 75, 100, 125, 150 and 175 mm.
An important aspect in the use of roundwood is its behaviour with respect todrying. Roundwood shows a greater amount of shrinkage in the circumferential(tangential) direction than in the radial direction. Tangential shrinkage usuallyleads to the formation of cracks and radial shrinkage often has the effect thatconnectors (bolts or lacings) can become loose after some time.
)LJXUH�������6KULQNDJH�DQG�FUDFNLQJ�RI�URXQGZRRG�GXH�WR�GU\LQJ�
The axial crack formation may cause special problems in the application of thinroundwood, since fasteners in the connections may coincide with the cracks (seeFigure 4.1). That is why special attention must be paid to this problem ofsecuring the safety of thin roundwood structures. As shown in Chapter 2.3,cracking can be minimized by selection of the drying method.

107
4.2 Laced joints
4.2.1 Description of laced joints
At the TUDelft, extensive research has been carried out on structuralapplications of roundwood timber. This research resulted in the execution ofvarious structures. In this work, experimental and practical experience wasobtained with the development and behaviour of connections in roundwood. Thedeveloped connections represent a special type since, apart from dowels lacingswere used to reinforce the connections.
During the project period, the experience gained with laced connections wasanalyzed and evaluated to formulate design rules for this type of roundwoodconnections. To this end, first the strength test results of roundwoodconnections using dowel-like fasteners supported by wire lacings were analyzed.Subsequently, the results were compared with theoretically determined strengthcapacity values using Johansen’s equations. Finally, the structural design ofthese roundwood connections was related to the dimensioning methods used forrectangular sawn wood, as prescribed in Eurocode 5.
Many tests were carried out at the Delft University of Technology on wire-laceddowel connections. In principle two types were developed.
• Type one (see Figure 4.2):
A pole is slotted along a diameter line to allow insertion of a(galvanised) steel plate. Two hollow dowels are inserted through pre-drilled holes in the wood pole and steel plate. The end-distance is 4.4to 4.7 x dowel diameter and dowel spacing is 4.7 to 5.8 x doweldiameter. The connection is secured by 2 or 4 wire bindings, 4–5 mmthick, on each dowel. Two wires are laced around the half pole sectionperimeter and through the hollow dowels. The other two wires arelaced in a similar manner on the remaining half-perimeter of the pole.A fifth wire is sometimes added around the full-pole diameter withoutrouting through the hollow dowel hole.
• Type two (see Figure 4.3):

108
A pole is slotted along a diameter line to allow insertion of a(galvanized) steel plate. Two bolts are inserted through pre-drilledholes in the wood pole and steel plate. The end-distance and boltspacing are 7 x hole diameter. The connection is secured by 4 wirebindings, 4–5 mm thick, on each bolt. The wires are laced around thefull-pole diameter without routing through the bolt hole.
�������������������)LJXUH�������&RQQHFWLRQ�ZLWK�KROORZ�GRZHOV��������)LJXUH�������&RQQHFWLRQ�ZLWK�EROWV�
Tests were carried out to determine the design loads of these connections, whichwere used in several space frames. Comparable tests were carried out by anEnglish research institute, the Timber Research and Development Association(TRADA). These test data were also used to analyze the wire-laced dowel-typeconnection.
4.2.2 Estimation of load capacity of wire-laced joints
The estimation of the load-carrying capacity of wire-laced dowel joints is basedon the European yield theory adopted in EC 5. The test results of roundwoodjoints show values that differ from the values obtained by the yield theory. They

109
provide information about the maximum strength of the connection and aboutthe failure mode that occurs.
In two steps the test results are compared to the calculation procedures forconnections applied in EC 5. In step 1 the mean results of the different testseries are compared with the estimation of the failure strength using theEuropean yield theory. In step 2 a statistical analysis is applied to evaluate thefindings of step 1. To this end, the embedment strengths that occur duringtesting are compared with the prescribed values in EC 5.
Failure Modes
Generally, the wire-laced dowel joint showed a similar failure behaviour asdescribed by the yield theory. However the mechanical behaviour of theconnections was influenced by the presence of the lacings: the lacings preventedthe wood from splitting. It may be assumed that the lacings introduced a frictioninto the connection which contributed to a higher load-carrying capacity of theconnection. This assumption was confirmed by the test results.
Failure modes which may occur:
1. Failure on embedment strength.
2. Failure of the dowel with one plastic hinge and failure of the wood,partially on maximum embedding strength.
3. Failure of the dowel with three plastic hinges and failure of the woodpartially on maximum embedding strength.
4. Failure on shear strength of the piece of wood under the dowel.
5. Failure on tensile strength of the net cross-section.
6. A new or old crack could not be kept closed by the lacings impairingthe force transfer from dowel to wood.

110
The first 3 failure modes correspond to the modes described by the yield theory.The failure modes 4 and 5 may occur if the connection layout design is wrong. Itis clear that these failure modes represent cases of undesired failure behaviourand, consequently, should be avoided. Failure mode 6 is a specific problem ofroundwood. If the lacings are properly applied, this will not be a restrictivefailure mode.
Assumptions
For the estimation of the strength of the joint the following assumptions wereapplied:
• The values used for the estimation were average values, as the numberof tests was too small to derive 5th percentile values. An approximationof the 5th percentile values was found through the application of astatistical analysis.
• The prescribed end-distances were not observed. Since no shear ortensile failure occurred during testing but a regular failure mode 2,according to EC 5, it may be assumed the end distances were sufficientfor the development of the maximum embedment strength in theconnection.
• The pole diameter was considered as the width of the connection. Thereason was that the dowels traversed the centre of the pole and thushad the length of the pole diameter. The development of theembedment strength took place under the dowel. The lack ofsurrounding wood was compensated by the lacings.
• A distinction was made between one and two wires per dowel. Asmost of the connections made use of 2 dowels, 2 and 4 lacings perconnection were used. The bolted connections always had two wiresper bolt.
• The formula specified in EC 5 for dowel-type connections was usedfor the calculation of the embedment strength.

111
Estimation
The characteristic data of the test series are collected in Table 4.1. The numberof specimens in each test series is in the range from 4 to 16. Three main groupsof connections can be distinguished:
group 1: connections with 2 wires per dowel group 2: connections with 1 wire per dowel group 3: connections with 2 wires per bolt
Step 1
In this section the lowest values of the yield theory are compared with the meanvalues of the test results. Failure modes 1, 2 and 3 correspond with thosementioned in part 4.2.
7DEOH�������&RPSDULVRQ�RI�WHVW�UHVXOWV�DQG�<LHOG�7KHRU\�
7HVWVHULHV
:RRG�W\SH
1R�GRZHO
¡ GRZHO
1R� ZLUH
¡SROH
:RRGGHQVLW\
0HDQWHVWYDOXH
<LHOGWKHRU\ IDLOXUHPRGH��
<LHOGWKHRU\ IDLOXUHPRGH��
<LHOGWKHRU\ IDLOXUHPRGH��
PP PP NJ�P� N1 N1 N1 N1
3� 6FRWFK�3 � �� � ��� HVWLP� ����� ���� ���� ����
3� 6FRWFK�3 � �� � ��� NQRZQ ���� ���� ���� ����
/� /DUFK � ���� � ��� NQRZQ ����� ����� ���� �����
/� /DUFK � ���� � ��� DYHUDJH ����� ����� ����� �����
596�� /DUFK � �� � ��� NQRZQ ���� ����� ���� ����
*DOY�� /DUFK � �� � ��� NQRZQ ���� ����� ���� ����
3� 6FRWFK�3 � �� � ��� NQRZQ ���� ���� ���� ����
/� /DUFK � ���� � ��� NQRZQ ������ ����� ���� �����
*DOY�� /DUFK � �� � ��� NQRZQ ���� ����� ���� ����
/� /DUFK � �� � ��� DYHUDJH ������ ����� ���� �����
/� /DUFK � �� � ��� DYHUDJH ������ ����� ���� �����
/� /DUFK � �� � ��� DYHUDJH ����� ����� ����� �����

112
According to EC 5, the lowest value of failure mode 1, 2 or 3 is restrictive. Thecalculations show that failure mode 2 is always restrictive. The tests showed(see Figures 4.4 and 4.5), that failure indeed occurs according to failure mode 2.
A first impression is (see Table 4.4, failure mode 2) that the calculated valuesrepresent a conservative approximation of the test values. The differencebetween test result and the lowest yield theory value (failure mode 2) is rathersmall for the dowel connections. This is, however, not the case for the boltedconnections (L4, L5, L7).
)LJXUH�������)DLOXUH�PRGH��� )LJXUH�������)DLOXUH�PRGH���
Step 2
To give an indication of the safety interval of the connections, a statisticalanalysis was done. The analysis was focused on the comparison of the occurringmaximum embedment strength during testing and the prescribed embedmentstrength of EC 5. To this end, the embedment strength, f h d, ,1 , occurring in theconnection during testing, was calculated by means of the yield theory, takinginto account that failure mode 2 is applicable:

113
Rd= f t dh d, ,1 1 24
11 1
2+ −
M
f dty d
h d
,
, ,
(4.1)
The value of f h d, ,1 is, subsequently, compared with the embedment strengthformula, figuring in EC 5, assuming γ=1 and kmod=1 which gives f h d, ,1 = f h k, :
f h k, = 0.082(1-0.01d)ρk. (4.2)
A linear regression analysis was performed on the relation between theembedment strength derived from the test values and the density of the wood.As not all the wood densities were known per test specimen, only those serieswere analyzed from which information was available.
The embedment strength, derived from the test series (fh, test), was considered asthe dependent variable. The independent variables were the wood density andthe dowel diameter. The dowel diameter is a constant coefficient and istherefore combined with the wood density resulting in the independent variable ρv. So the following relationship was analyzed:
f h d, ,1 =fh,test= C (1-0.01d)ρv (4.3)
Hence, C can be compared with the value 0.082 of Equation (4.2).
Group 1: P2, L2, RVS-4, Galv-4 (2 dowels, 4 wires)
From the first group of test results, the connection with 4 lacings, 4 of the 6 testseries were sufficiently documented to be used. In total, 55 test values wereavailable.
From the second group of test results all the data sets were used, in total 17 testvalues.
The bolt test series were not sufficiently documented to be used for a regressionanalysis. At the moment, a new test series is being prepared to establish anembedment formula for laced-bolted connections.

114
To give an indication of the f h d, ,1 value, the average values were used and a 5th
percentile values were estimated. Table 4.2 shows the results of the statisticalanalysis.
7DEOH�������6WDWLVWLFDO�DQDO\VLV�
*URXS�� & 6WDQG��'HYLDWLRQ /RZHU�OLPLW 8SSHU�OLPLW
3� ����� ����� ����� �����
/� ����� ����� ����� �����
596�� ����� ����� ����� �����
*DOY�� ����� ����� ����� �����
7RWDO ����� ����� ����� �����
*URXS�� & 6WG��GHYLDWLRQ /RZHU�OLPLW 8SSHU�OLPLW
3� ����� ����� ����� �����
/� ����� ����� ����� �����
*DOY�� ����� ����� ����� �����
7RWDO ����� ����� ����� �����
*URXS�� DYHUDJH�IK�WHVW
& VW��GHYLDWLRQ &���WK��
/��/��/� ����� ������ ������ �����
Comparing the C-values with the 0.082 EC 5 value, they are always higher (seeTable 4.3).
7DEOH�������/RZHU��WK�SHUFHQWLOH�&�YDOXHV�DV�D�IXQFWLRQ�RI�FRQQHFWLRQ�W\SH�
*URXS��
��GRZHOV����ZLUHV
*URXS��
��GRZHOV����ZLUHV
*URXS��
EROWV
&�YDOXH ����� ����� �����
It may be concluded that the C-values are a function of the type of connection.The separate evaluation of the three groups provides some insight into theefficiency of the various connection methods.
Especially the bolted connection shows a large deviation in strength from theyield theory values. Therefore some additional tests were performed to

115
investigate deeper the influence of the lacings. To this end, embedding-strengthtests were performed with the exception that one plastic hinge in the dowel wasconsented. The occurring embedment strength was derived from the test resultin a similar way as described in part 4.3 step 2.
There were 3 groups of tests done. Group L8 had one belt and one dowel and adiameter of 115 mm. L9 was similar but had a diameter of 135 mm. L10 wassimilar to L8 but did not have a belt. The results are listed in Table 4.4.
7DEOH�������5HVXOWV�RI�HPEHGPHQW�WHVWV�
7HVWVHULHV
:RRG�W\SH
1R�GRZHO
¡ GRZHO
1R�EHOWV
¡�SROH :RRG GHQVLW\
0HDQ�WHVWYDOXH
<LHOG�WKHRU\ IDLOXUH�PRGH��
PP PP NJ�P� N1 N1
/� /DUFK � �� � ��� NQRZQ ���� ����
/� /DUFK � �� � ��� NQRZQ ���� ����
/�� /DUFK � �� � ��� NQRZQ ���� ����
A statistical analysis was carried out in a similar way as for Table 4.2. Theresults are shown in Table 4.5.
7DEOH�������6WDWLVWLFDO�DQDO\VLV�
*URXS�� & 6WDQG�
'HYLDWLRQ
/RZHU�OLPLW 8SSHU�OLPLW
/� ����� ����� ����� �����
/� ����� ����� ����� �����
WRWDO ����� ����� ����� �����
/�� ����� ����� ����� �����
From the results, it can be seen that the test result comes very close to theestimated values (Table 4.1). There is also very little deviation in the results.When no belts are applied the results are lower than the estimated values. It canbe concluded that, when hollow dowels with wires or bolts with nuts areemployed, there is no extra strength effect due to friction. The use of theconnections is illustrated in Figure 4.6.
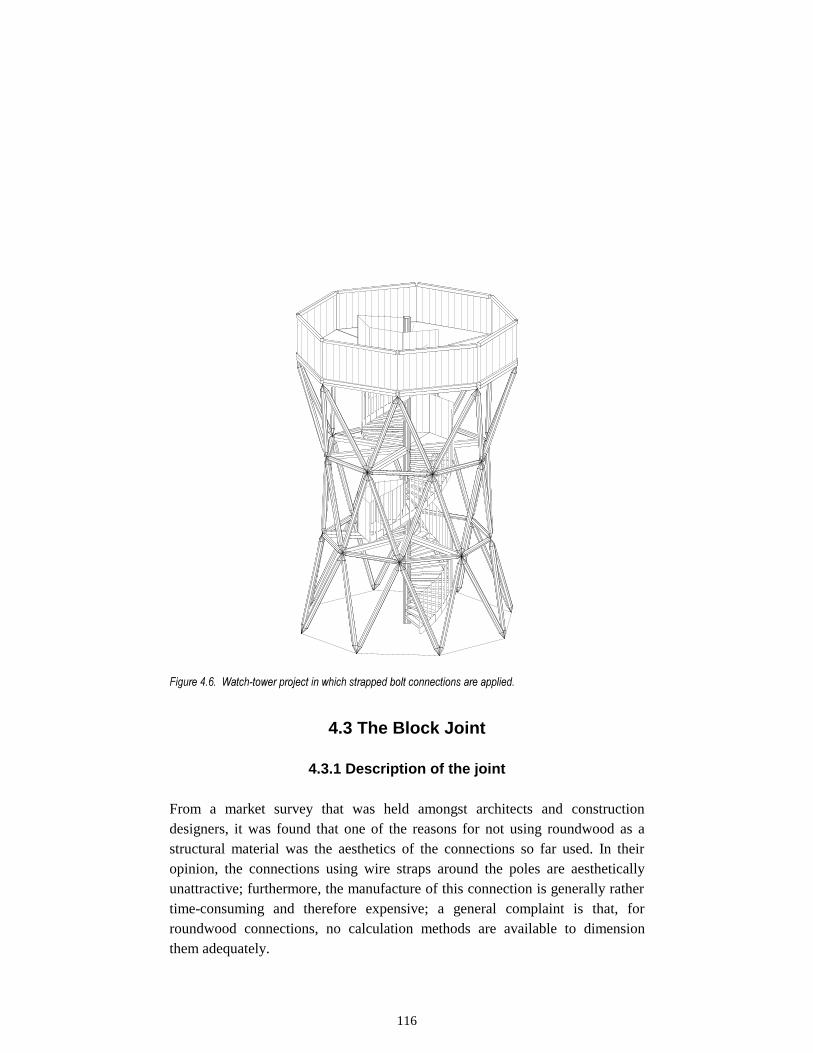
116
)LJXUH�������:DWFK�WRZHU�SURMHFW�LQ�ZKLFK�VWUDSSHG�EROW�FRQQHFWLRQV�DUH�DSSOLHG�
4.3 The Block Joint
4.3.1 Description of the joint
From a market survey that was held amongst architects and constructiondesigners, it was found that one of the reasons for not using roundwood as astructural material was the aesthetics of the connections so far used. In theiropinion, the connections using wire straps around the poles are aestheticallyunattractive; furthermore, the manufacture of this connection is generally rathertime-consuming and therefore expensive; a general complaint is that, forroundwood connections, no calculation methods are available to dimensionthem adequately.

117
Additionally, there is the problem of cracks that influence the strength of thejoint. The existing joints all use dowel-type fasteners; for small-diameters thedowel is necessarily placed axially, while cracks may occur axially as well. Aloss of connection strength may be assumed if the dowel is placed over a crack.
With the above-mentioned points in mind, a new type of joint was developedand tested. The description of the joint, the tests carried out, and the design rulesthat follow from these tests are reported.
Different parts of the joint
The joint is fixed to a roundwood pole with a milled slot at about 200 mm fromthe end. From the head of the pole to this slot a hole is drilled into thelongitudinal direction. To enable the joint to transfer tension forces, a steelblock is placed in the milled slot. Then a steel rod is placed into the drilled holeand screwed into the steel block (Figure 4.8).
On top of the beam, a round steel disc is screwed onto the rod. This discpositions the steel block inside the beam. Furthermore, it ensures an evendistribution of the stresses in case of compression forces. The last part of theconnection consists of a hexagonal hollow bar with a screw thread on one sideand a cover plate with a small hole in it on the other side. The screw-threadedside is screwed to the rod in order to secure the fixing of the disc and to transferthe tension forces into the rod.
Before fixing the hexagonal bar to the rod, a bolt is placed into the hollowsection in such a way that it sticks out of the cover plate. By adding two smallsteel elements, the bolt can now easily be connected to a node. In this way, theconnection is very similar to the well-known and often used MERO-connection(Figure 4.7).

118
Steel rod
Steel discHexagonalbar
Cover plate
bolt Steelblock
wood
)LJXUH�������&URVV�VHFWLRQ�RI�WKH�EORFN�MRLQW�FRQQHFWLRQ�
)LJXUH�������6WHHO�EORFN�DWWDFKHG�WR�VWHHO�URG��
During the test series, the dimensions of the different parts of the joint werevaried in order to optimize the strength of the connection itself. This resulted inroughly the following dimensions for the different pole diameters, as given inTable 4.6.
7DEOH�������'LPHQVLRQV�RI�WKH�GLIIHUHQW�SDUWV�RI�WKH�FRQQHFWLRQ�
3DUW�RI�WKH�FRQQHFWLRQ 3ROH�GLDPHWHU�����PP 3ROH�GLDPHWHU�����PP
6WHHO�EORFN�GLPHQVLRQV ���[����[����PP� ���[����[����PP�
6WHHO�URG�GLDPHWHU 0�� 0��
(QG�GLVWDQFH ����PP ����PP
'LVF�WKLFNQHVV ���PP ���PP
(QG�EROW 0�� 0��

119
Testing
When used in trusses, the joint has to be able to transfer both tension andcompression forces. First, testing was focused on the tension testing of the joint,as in this way it would allow a comparison to be made of the strength andstiffness of the joint with known alternative solutions. In a later stage of theproject, some compression tests on the complete joint were carried out.
All the tests were carried out on poles with diameters of 100 and 140 mm. Theapplied wood species was Japanese Larch with a density varying fromapproximately 400 to 550 kg/m3 (the wood can be classified as C40). Themoisture contents of the wood varied from 12 to 15 %.
All tests were carried out on a test bench with a maximum test capacity intension of 15 tons. As the 140 mm joint sometimes appeared to be stronger than15 tons, the various dimensions of the joint were in some cases different fromthe values given in Table 4.6. Varying the dimensions also gave much moreinsight into the behaviour of the joint and made it possible to optimize the jointby evaluating the different failure modes.
Failure modes
As stated before, testing was focused on the tension strength of the joint. Nextto that, a few simple tests were carried out to obtain information on thecompression strength of the joint.
If the joint was loaded in tension, five different failure modes may occur. InFigure 4.9, the stresses critical for different failure modes are presented.

120
σt,0 (5)
σc,0 (2)
σt.90 (3)
σv (4)
)LJXUH�������2FFXUULQJ��VWUHVVHV�LQ�WKH�FRQQHFWLRQ�
Failure mode 1, Strength and stiffness of the steel block.
The tension forces in the steel rod are transferred to the wood by the steel block.Consequently, the wood underneath the steel block is loaded in compression.The block at the end of the rod must have sufficient stiffness in order to enable auniform repartition of the compression stresses on the wood.
It goes without saying that, next to stiffness, the rod and the block must haveenough strength to transfer the tension forces.
This failure mode turned out to be plastic. The stiffness of the steel block wastested by means of 2 test specimens. From the results the dimensions of the steelblock were determined.
Failure mode 2, Embedment strength of the wood underneath the steel block
The wood is subjected to compression stresses that are introduced by the steelblock. It is common for dowel-type joints that the combined effects of both thecompression strength of the wood and the shape of the dowel, expressed in theembedment strength, are determined. If the dowel is flat, it is obvious that theembedment strength, found during testing, is almost equal to the compressionstrength of the wood itself. In this case the failure mode is plastic as well.
This type of failure was first tested in standardized tension tests. In order tocalculate the embedment strength according to the standard procedure, an
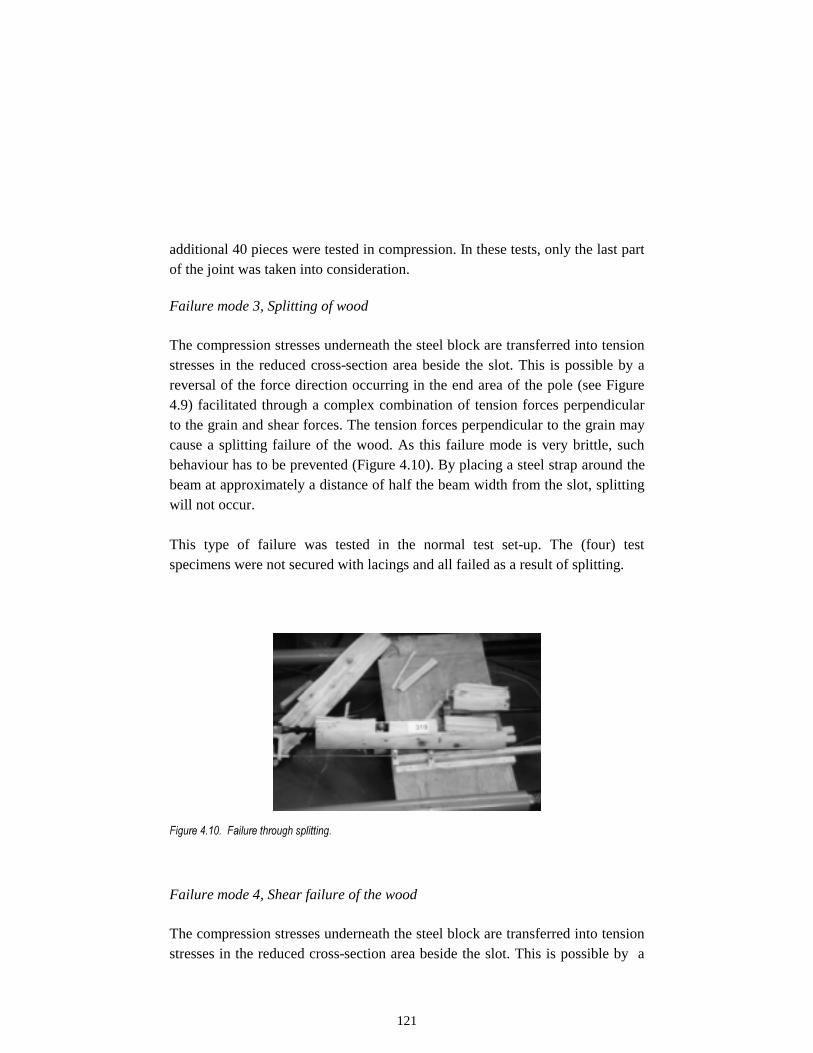
121
additional 40 pieces were tested in compression. In these tests, only the last partof the joint was taken into consideration.
Failure mode 3, Splitting of wood
The compression stresses underneath the steel block are transferred into tensionstresses in the reduced cross-section area beside the slot. This is possible by areversal of the force direction occurring in the end area of the pole (see Figure4.9) facilitated through a complex combination of tension forces perpendicularto the grain and shear forces. The tension forces perpendicular to the grain maycause a splitting failure of the wood. As this failure mode is very brittle, suchbehaviour has to be prevented (Figure 4.10). By placing a steel strap around thebeam at approximately a distance of half the beam width from the slot, splittingwill not occur.
This type of failure was tested in the normal test set-up. The (four) testspecimens were not secured with lacings and all failed as a result of splitting.
)LJXUH��������)DLOXUH�WKURXJK�VSOLWWLQJ�
Failure mode 4, Shear failure of the wood
The compression stresses underneath the steel block are transferred into tensionstresses in the reduced cross-section area beside the slot. This is possible by a

122
reversal of the force direction occurring in the end area of the pole (see Figure4.9) facilitated through a complex combination of tension forces perpendicularto the grain and shear forces. Applying a strap the connection may fail in shear;in this case the shear strength of the wood is exceeded and a part of the pole ispushed out. This type of failure is brittle as well (Figure 4.11).
Tests were carried out on about 35 pieces in the standardized tension test.
)LJXUH��������7\SLFDO�VKHDU�IDLOXUH�
Failure mode 5, Tension failure in the reduced net cross-area
Finally, the pole itself was subjected to tension stresses. As a part of the wood ismilled away in order to insert the steel block, the net cross-area is reduced.Tension stresses will be highest at this cross-section and the pole may fail undertension. This type of failure is once again brittle. The tension failure was testedby means of 20 poles with a diameter of 100 mm.
Failure of the joint loaded in compression
If the joint is loaded in compression, the covering steel plate will be pressed intothe wood. Failure will occur if the embedment strength (=compression strength)of the wood is exceeded. This failure mode is plastic. Two tests were carried outas the maximum capacity of the bench was only 15 tons.

123
4.3.2 Test results
For the different failure modes, the test results are discussed.
Failure mode 1, Strength and stiffness of the steel
After the second test, the stiffness of the block was increased in order to enablea uniform distribution of the compression stresses. In order to make sure that thestiffness of the rods would not influence the stiffness of the joint toosignificantly, a rod with a bigger diameter was chosen. No further investigationhas been done on the steel parts in the joint.
Failure mode 2, Embedment strength of the wood
A series of embedment tests was carried out according to a standardized testingprocedure. It turned out to be difficult to determine the stiffness of theconnection from these tests as the stiffness of the rod had to be taken intoaccount as well. Furthermore, tension tests are not described for embedmentstrength testing. For this reason a series of supplementary tests was carried out.
These tests made it clear that this type of failure shows a very plastic failurebehaviour and the strength is almost equal to the compression strength of thewood. The slot in the middle of the pole did not influence the strength at all. Inorder to protect the compression testing-bench from shear forces, the tests werestopped before a displacement of 15 mm was reached. However, tests werealways run until the moment that the compression force was already decreasingfor more than 1 minute.
Failure mode 3, Splitting of the beam
All poles tested without steel straps around them failed due to splitting of thepole. This happened with a lot of energy, causing pieces of wood to detach fromthe pole. The strength found for the joint (without straps) was about 60 % of thestrength determined in the tests where a strap was applied. As the deviation inthe test results was higher as well, no further tests without straps were carriedout.

124
Failure mode 4, Shear failure of the beam
The shear strength of the wood depends on many parameters. First, as there aretension forces perpendicular to the grain as well, the strength will be lower thanwhen tested in shear only. Then, there is the influence of cracks, knots and thegeometry of the joint. And, last but not least, the cross-area over which shearwill take place is very difficult to define. Therefore, one cannot compare theshear strength found in the tests with the strength given in the codes. The shearvalues found in the test series turned out to be approximately 50 % lower thanexpected from the standard values.
The influence of the shear area was also difficult to determine. If the shearfailure of the joint is compared with that of a ring shear connector, a decrease instrength may be expected with increasing shear area (Figure 4.12). However,such a tendency could not be found in these test series.
F
F
σv
σv
R i n g s h e a r c o n n e c t o r
)LJXUH��������6KHDU�VWUHQJWK�RI�D�ULQJ�VKHDU�FRQQHFWRU�
Failure mode 5, Tension strength of the wood
The tension strength found in the test series is probably equal to the tensionstrength of the wood if knots and other small imperfections are taken intoaccount. The tension strength was only tested for beams with a diameter of 100mm, as the remaining cross-area for the beams with diameter 140 mm was toobig. The forces would be higher than the maximum capacity of the bench.

125
Failure of the joint loaded in compression
Tests were carried out to determine the load-bearing capacity of the coveringsteel plate (Figure 4.13). The load-bearing capacity exceeded that of the testingbench (150 kN) and can be estimated (through evaluation of the contact area andthe known compression strength of the material) to a value of 250 kN.
C o m p re s s io nb e n c h
C o m p re s s io nb e n c h
w o o d
S te e l d is c
H e x a g o n a lb a r
F
F
)LJXUH��������7KH�MRLQW�WHVWHG�LQ�FRPSUHVVLRQ�
The compilation of test results is given in Table 4.7.
7DEOH�������7HVW�UHVXOWV�
)DLOXUH�PHFKDQLVP 3ROH�GLDPHWHU
�PP�
1R�RI�WHVWV 0HDQ
�1�PP��
0LQLPXP
�1�PP��
(PEHGPHQW����>IK@ ��� �� ���� ����
6SOLWWLQJ ��� �
6KHDU��������������>IY@ ������� �� ��� ���
7HQVLRQ�����������>IW@ ��� �� ���� ����
4.3.3 Design criteria for the joint
If the dimensions given in Table 4.6 are observed, and Japanese Larch of thesame quality (see section ‘Testing of the Joint’) as used in testing is applied, thejoint is able to transfer tension forces up to 110 kN (characteristic value) andcompression forces up to 250 kN.

126
From the test results it was concluded that, taking into account (i) certain joint detailing recommendations for compression, and (ii) the necessary prevention of the splitting failure mode (via the applicationof a steel strap is placed around the pole),
three tension failure modes have to be checked, and the following equations areproposed:
Embedment underneath the steel block:
dcdhnetblock
c ffA
F,0,,
,0, 9.0=≤=σ (4.4)
Shear strength of the wood:
dvshear
v fA
F,4.0≤=σ (4.5)
Tension strength of the wood:
dtnetwood
t fA
F,0,
,0, 6.0≤=σ (4.6)
4.4 Forced plate joint
4.4.1 Introduction
Forced plates provide a simple and practical solution for connecting roundtimber. The joints are easy to construct and various plate sizes are available. Theplates are galvanized and pressed into different pre-formed shapes to enabledifferent joint configurations to be produced; the plates are also pre-drilled fornailing. Ring nails are used to connect the plates to the timber and it isrecommended that all the nail holes be used. The forced plates are manufacturedin Germany (Rudolf Feicht gmbh. Metallverarbeitung, Arnstorfer Str. 10, 84326Zell, Germany). Various configurations are available for building differentstructural forms and five plate sizes are offered for different diameter logs.Typical dimensions of one plate are shown in Figure 4.14. In this example, aplate for a 13–17 cm diameter log is used.

127
100
85
85
29
0
28
21 Nails
Plate thickness = 1.5mmNail = 60mm ringed shank (penetration = 57mm)Nominal diameter = 3.5mmNails to comply with DIN1052
(42 total)
(Note: The dimensions shown are measurements from a plate)
)LJXUH��������7\SLFDO�SODWH�GLPHQVLRQV��UHI���±���FP��
4.4.2 Calculation
Calculations may be based on the equations given in Eurocode 5: Design ofTimber Structures (1994). Here, a calculation example is shown and theassumptions made are as follows:
• Plates fully nailed• Loads acting axially• No pre-drilled holes• No bending moment introduced into the joint• Timber is Sitka spruce (Picea sitchensis) C30 ; ρk = 380 kg/m3
• Joint slip not considered Plate Details
Nails are ring-shanked, 3.5 mm diameter, 60 mm long Service class 2, load duration permanent: modification factor kmod = 0.6 Partial safety coefficients: Steel (γm) = 1.1, timber (γm) = 1.3 Embedding strength (fh,k):
3.0, 082.0 −= df kkh ρ (4.7)

128
23.0, /4.215.3380082.0 mmNf kh =××= −
Fastener design yield moment (My,k):
NmmdM ky6.2
, 180=(4.8)
NmmM ky 46755.3180 6.2, =×=
Design embedding strength (fh,d):
2,mod, /9.9
3.1
4.216.0mmN
fkf
m
khdh =×==
γ(4.9)
Design value for nail yield moment (My,d):
NmmM dy 42501.1
4675, == (4.10)
Nails in single shear Minimum nail penetration = 6d Actual penetration = 57 mm > 6 × 3.5 = 21 mm Check using Equations 4.11 and 4.12 for minimum value of Rd:
NdtfR dhd 7905.3579.94.04.0 1, =×××== (4.11)
NdfMR dhdyd 6265.39.9467521.11.1 ,, =×××== (4.12)
Minimum value = 626N
Design load = Design resistance per nail × Number of nails × Number of plates = 626 x 21 x 2 = 26.3 kN.
Check joint for tension perpendicular to the grain:
be ≥ 0.5 h = 0.5 × D = 70 mm

129
D
be
t
'LPHQVLRQV� '� �����PP EH� �����PP��IXUWKHVW�QDLO� W��� �����'�� �����PP��FO�����������
)LJXUH��������-RLQW�GLPHQVLRQV�
Shear strength
fv,k = 3.0 N/mm2
according to Table 1. pr EN 338:1994.
Design shear strength
2, /38.1
3.1
6.00.3mmNf dv =×=
Design shear force
kNtbf
V edvd 9.12
3
11212538.12
3
2 , =×××=≤ (4.13)
kNVF dd 8.259.1222,90 =×≤=
Therefore minimum load is due to tension perpendicular to the grain where Design failure load = 25.8 kN.

130
5. Roundwood Structures
5.1 Introduction
This chapter of the report looks at the opportunities for round-pole constructionin Europe. It covers buildings from simple cowsheds and barns designed andbuilt by local craftsman (Figure 5.1), to highly prestigious statement structuresdesigned by architects and engineers where the small-diameter poles of thisinvestigation may only be an appropriate and complementary part of the whole,in conjunction with other materials that facilitate a much greater scale ofstructure (Figure 5.2).
)LJXUH�������3RUWDO�IUDPH�GHWDLOV�IURP�D�SROH�EDUQ�LQ�$XVWULD�
)LJXUH�������7ZR�YLHZV�RI�WKH�(IWHOLQJ�EXLOGLQJ�DW�.DDWVKHXYHO�LQ�+ROODQG�

131
The areas of the project covered by this chapter include:
• The market study undertaken at the start of the project by each partner anddrawn together by VTT in Finland.
• The non-engineered guidelines, identified as essential to the development ofthe volume use of round-pole structures. The guidelines cover smallerbuildings and structures suitable for construction by builders, farmers andcraftsmen requiring no more than local authority approval. The completedocument identifies the opportunities and gives guidance on standardtechniques for design and construction. The booklet is richly illustrated withexamples and ideas as an appropriate communication to the end-user.
• The engineered guidelines, which look to the development of new uses forround-poles in construction and enables poles to compete with otherstructural materials in higher technology buildings and structures. Thisbooklet brings together the research on material and joint properties and iswritten to provide factual information for engineers, architects and planningauthorities.
• Site visits. As part of the programme of meetings during the project, visitswere arranged by the participating countries to projects of significantinterest to enable the researchers to view first hand the very differentapproaches and techniques involving the use of round-poles in differentcountries, but likely to be of value throughout Europe.
The output from these areas of the project work are, principally, three majordocuments suitable for widespread publication in Europe, namely:
• Round small-diameter timber for construction: Market Summary edited byAnna-Leena Perälä (1997)
• The Non-Engineering Guidelines (Griffits et al. 1999)
• The Engineering Guidelines (Groot 1999).
Further dissemination of this part of the work is planned through articles in the

132
architectural and construction press, through agricultural media and atinternational conferences focusing on structural uses of timber.
In preparing this report, the help given by an internal project group reportprepared by Dr Pieter Huybers of the Delft University of Technology in theNetherlands is gratefully acknowledged (Figure 5.3).
)LJXUH�������5HVHDUFK�QRWHV�SUHVHQWHG�E\�'U�3LHWHU�+X\EHUV�VKRZLQJ�RQH�RI�KLV�URXQG�SROH�VSDFH�VWUXFWXUHV�
5.2 Historical influences
Roundwood has always been a very common building material. It was, and is,available throughout the world. As a source of material it is self-replenishingover a much shorter period of time than that needed for sawn timber. It istherefore understandable that roundwood has remained very popular in many

133
developing countries. However, in Europe the changes in the building industryrelated to available materials, planning and technical requirements, andcommercial expediency has meant that roundwood has often been ignored in thetwentieth century.
Recently, as a result of changes in forestry management, a quality andpredictable resource of small-diameter roundwood is available. There iscommercial value in seeking to use it in higher value-added end-uses asprincipal structural members within the construction industry and to develop itsvolume use in local rural industry.
In olden times when timber was more plentiful and the overall volume ofconstruction was very much smaller, small-diameter round-poles would be usedfor their convenience in size, related to handling and transportation, and wherequality might be of secondary importance. This would lead to end-uses in moretemporary constructions and in lower value buildings such as barns, animalshelters and artisan houses. Illustrating these themes, Figures 5.4 and 5.5 show areconstruction of a Roman camp and fortification, which included an enormousvolume of small-diameter, minimally prepared roundwood. Figure 5.6 illustratesan old French barn and workers’ accommodation, now used as a craft shopwhere the round-pole rafters are of very poor quality by today’s standards interms of straightness, but yet have survived over a long period of time.

134
)LJXUH�������7ZR�YLHZV�RI�D�PRGHUQ�UHFRQVWUXFWLRQ�RI�D�5RPDQ�IRUWLILFDWLRQ�

135
)LJXUH������5RXQG�SROH�UDPSDUWV�DQG�ZDOO�LQ�I�ILOP�VHW�IRU�D�5RPDQ�IRUW�
)LJXUH�������5RXQG�SROH�UDIWHUV�LQ�D�)UHQFK�EDUQ�QRZ�XVHG�DV�D�FUDIW�VKRS�

136
Figures 5.7 and 5.8 show more formal uses of roundwood, which might relate tolarger more prestigious structures in developing countries where the ability touse small-diameter roundwood, without any form of high-technology, greatlyincreases its potential. The buildings are in fact in Holland and are relativelymodern if less permanent structures, but their design must be based on structuralforms found in Dutch protectorates in Africa or the East Indies.
)LJXUH�������5HVWDXUDQW�URRI�LQ�ZRRGODQG�SDUN�QHDU�$SHOGRRUQ�LQ�+ROODQG�
)LJXUH�������7HD�URRP�DW�$SHOGRRUQ��%RWK�)LJXUHV�����DQG�����VKRZ�DGDSWDWLRQV�RI�GHVLJQV�IURP�WUDGLWLRQDOEXLOGLQJV�LQ�'XWFK�FRORQLHV�LQ�WKH�)DU�(DVW�

137
More recently, round-pole use has been restricted to agricultural and rural end-use, mainly in the more forested areas of Europe. Unless there is a strongtradition for the use of wood, the structures are often ill-considered and lackingin reliability. This is apparent from:
• Lack of stability in the structure as a whole or in the meeting of elements.
• Poor or inappropriate connections. The elements are often just boltedtogether such that drying cracks in the wood run through the holes becausethe wood shrinks around the bolts and meets considerable resistance to itscontraction.
• Supporting poles being dug into the ground or cast into concrete footingswithout the ability to drain water. Moisture content in the poles thenincreases making them vulnerable to rot and premature failure.
• Poles expected to support unduly high bending moments, which leads tounacceptably high deflections, increasing the rustic nature of the building,and possibly leading to early failure of the structure.
Where the tradition for use of wood is greater, and experience of timber avoidsthe elementary problems noted above, it is instead common that the use oftimber has not developed to meet the challenges of today, inspired by modernliving requirements, changes in architectural philosophy and competition fromother materials.
5.3 The present situation
Changes in the forestry industry and the challenges of commercialism haveidentified the need to get maximum value out of all the forestry output includingwhat has often been considered a secondary by-product - forest thinnings.Throughout Europe there is a vast resource of such thinnings, which, due to thenature of their cultivation and growth make them more suited to constructionalend-uses than had been previously envisaged. Quality, in terms of strength andstraightness is essential. Practicality in terms of available length and proportionof timbers meeting acceptable specification is also necessary. Changes inperception and use of timber are also important. Very small 5–8 cm diameterpoles are commercially available throughout Europe, mostly in a peeled and

138
concentric form for use in garden landscaping. The leisure industry and accessto the countryside have grown enormously and developments associated withthese changes have to be environmentally acceptable and appropriate to thelocation. This has created a totally new market for buildings portraying a morerustic and traditional image but still incorporating high technology and highquality.
Round-poles are ideal for meeting this demand, either in debarked form wherethe priority is on rustic appearance or in peeled form if it is important todemonstrate the twentieth century influence on an old technology.
Familiarity with such modern structures, through their use by visitors moreaware of an urban landscape, creates further uses for round-poles, bringing theminto the urban environment to reduce the harshness of the landscape and create amore relaxed and tranquil and environmentally healthy image. This area hasgrown from playground equipment to cover inner-city farms and zoos, towersand footbridges in urban parks as well as visitor centres, restaurants andmaintenance facilities within such parks.
In the countryside, the new uses of roundwood have benefited its volume of usein farm buildings and landscaping. Proprietary fixing systems are more readilyavailable along with the staple material and there is an increased enthusiasm forthe use of roundwood in comparison with the more recent competition of steeland concrete. Again, environmental concerns and the desire to use appropriatetechnology benefit the acceptance of roundwood structures by the planningauthorities.
It is with this background that this project was started in 1996. Material wasavailable, interest had been generated but support information was lacking.Before that information could be properly provided it was important to identifythe current situation and the potential market. This would determine the mainobjectives of the project in addition to the classification of the timber sourcewithin the needs and scope of EC5, the European Code for timber design.

139
5.4 Market study
5.4.1 Overview
The five countries involved in the project had widely different experience in theuse of roundwood, and hence in their visions of potential and possible use.Each country produced its own market study and these were edited andsummarized by a specialist in the field of market studies, Anna-Leena Perälä ofVTT in Finland (1997). She noted the following: "The measure of forest and theuse of wooden products vary in different countries. The resource of forests percapita and the use of wooden buildings are significant in Finland and in Austria.Wooden structures are not so common in the United Kingdom, France and theNetherlands. Presently small roundwood (dia. 8–15 cm) is used for firewood,paper industry pulp or on a limited scale as sawn goods, primarily in thecountryside and yards. The purpose of this sub-project is to seek potential andinteresting markets for the products in construction in participant countries inthe future.
The main results indicate that potential markets could be both in small buildingsand large engineered structures. It seems that the work will include:
- the development of small buildings with traditional structural systems to bebuilt in rural areas, including agricultural buildings.
- the development of systems for larger buildings, which could be attractivewhen combined with unique architecture, especially in the leisure industry.
Larger volumes come from small buildings and simple structures. The keybuildings could be log cabins, small storage buildings and agricultural buildings.Such buildings could also be larger architectural buildings, for instance inwoodlands. In the civil engineering area small bridges (footbridges, light vehicleaccess bridges), sound barriers and landscaping could be developed.
The essential material properties for small roundwood are its straightness, taper,durability, strength properties and joining methods. Architects and structuraldesigners would appreciate products that are also readily available,standardized, slightly processed and used locally. Treatment is also important.

140
Small roundwood is most often seen as a competitor of sawn goods, but thestructures could be developed with new ideas. The product must be pricedcompetitively and easy to install. Now, there is too little experience. Goodshowcase projects and instructions will promote the use of the product sinceend-users and designers have to be convinced of a product’s advantages."
5.4.2 Results by country
(i) United Kingdom
The UK has a small forest area (10.5 % of total land), large imports (90 % ofsawn timber), uses 10 Mm3/year of sawn timber, 43 % in construction.Roundwood use very small; 80 % for paper and boards, 20 % for fuel,fencing, leisure products and construction. Although the volume is low-use,there are many examples of pole-use from small barns to highly engineeredbuildings. As the country is moving to a more environmentally concernedattitude, the potential for roundwood in leisure and agriculture (buildings),transportation (cycle routes) and landscape and gardening is opening. Figure5.9 shows how these uses are of greatest importance in woodland, farmingand rural areas.
(ii) France
France is 27 % forested. It uses 15 Mm3/year in construction, which is 25 %of total consumption. There is little use of timber in building and round-polesare mainly used as telegraph poles and for urban furniture (sound barriers,retaining walls, crash barriers, snow fences). The perceived obstacles to theuse of roundwood are shown in Figure 5.10.

141
Woodland Farming Rural Suburban Urban
Small Round Diameter TimberCT95-0091/GB
University of Surrey
Industrial
Key:
Usage to smallround wood
High
Medium
Low
- -
commercial
Buildings
Agricultural
Leisure
Landscaping
Trans-portation
Bridges
POTENTIAL USE OF SMALL ROUND WOOD IN THE UNITED KINGDOM
)LJXUH�������5HVXOWV�RI�WKH�8.�6XUYH\�
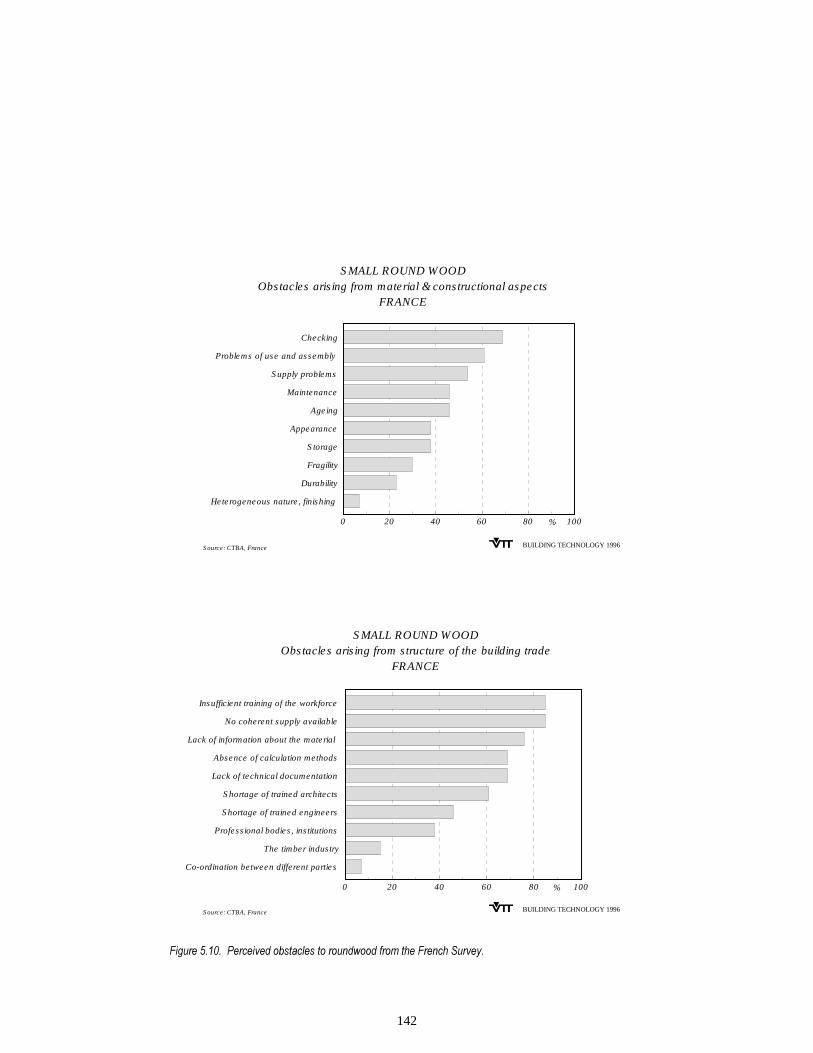
142
S MALL ROUND WOODObstacles aris ing from material & constructional aspects
FRANCE
S ource: CTBA, France BUILDING TECHNOLOGY 1996
Checking
Problems of use and assembly
S upply problems
Maintenance
Age ing
Appearance
S torage
Fragility
Durability
He terogeneous nature , finishing
0 20 40 60 80 100%
Insufficient training of the workforce
No coherent supply available
Lack of information about the material
Absence of calculation methods
Lack of technical documentation
S hortage of trained architects
S hortage of trained engineers
Profess ional bodies , ins titutions
The timber indus try
Co-ordination between different partie s
0 20 40 60 80 100%
S MALL ROUND WOODObstacles aris ing from s tructure of the building trade
FRANCE
S ource: CTBA, France BUILDING TECHNOLOGY 1996
)LJXUH��������3HUFHLYHG�REVWDFOHV�WR�URXQGZRRG�IURP�WKH�)UHQFK�6XUYH\�

143
(iii) The Netherlands
The Netherlands is 10 % forested, and 90 % of wood is imported. Forthinnings 0.7 Mm3/year is available, with 30 % going to paper and board.There is evidence of interest in round-pole use for leisure buildings(children’s farms, riding schools) and farm buildings. Problems are due tothe lack of architectural tradition and poor image, but the government istargeting these problems and there is a keenness to go “back to basics” inconstruction forms. The results of the Dutch survey are shown in Figure5.11.

144
ECONOMIC APPLICATIONLeisure buildings
Children farmHorse riding school
Farm buildingNoise barrierRoad barrier
Industrial building
OTHER APPLICATIONSPlay equipment/ ArtObservation towers
Urban furnitureExhibition buildings
Holiday cabinsBridges
RestaurantsAesthetic structures
Shell structuresTimber frame houses
Housing0 20 40 60 80 100
AgreeOpposeNo opinionNo answer
Potential use of small round wood in the Netherlands
Source: VTT, Building Technology BUILDING TECHNOLOGY 1996
%
Obs tructions to use small round wood in the Ne therlands
S ource : TUDelft 1996
Lack of des ign guide lines
Unfamiliarity
Detailing connections
No exis ting building sys tem
Problematic measure control
High costs
Durability
Maintenance
Aes the tically unattractive
0 20 40 60 80 100
Agree
Oppose
No opinion
No answer
%
0 20 40 60 80 100%
BUILDING TECHNOLOGY 1996
)LJXUH��������2XWSXW�IURP�WKH�'XWFK�6XUYH\�

145
(iv) Finland
Finland has a large forest area (15 % of total in Europe), with 1.8 Mm3/yearharvest potential for small construction roundwood; 0.25 Mm3/year could beused for construction in Finland. Timber is heavily used in the buildingindustry but very little of this is roundwood. The greatest potential is forbuildings under 200 m2, summer-houses, farm buildings and in framesystems for low cost halls. Tourism, related to the natural environment, couldincrease the potential market. The results from the Finnish survey ofengineers and architects are shown in Figure 5.12.
Poss ible use of small round wood in Finland
Yard equipments
Fences
Playgrounds
S mall buildings
Free -time buildings
Rural constructions
0 20 40 60 80 100%
0 20 40 60 80 100%
Source: VTT, Building Technology BUILDING TECHNOLOGY 1996
NEW BUILDINGS , S TRUCTURES
NEW BUILDINGS ,YARDS
NEW BUILDINGS , S ITE
REPAIR MARKET
CIVIL ENGINEER ING
44,0%
16,0%
24,0%
12,0%
4,0%
BUILDING TECHNOLOGY 1996
1993, TOTAL 250 000 m³
TOTAL MARKETS FOR S MALL ROUND WOOD
IN CONS TRUCTION , FINLAND
)LJXUH��������5HVXOWV�RI�WKH�)LQQLVK�6XUYH\�

146
(v) Austria
Austria is a major producer and user of timber (31 Mm3 per year, 6 % smallroundwood). The use of roundwood is essential to farmers, etc. who areunable to recover the cost of thinning operations. At present, architects show alow interest in roundwood and are hampered by a lack of experience inengineering structures. Farmers, however, are keen to see developments andhave the skills to design and build their own structures.
5.4.3 Conclusions
The market situation of small-diameter roundwood is different for each of theparticipating countries, which is partly due to their different traditions. Austria andFinland are more rural in character and better accustomed to rustic timberstructures, whereas France, and particularly the Netherlands and the UnitedKingdom are more urbanized countries and consequently have a higher resistanceto the use of wood as a building material. However, it can be seen that there areseveral similarities in the results collected from the different countries. Theseconcern the potential uses of roundwood and obstacles that would need to beremoved before roundwood can be utilized in construction projects.
For all the countries, it was clear that the potential market for round timber wouldbe for buildings located in rural areas. The buildings would generally be related tothe leisure and recreational industries (for example, cottages, holiday homes,bridges, children’s farms, equestrian buildings, towers) and agriculture. In suchareas, round-pole construction will often be regarded by architects as appropriatetechnology enabling it to be used in larger and more prestigious constructions.Currently, the most common use of roundwood is in landscaping and gardeningwhere the wood is used for noise walls, various barriers and fences, urbanfurniture, playground structures and pergolas.
In the countries where there is a good supply of timber, such as Finland andAustria, small-diameter roundwood structures can be built at competitively lowprices, particularly, when the building owner is carrying out the work himself.This includes simple small-scale structures, for example, multifunctional sheds,etc., which can be built on-site or delivered as a prefabricated package. Thesestructures could still be aesthetically pleasing.

147
Typical reasons why roundwood is seldom used when it would be perfectlysuitable are as follows:
• The material is not generally available to sell via normal commercialchannels.
• Architects, engineers and carpenters are not familiar with the strength orjointing characteristics of roundwood, nor do they have adequate designguidelines.
The material’s structural characteristics, which include straightness, taper,surface quality and moisture content, are important areas and will need to beconsidered as part of the project. It can be concluded that one of the aims of thisproject is to remove the obstacles that currently limit the use of roundwood as abuilding material. The most important and challenging task is to get the marketto work for roundwood by increasing the supply and demand together. Theresults from this project will provide valuable information to help increasepeople’s awareness of roundwood. The marketing of round-pole structures canbe expected to improve as more demonstration buildings are constructed.
It is important to direct further work as follows (Figure 5.13):

148
ENGINEERING STRUCTURES SMALL BUILDINGS
Architectural buildings(unique)
Public buildings
Small bridges
Sound barriers
Tourist areas
Simply buildingparts
Agricultural buildings
Quantitiesbecomefrom smallbuildings
FINUK
FR AUSNL
)LJXUH��������&RQFOXVLRQV�IRU�IXUWKHU�ZRUN�
1. The main volume of the use of small-diameter roundwood will be in non-structural use and in small traditional-type buildings. The project does not,however, include landscaping, urban furniture or other non-structural uses. Alsothose uses will benefit indirectly due to the improved availability of thematerial. In this project, it is essential to design models for relatively smallbuildings including the design of a total building: foundation, walls and roof. Inmost cases these structures do not require new innovations for a load bearingframe. The structural development work includes simple connections and safespan tables for these buildings. The types of structures to be developed include:
• Agricultural and rural buildings: cattle sheds, machinery stores, feedingsheds, drying sheds, storage buildings, garages, including the use with otherbuilding materials.

149
• Footbridges, small vehicular bridges and bridge elements.
• Noise walls and retaining walls on roads.
• Rural vernacular structures.
2. Small in volume but important for the image of roundwood is the use forarchitectural medium-size buildings for the leisure industry in which the load-bearing structure is visible. These buildings typically include a large room(restaurant, hotel lobby, or exhibition hall). Structural systems with load-bearingjoints for these structures will be developed.
5.5 Structure of programme
The work within the market study has thus identified two different end-users forthe work of the project. Firstly, a non-technical group, which requiredinformation on the design and ability to build simple structures where therequirement for detailed calculations to demonstrate the acceptability ofstructures would be minimal. For them the guidelines for architects and builderswere drafted. This booklet overviewed the use of roundwood and showed, byexample, the scope of use and details providing solutions to typical challenges.
Secondly, the engineering body including architectural engineers who wouldexpect to have detailed design information for the available roundwoods and themore common jointing techniques enabling them to incorporate roundwoodsinto the standard design procedures of EC5. This guideline would be very muchmore technical and direct in its presentation but would also use case studies todemonstrate the new-found versatility of roundwood.
Two further factors were identified:
• the overlap in the type, and sometimes scale of the structures between thetwo guidelines.
• the interest in peeled, concentric poles which had not been fully appreciatedat the start of the project.
• the need to limit the work of the project to solutions and forms suited tomore standard (and thereby volume) use.

150
• the importance of appreciating small-diameter roundwoods as appropriatecomponents within larger structures incorporating other materials ratherthan limiting the study to structures composed wholly or substantially of theroundwood sizes covered by the programme.
Figure 5.14 shows the table of end-uses suggested for round-poles and it isincluded in the non-engineered guidelines.
85%$1��&,7< 585$/ )$50,1* )25(675<
5(027(
&20021�86(6
/DQGVFDSLQJ
0LQRU�6WUXFWXUHV
121�(1*,1((5('
86(6�
%XLOGLQJV
6WUXFWXUHV
(1*,1((5('�86(6�
%XLOGLQJV
6WUXFWXUHV
3OD\JURXQG�HTXLSPHQW
3ODQW�FRQWDLQHUV 6XPPHUKRXVHV���3DWLRV )HQFLQJ�
)HHG�ER[HV
([HUFLVH�URXWHV $GYHQWXUH�WUDLOV
5RDG�HGJLQJ
6LJQV
,QIRUPDWLRQ�SRLQWV
+LGHV��6KHOWHUV
3DUN�NLRVNV
0DUNHW�VWDOOV
8UEDQ�IDUPV
DQG�]RRV
6SRUW�SDYLOOLRQV
LQ�SDUNV
6KHGV���:RUNVKRSV
%XV�VKHOWHUV
3DWKV��&\FOH�WUDFNV
5HWDLQLQJ�ZDOOV
2SHQ�EDUQV
$QLPDO�KRXVHV
6WRUDJH�VKHGV
�6LORV
(THVWULDQ�FHQWUHV
&RYHUHG�VWRUHV
7HPSRUDU\�LQGXVWULDO
ZRUNSODFHV
+ROLGD\�FRWWDJHV
6PDOO�YLVLWRU�FHQWUHV
+RXVHV��GRPHVWLF�DQG�VPDOO�FRPPHUFLDO
XQLWV
/DUJHU�FOHDU�VSDQ�DQG�PRUH�FRPSOH[
DJULFXOWXUDO�XVHV
9LVLWRU�FHQWUHV�DQG�
RIILFHV
5HVWDXUDQWV
5HWDLO�RXWOHWV
9HKLFOH�EULGJHV
/RRNRXW�DQG
FRPPXQLFDWLRQ
WRZHUV
)RRWSDWK�DQG�F\FOH�ZD\�EULGJHV
1RLVH�EDUULHUV
)DUP�DFFHVV
EULGJHV
/DUJHU�UHWDLQLJ
ZDOOV
6800$5<
&RPPRQ�DQG�QRQ�HQJLQHHUHG�XVHV�LQFUHDVH�LQ�PRUH�UXUDO�DQG�IRUHVWHG�DUHDV
)LJXUH��������8VDJH�RI�URXQG�SROHV�LQ�FRQVWUXFWLRQ�
5.6 Overview of uses
5.6.1 Playground and leisure equipment
One of the most common uses of roundwoods which demonstrates thepossibilities of the material to a much wider audience, is in playgroundfurniture. In all types of environment, roundwood has become the number-onematerial for climbing frames, swing structures and other structures for the larger

151
more complex and often theme playgrounds. Here the wood is used in a harshenvironment and very heavy expectations are put on it in terms of limitingcracking and splintering.
An advance, both technically and in size, leads to adventure trails, exerciseroutes, play forts, elevated woodland walks etc. Whereas the qualityplayground furniture is mainly prepared from concentric poles, here themembers are more likely to be debarked poles. Some examples are shown inFigures 5.15 and 5.16 taken from Moors Valley Country Park in the South ofEngland. Here the use of round-poles within a woodland area is aestheticallyessential but the examples demonstrate the reduced formality of the materialwhich makes it ideal for leisure projects where a more rural appearance and feelis important to combat the harshness and rush of urban life.
)LJXUH��������3OD\JURXQG�IRUW�IURP�:HVW�0RRUV�&RXQWU\�3DUN�LQ�(QJODQG�

152
)LJXUH��������%ULGJH�IRUPLQJ�SDUW�RI�D�WUHH�WRS�WUDLO�DW�:HVW�0RRUV�
Other examples of use for round-poles in this area cover:
• Landscaping; such as kerb lines and retaining walls in forests and countryparks
• Signing and small shelters for public notices• Fencing and retainers used to delineate areas, particularly in playgrounds
where short lengths of round-poles placed vertically can also act as acontainer for the soft wood chips needed in the play area for safety.
• Garden toys, planters, summerhouses and even patios• Landscaping and terracing of ponds and pools.
5.6.2 Commercial landscaping
A little different from the artistic structures of the leisure industry are the largerstructures used commercially such as noise barriers, heavy-duty fencing,retaining walls and loading platforms and retaining walls for storage pits. Herethe appearance will not match that of pre-formed materials but round-poles maybe used as a result of cost, availability and appropriateness to the environment.Figures 5.17 and 5.18 show examples.

153
)LJXUH��������6SHFLDOLVW�IHQFLQJ�DSSOLFDWLRQ�LQ�)LQODQG�
)LJXUH��������6WRUDJH�ELQV�FRPELQLQJ�URXQG�SROHV�DQG�VWHHO�ZLWK�DGGHG�SURWHFWLRQ�IRU�PDFKLQH�ORDGLQJRSHUDWLRQV�
5.6.3 Loghouses
Loghouses have a great tradition in forested countries and are now seen morecommonly in less likely environments such as the UK. They can vary fromsmall storage buildings, allowing natural ventilation, to large visitor centres butthe most common use is in small holiday chalets and summer homes. Someexamples of loghouses are shown in Figures 5.19, 5.20 and 5.21.

154
)LJXUH��������$Q�RSHQ�ORJ�KRXVH�VWRUDJH�EXLOGLQJ�LQ�)LQODQG�
)LJXUH��������$�ODUJH�ORJ�KRXVH�XVHG�DV�DQ�H[KLELWLRQ�FHQWUH�LQ�:DOHV��QRWH�DOVR�WKH�XVH�RI�URXQG�SROHV�LQ�WKHHQWUDQFH�ZDONZD\�

155
)LJXUH��������7\SLFDO�GHWDLOV�RI�ORJ�KRXVH�FRQVWUXFWLRQ�

156
5.6.4 Pole buildings and pole barns
Pole buildings are very popular, in particular for low-cost self-buildconstruction. Traditionally fully enclosed and insulated buildings would besmaller structures, perhaps limiting roundwood to the main vertical membersand secondary horizontals and using sawn timbers for principal beams andfinishes. Larger structures would then cover barns, animal houses and othersemi-industrial buildings. The size of roundwood would increase but so toowould the use, due to the reduced formality of the building. Smaller diameterswould be used in bracing, roof units and even claddings. The two forms arecombined in the increasingly common commercial buildings used as visitorcentres, parkland cafes, shops and garden centre offices, etc.
Details can vary depending on use and tradition. Poles may be sunk into theground, inserted into concrete bases or built off low walls. Floors may be atground level or built off the ground and roofs may take many different forms butare mainly exposed on their underside to give height and character to thebuilding.
Examples are shown in Figures 5.22, 5.23 and 5.24 and an extreme version isillustrated in Figure 5.25.
)LJXUH��������$UFKLWHFWV�YLHZ�RI�D�VPDOO�URXQG�SROH�FRQVWUXFWLRQ��E\�5ROI�.HUlQHQ��

157
)LJXUH��������$�YHU\�VLPSOH�RSHQ�EDUQ�URXQG�SROH�VWUXFWXUHV�XVHG�IRU�GU\LQJ�IHQFH�SRVWV�LQ�:DOHV�
)LJXUH��������$�YLVLWRU�FHQWUH�LQ�:DOHV�PDNLQJ�JRRG�XVH�RI�URXQG�SROHV�RI�GLIIHUHQW�GLDPHWHUV�

158
)LJXUH��������$Q�H[WUHPH�IRUP�RI�SROH�VWUXFWXUH�KRXVH�EXLOW���P�DERYH�JURXQG�OHYHO�LQ�)UDQFH�VXFK�WKDW�WKHIORRU�LV�WKHQ�DERYH�VHD�OHYHO�
5.6.5 Space frame and specialist roofs
Round-poles are perhaps less suited to trussed structures in roofs and will onlycompete where trussed rafters are less available or a special roof is needed.Round-poles are, however, very suited for use in three-dimensional spacestructures, where a short length and small cross-section are an advantage and theuse of a whole cross-section reduces problems from natural timber weaknesses.Much work in this field has been undertaken by the Dutch partner, PieterHuybers’ and is illustrated in Figure 5.26 and Figures 5.27 to 5.30.
)LJXUH��������)UDPHZRUN�IRU�D�WLPEHU�VKHG�LQ�+ROODQG�IHDWXULQJ�D�VSDFH�IUDPH�URRI�

159
)LJXUH��������6SDFH�IUDPH�URRI�LQ�EDUQ�LQ�(QJODQG�
)LJXUH��������([WHUQDO�VSDFH�IUDPH�ZLWK�ELUG�KRXVHV�LQ�D�FKLOGUHQV�]RR�LQ�+ROODQG�

160
)LJXUH��������+X\EHUV�VSDFH�IUDPH�MRLQW�GHWDLO�
)LJXUH��������6SDFH�IUDPH�W\SH�URRI�IRU�D�WUDLQLQJ�FHQWUH�LQ�(QJODQG�
The success of these structures commercially, aesthetically and structurally liesin the joint-linking members and in the connection of this joint with theroundwood. A significant part of the Guidelines for Engineers and Designers islinked to this work but is of much wider use due to the importance of the needfor a high-strength but low-cost in-line end connection. The poles themselvesare rarely the critical function in the design. Strength will be lost in theconnector and particularly when eccentricities are induced.
Other systems have been reviewed including one that relies on end-tube-shapedsleeve connectors and often uses wire pre-stressing to achieve rigidity (Figure5.31).

161
)LJXUH��������3ROHV�ILWWHG�LQWR�HQGFDSV�DQG�SUHVWUHVVHG�WR�JLYH�EXLOGLQJ�ULJLGLW\�
5.6.6 Towers and domes
The work on space structure roofs has expanded to other three-dimensionalforms, such as towers and domes where the jointing needs are similar. Aparticularly fine example of a tower at Apeldoorn in Holland is illustrated in thenext section, whilst a small dome which can easily be erected and dismantledfor exhibition use, is illustrated in Figure 5.32.
)LJXUH��������0RGHO�RI�D���P�KLJK�SROH�GRPH�FRQVWUXFWHG�LQ�+ROODQG�IRU�H[KLELWLRQ�XVH�

162
The scope for these structural forms is vast and 50-m span flat domes here havebeen shown to be fully feasible (Figure 5.33).
)LJXUH��������'HVLJQ�IRU�D����P�GRPH�WR�FRYHU�WKH�&,&$7�FHQWUH�LQ�+ROODQG�
5.6.7 Bridges
The use of round-poles in bridges is varied in both structural form and size/end-use. Simple forms using poles as principal spanning members are common andappropriate for woodland walkways and cycle paths (Figure 5.34). Larger spansrequire more complex forms. The solution in Figure 5.35 keeps the mainmembers and joints in compression, thus giving rigidity to the structure. Thesize of pole will determine the span but for the small-diameters associated withthis project spans of up to 15 m can easily be achieved.
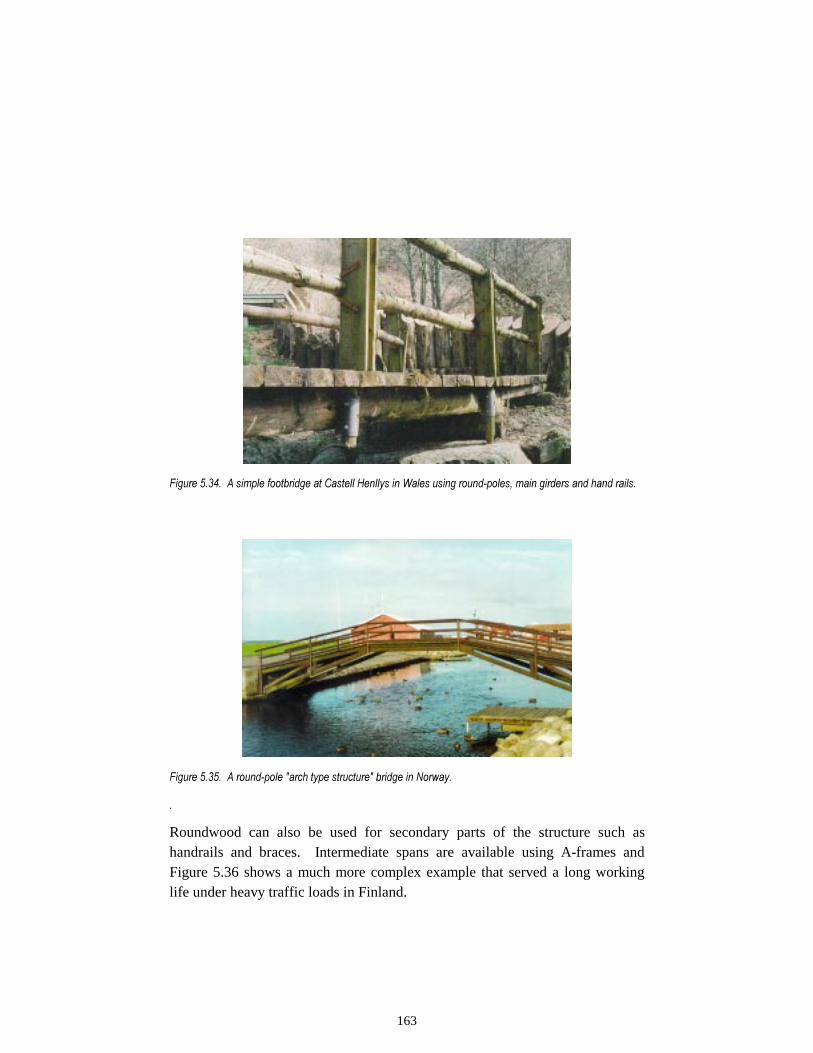
163
)LJXUH��������$�VLPSOH�IRRWEULGJH�DW�&DVWHOO�+HQOO\V�LQ�:DOHV�XVLQJ�URXQG�SROHV��PDLQ�JLUGHUV�DQG�KDQG�UDLOV�
)LJXUH��������$�URXQG�SROH��DUFK�W\SH�VWUXFWXUH��EULGJH�LQ�1RUZD\�
�
Roundwood can also be used for secondary parts of the structure such ashandrails and braces. Intermediate spans are available using A-frames andFigure 5.36 shows a much more complex example that served a long workinglife under heavy traffic loads in Finland.

164
)LJXUH��������$�)LQQLVK�H[DPSOH�RI�D�URXQG�SROH�EULGJH�FDUU\LQJ�KLJKZD\�ORDGLQJ�
Multi-span bridges are illustrated in their simplest form in the tree-top trail(Figure 5.34), whereas the higher technology form will probably be based on thespace structure relying on the joints detailed in Chapter 4.
5.7 Case studies related to round-pole group visits
5.7.1 Holland
The tour of round-pole structures organized by Delft University of Technologytook in the following:
• An animal farm at Rotterdam featuring a space frame roof, which allowedthe party to view the form of construction in detail since externally therewas an open framework used mainly as an architectural feature. Internally, itwas possible to walk through the roof structure itself and see theperformance of Huybers’ laced joint after a few years’ service.
• The entrance pavilion to the Efteling theme park at Kaatsheuvel designed byTon Van der Ven with structural advice from Hans Roosen. The buildingfeatures thatch-covered tent-shaped roofs with three 40-m high peaks overan open building 60 m wide. The largest poles are 40-m long, 0.65 m in

165
diameter but many of the poles branching from these main trunks are muchsmaller. The whole building demonstrates a fantastic use of round-poletechnology, very highly engineered to extremely precise tolerances butgiving the essential magical fairytale feel required for the building whichcould not have been achieved in any other material. Efteling is illustrated inFigure 5.37 and Figure 5.38.
)LJXUH��������7ZR�YLHZV�RI�WKH�(IWHOLQJ�VWUXFWXUH�LQ�+ROODQG�VKRZLQJ�WKH�XVH�RI�URXQGZRRG�ZLWK�RWKHUPDWHULDOV�

166
)LJXUH��������3ODQV�DQG�HOHYDWLRQ�RI�WKH�(IWHOLQJ�VWUXFWXUH�
• The Acacia Hall and the Teahouse at Apeldoorn. Illustrated earlier inFigures 5.7 and 5.8, these buildings showed the use of round-poles intraditional-type structures of the Dutch East Indies. Simple roof formsprovided an exciting open solution to these buildings in the middle of alarge woodland park.

167
• The Observation Tower at Apeldoorn. When viewed this was one of themost recent of Huybers’ space frame structures. The lookout towerillustrated in Figures 5.39, 5.40 and 5.41 is 27.0-m high with a base 8.1 m x8.1 m. All the joints are bolted with 16mm diameter high-strength bolts andwire lacing is incorporated to reduce the effects of splitting in the round-poles. Debarked larch is used and the principal members are 2.5-m and 3.6-m long, 12, 15 and 20 cm in diameter.

168
)LJXUH��������'HWDLOV�RI�+X\EHUV�WRZHU�DW�$SHOGRRUQ�LQ�+ROODQG�

169
)LJXUH��������7ZR�YLHZV�RI�WKH�$SHOGRRUQ�WRZHU�
)LJXUH��������3ROH�MRLQW�LQ�WKH�$SHOGRRUQ�WRZHU�

170
5.7.2 England
The UK visit to the University of Surrey concentrated on a tour of Hooke Parkin Dorset, where John Makepeace of the Parnham Trust had set up a school forwoodland industry. All the buildings and structures for the school, situated deepin woodland, featured round-pole technology. The buildings are an interestingcombination of forestry thinnings with very high-tech ideas carefully engineeredby Buro Happold in Bath. They demonstrate ideas of what can be achieved withround-poles particularly when reliance can be placed on epoxy gluing. However,they were seen by the project team to be one-off developmental structures, withonly limited relevance to the low-cost higher volume uses required for theround-pole project. The following buildings were viewed:
• The Prototype House. The single storey domestic building shown in Figure5.42 and Figure 5.43 has a size of 11.2 m by 8.5 m. The material used wasNorway Spruce. Two A-frames support a doubly curved roof structure using5.5-m long, 6 to 9-cm diameter hanging poles with an initial sag of 20 cm.Thus the roof load is carried in tension and taken out of the poles by epoxythreaded 12-mm steel rods connected to tension eyes.
)LJXUH��������,QWHULRU�$�IUDPH�DQG�UDIWHUV�LQ�SURWRW\SH�KRXVH�DW�+RRNH�3DUN�

171
)LJXUH��������7KH�SURWRW\SH�KRXVH�DW�+RRNH�3DUN�LQ�(QJODQG�
The Workshop Building. This is a 15-m span vault roof using Norwegian Sprucepoles 10.5-m long tapering from 18 cm to 7 cm. A crown section of two poleswas used to connect the bent poles through lapping bolted joints. At the base,the rods were fixed to concrete walls using grouted-in bolts. Details are given inFigure 5.44 and Figure 5.45.
)LJXUH��������6WUXFWXUDO�GHWDLOV�RI�WKH�:RRGODQG�6FKRRO�RI�,QGXVWU\�DW�+RRNH�3DUN�

172
)LJXUH��������([WHUQDO�DQG�LQWHUQDO�YLHZV�RI�WKH�ZRUNVKRS�EXLOGLQJ�DW�+RRNH�3DUN�
• The Westminster Lodge, architect Ted Cullen, is for studentaccommodation. The floor is raised above sloping ground and the load-bearing walls are made from clad roundwood. The main feature is the two-way spanning Vierendeel truss roof which required eight 3-m long poles tobe spliced together to form the top chord. The poles were approximately100 mm in diameter and were used in four layers to span the 8.4 m in twoprincipal directions. Blocking pieces provided shear connections betweenthe top and bottom layers adding stiffness in the central part of the span.See details in Figure 5.46.
)LJXUH��������6XSSRUW�V\VWHP�DQG�LQWHUQDO�URRI�VWUXFWXUH�RI�VFDUI�MRLQWHG�SROHV�IRU�WKH�:HVWPLQVWHU�/RGJH�DW+RRNH�3DUN�

173
5.7.3 Finland
The visit organised by VTT included a visit to children’s playground andharbour area in Lahti, a log-house exhibition in Järvenpää and a pole bridge inNurmijärvi. In Lahti, impregnated small poles are widely used in a children'spark (Launeen perhepäiväpuisto, Figure 5.47). Log-houses are normally used assummer cottages, but also about 1000 log-homes are built annually. Theexhibition area consisted of products of several manufacturers. The dimensionsused in log- houses are normally larger than would be considered by a small-diameter timber project.
)LJXUH��������&KLOGUHQV�SDUN�LQ�/DKWL�
The bridge (Figure 5.36) has total length of 51 m, maximum span of 16 m andnet width 6 m. The estimated load-carrying capacity corresponds to 32-tonvehicles with a 13-ton bogie unit. It was built in the mid-1960s and is still ingood condition.
Due to distances, more northern places were not visited, where a new andgrowing activity is to build cow-sheds from round timber (Figure 5.48).

174
)LJXUH�������$Q�XQLQVXODWHG�FRZ�VKHG�LQ�9LLWDVDDUL�����[����P�
5.7.4 Austria
The visit organised by BOKU in Austria took in the main factory for WolfSystem at Sharnstein and the small workshops of Herr Zopf together withnearby examples of his cowshed buildings. At Wolf, the team were shownmaterials and modules for a housing system using slabbed round-poles (seeFigure 5.49). Herr Zopf manufactured industrial sheds and other commercialstructures in roundwood using forced metal connector plates. Local timber,often owned by the client, was used and some large portal framed structureswere very effectively achieved and are detailed in Figures 5.1 and 5.50.

175
)LJXUH��������$XVWULDQ�PRGXODU�KRXVLQJ�V\VWHP�XVLQJ�VODEEHG�URXQG�SROHV�
)LJXUH��������'HWDLOV�RI�WKH�=RSI�V\VWHP�XVLQJ�IRUFHG�PHWDO�SODWHV�

176
6. Summary
The work covered the economy of harvesting and manufacturing of small-diameter round timber, strength testing and grading of the material, feasiblestructures to be built in roundwood and the development for jointingtechnologies.
The resource available for the production of small-diameter structural timberhas been studied in detail based on the first commercial thinning in Finland. Theresult was that the total resource is large. If only the best quarter ofcompartments is considered worth harvesting, 2.1 million m3 are available witha minimum diameter of 7 cm. However, the yield per hectare is variable andvery much dependent on the dimensions needed. When a diameter of 100 mm orless is adequate, the material can be harvested in the first commercial thinningin an economic way. Larger diameters are also available but the yield isnormally small, a few bolts per hectare. Figure 6.1 illustrates the yield perhectare in the best compartments as a function of the diameter of the finalproduct, assumed to be 25 mm less than the diameter of raw material.
For load-bearing structures, diameters such as 150 mm are usually needed.These are available from the second commercial thinning. This material hasbetter quality and a higher price. However, the raw material price is only aminor part of the production cost of finalized products, and will not jeopardizethe economy of round timber as building material.

177
Cylindrical spruce
0
50
100
150
200
250
50 100 150 200Diameter (mm)
Cos
t (eu
ro/m
3 )
0
20
40
60
80
100
120
Ava
ilabi
lity
(1/h
a)
l = 3 ml = 4 ml = 5 m
)LJXUH�������&RVW�RI�)LQQLVK�URXQGZRRG�PLOOHG�F\OLQGULFDOO\��H�P���DQG�DYDLODELOLW\�RI�WKH�UDZ�PDWHULDO�LQ�WKHILUVW�FRPPHUFLDO�WKLQQLQJ�RQ�WKH�EHVW�TXDUWHU�RI��IRUHVW�FRPSDUWPHQWV��SLHFHV�SHU�KD���'LDPHWHU�PHDQV�WKHVL]H�RI�ILQDO�SURGXFW��URZ�PDWHULDO�LV�SUHVXPHG�WR�EH����PP�ODUJHU�LQ�GLDPHWHU�
Production costs are estimated for products with different surface qualities: barkremoved only or machined cylindrical. The cost components are given in Table6.1. There are two production cases analyzed based on 3-m-long bolts and 100-mm top diameter of final product:
• In case (1) the trees are harvested and debarked manually, and naturalseasoning is used for drying. Top diameter of the bolts is 130 mm, volume39 l, ordinary quality.
• In case (2) mechanical harvesting and cylindrical peeling is used withdrying in an industrial kiln to 12 % moisture content. The top diameter ofthe bolts is 150 mm, volume 53 l, selected quality.

178
)LJXUH�������3KRWR�RI�PDQXDOO\�GHEDUNHG�DQG�SHHOHG�WLPEHU�
7DEOH�������([DPSOH�RI�SURGXFWLRQ�FRVW�EUHDNGRZQ��RI�URXQGZRRG�IRU���TXDOLW\�FODVVHV��<LHOG�LQ�GHEDUNLQJ�LVDVVXPHG�WR�EH������F\OLQGHU�ZLWK�WRS�GLDPHWHU�HIIHFWLYH��DQG�LQ�F\OLQGULFDO�SHHOLQJ�������G� �����PP��O� ��P�����RYHUKHDG�LQFOXGHG�
&DVH����PDQXDO��ORZ�FRVW &DVH����WHFKQLFDO��KLJK�TXDOLW\
(XUR���P� (XUR���P (XUR���P� (XUR���P
6WXPEDJH�SULFH ���� ���� ���� ����
+DUYHVWLQJ ���� ���� ���� ����
7UDQVSRUWDWLRQ�IRU�GHEDUNLQJ
RU�SHHOLQJ
���� ���� ���� ����
'HEDUNLQJ�SHHOLQJ ���� ���� ����� ����
&RVW�RI�GU\LQJ � � ���� ����
7RWDO�SURGXFWLRQ�FRVW ����� ���� ����� ����
The main reason for the higher prices of peeled products is the low yield ofpeeling. Because only half of the volume of raw material is possible to sell asthe product, it will more than double the price of raw material.

179
Low cost High quality Impregnated
0,0
0,5
1,0
1,5
2,0
2,5
euro
/m ∅
100 Processing
TransportHarvestingMaterial
)LJXUH�������&RVW�EUHDNGRZQ�RI�ORZ�FRVW��&DVH���LQ�7DEOH�������KLJK�TXDOLW\��&DVH�����DQG�LPSUHJQDWHG�KLJK�TXDOLW\�URXQG�WLPEHU�SHU�PHWHU�ZKHQ�GLDPHWHU�LV�����PP�
The production cost of cylindrical round timber per cubic meter seems to beclose to the cost of sawn timber. Accordingly, the reason to use high-qualityround timber is not the low cost, but the required round form. This product is forstructures where the round form is visible and the customer wants to have it.Cylindrical round timber can be cheaper, if the side product of rotary peelingcan be sold at a fair price.
The cost of debarked round timber is clearly lower than that of sawn timber,roughly half of it. It has high strength and the environmental characteristics aretop class. The disadvantage is the natural, irregular form, making it not easy touse in normal construction. It is best suited for buildings in which theappearance is not important.
In practice, the important qualities are those between the two extremesdescribed above. Two options are frequently used: conical peeling as traditionalpoles in electricity lines, or sawing partly (vane allowed) to have 1 to 4 straightsurfaces as needed. The cost of these is expected to be analyzed between thetwo cases.

180
When used out-of-doors, exposed to rain, as in a park and garden for smallstructures and for furniture, the material harvested from the first commercialthinning is of the right size, but it should be protected against biologicaldeterioration. Traditionally, CCA treatment has been used and it offers a goodprotection. For environmental reasons, new less toxic methods are needed andhave also been developed. Roundwood is a well-suited material for externalstructures and fences. It can be made more attractive by developing dryingmethods that produce round timber without checking. Round surface withoutcracks is also more durable, because water cannot enter the material thoughcracks or remain on horizontal surfaces.
The strength of small-diameter round timber was found to be relatively high:higher than can be obtained for sawn timber made from the same logs (Figure6.4). The characteristic bending strength of unsorted material may be evendouble the value of sawn timber.
0,0
0,2
0,4
0,6
0,8
1,0
20 30 40 50 60 70 80
Bending strength, N/mm2
Cum
ulat
ive
freq
uenc
y
Small round wood
Sawn timber
)LJXUH�������&XPXODWLYH�GLVWULEXWLRQ�RI�EHQGLQJ�VWUHQJWK�RI�URXQG�DQG�VDZQ�VSUXFH�EDVHG�RQ�����VSHFLPHQV�RIVDZQ�WLPEHU�DQG�����URXQG�WLPEHU�VSHFLPHQV�LQ�)LQODQG�
It is concluded that the same CEN strength classes that are used for sawn timbercan be used for small-diameter round timber for structural use. A proposal ismade for a visual grading system and the equivalence to CEN strength classes isanalyzed.

181
The correlation of visual grading parameters with strength is not any better thanhas been observed for sawn timber. However, visual grading is feasible forround timber: the yield of normal strength classes is high because of highstrength.
Non-destructive methods (X-ray, ultrasonic, Edyn) are promising for the gradingof round timber in the future. The bending test on round timber is moreproblematic than that on sawn timber. Therefore, non-destructive methods are amore promising alternative for future grading of round timber than traditionalgrading machines based on bending.
The methods for determination of modulus of elasticity were compared forDouglas fir and larch (Gard et al. 1998):
• vibration measurements ( Edyn)• bending method: measurement reference points in middle section and on
both ends of the specimens (Em stat global), see Figure 3.1• bending method: measurement reference points according to EN 408 (Em stat local).
The correlation coefficients between various E values are shown in Table 6.2.
It is concluded that the measurement of Em stat global is more reliable than Em stat local
in the case where the wood has large and variable knot sizes. Therefore themeasurement of Em stat global is seen preferable when a static bending test iscarried out. A proposal for a testing method is presented in the Appendix A.
Because of practical problems in performing the bending test, and inaccuracieswhere the diameter of pole is variable, it is suggested that determination ofEm dyn should be developed and adopted as a basic method for determination ofthe modulus of elasticity of round timber. It would be useful as a laboratorytool, but also a possible basis for strength-grading.
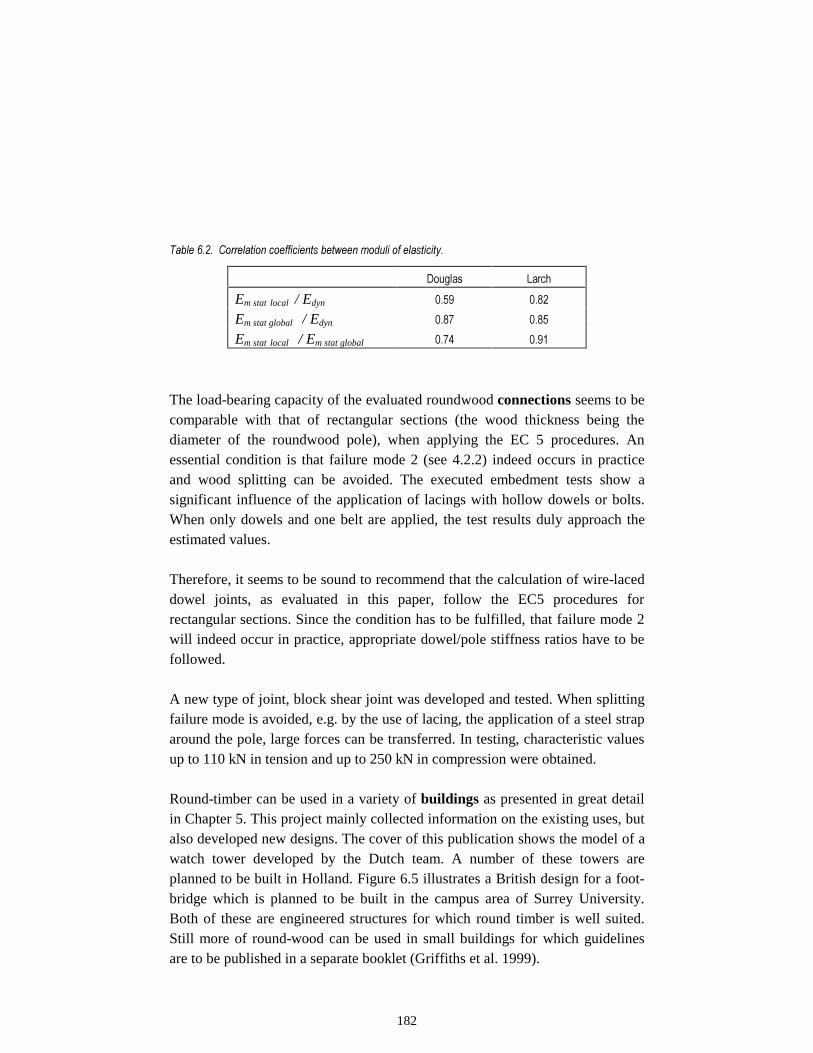
182
7DEOH�������&RUUHODWLRQ�FRHIILFLHQWV�EHWZHHQ�PRGXOL�RI�HODVWLFLW\�
'RXJODV /DUFK
Em stat local / Edyn ���� ����
Em stat global / Edyn ���� ����
Em stat local / Em stat global ���� ����
The load-bearing capacity of the evaluated roundwood connections seems to becomparable with that of rectangular sections (the wood thickness being thediameter of the roundwood pole), when applying the EC 5 procedures. Anessential condition is that failure mode 2 (see 4.2.2) indeed occurs in practiceand wood splitting can be avoided. The executed embedment tests show asignificant influence of the application of lacings with hollow dowels or bolts.When only dowels and one belt are applied, the test results duly approach theestimated values.
Therefore, it seems to be sound to recommend that the calculation of wire-laceddowel joints, as evaluated in this paper, follow the EC5 procedures forrectangular sections. Since the condition has to be fulfilled, that failure mode 2will indeed occur in practice, appropriate dowel/pole stiffness ratios have to befollowed.
A new type of joint, block shear joint was developed and tested. When splittingfailure mode is avoided, e.g. by the use of lacing, the application of a steel straparound the pole, large forces can be transferred. In testing, characteristic valuesup to 110 kN in tension and up to 250 kN in compression were obtained.
Round-timber can be used in a variety of buildings as presented in great detailin Chapter 5. This project mainly collected information on the existing uses, butalso developed new designs. The cover of this publication shows the model of awatch tower developed by the Dutch team. A number of these towers areplanned to be built in Holland. Figure 6.5 illustrates a British design for a foot-bridge which is planned to be built in the campus area of Surrey University.Both of these are engineered structures for which round timber is well suited.Still more of round-wood can be used in small buildings for which guidelinesare to be published in a separate booklet (Griffiths et al. 1999).

183
10 000
Water Level
Foundation
Outline of bridge
Handrail1200
BridgeSection
)LJXUH�������$�URXQG�SROH�IRRW�EULGJH�GHVLJQ�

184
References
Adjanohoun, G., Guillot, J.-L., Lanvin, J.-D. & Cholat, R. 1998. Smallroundwood grading by nondestructive X-rays and ultrasonic waves methods.Proceedings of World Conference on Timber Engineering, August 17–20, 1998,Montreux, Switzerland. Vol 1. Pp. 684-691.
Asikainen, A. 1995. Discrete-event simulation of mechanized wood-harvestingsystems. Tiedonantoja 38, Joensuun yliopisto, metsätieteellinen tiedekunta. 86p.
Barnard G. & Griffiths R. 1998. Strength characteristics for small roundwood inbending and compression from a UK resource. Proceedings of WCTE98-conference. Vol. 1. Pp. 602–609.
Barnard, G. 1997. Individual report of University of Surrey, UK. In: RoundSmall-diameter Timber for Constructions. Progress report 1996.
Blass, H. J. & Gard, W. F. 1994. Machine strength-grading. Proceedings: PTEC1994 Brisbane/Australia. Vol. 2. Pp. 598–603.
Blass, H. J., Aune, P., Choo, B. S., Görlacher, R., Griffits, D. R., Hilson, B. O.,Racher, P. & Steck, G. 1995. Timber Engineering, STEP 1. Basis of design,material properties, structural components and joints. First edition. Centrumhout, The Netherlands. ISBN 90-5645-001-8.
Boren, H. & Barnard G. 1999. Strength properties of round British and FinnishScots pine in bending and compression parallel to grain. Accepted forpublication in Paper and Timber. 12 p.
Boren, H. 1999. Physical and mechanical properties of Finnish thinning wood(Picea abies and Pinus sylvestris). Manuscript of doctoral thesis for Universityof Joensuu, Faculty of Forestry.
Bowerman, B.L. & O’Connell, R.T. 1990. Linear statistical models: an appliedapproach. 2nd edition. Belmont, California, USA. 1024 p. ISBN 0-534-22985-9.

185
Brunberg, T. 1988. Underlag för prestationsnormer för skördare islutavverkning. Summary: Instruments for setting productivity norms forharvesters in final cuttings. Skogsarbeten redogörelse 4. 20 p.
European standard EN 338, 1995. Structural timber - Strength classes. EuropeanCommittee for Standardization. Brussels.
European standard EN 384, 1995. Structural timber - Determination ofcharacteristic values of mechanical properties and density. European Committeefor Standardization. Brussels.
European standard EN 408, 1995. Timber structures - Structural timber andglued laminated timber - Determination of some physical properties andmechanical properties. European Committee for Standardization. Brussels.
European standard EN 518, 1995. Structural timber - Grading - Requiments forvisual strength-grading standards. European Committee for Standardization.Brussels.
Gard, W.F. 1996. Saving Drying Costs by Presorting Green Timber with Regardto Strength. 5th International IUFRO Wood Drying Conference in Quebec City/Canada, Proceedings. P. 555.
Gard, W.F., de Vries, P. & Lanvin, J.-D. 1998. Methods to determinemechanical properties in order to grade roundwood. WCTE Proceedings. Vol. 1.Pp. 634–641.
Griffits, R., Kivinen, T., Patzelt, M. & Pietilä, J. 1999. Use of roundwoodstructures. Guidelines for Architect and Builders. Manuscript for EU-publication.
Groot, C. 1999. Design guidelines for Engineered structures and connectionsusing small-diameter round timber. Manuscript for TUDelft report. 60 p.
Görlacher, R. 1984. Ein neues Messverfahren zur Bestimmung desElastizitaetsmodulus von Holz. Holz als Roh- u. Werkstoff 42, pp. 219–222.

186
Görlacher, R. 1990. Klassifizierung von Brettschichtholzlamellen durchMessung von Longitudinalschwingungen. Berichte der Versuchsanstalt fürStahl, Holz und Steine der Universität Fridericiana in Karlsruhe 4. Folge - Heft21.
Hakkila, P., Kalaja, H. & Saranpää, P. 1995. Etelä-Suomen ensiharvennus-männiköt kuitu- ja energialähteenä. [Young Scots pine first thinning stands inSouthern Finland as fibre and energy resource] Metsäntutkimuslaitoksentiedonantoja 582. Vantaa. 100 p.
Hakkila, P. 1996. Ensiharvennuspuun hyödyntäminen. [Utilizing wood fromfirst thinnings] Folia Forestalia - Metsätieteen aikakauskirja .Vol. 4, pp. 428–433.
Harstela, P. 1991. Work studies in forestry. Silva Carelica. Vol. 18. 41 p.
Hearmon, R.F.S. 1966. Vibration testing of wood. Forest Prod. J. Vol. 16, pp.29–39).
Heräjärvi, H. 1998. Ensiharvennuskuusen korjuu pyöreäksi rakennuspuuksi,tapaustutkimus. [Harvesting spruce for round construction timber, a case study].Metsäteknologian ja puutalouden pro gradu. Joensuun yliopisto. 60 p. Masterthesis in University of Joensuu.
Houtman, R., Groot, C.J.W.P. & van der Ende, G. 1998. Maximum strength ofwire-laced dowel joints for roundwood. Proceedings of World Conference onTimber Engineering, August 17–20, 1998, Montreux, Switzerland. Vol. 2. Pp.161–168.
Houtman, R. 1998. Estimation of the maximum load capacity of wire-laceddowel joints according to the yield theory of the EC5. Report C4-98-01, TUDelft, Fac CT, Delft, 1998. 17 p.
Hu, L.J. & Hsu, W.E. 1996. Implementation of transverse simple beam vibrationtechnique to determine modulus of elasticity for wood based materials:accuracy, comparability and limitations. Proceedings of the 10th InternationalSymposium on NDT. Pp. 227–235.

187
Huybers, P. 1996. The structural application of thin roundwood poles inbuilding. TU Delft. 122 p.
Huybers, P. 1990. Thin poles of roundwood for structural engineeringapplications in building. Chapman and Hall Ltd. Structural Engineering Review.Vol. 2. Pp. 169–182.
Imponen, V. 1995. Hake-, puu- ja puutavaralajimenetelmien taloudellisuusmassatehtaan kuitu- ja energiapuun hankinnassa. [The economy of chip, whole-tree and short-wood methods in the fiber and energy delivery of a pulp millabstract]. Bioenergian tutkimusohjelma -projekti 110. Väliraportti. Metsäteho.Helsinki. 20 p.
Imponen, V. & Kuitto, P.-J. 1986. Moottorisahakarsinnan ajanmenekinjakautuminen rungon osille. [Time distribution in chain saw debranching].Metsäteho. Helsinki. 6 p.
Jayanetti, D.L. 1985. Tests on wire-laced joints in round timber. TimberResearch and Development Association.
Kuitto, P.-J., Keskinen, S., Lindroos, J., Oijala, T., Rajamäki, J., Räsänen, T. &Terävä, J. 1994. Puutavaran koneellinen hakkuu ja metsäkuljetus. [Mechanizedtimber harvesting and forwarding]. Metsätehon tiedotus 410. Helsinki. 38 p.
Kärkkäinen, M. 1978. Viilusaannon teoreettinen malli. Summary: Theoreticalmodel for the veneer yield. Commun. Inst. For. Fenn. Vol. 95, No. 2, pp. 1–42.
Laasasenaho, J. 1982. Taper Curve and Volume Functions for Pine, Spruce andBirch. Commun. Inst. For. Fenn. Vol. 108. 74 p.
Lanvin, J.D., Nasri, N., Champellan, D. & Pascal, G. 1997. Classement des boisde structure au moyen d'un densimètre à rayons X. Colloque RAYONS X 1997.ENSAIS Strasbourg 14-16/10/1997. Les Edition de la Physique.
Liikkanen, R. 1992. Kuusikuitutukkien hakkuu miestyönä. [Manual harvestingof Norway spruce logs]. Metsäteho. 12 p.

188
Lilleberg, R. 1995. Harvennustapa männikön ensiharvennuksessa. [Thinningalternatives in first thinning of pine. Summary]. Metsäteho, katsaus 3/1995. 7 p.
Lilleberg, R. 1990. Kuormainharvesteri avo- ja harvennushakkuissa,maksuperustetutkimus. [Harvester in final and thinning harvesting; accrual basisstudy]. Metsäteho. 21 p.
Lukindo, A.R. 1996. Review of small roundwood connections. Wood DesignFocus Journal Dec. 96.
Lämsä, P., Kellomäki, S. & Väisänen, H. 1990. Nuorten mäntyjen oksikkuudenriippuvuus puuston rakenteesta ja kasvupaikan viljavuudesta. [Branchiness ofyoung Scots pines as related to stand structure and site fertility. Summary] FoliaForestalia. Vol. 746. 22 p.
Maa- ja metsätalousministeriö. 1988. Ensiharvennustyöryhmän muistio.Työryhmämuistio 1988:27. 57 p. [Ministry of Agriculture and Forestry.Memorandum from first thinnings].
Mattila, A. (toim.). 1995. Metsäalan palkkaus koulutusaineisto. Särmä, Puu- jaerityisalojen liiton jäsenlehti 14 c/1995.
Metsänhoitosuositukset. 1989. Keskusmetsälautakunta Tapio. 55 p. [Forestmanagement recommendations. Forestry Board Tapio].
Meyer, H. A. 1941. A correction for a systematic error occuring in theapplication of the logarithmic volume equation. Pa. State Forest SchoolResearch Paper, 7, pp.1–3.
Mäkelä, M. 1989. Koneellinen puunkorjuu kuusikon ensimmäisessäharvennuksessa. [Mechanized first thinning of Norway spruce stand].Metsätehon katsaus 10/1989. 6 p.
Mäkelä, M. 1990. Tavanomaiset kuormainharvesterit ensiharvennustenhakkuukoneina. [The use of conventional one-grip harvesters for first thinning.Summary]. Metsätehon katsaus 13/1990. 4 p.

189
Mäkelä, J. & Ryynänen, S. 1994. Polttopuun korjuu metsänomistajien tekemissäensiharvennuksissa. [Harvesting fuel wood from first thinnings done by forestowners]. Bioenergian tutkimusohjelma projekti 108, Väliraportti. Työtehoseurary. Helsinki. 8 p.
Niemistö, P. 1992. Runkolukuun perustuvat harvennusmallit. [Thinning modelsbased on stem number]. Metsäntutkimuslaitoksen tiedonantoja 432. 18 p.
Niemistö, P. 1994. Männikön ensiharvennus ala-, ylä- tai laatuharvennustakäyttäen. [First thinning of Scots pine stand using low, high or quality thinning]Folia Forestalia - Metsätieteen aikakauskirja 1994(1), pp. 19–32.
Nurmi, J. 1994. Työtavan vaikutus hakkuukoneen tuotokseen ja hakkuutähteenkasautumiseen. [Effect of working method on harvesting out put and loggingresidue accumulation]. Folia Forestalia - Metsätieteen aikakauskirja 1994(2),pp. 113–122.
Oijala, T. & Terävä, J. 1994. Puunkorjuun kustannusten jakaminentavaralajeille. [Division of harvesting costs on timber assortments. Summary].Metsätehon katsaus 12/1994. 6 p.
Oijala, T. & Örn, J. 1995. Korjuun kustannusvertailun laskentaohjelman käyttö -Excel. Metsäteho. 6 p.
Pahkinen, E. & Lehtonen, R. 1989. Otanta-asetelmat ja tilastollinen analyysi.Gaudeamus. Helsinki. 286 p.
Patzelt, M. 1998. Individual report of BOKU, Austria. In: Round Small-diameter Timber for Constructions. Progress report 1997.
Patzelt, M. & Obrich, R. 1998. Influence of knots on bending strength of small-diameter roundwood as basis of a simple strength-grading method. Proceedingsof World Conference on Timber Engineering, August 17–20, 1998, Montreux,Switzerland. Vol. 1, pp. 714–715.

190
Perstorper, R. M. 1994. Dynamic modal tests of timber evaluation according toEuler and Timoshenko theory. In: Quality of structural timber- end-userrequirements and performance control. Pp. IIb-1–IIb-21. ISSN 0534-0411.
Perälä, A.-L. (ed.) 1997. Round small-diameter timber for construction. Marketsummary. VTT Research Notes 1877. Espoo 1997, 30 p. Final report of task 2A.
Perälä, A.-L.1997. Round small-diameter timber construction market in Finland.VTT Research Notes 1867. Espoo. 33 p. + app. 12 p.
Ranta-Maunus, A., Saarelainen, U. & Boren, H. 1998. Strength of small-diameter round timber. CIB W18 meeting in Savonlinna, Paper 31-6-3. 10 p.
Sirén, M. 1990. Pienet hakkuukoneet varhaisissa harvennushakkuissa. NSR-tutkimus. Summary: Small multi-function machines in early thinning operations.A joint Nordic NSR-study. Folia Forestalia 743. Metsäntutkimuslaitos. Helsinki.29 p.
Sluis, E.W.P., Groot, C.J.W.P. & van der Erde, G.1998. The block shear joint, anew joint for roundwood structures, Proceedings of World Conference onTimber Engineering, August 17–20, 1998, Montreux, Switzerland. Vol. 2. Pp.268–275.
Sluis, E.W.P. 1999. The block shear joint. Report C4-99-01, TU Delft, Fac CT,Delft. 24 p.
Sluis, E. 1998. Testing of the block joint, a new joint for roundwood structures.TU- Delft, Report C4-98-02.
Sluis, E.1998. Embedment testing of the block joint. TU-Delft, Report C4-98-03.
Tapion taskukirja. 1997. 23. uudistettu. Kustannusosakeyhtiö Metsälehti. 638 p.
Vries, de P.A. 1998. Quality and strength characterization of small-diameterLarch (Larix kaempferi (LAMB.) CARR.). Report C4-98-01, Delft University,Delft/Netherlands.

191
Vries, de P.A. & Gard, W.F.1998. The development of a strength-gradingsystem for small-diameter round timber, accepted for publication in HERON.14 p.
Vries, de P. 1998. Strength-grading of small-diameter larch, Delft University ofTechnology, report C4-98-02. 33 p.
Vries, de P. 1998. Quality and strength characterization of homegrown (Dutch)Larch, Delft University of Technology, report C4-98-01. 27 p.
Vuokila, Y. 1976. Ensiharvennuskertymä. [Yield from the first thinning.Summary]. Folia Forestalia 264. 12 p.

A1
APPENDIX A
Voluntary Product Standard VPS-SRT-1 Draft 1999-02-01
Structural round timber - Determination ofbending and compression characteristics
1. Scope
This standard specifies the test methods for determining the followingproperties of the structural round timber: modulus of elasticity in bending,bending strength, the modulus of elasticity in compression parallel to the grain,and compression strength parallel to the grain.
This standard is applicable for cylindrical shapes or for tapered shapes of roundstructural timber, or when the shape is partially cylindrical and partially tapered,and including oval cross-sections.
Where this standard does not describe a test method for a type of test themethod from EN 408 can be applied.
2. Normative references
EN 408 Timber structures - Structural timber and glued laminated timber - Determination of some physical and mechanical properties
VPS-SRT-3 Structural round timber - Sizes, permissible deviations

A2
3. Symbols
A cross-sectional area, in square millimetres
a distance between loading position and nearest support in bending test, in millimetres
d diameter of round timber, in millimetresd1 diameter of round timber at or close to the failuredn diameter of round timber perpendicular to the direction of load at he
midspan, in millimetresdv diameter of round timber in the direction of load measured at the mid span, in millimetresEc,0 modulus of elasticity parallel to the grain, in newtons per square millimetreEm modulus of elasticity in bending, in newtons per square millimetreEm,global modulus of elasticity in bending over the total span, in newtons per square millimetreF load, in newtonsFmax maximum load, in newtonsfc,0 compressive strength parallel to the grain, in newtons per square millimetrefm bending strength, in newtons per square millimetreI second moment of area, in millimetres to the fourth power
I = π . dv13 . dh1 /64
l span in the bending, or the length of the piece between the loading plates in the compression test, in millimetres
l1 gauge length for the determination of modulus of elasticity, in millimetres
W section modulus, in millimetres in the third powerw deflection or displacement in compression, in millimetres.
4. Determination of dimensions of test piece
The dimensions shall be measured to an accuracy of 1 %. All the measurementsshall be made when the test pieces are conditioned as specified in clause 7.

A3
5. Determination of the moisture content of test pieces
The moisture content of the test piece shall be determined on a section takenfrom the test piece. For structural round timber, the section shall be of fullcross-section, free from knots and resin pockets.
In the strength test, the section shall be cut as close as possible to the failure.
6. Determination of density of test pieces
The density is measured from a disk, taken close to the point of failure. Theimmersion method is recommended.
7. Conditioning of test pieces
The test pieces should be conditioned at +20 oC, 65 % RH to a constant weight,which is considered to be attained when the results of two successiveweightings, carried out at an interval of 6 h, do not differ by more than 0.1 % ofthe mass of the test piece.
8. Bending test
8.1 Test piece
The test piece shall have a minimum length of 19 times the diameter of theround timber. For conical shapes see the span table in the next paragraph.Where this is not possible, the length of the timber shall be reported.
8.2. Procedure
The test piece shall be symmetrically loaded at two points over a span of 15 to21 times the minimum diameter of the round timber. The loading heads shall beplaced at the third points of the span as shown in Figures 1 and 2.

A4
Where the diameter of the round timber is cylindrically processed to a targetsize, the span should be 18 times that target size. Where the actual diameter isnot processed to a target value, the span corresponding to the top diameter of thetimber can be taken from the following table:
Top diameter range Nominal diameter(VPS-SRT-3)
Span
75 to 99 mm 75 mm 1500 mm100 to 124 mm 100 mm 1950 mm125 to 149 mm 125 mm 2400 mm150 to 174 mm 150 mm 2850 mm175 to 199 mm 175 mm 3300 mm200 to 224 mm 200 mm 3750 mm225 to 249 mm 225 mm 4200 mm250 to 275 mm 250 mm 4650 mm
If the test piece or the equipment does not permit these conditions to beachieved exactly, the distance between the load points and the supports may bechanged by an amount not greater than 1.5 times the diameter of the roundtimber and the span and the test piece length may be changed by an amount notgreater than three times the diameter of the timber, while maintaining thesymmetry of the test set-up.
The test piece should be placed in a random position with regard to loadingdirection. However, for practical reasons it is recommended to place the sweepin the direction of loading or opposite to it.
The test piece shall be simply supported.
Note: Shaped wooden blocks of length not greater than the diameterof the round timber may be inserted between the piece and theloading heads or supports to minimize local indentation. The blocksunder the loading heads may have different heights to take intoaccount the possible tapering of the wood.
The test arrangement shall maintain the loading forces equal.

A5
Load shall be applied at a constant rate. The rate of movement of the loadingheads shall be not greater than 0.003 d mm/s, and so adjusted that the maximumload is reached within (300 ±120) s in case of determining bending strength.
The loading equipment used shall be capable of measuring the load to anaccuracy of 1 % of the load applied to the test piece, for loads less than 10 % ofthe maximum applied load, and with the accuracy of 0.1 % of the maximumapplied load.
Deformations shall be determined with an accuracy of 1 % or, for deformationsless than 2 mm, with an accuracy of 0.02 mm. The rotation of the test pieceduring the test shall be considered and taken into account.
The diameters in the direction of the load, dv, and perpendicular to the load, dh,are measured at the mid-span.
6D 6D6D
5D
WL
F/2 F/2
)LJXUH�����%HQGLQJ�WHVW�DQG�PHDVXUHPHQW�RI�ORFDO�GHIOHFWLRQ�Z/�GHWHUPLQDWLRQ�RI�PRGXOXV�RI�HODVWLFLW\�
8.3 Expression of test results
The local modulus of elasticity in bending Em (Figure 1) is given by the equation
E ma l F F
I w wL L=
−−
12
1 62 1
2 1
( )
( )
where

A6
F2 - F1 is an increment of the load on the straight-line portion of the loaddeformation curve, in newtonsNote: F1 and F2 should be taken as 10 % and 50 %, respectively,of the maximum load.
wL2 - wL1 is the increment of local deflection corresponding to F2 - F1,in millimetres, having been measured at the centre of a centralgauge length of about five times the diameter of the round timber.
Alternatively, the global modulus of elasticity in bending Em,global (Figure 2) canbe calculated, which is given by the equation
Ea l a F F
I w wm g lo b a lG G
,( ) ( )
( )=
− −−
3 2 4 2
4 82 1
2 1
where
wG2 - wG1 is the increment of total deflection at the centre of beam,corresponding to F2 - F1, in millimetres
a is the shorter distance between the loading position and thesupport.
The modulus of elasticity shall be calculated to an accuracy of 1 %.
6D 6D6D
WG
F/2 F/2
18D
)LJXUH�����%HQGLQJ�WHVW�DQG�PHDVXUHPHQW�RI�JOREDO�GHIOHFWLRQ�Z*�IRU�GHWHUPLQDWLRQ�RI�PRGXOXV�RI�HODVWLFLW\�

A7
The bending strength fm is given by the equation
fF a
d dm
h v
=1 6
2m ax
π
The strength shall be calculated to the accuracy of 0.1 N/mm2.
Note: The accuracy of determination of modulus of elasticity depends on thematerial characteristics as knots. Global modulus of elasticity is less sensitive tothe effect of large knots and can be recommended especially for cylindricalpoles.
9. Compression test parallel to the grain
9.1 Test piece
The test piece shall be of full cross-section, and shall have a length of six timesthe diameter of the round timber. The end surfaces shall be accurately preparedto ensure that they are plane and parallel to one other and perpendicular to theaxis of the piece.
9.2 Procedure
The test piece shall be loaded concentrically. The load shall be applied at aconstant rate. The rate of movement of the loading head shall not be greater than0.00005 l mm/s. The maximum load should be reached within (300+120) s. Thetime to failure of each test piece shall be recorded and its average reported. Anysingle piece diverging more than 120 s from the target of 300 s shall be reported.
9.3 Expression of test results
The modulus of elasticity in compression is given by the equation
El F F
A w wc ,( )
( )01 2 1
2 1
=−−

A8
The compressive strength is given by the equation
fF
Ac ,m a x
0 =
The cross-sectional area A = π d1 d2 / 4. The diameters in two perpendiculardirections, d1 and d2, are measured at or close to the fracture.
The mode of fracture and growth characteristics at the fracture section of eachtest peace shall be reported.

B1
APPENDIX B
Voluntary Product Standard VPS-SRT-2 Draft 1998-10-28
Structural round timber - grading -requirements for visual strength-grading
standards
Foreword
This standard has been prepared as part of the EU/FAIR research project“Round small-diameter timber for construction” (1996-1998). Small-diametermeans that all the tested timbers in the project had a diameter of between 50 and200 mm, the main part of test specimens being in the range of 100 to 150 mm.
Introduction
Strength-grading rules exist for the overhead transmission poles. While thetransmission poles are mainly designed for the ground level bending strength,the structural round timber may be used as, e.g. compression members (studs) oras beams. Consequently, the grading rules may differ from the pole-gradingrules. Different species grow differently and may need different grading rules,which can yield in different strength classes.
This standard proposes that strength classes for structural timber as given in EN338 may be used also for round structural timber and the characteristic valueswill be determined in accordance with the principles of EN 384.
1. Scope
This standard gives basic principles for visual strength-grading standards. InAppendix A, strength-grading standards for two different species are presented.

B2
2. Normative references
This standard incorporates dated or undated references. For undated referencesthe latest edition of the publication referred to applies.
EN 338 Structural Timber - Strength Classes
EN 384 Structural Timber - Determination of characteristic values ofmechanical properties and density
EN 844 Round and sawn timber - Terminology
EN1310 Measurement of features.
3. Definitions
For the purposes of this standard the following definitions apply:
3.1 Spiral grain: The apparent deviation of the grain orientation on the surfaceof the round timber from the orientation of the longitudinal axis of the timber.The grain deviation may in the clockwise or in the anticlockwise direction.
3.2 Grading diameter: the diameter of the round wood, which is measured ator above the knot, not including the knot butts.
4. Requirements for the standards on visual strength-grading of round structural timber
The grading standard shall include limits for the characteristics and theirmethods of measurement given in the clauses 5 to 7.
If grading is restricted to a special use, e.g. compression, this shall be clearlystated.
If there are any restrictions or additional criteria with regard to the application

B3
of the rules, they shall be stated in the standard. Such criteria shall relate to thestrength or constructional use of the timber.
Unless otherwise stated, 20 % moisture content shall be taken as the referencepoint for all measurements.
Limits of reduction in size shall be stated beyond which reprocessing invalidatesthe grading.
5. Strength reducing characteristics
5.1 Knots
Maximum diameter of the knots or the knot hole, measured along the girth ofthe round timber, shall be specified.
The knot grouping, over a length of 150 mm shall be specified.
5.2 Spiral grain
The standard shall have a definition of slope of grain, a method for itsmeasurement and limitations on the spiral grain for each grade specified.
5.3 Rate of growth
The grading standard shall contain a requirement for the rate of growth, itsmethod of measurement and limits for it.
5.4 Cracks
The maximum length and the sum of the depths of the radial cracks at a cross-section should be defined.
5.5 Reaction wood
The relative amount of reaction wood in a cross-section should be defined.

B4
6. Geometrical characteristics
6.1 Ovality
The maximum deviation of roundness, its method of measurement and the limitsshall be defined.
6.2 Sweep
The maximum continuous or abrupt curvature as a deviation of the straight lineshall be defined, as well as its method of measurement and the limits shall bedefined.
6.3 Machining defects
The maximum extent of machining defects, like cuts and hairy grain, shall bedefined.
7. Biological characteristics
7.1 Bark
The requirement for the inclusion of bark and/or cambium should be defined.
7.2 Fungal and insect damage
The standard shall include requirements that limit fungal and insect damage toround timber, and which prohibit round timber under live insect damage.
8. Other characteristics
The standard may include requirements that limit the presence of oil, mud andother discolouring substances on the surfaces.

B5
9. Marking
Each graded piece shall be marked. A description of the marking shall be given.The marking shall as a minimum give the following information:
a) strength class and/or gradeb) species or species combinationc) producerd) the standard to which it is graded.

B6
Annex A to VPS-SRT-2
Strength-grading standard for roundstructural timber - Norway Spruce (Piceaabies) and Scots Pine (Pinus sylvestris)
1. Scope
This standard covers the visual strength-grading of structural round timber ofspruce grown in the Scandinavian countries based on the EU/FAIR researchproject “Round Small-diameter Timber for Construction” (1996-1998) in whichtesting was limited to diameters below 200 mm. This standard can be applied toround timber with different surface qualities: cylindrical or conical machinerounded or debarked timber.
2. Grading limitations
The grading should take place after surface machining of the timber (debarking,lathe work) and after drying to a moisture content less than the fibre saturationpoint. Surface smoothing is not considered to change the grade. Some of thecharacteristics, like cracks, vary in size according to the moisture content, andtheir size may differ at the time of grading from those at the MC of 20 %.
3. The measurement of the strength reducingcharacteristics
3.1 Knots
The knots are measured along the girth, not including the callus. The diameterof the knot is limited in relation to the grading diameter. The limits are in Table1.

B7
3.2 Knot groupings
The sum of the knots of a knot grouping is related to the grading diameter. In acluster, all the knots within a longitudinal distance of 150 mm are included. Thelimits of the knot groupings are in Table 1.
3.3 Top defect
Top defect is not allowed in structural round timber. Double pith is not allowed.
3.4 Spiral grain
Spiral grain is measured as a deviation of the grain from the longitudinal lineand it is measured along the girth. The spiral grain is expressed as 1 to x (1:x),where x is the number of the units in the longitudinal direction when thedeviation is one unit. The limits of the spiral grain are in Table 1.
3.5 Rate of the growth
The average rate of growth is measured at the top end of the round timber. Themeasuring takes place along the radial line through the pith, where the distancefrom the pith to the surface is the maximum. The number of growth rings iscounted starting at 25 mm from the pith and ending at the outer circumference.The rate of growth is expressed as the average of annual ring widths. The upperlimits of the rate of the growth are in Table 1.
3.6 Cracks
Cracks other than in the radial plane are not allowed. No radial crack may passthe pith. Two radial cracks at a cross-section are allowed only if the less deepcrack has the depth of less than a half of the radius of the round timber. Thelimits for the depth and for the length of the cracks are in Table 1.
3.7 Reaction wood
Reaction wood is measured as a percentage of the cross-section. The limit of theamount is in Table 1.

B8
4. Limitations for geometrical characteristics
4.1 Ovality
The difference between the maximum and the minimum diameter at any cross-section in relation to the maximum diameter is defined as the ovality. The limitsfor the ovality are in Table 1.
4.2 Sweep
The maximum height of the arch on the concave side of the round timber ismeasured over the span of 2 meters. The limits of the sweep are in Table 1.
4.3 Machining defects
The maximum depth of cuts is limited as in Table 1. The length of the cuts islimited to 25 % of the length of the structural round timber.
5. Biological characteristics
5.1 Bark
The bark is not allowed, except in bark pockets or in bark ringed knots. Thecambium is evaluated over the length of 1 metre and is expressed as thepercentage of the cambium-covered surface to the surface of that 1-m-length.The limits of the cambium are in the Table 1.
5.2 Fungal and insect damage
No decay is allowed. The blue stain is allowed. The insect holes are allowedonly in the kiln-dried round timber.
6. Surface cleanness
The surface of the round timber should be free from soil and oil.

B9
7. Allowable characteristics
7DEOH�����/LPLWV�RI�WKH�FKDUDFWHULVWLFV�
&KDUDFWHULVWLF *UDGH�´$µ *UDGH�´%µ
6L]H�RI�WKH�NQRW��LQ�UHODWLRQ�WR�WKH�JUDGLQJ�GLDPHWHU��PP ���� ����
6XP�RI�NQRWV��LQ�UHODWLRQ�WR�WKH�JUDGLQJ�GLDPHWHU ���� �����
6SLUDO�JUDLQ ���� ���
5DWH�RI�WKH�JURZWK��PP � �
6LQJOH�FUDFN��GHSWK�LQ�UHODWLRQ�WR�WKH�JUDGLQJ�GLDPHWHU ���� ����
6LQJOH�FUDFN��OHQJWK QRW�OLPLWHG QRW�OLPLWHG
6XP�RI�DQ\�WZR�FUDFNV�DW�D�FURVV�VHFWLRQ��LQ�UHODWLRQ�WR�WKH
GLDPHWHU
���� ����
5HDFWLRQ�ZRRG��UDWLR�WR�WKH�FURVV�VHFWLRQ ���� ����
7DSHULQJ��PP�P XQPDFKLQHG
PDFKLQHG
�
�
��
�
2YDOLW\ XQPDFKLQHG
PDFKLQHG
����
���
����
����
6ZHHS��RYHU���PHWHUV ��PP ���PP
0DFKLQLQJ�GHIHFWV��PD[LPXP�GHSWK ��PP ��PP
&DPELXP ���� ����
,QVHFW�KROHV QRW�SHUPLWWHG�LQ�WKH
DLU�GULHG�WLPEHU
QRW�SHUPLWWHG�LQ�WKH
DLU�GULHG�WLPEHU
8. Marking
The round structural timber is marked at the butt end or on the surface close tothe butt end. The marking shall give the following information:
a) Grade “A” or “B”b) Species ER = European Redwood, EW = European Whitewoodc) Producerd) The number of this standard, e.g. VPS-SRT-2:Ae) The size according to the standard VPS-SRT-3f) “KD”, if the timber is kiln-dried.

C1
APPENDIX C
Voluntary Product Standard VPS-SRT-3 Draft 1998-10-27
Structural round timber - Sizes, permissibledeviations
1. Scope
This standard defines the sizes of the structural round timber and thepermissible deviations.
2. Normative references
This standard incorporates dated or undated reference. For undated referencesthe latest edition of the publication referred to applies.
VPS-SRT-2, draft Voluntary Product Standard, Structural round timber - grading - requirements for visual strength grading standards
3. Method of measuring
The length of the structural timber is the minimum distance between the fullcircumferences at the top and at the butt. Thus the inclined cross cuttings areignored. The diameter of the of the round timber is the minimum diameter at thetop end of the round timber. If the moisture content at the time of measurementdeviates from 20 %, the measured size of the diameter can be adjusted byincreasing it by 0.25 % for difference in moisture content short of 20 %, ordecreasing it by 0.25 % for difference in moisture content in excess of 20 % andup to 28 %.

C2
4. Timber diameters
The size of the round timber is expressed as the next fulfilling size in series of75 to 200 mm, in steps of 25 mm.
Note: If the minimum diameter is measured as 89 mm, the size ofthe round timber is 75 mm.
By the agreement between the producer and the client, the timber sizes may bedefined differently.
5. Deviations
The size of the timber is, by definition, within tolerances of -0, +25 mm.
In the case of cylindrically shaped structural round timber, an unmachined, butdebarked area of a maximum length of 500 mm and not covering more than 25% of the circumference and not reducing the diameter by more than 5 mm isconsidered to meet the size.
The length of the timber is expressed in fulfilling multiples of 300 mm, or itshall meet the requirements of the client with tolerances -0, +50 mm.