“A known but an indifferent judge”: Situating Ronald Dworkin in ...
Upload
innovationoecdCategory
view
124download
1
Institute for Statistical Studies and Economics of
Knowledge
The value of innovation statistics – is data
indifferent to the complexity of firm strategies
Vitaliy Roud,
Leonid Gokhberg
19 September 2016
Blue Sky III – Ghent

2© National Research University Higher School of Economics,
2015
Outline
Hypothesis: link between the sophistication of innovation strategy and
the comprehension of the innovation survey questionnaire
Data and method
Strategies for collecting data
Perception of the questionnaires
Accuracy of data provision
Grading the quality of survey fill-in
Testing the link between innovation strategy and quality of data
provided

− Qualified innovation managers of larger enterprises
are the best to recognize the core concepts
− Informal innovators would face all sorts of difficulties
3
Hypothesis: Competences to fill in the innovation survey
questionnaire and the sophistication of innovation strategy
• Cognitive testing of innovation studies – companies are not
equal in comprehension of innovation survey concepts
• Two extrema:
• This study: to operationalise the continuum of states
between total comprehension and total misunderstanding

Data
4
Monitoring of Innovation Behaviour of Enterprises
• Russian branch of the European Manufacturing Survey
(Consortium of 18 research centres coordinated by
Fraunhofer ISI)
• Original methodology compliant with the Oslo Manual, EU CIS and
Russian Innovation Survey
• Executed by Higher School of Economics Institute for Statistical
Studies and Economics of Knowledge biannually since 2009:
http://issek.hse.ru/innoproc/en/
• Round 2015: ~1300 enterprises in Manufacturing and ICT
• Personal interviews with the top management, stratified representative
sample (firm size, sector)
Firm-level data on:
• Conventional indicators of innovation
• Participation in national innovation surveys

Methods
5
Latent class analysis:
comprehension of the
innovation survey
concepts
Latent class analysis:
accuracy of data provision
Latent class analysis:
strategies of data
collection
Stage 1: understanding the diversity
Stage 2: reducing the dimensions
Principle component
analysis: comprehension
and accuracy of data
Multiple choice regression
(mlogit): grade of quality and the
sophistication of innovation
strategy
Stage 3: testing the heterogeneity
Latent class analysis – grade of
the survey participation quality:
comprehension and accuracy of
data
Innovation Strategy
Technology level
General controls
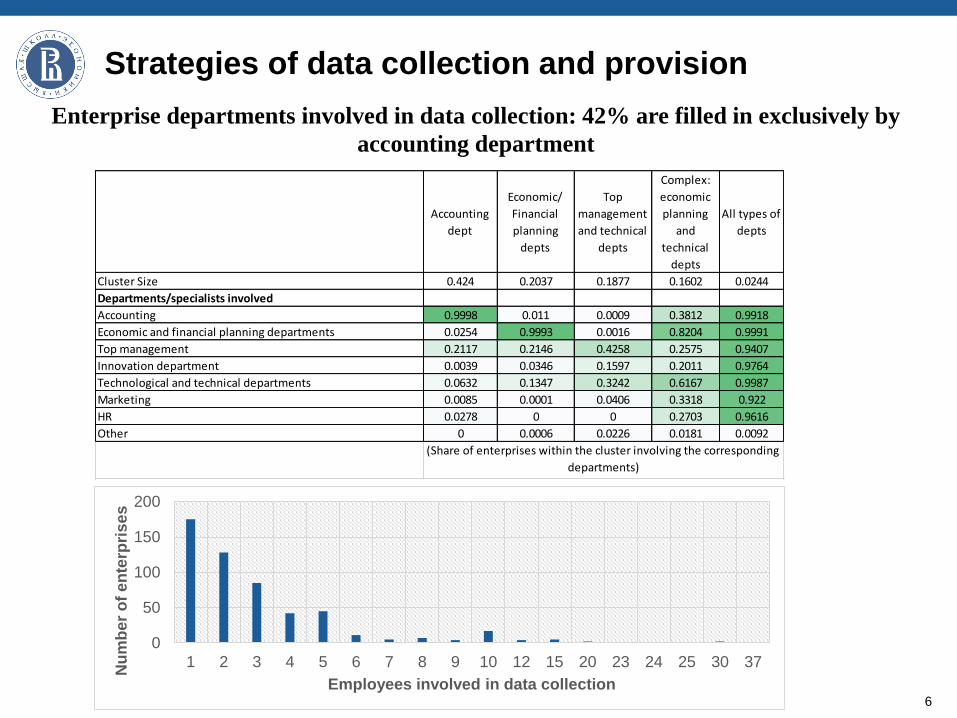
Strategies of data collection and provision
6
Accounting
dept
Economic/
Financial
planning
depts
Top
management
and technical
depts
Complex:
economic
planning
and
technical
depts
All types of
depts
Cluster Size 0.424 0.2037 0.1877 0.1602 0.0244
Departments/specialists involved
Accounting 0.9998 0.011 0.0009 0.3812 0.9918
Economic and financial planning departments 0.0254 0.9993 0.0016 0.8204 0.9991
Top management 0.2117 0.2146 0.4258 0.2575 0.9407
Innovation department 0.0039 0.0346 0.1597 0.2011 0.9764
Technological and technical departments 0.0632 0.1347 0.3242 0.6167 0.9987
Marketing 0.0085 0.0001 0.0406 0.3318 0.922
HR 0.0278 0 0 0.2703 0.9616
Other 0 0.0006 0.0226 0.0181 0.0092
(Share of enterprises within the cluster involving the corresponding
departments)
Enterprise departments involved in data collection: 42% are filled in exclusively by
accounting department
0
50
100
150
200
1 2 3 4 5 6 7 8 9 10 12 15 20 23 24 25 30 37
Nu
mb
er
of
en
terp
ris
es
Employees involved in data collection

Perception of the Innovation Survey Concepts (1)
7
Portfolio of questionnaire perceptions: perfectly relevant vs. non-applicable for the firm
Perfect
applicability
Good
applicability
Average
applicability
Average for
core questions -
Poor for
extended
Poor
applicability
Cluster Size 0.1529 0.2529 0.3549 0.1194 0.1199
IndicatorsGeneral firm characteristics (markets, human capital, etc.) 1.0554 1.7768 2.7448 1.8903 4.1099Innovation types: product, process, organisational, marketing 1.0304 1.9682 3.0167 3.1313 4.9992Innovation sales 1.0115 1.9536 3.1583 3.2661 4.9887Factors hampering innovation 1.0657 1.8789 2.9124 2.9729 4.9992Innovation expenditure 1.0286 1.7998 3.1009 4.4538 4.9938Results of innovation 1.0007 1.8012 3.0266 4.7134 4.9993R&D collaboration 1.0005 1.8991 3.1578 4.5982 4.9993Information sources 1.0459 1.8845 2.9746 4.346 4.9992Intellectual property rights protection 1.0119 1.9162 2.887 4.2468 4.9992Purchase and selling of technologies 1.0187 1.9536 3.0489 4.6313 4.9993Organisational and marketing innovation 1.0033 2.0015 3.2044 4.3163 4.9993Ecological innovation 1.0311 2.0948 3.1229 4.7682 4.9993
(average score within the cluster; 1 - perfect .. 5 - poor)
Diversity reduced to a one-dimensional scale of applicability:
Perfect; Good; Average; Average for core concepts and poor for extended
framework; Poor

Perception of the Innovation Survey Concepts (2)
8
Portfolio of the quality of data provided: precise and verified vs. general estimates
Perfect
accuracy
Good
accuracy
Average
accuracyPoor accuracy
Cluster Size 0.1935 0.2537 0.309 0.2438
IndicatorsGeneral firm characteristics (markets, human capital, etc.) 1.0004 1.6399 2.5739 3.8244Innovation types: product, process, organisational, marketing 1.0226 1.8311 2.8367 5.203Innovation sales 1.0278 1.8207 3.1647 5.2993Factors hampering innovation 1.021 2.2062 3.4413 4.6051Innovation expenditure 1.0005 1.9615 2.7125 5.7329Results of innovation 1.0923 1.9613 2.9311 5.6131R&D collaboration 1.0005 1.7636 2.8746 5.8036Information sources 1.0006 1.8688 3.5205 5.3329Intellectual property rights protection 1.0006 1.9527 3.3479 5.6574Purchase and selling of technologies 1.0086 1.9161 3.3584 5.7767Organisational and marketing innovation 1.0029 2.0603 3.68 5.6648Ecological innovation 1.0006 2.0853 3.7091 5.7307
(average score within the cluster; 1 - perfect .. 5 - poor)
Diversity reduced to a one-dimensional scale: Perfectly precise .. Rough estimates

Perception of the Innovation Survey Concepts (3)
9
Dimension reduction: joint principle component analysis of applicability and
accuracy (rotated component matrix) – 3 dimensions of diversity
Core
innovation
questions
Extended
questions Accuracy
General firm characteristics (markets, human capital, etc.) .822 .257 .125
Innovation types: product, process, organisational, marketing .688 .504 .251
Innovation sales .638 .609 .179
Factors hampering innovation .687 .598 .132
Innovation expenditure .254 .818 .333
Results of innovation .271 .817 .372
R&D collaboration .224 .825 .371
Information sources .306 .816 .253
Intellectual property rights protection .239 .818 .299
Purchase and selling of technologies .244 .815 .393
Organisational and marketing innovation .222 .816 .368
Ecological innovation .180 .812 .417
General firm characteristics (markets, human capital, etc.) .162 .162 .622
Innovation types: product, process, organisational, marketing .112 .254 .851
Innovation sales .245 .298 .800
Factors hampering innovation .602 .216 .636
Innovation expenditure .037 .276 .885
Results of innovation .021 .260 .886
R&D collaboration .016 .254 .904
Information sources .274 .296 .830
Intellectual property rights protection .221 .370 .822
Purchase and selling of technologies .209 .368 .842
Organisational and marketing innovation .217 .344 .833
Ecological innovation .213 .357 .832
Ap
plic
abili
ty a
nd
rel
evan
ce o
f
con
cep
ts
Acc
ura
cy o
f th
e d
ata
pro
vid
ed
(per
fect
ly v
erif
ied
vs.
gen
eral
esti
mat
ion
)
Component
• Understanding of core concepts
(definitions of innovation and
innovation sales)
• Understanding the extended
framework (ability to account for
expenditure on innovation
activities, etc.
• Quality of data provided

Portfolio of questionnaire comprehension and data
precision
10
Perfect
appl icabi l i ty
and perfect
accuracy
Good
appl icabi l i ty
and accuracy
Average
appl icabi l i ty,
average
accuracy
Good
appl icabi l i ty,
poor accuracy
Poor
appl icabi l i ty,
poor accuracy
Cluster Size 0.1283 0.2442 0.3473 0.0813 0.1988
ApplicabilityGeneral firm characteristics (markets, human capital, etc.) 1.008 1.6853 2.7245 2.3038 3.1921Innovation types: product, process, organisational, marketing 1.0006 1.9197 3.0288 2.7295 4.0732Innovation sales 1.0107 2.026 3.1641 2.6653 4.0347Factors hampering innovation 1.0156 1.8933 3.0541 1.9834 3.991Innovation expenditure 1.0006 1.9861 3.0593 2.5826 4.8272Results of innovation 1.0006 1.9207 3.0286 2.5429 4.8938R&D collaboration 1.0006 2.0122 3.1561 2.3815 4.9112Information sources 1.0006 1.981 3.1801 1.7698 4.6812Intellectual property rights protection 1.0006 1.9325 3.0562 1.8357 4.8577Purchase and selling of technologies 1.0006 1.97 3.1171 2.3354 4.955Organisational and marketing innovation 1.004 2.097 3.1603 2.7315 4.7066Ecological innovation 1.0006 2.1339 3.1202 2.8391 4.9548Accuracy
General firm characteristics (markets, human capital, etc.) 1.0004 1.4989 2.47 3.0271 3.7262Innovation types: product, process, organisational, marketing 1.0006 1.704 2.6064 4.9991 4.7767Innovation sales 1.0249 1.6706 2.6115 5.2474 5.309Factors hampering innovation 1.0289 1.8454 2.9795 4.5602 4.7728Innovation expenditure 1.0006 1.6296 2.7644 5.4212 5.0025Results of innovation 1.0007 1.9079 2.7896 5.1648 4.9992R&D collaboration 1.0006 1.6172 2.7383 5.6144 5.0683Information sources 1.0092 1.7682 2.8555 4.9991 5.484Intellectual property rights protection 1.0007 1.6838 2.7808 5.2712 5.8546Purchase and selling of technologies 1.0007 1.6015 2.8021 5.751 5.8462Organisational and marketing innovation 1.0042 1.7264 3.1094 5.6506 5.7324Ecological innovation 1.0007 1.6738 3.1852 5.6957 5.8407
(average score within the cluster; 1 - perfect .. 5 - poor)

Determinants of questionnaire comprehension
11
Marginal effects of the variables i
Perfect applicability and perfect
accuracy
Good applicability
and accuracy
Average applicability
, average accuracy
Good applicabilit
y, poor accuracy
Poor applicabilit
y, poor accuracy
Number of employees (log) 0.0370** 0.0234* -0.0297 -0.00267 -0.0281
(0.0162) (0.0121) (0.0279) (0.0237) (0.0176)
New to market product innovation 0.1304** 0.0388** 0.0566 0.0149 -0.0631
(0.0506) (0.0161) (0.0312) (0.0057) (0.0858)
New to firm product innovation -0.00416 0.0364 -0.0833 0.00228 0.0488
(0.0564) (0.0527) (0.0676) (0.0466) (0.0693)
Process innovation -0.0946 0.0625 0.0679 -0.0592 0.0233
(0.0598) (0.0626) (0.0713) (0.0439) (0.0623)
Organisational innovation 0.108** -0.103* -0.0907* -0.0432* -0.128**
(0.0532) (0.0605) (0.0526) (0.0208) (0.0616)
New marketing methods 0.0490 0.0986* -0.158* -0.00809 0.0182
(0.0533) (0.0554) (0.0818) (0.0554) (0.0646)
Ongoing innovation -0.123* -0.00512 0.00673 0.0470 0.0740
(0.0699) (0.0665) (0.0769) (0.0472) (0.0677)
Abandoned innovation -1.064*** -0.0398 0.842*** 0.189** 0.0722
(0.199) (0.174) (0.168) (0.0951) (0.151)
Technologies for automation and logistics -0.00160 -0.0291 -0.0345 0.0354 0.0298
(0.0230) (0.0305) (0.0373) (0.0338) (0.0359)
Advanced production processes 0.0806** 0.0469* 0.0225 0.0313 -0.101
(0.0238) (0.0246) (0.0389) (0.0267) (0.0821)
Optimized organisational concepts 0.000690 0.0874*** -0.0278 -0.00330 -0.0570
(0.0304) (0.0279) (0.0442) (0.0250) (0.0384)
Innovation management 0.0658*** 0.0321** 0.0370** -0.0295 -0.105***
(0.0224) (0.0164) (0.0125) (0.0274) (0.0291)
Has in-house innovation effort 1.191*** 0.629*** -0.191 -0.186* -0.185*
(0.206) (0.127) (0.168) (0.107) (0.0753)
Active at the international market 0.0213** 0.0805 0.0934 -0.0594 -0.136**
(0.0079) (0.0621) (0.0654) (0.0453) (0.0644)
Base questionnaire fill-in strategy: only accounting dept
Economic and financial planning depts 0.141* 0.0402 -0.235*** 0.0585 -0.00492
(0.0743) (0.0664) (0.0878) (0.0704) (0.0763)
Top management and technical specialists 0.0898 0.0890 -0.112 0.00837 -0.0753
(0.0588) (0.103) (0.0935) (0.0686) (0.0581) Complex: economic planning, technical depts and others -0.0507 0.0873 -0.348*** -0.0331 0.344***
(0.0355) (0.0790) (0.0751) (0.0499) (0.0590)
All types of departments -0.0403 -0.116* -0.464*** -0.0559 0.677***
(0.0508) (0.0633) (0.0641) (0.0394) (0.0552)
Number of employees to complete the survey -0.0747* 0.0213* 0.289*** 0.00380 -0.240***
(0.0443) (0.0158) (0.0491) (0.0355) (0.0544)
Observations 401 401 401 401 401
Standard errors in parentheses
*** p<0.01, ** p<0.05, * p<0.1
Marginal effects after mlogit choice regression: comprehension of the innovation survey questionnaire
Firm size: larger companies
Innovation:
new-to-market innovation
but even more important:
organisational innovation
Technological level:
Advanced production technologies
but even more important:
Innovation management culture
In-house innovation effort
Activity at the international market
Companies better at providing data:
Best organisation of data collection:• Economic and financial planning depts.
• Limited number of responsible employees

Conclusions
12
(1) Grading the comprehension of the
innovation survey and the accuracy of data
provision:
• understanding basic definitions
• ability to measure broader indicators
• accuracy of data provided
(2) Advanced companies are better at
collecting and delivering innovation-related
data
• New-to-market product innovators
• International markets
• Advanced technology levels
(3) But organizational and innovation
culture is of higher importance
• Organisational innovation
• Advanced organisational concepts
• Innovation management culture
Key findings
(1) Need for clear guidelines (or sections)
• Explaining basic definitions
• Recommendations on identifying complex
indicators
• Instructions to increase accuracy
(2) Overcome existing bias towards
advanced and large companies
• Modular surveys should be more friendly
enterprises notable for to less sophisticated
innovation strategies and ad-hoc innovation
management processes
(3) Survey guidelines tailored for different
enterprise units
• accountants
• technical specialists
• top management
Implications

13
Thank you!
http://issek.hse.ru
https://foresight-journal.hse.ru/en/