Rothschild & Co – Equity story · This presentation and its contents may not be copied or...
53
June 2018 Rothschild & Co – Equity story
Transcript of Rothschild & Co – Equity story · This presentation and its contents may not be copied or...

June 2018
The image should be sized at 1431
(w) by 611 (h) pixels. For assistance
please contact Creative Services,
For any image not provided by
Rothschild & Co, permission or a
license must be obtained from
the image owner prior to use.
Rothschild & Co – Equity story

1
This presentation has been prepared solely for information purposes and must not be construed as or considered as constituting or giving
any investment advice. It does not take into account, in any way whatsoever, the investment objectives, financial situation or specific
needs of its recipients.
This presentation and its contents may not be copied or disseminated, in part or as a whole, without prior written consent of Rothschild &
Co.
This presentation may contain forward-looking information and statements pertaining to Rothschild & Co SCA (“Rothschild & Co”), its
subsidiaries (together, the “Rothschild & Co Group”) and its and their results. Forward-looking information is not historical. It reflects
objectives that are based on management’s current expectations or estimates and is subject to a number of factors and uncerta inties, that
could cause actual figures to differ materially from those described in the forward-looking statements including those discussed or
identified in the documentation publicly released by Rothschild & Co, including its annual report.
Rothschild & Co does not undertake to update such forward-looking information and statements unless required by applicable laws and
regulations. Subject to the foregoing, Rothschild & Co has no obligation to update or amend such information and statements, neither as a
result of new information or statements, nor as a result of new events or for any other reason.
No representation or warranty whatsoever, express or implied, is made as to the accuracy, completeness, consistency or the reliability of
the information contained in this document. It may not be considered by its recipients as a substitute to their judgment.
This presentation is qualified in its entirety by the information contained in Rothschild & Co’ financial statements, the notes thereto and the
related annual financial report. In case of a conflict, such financial statements, notes and financial reports must prevail. Only the
information contained therein is binding on Rothschild & Co and the Rothschild & Co Group. If the information contained herein is
presented differently from the information contained in such financial statements, notes and reports, only the latter is binding on
Rothschild & Co and the Rothschild & Co Group.
For more information on Rothschild & Co: www.rothschildandco.com; www.rothschild.com
1 Disclaimer

2
Strategic focus
Improve synergies
between three divisions
Focus on long term
performance rather than
short term profit
Continue to simplify
group structure where
feasible
Create value Grow
scale
Grow our three
businesses organically
and through investments
Diversify earnings to
reduce relative
importance of our
advisory business
Improve returns to
shareholders
Cost saving initiatives
Efficient use of capital

Fa
cin
g P
ag
e 3
Rothschild
Merchant Banking
Rothschild
Global Advisory
Rothschild
Private Wealth &
Asset Management
Network of Contacts
Sourcing
opportunities
Fundraising
Cross fertilisation provides a competitive advantage

3
Global advisory Private wealth & Asset management Merchant baking
Three resilient pillars with strong potential
M&A and strategic advisory
Debt advisory and restructuring
Equity advisory
Private Wealth
Asset Management
Trust Services
c.1,040 bankers of which c.210 MDs c.245 relationship managers and
investment managers
Global European / US
€66.5bn of AuM c.€1.2bn of revenue
#7 globally by revenue
Geography
Offerings
# Front office
Size
Key figures (average 2
years)
Rothschild Global Advisory Rothschild Private Wealth
& Asset Management
€1,177m
66%
Private equity funds
Private debt funds
Proprietary portfolio
c.85 professionals
European / US
€8.5bn of AuM
Rothschild Merchant Banking
€441m
25%
€159m
9%
€211m
59%
€45m
13%
€101m
28%
Profit before tax Revenue

Fa
cin
g P
ag
e 4
Voting rights Share capital
Shareholding structure as at 31 May 2018
Enlarged family
concert49.2%
Edmond de
Rothschild Group5.9%
Jardine Matheson
Group5.4%
Float38.1%
Treasury shares1.3%
Enlarged family
concert58.9%
Edmond de
Rothschild Group7.0%
Jardine Matheson
Group6.9%
Float27.1%

4
Equity Scheme introduced in October 2013 for
57 senior employees from 10 countries
Extended to 10 new senior employees in
December 2015
Extended to 20 new senior employees in
December 2017
Aligned shareholders and senior
management
A Supervisory board composed of:
– 16 recognised professionals, including
9 independent members
– 8 different nationalities
3 specialised committees:
– Audit Committee
– Risk Committee
– Remuneration & Nomination Committee
Board and committees
Rothschild & Co Gestion, Managing Partner
of Rothschild & Co represented by:
Alexandre de Rothschild, Chairman
Olivier Pécoux, Managing Partner
Marc-Olivier Laurent, Managing Partner
Robert Leitao, Managing Partner
François Pérol (effective as at 1/09/2018)
Assisted by the Group Executive Committee
(GEC) with 12 members (Managing partners,
Business heads, significant Support function
heads)
Group management
Strong corporate governance
3 2 1
Accomplished
management team
Governance complying with
best practice Alignment of interests

Rothschild Global Advisory
1
Fa
cin
g P
ag
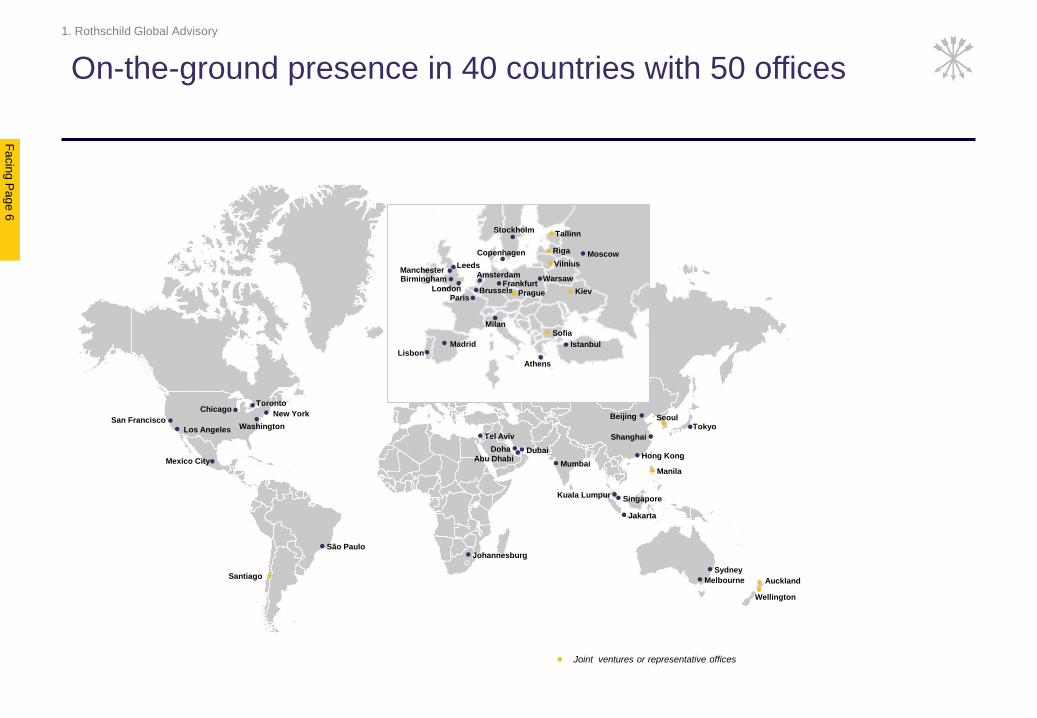
e 6
Melbourne
Sydney
Wellington
Singapore
Jakarta
Hong Kong
Kuala Lumpur
Manila Mumbai
Beijing
Shanghai
Tokyo Los Angeles
São Paulo
Dubai Abu Dhabi
Tel Aviv
Doha
Johannesburg
Toronto
Washington
Mexico City
New York Chicago
Leeds
London
Birmingham
Milan
Stockholm
Manchester
Moscow
Lisbon Madrid
Athens
Istanbul
Paris
Amsterdam
Brussels Frankfurt
Warsaw
On-the-ground presence in 40 countries with 50 offices
Santiago
Kiev Prague
Riga
Sofia
Tallinn
Vilnius
Auckland
Seoul
Joint ventures or representative offices
San Francisco
Copenhagen
1. Rothschild Global Advisory

6
Integrated network of industry specialists with deep
understanding of the dynamics of each industry
1. Rothschild Global Advisory
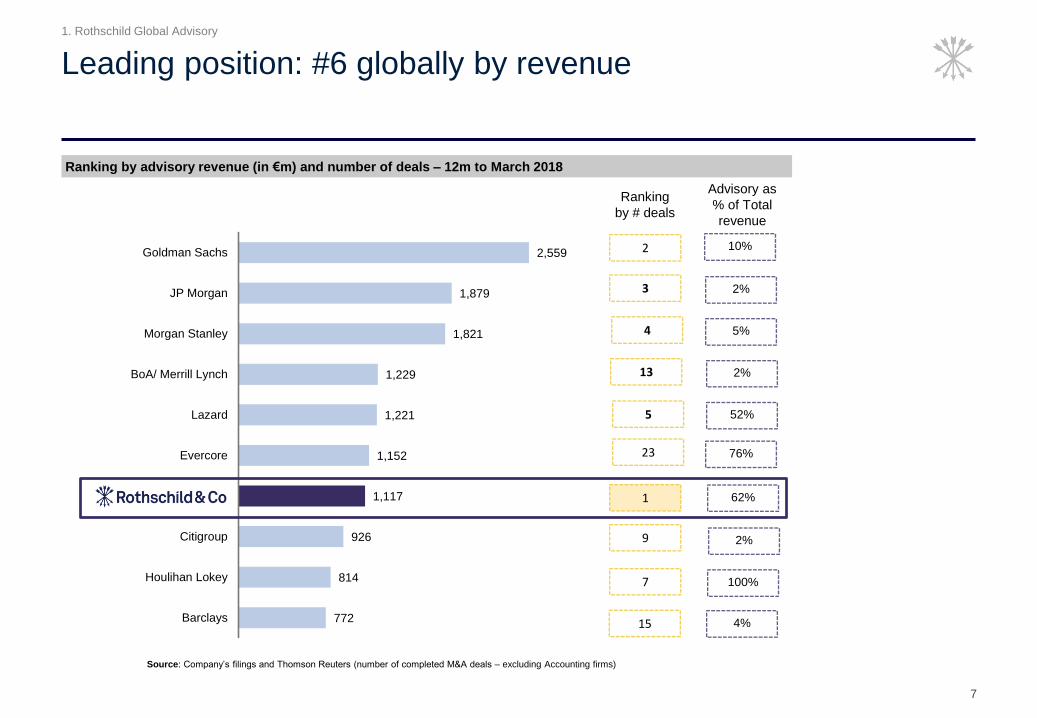
7
Leading position: #6 globally by revenue
Ranking by advisory revenue (in €m) and number of deals – 12m to March 2018
Source: Company’s filings and Thomson Reuters (number of completed M&A deals – excluding Accounting firms)
Ranking
by # deals
Advisory as
% of Total
revenue
2,559
1,879
1,821
1,229
1,221
1,152
1,117
926
814
772
Goldman Sachs
JP Morgan
Morgan Stanley
BoA/ Merrill Lynch
Lazard
Evercore
Citigroup
Houlihan Lokey
Barclays
2
3
4
13
5
1
23
9
7
15
10%
2%
5%
2%
52%
76%
62%
2%
100%
4%
1. Rothschild Global Advisory

-
1,000
2,000
3,000
4,000
5,000
2004 2005 2006 2007 2008 2009 2010 2011 2012 2013 2014 2015 2016 2017
Global announced M&A Global completed M&A
Fa
cin
g P
ag
e 8
Source Thomson Reuters. Any involvement
Global M&A market (deal values)
% 2016 vs 2015
Announced: -16%
Completed: -2%
% 2017 vs 2016
Announced: +0%
Completed: -11%
% 5m 2018 vs 5m 2017
Announced: +69%
Completed: -14%
1. Rothschild Global Advisory
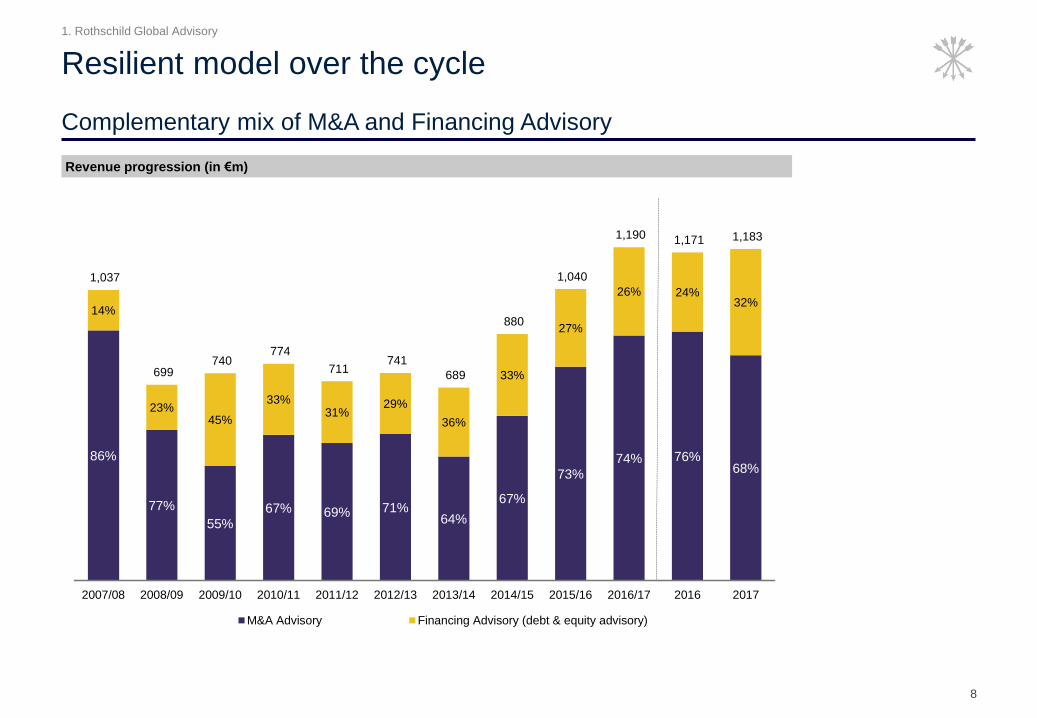
8
Complementary mix of M&A and Financing Advisory
Resilient model over the cycle
Revenue progression (in €m)
86%
77%
55%
67% 69% 71%64%
67%
73%
74% 76%68%
14%
23%45%
33%31%
29%
36%
33%
27%
26% 24%32%
1,037
699 740
774
711 741
689
880
1,040
1,190 1,171 1,183
2007/08 2008/09 2009/10 2010/11 2011/12 2012/13 2013/14 2014/15 2015/16 2016/17 2016 2017
M&A Advisory Financing Advisory (debt & equity advisory)
1. Rothschild Global Advisory
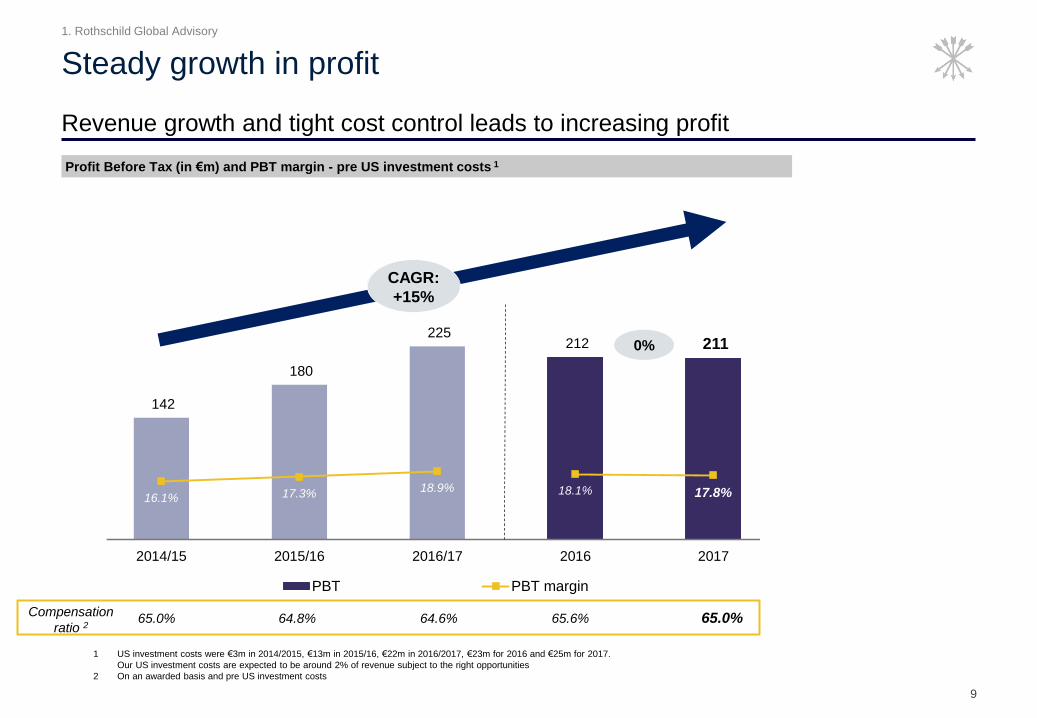
9
Steady growth in profit
Revenue growth and tight cost control leads to increasing profit
142
180
225 212 211
16.1% 17.3%18.9% 18.1% 17.8%
0%
10%
20%
30%
40%
50%
60%
70%
80%
90%
-
50
100
150
200
250
300
350
400
2014/15 2015/16 2016/17 2016 2017
PBT PBT margin
Profit Before Tax (in €m) and PBT margin - pre US investment costs 1
1 US investment costs were €3m in 2014/2015, €13m in 2015/16, €22m in 2016/2017, €23m for 2016 and €25m for 2017.
Our US investment costs are expected to be around 2% of revenue subject to the right opportunities
2 On an awarded basis and pre US investment costs
0%
Compensation
ratio 2 65.0% 64.8% 64.6% 65.6% 65.0%
CAGR:
+15%
1. Rothschild Global Advisory

10
Calgary
Chicago Toronto
New York
Washington San Francisco
Los Angeles
Office
Recently opened office
Overview
Our North America development
Highlights
Strategy
Leading M&A practice across multiple industries including Consumer, Industrials, TMT and Mining recently augmented by new Technology and Healthcare sector bankers
Growing equity advisory and newly established debt advisory practices
Recruitment of 21 senior bankers since 2013
Objective to double our M&A market share by the end of 2020
Strong restructuring practice
Bolster core capabilities
– Strengthening of core M&A sector coverage and
professional talent
Broaden geographic footprint
– Recent opening of offices in Chicago, Los Angeles
and San Francisco
Expand platform capabilities
– Expansion into new sectors / products, building on
existing global presence c. 180 advisory bankers of which 33 MDs
1. Rothschild Global Advisory

11
Strategy
Invest in sector and product expertise by hiring first class talent to link together the
broad geographic mix
Leverage our deep knowledge of advisory market:
To win new clients
To benefit all parts of the Group
Enhance cross selling synergies between the businesses
2
3
4
Extend our unique advisory platform to provide global network and perspective
Europe: build on existing strong position to enhance and defend market share, while growing in smaller
markets where under represented such as Switzerland
United States: continue selective investment in new talent to strengthen and broaden our sector skills and
geographic reach
Asia: build out offering in Asian market
1
1. Rothschild Global Advisory
Rothschild Private Wealth & Asset Management
2
Fa
cin
g P
ag
e 1
3
Singapore
Hong Kong
Tokyo
New York
Paris
Brussels
London Frankfurt
Luxembourg
Guernsey
Geneva
Zurich
Milan
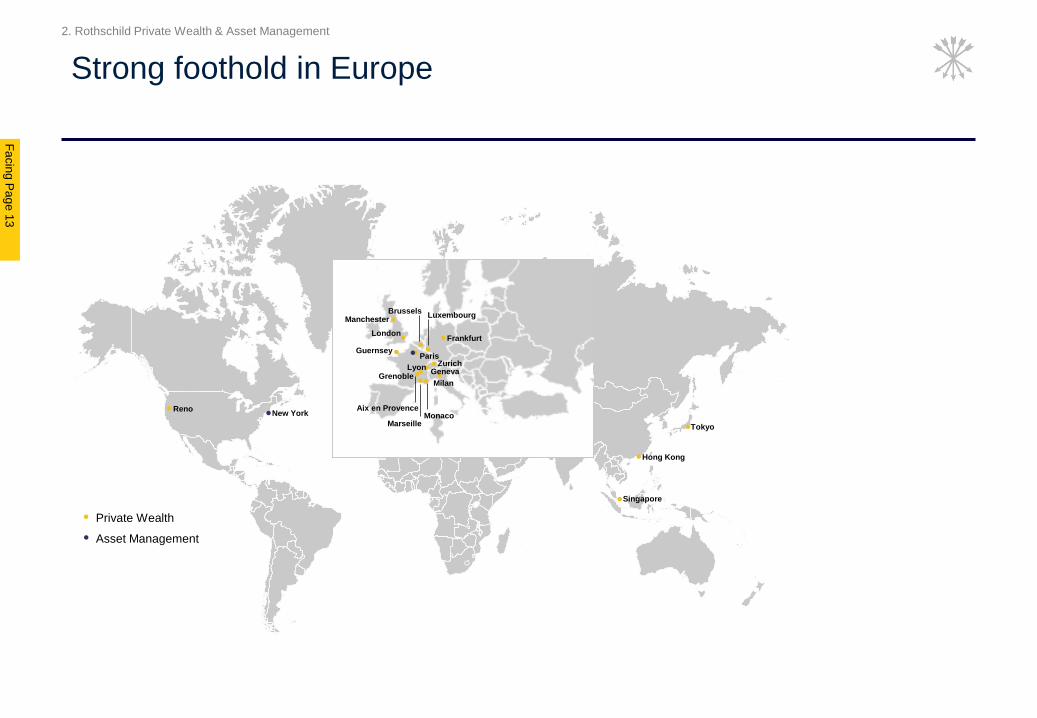
Strong foothold in Europe
Private Wealth
Asset Management
London
Milan
Paris
Brussels
Frankfurt
Luxembourg
Zurich Geneva
Guernsey
Reno
Manchester
Lyon Grenoble
Marseille Monaco
Aix en Provence
2. Rothschild Private Wealth & Asset Management

13
Rothschild Private Wealth & Asset Management
Group AUM (as at 31 March 2018) : €67bn
A broad business covering different geographies
Rothschild Asset
Management Europe
European
Rothschild Asset Management
United States
Rothschild Martin Maurel
France
Belgium
Monaco
Rothschild Wealth Management & Trust
Switzerland
UK
Rest of the world
Private Wealth €43bn Asset Management €31bn 1
€22bn
€21bn
123 Private Client
Advisors
€22bn €9bn
($9.5bn)
€22bn 1
1 : Of which €7bn managed on behalf of Private Wealth clients
24 Investment
Managers
17 Investment
Managers 80 Client Advisors
2. Rothschild Private Wealth & Asset Management
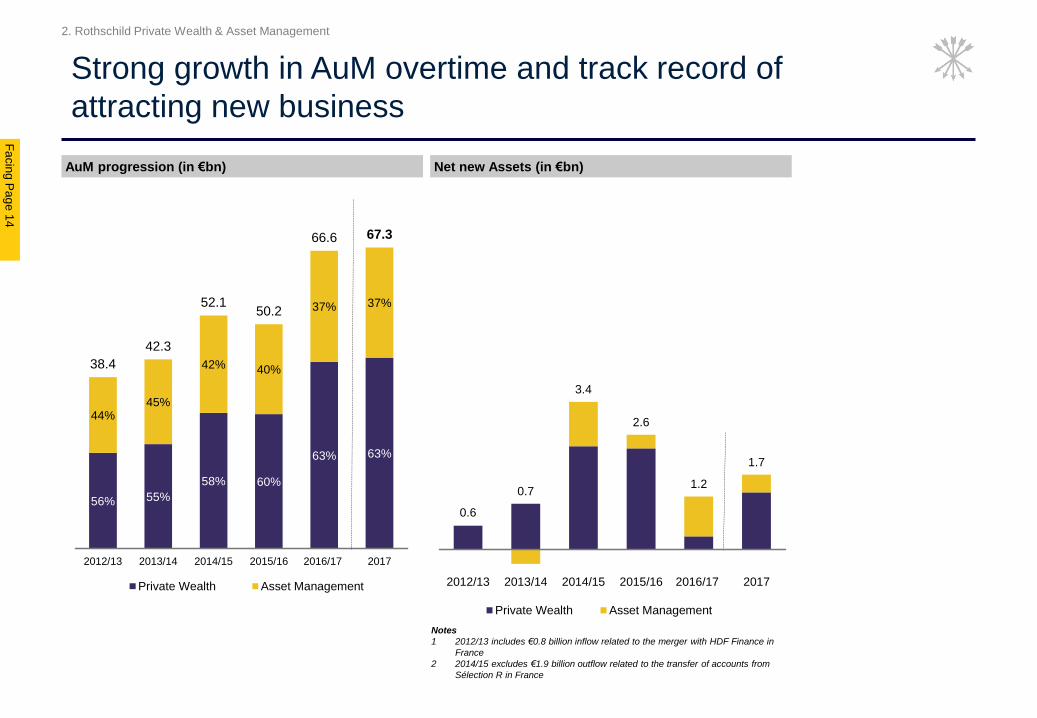
56% 55%
58% 60%
63% 63%
44% 45%
42% 40%
37% 37%
38.4
42.3
52.150.2
66.6 67.3
2012/13 2013/14 2014/15 2015/16 2016/17 2017
Private Wealth Asset Management
Fa
cin
g P
ag
e 1
4
Net new Assets (in €bn) AuM progression (in €bn)
Notes
1 2012/13 includes €0.8 billion inflow related to the merger with HDF Finance in
France
2 2014/15 excludes €1.9 billion outflow related to the transfer of accounts from
Sélection R in France
Strong growth in AuM overtime and track record of
attracting new business
0.6
0.7
3.4
2.6
1.2
1.7
2012/13 2013/14 2014/15 2015/16 2016/17 2017
Private Wealth Asset Management
2. Rothschild Private Wealth & Asset Management
14
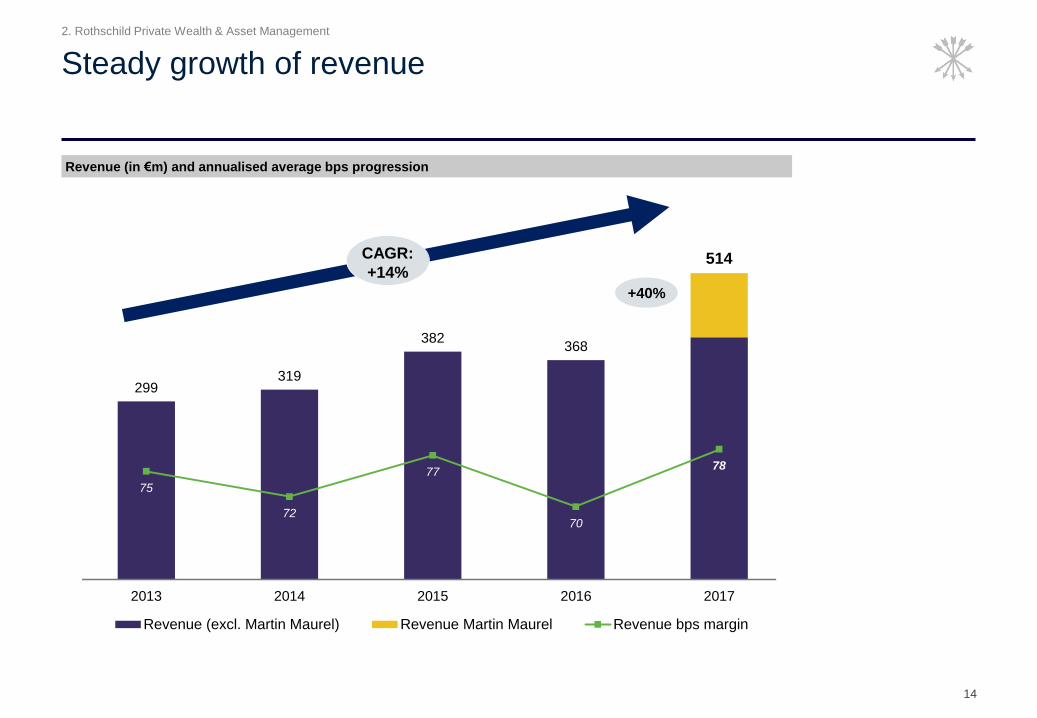
Revenue (in €m) and annualised average bps progression
Steady growth of revenue
299319
382368
514
75
72
77
70
78
60.0
65.0
70.0
75.0
80.0
85.0
90.0
95.0
100.0
105.0
110.0
-
100.0
200.0
300.0
400.0
500.0
600.0
2013 2014 2015 2016 2017
Revenue (excl. Martin Maurel) Revenue Martin Maurel Revenue bps margin
CAGR:
+14%
+40%
2. Rothschild Private Wealth & Asset Management
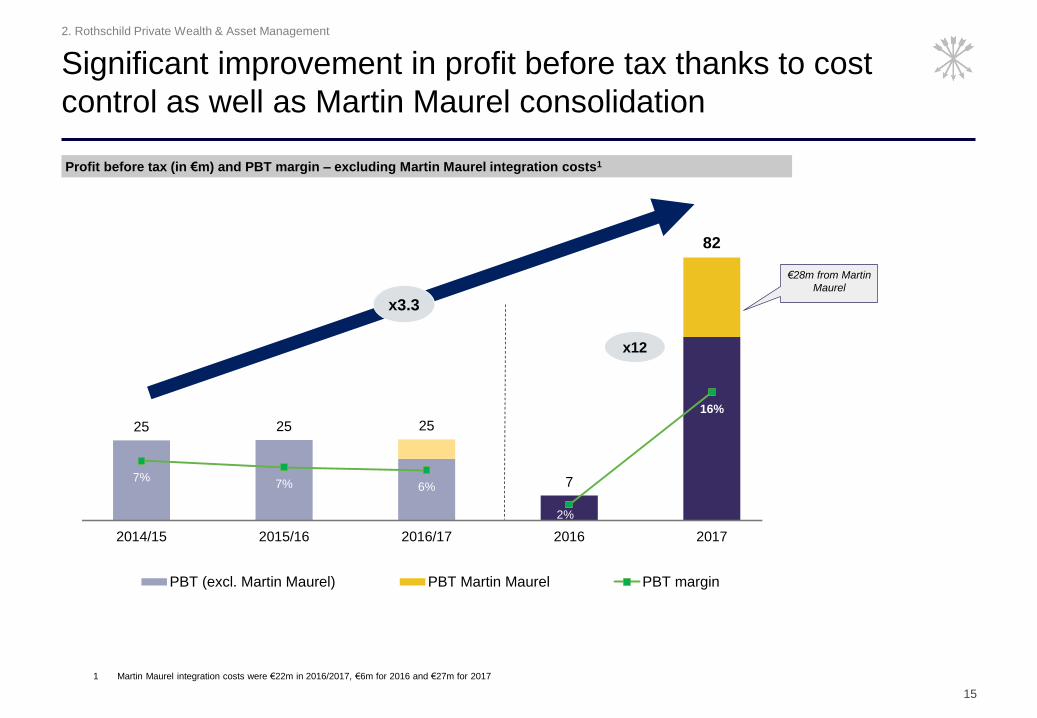
15
25 25 25
7
82
7%7% 6%
2%
16%
0.0%
5.0%
10.0%
15.0%
20.0%
25.0%
30.0%
35.0%
40.0%
-
10.0
20.0
30.0
40.0
50.0
60.0
70.0
80.0
90.0
100.0
2014/15 2015/16 2016/17 2016 2017
PBT (excl. Martin Maurel) PBT Martin Maurel PBT margin
Significant improvement in profit before tax thanks to cost
control as well as Martin Maurel consolidation
Profit before tax (in €m) and PBT margin – excluding Martin Maurel integration costs1
x3.3
x12
1 Martin Maurel integration costs were €22m in 2016/2017, €6m for 2016 and €27m for 2017
€28m from Martin
Maurel
2. Rothschild Private Wealth & Asset Management
16
Strategy
Wealth preservation on the long-term, tailored wealth planning and outstanding client
service
1
Strong focus on cost saving initiatives 2
Private Wealth:
– France – Belgium - Monaco – Build revenue through broader product offering, revised fee structure and
leveraging network and finalise the operational integration
– UK – increase market share through distinct and award winning offering
– Switzerland – refocus on fewer target markets, improve advisory offering and tighter cost control
3
Asset Management:
– France – Refocus AM business on France and neighbouring countries and value to our private wealth and
institutional clients and provide distinct investment services: BtoBtoC
– USA – continue aggressive growth plans for core US equity business and restructure to increase intrinsic
value
4
2. Rothschild Private Wealth & Asset Management

Rothschild Merchant Banking
3
Fa
cin
g P
ag
e 1
8
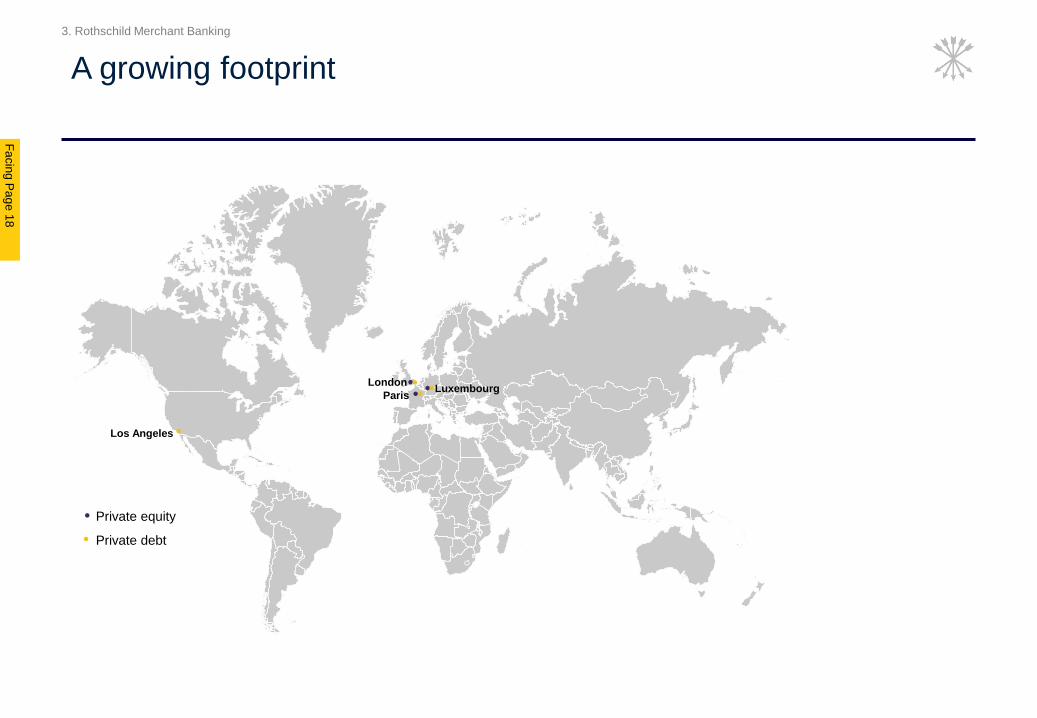
Los Angeles
Paris
London Luxembourg
A growing footprint
Private equity
Private debt
3. Rothschild Merchant Banking
18
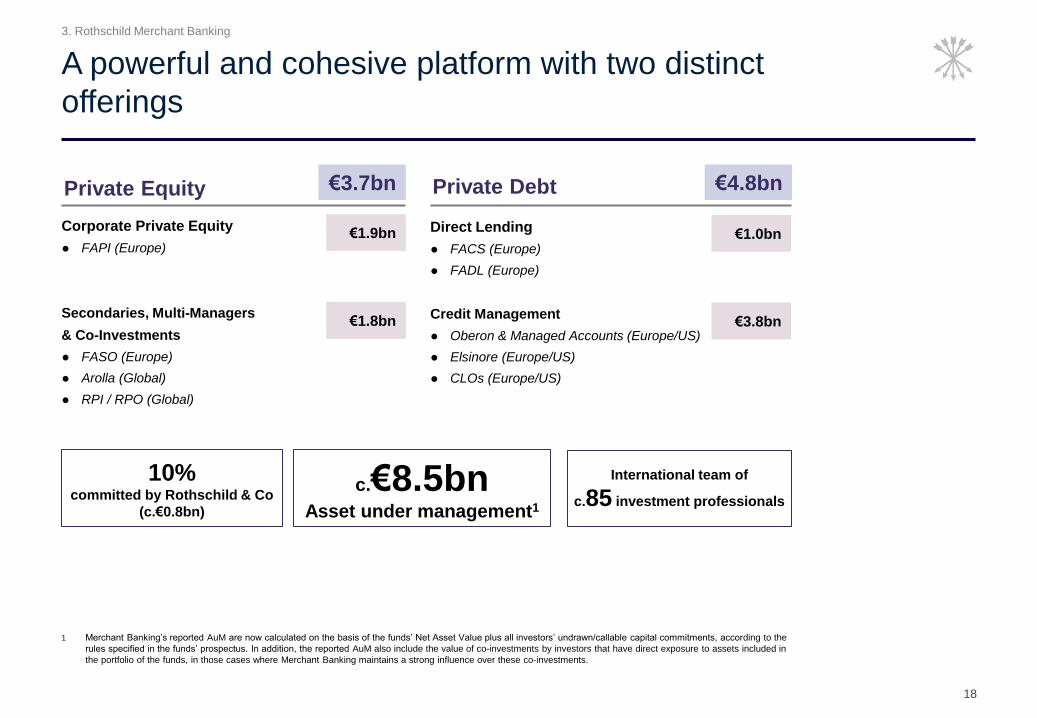
Direct Lending
FACS (Europe)
FADL (Europe)
Credit Management
Oberon & Managed Accounts (Europe/US)
Elsinore (Europe/US)
CLOs (Europe/US)
Corporate Private Equity
FAPI (Europe)
Secondaries, Multi-Managers
& Co-Investments
FASO (Europe)
Arolla (Global)
RPI / RPO (Global)
A powerful and cohesive platform with two distinct
offerings
Private Equity Private Debt
c.€8.5bn Asset under management1
10% committed by Rothschild & Co
(c.€0.8bn)
International team of
c.85 investment professionals
€3.7bn €4.8bn
€1.9bn
€1.8bn
€1.0bn
€3.8bn
1 Merchant Banking’s reported AuM are now calculated on the basis of the funds’ Net Asset Value plus all investors’ undrawn/callable capital commitments, according to the
rules specified in the funds’ prospectus. In addition, the reported AuM also include the value of co-investments by investors that have direct exposure to assets included in
the portfolio of the funds, in those cases where Merchant Banking maintains a strong influence over these co-investments.
3. Rothschild Merchant Banking
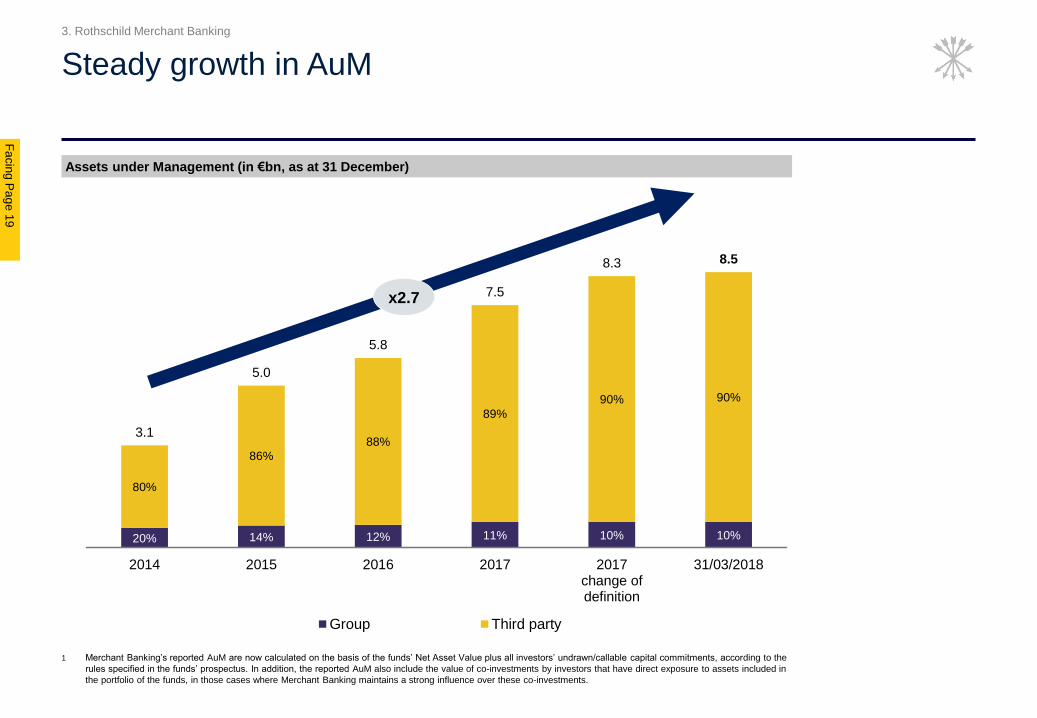
20% 14% 12% 11% 10% 10%
80%
86%
88%
89%
90% 90%
3.1
5.0
5.8
7.5
8.3 8.5
2014 2015 2016 2017 2017change ofdefinition
31/03/2018
Group Third party
Steady growth in AuM
Fa
cin
g P
ag
e 1
9
Assets under Management (in €bn, as at 31 December)
x2.7
1 Merchant Banking’s reported AuM are now calculated on the basis of the funds’ Net Asset Value plus all investors’ undrawn/callable capital commitments, according to the
rules specified in the funds’ prospectus. In addition, the reported AuM also include the value of co-investments by investors that have direct exposure to assets included in
the portfolio of the funds, in those cases where Merchant Banking maintains a strong influence over these co-investments.
3. Rothschild Merchant Banking

19
Change in the Group investment Net asset value (in €m)
116
23
(1)
(23)
115
354
93
97(133)
411
470
116
96
(156)
526
Asset value31 Dec 2016
Additions Value creation Disposals Asset value31 Dec 2017
Private Debt Private Equity
NAV of €526m
for a total commitment of
c.€800m (10% of AuM)
Value creation of:
20% on total assets
27% on equity
investment
Strong value creation while maintaining constant
capital at work
3. Rothschild Merchant Banking
Fa
cin
g P
ag
e 2
0
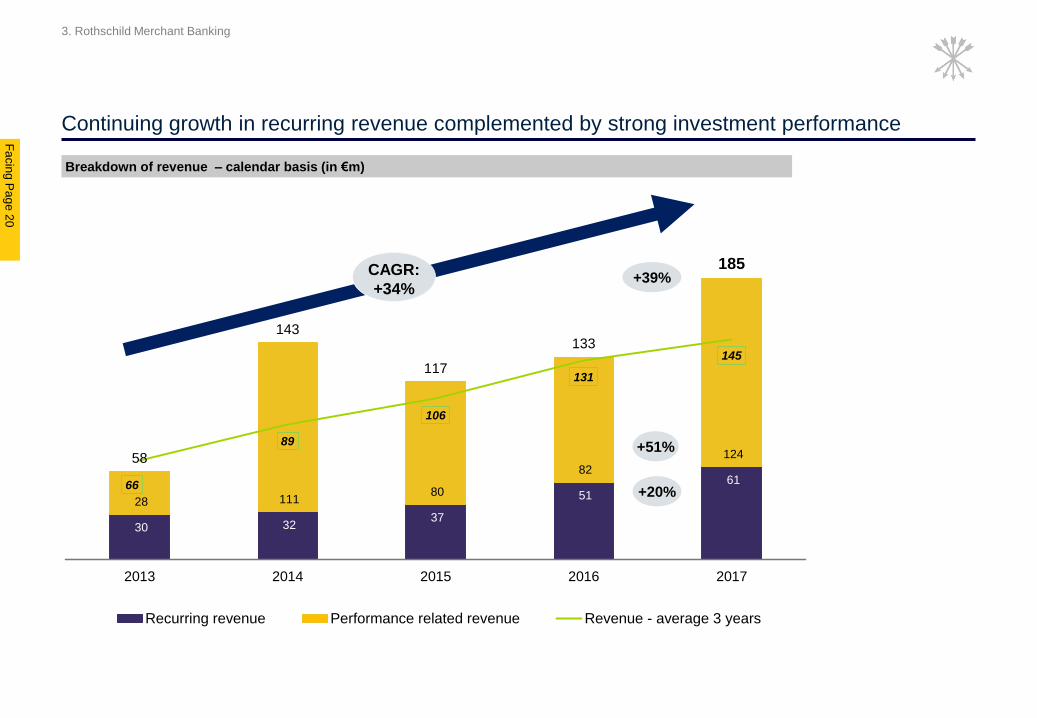
Breakdown of revenue – calendar basis (in €m)
Continuing growth in recurring revenue complemented by strong investment performance
30 32 37
51
61
28 111 80
82
124 58
143
117
133
185
66
89
106
131
145
2013 2014 2015 2016 2017
Recurring revenue Performance related revenue Revenue - average 3 years
+39% CAGR:
+34%
+20%
+51%
3. Rothschild Merchant Banking
20
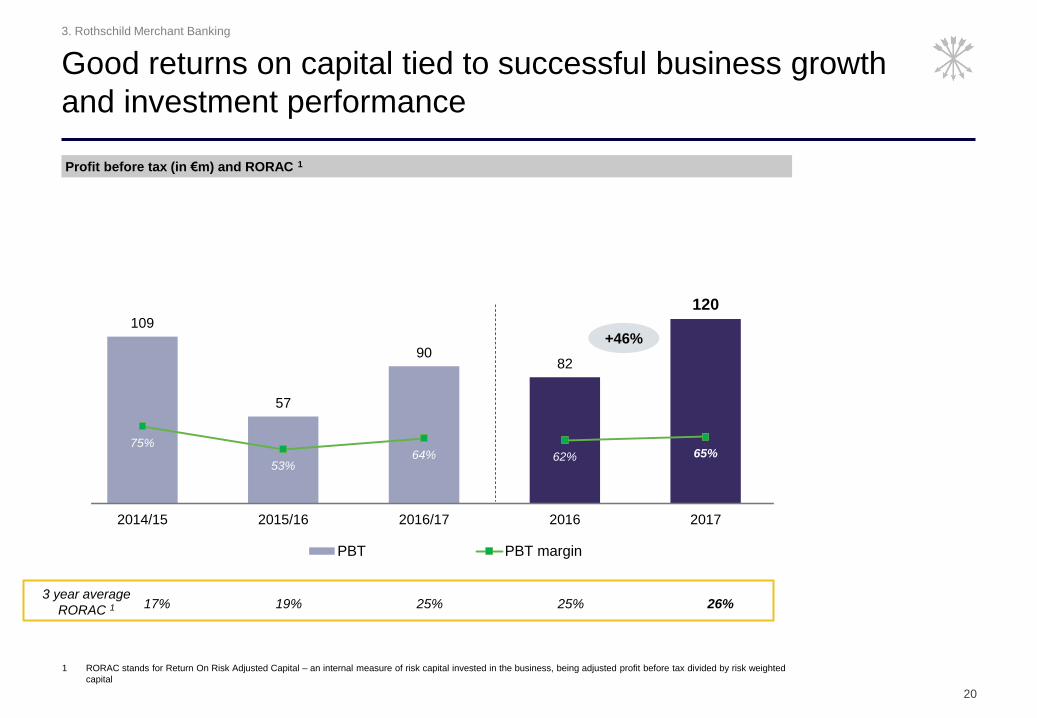
109
57
9082
120
75%
53%64% 62% 65%
0%0
20
40
60
80
100
120
140
160
180
200
2014/15 2015/16 2016/17 2016 2017
PBT PBT margin
Profit before tax (in €m) and RORAC 1
Good returns on capital tied to successful business growth
and investment performance
1 RORAC stands for Return On Risk Adjusted Capital – an internal measure of risk capital invested in the business, being adjusted profit before tax divided by risk weighted
capital
3 year average
RORAC 1 17% 19% 25% 25% 26%
+46%
3. Rothschild Merchant Banking
21
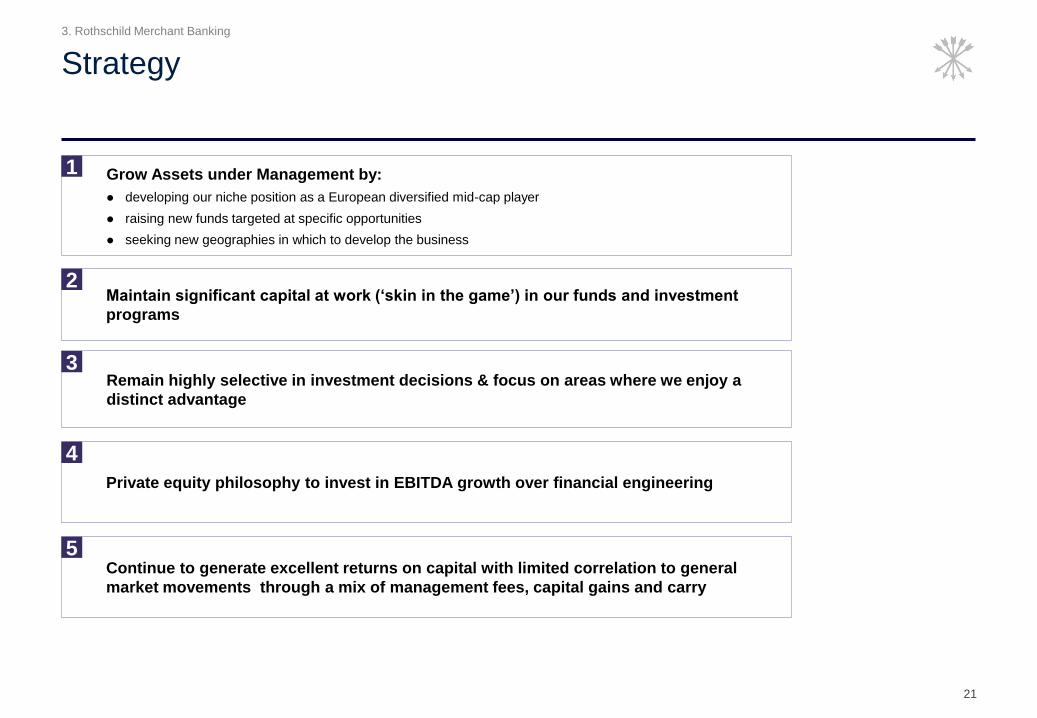
Strategy
Grow Assets under Management by:
developing our niche position as a European diversified mid-cap player
raising new funds targeted at specific opportunities
seeking new geographies in which to develop the business
1
Maintain significant capital at work (‘skin in the game’) in our funds and investment
programs
Remain highly selective in investment decisions & focus on areas where we enjoy a
distinct advantage
Private equity philosophy to invest in EBITDA growth over financial engineering
2
3
4
Continue to generate excellent returns on capital with limited correlation to general
market movements through a mix of management fees, capital gains and carry
5
3. Rothschild Merchant Banking

Financials
4

Fa
cin
g P
ag
e 2
3
Comments
Improving
operating margin
Revenue growth Costs saving initiatives Targeted headcount optimisation
2014/15 2015/16 2016/17 2016 2017
UK asset finance profit - (97) - - -
Long-standing shareholding impairment 2 - - - -
IT outsourcing costs - - - - -
Legacy legal provisions (including DoJ) 16 - - - -
Deferred tax asset write off 9 - - - -
Martin Maurel integration costs - - 7 4 18
Others (pensions credit, sale of property,
swap settlement cost, special tax credit) (11) - - - (7)
Total exceptionals items 16 (97) 7 4 11
Compensation
costs Target of an adjusted compensation ratio: in low to mid 60%’s through the cycle
Exceptionals
impact on Net
Income – Group
share
Non-controlling
interests
Comprise Rothschild family shareholders in the Swiss based Private Wealth business, the
profit share distributed to French partners and interest on perpetual debt
4. Financials

23
Summary P&L
Strong momentum over recent financial years
In €m2015
(12m to March)
2016
(12m to March)
2017
(12m to March)
2016
(12m to Dec)
2017
(12m to Dec)
Revenue 1,403 1,589 1,767 1,713 1,910
Staff costs (820) (954) (1,016) (1,013) (1,087)
Administrative expenses (257) (267) (279) (268) (320)
Depreciation and amortisation (36) (37) (32) (32) (34)
Impairments (22) (12) (11) (14) (13)
Operating Income 268 319 429 386 456
Profit before tax 317 422 436 393 477
Consolidated net income 254 357 366 331 412
Net income - Group share 144 232 186 179 236
Net income - Group share excl. exceptionals 160 135 193 183 247
Earnings per share € 2.08 € 3.37 € 2.64 € 2.60 € 3.18
EPS excl. exceptionals € 2.31 € 1.95 € 2.74 € 2.66 € 3.33
ROTE (excluding exceptional items) 13.0% 11.3% 14.6% 14.4% 17.2%
4. Financials

Fa
cin
g P
ag
e 2
4
1 This analysis is prepared from non IFRS data used internally for assessing business performance then adjusted to conform to the Group's statutory financial accounting policies. IFRS reconciliation mainly
reflects the treatment of profit share paid to French partners as non-controlling interests; accounting for deferred bonuses over the period that they are earned; the application of IAS 19 (R) for defined benefit
pension schemes; and reallocation of impairments and certain operating expenses
2 Martin Maurel contributed €105m of revenue and €28m of PBT to 2017 results
Performance by business
(in €m)Global
Advisory
Private Wealth &
Asset
Management
Merchant
Banking
Other
businesses and
corporate centre
IFRS
reconciliation
2017(12m to Dec)
Revenue 1,183 514 185 36 (8) 1,910
Operating expenses (998) (459) (65) (67) 148 (1,441)
Impairments - - - - (13) (13)
Operating income 185 55 120 (31) 127 456
Exceptional charges / (profits) 27 27
Operating income excluding
exceptional charges / profit185 82 120 (31) 127 483
Operating margin % 16% 16% 65% 25%
(in €m)Global
Advisory
Private Wealth &
Asset
Management
Merchant
Banking
Other
businesses and
corporate centre
IFRS
reconciliation2016
(12m to Dec)
Revenue 1,171 368 133 34 7 1,713
Operating expenses (982) (367) (51) (74) 161 (1,313)
Impairments - - - - (14) (14)
Operating income 189 1 82 (40) 154 386
Exceptional charges / (profits) 6 6
Operating income excluding
exceptional charges / profit189 7 82 (40) 154 392
Operating margin % 16% 2% 62% 23%
4. Financials

24
Compensation ratio objective: Low to mid 60%’s through the cycle
Group Compensation ratio
1 Total staff costs include profit share paid to French Partners and effects of accounting for deferred bonuses over the period in which they are earned, as opposed to
“awarded” basis but exclude redundancy costs, revaluation of share-based employee liabilities and acquisition costs treated as employee compensation under IFRS
2 RGA US investment costs are defined as compensation earned in respect of the first 12 month period of employment plus any make-wholes payable in the reporting
period
(in €m)
2017
(12 months
to Dec)
2016
(12 months
to Dec)
2016/17
Revenue 1,910 1,713 1,767
Total staff costs 1 (1,211) (1,119) (1,142)
Compensation ratio 63.4% 65.3% 64.6%
variation due to FX 0.3% - -
variation due to RGA US investment costs 2 (1.3)% (1.3)% (1.3)%
Adjusted Compensation ratio including
deferred bonus accounting62.4% 64.0% 63.3%
variation due to deferred bonus accounting (0.3)% 1.0% 0.6%
Adjusted Compensation ratio excluding
deferred bonus accounting62.1% 65.0% 63.9%
Headcount 3,502 2,946 3,410
4. Financials

Fa
cin
g P
ag
e 2
5
Summary balance sheet
(in €bn) 31/12/2017 31/03/2017 31/12/2016
Cash and amounts due from central banks 3.9 3.9 3.3
Loans and advances to banks 1.7 1.9 1.3
Loans and advances to customers 3.0 2.9 1.6
of which Private client lending 2.4 2.3 1.4
Debt and equity securities 2.1 2.1 1.5
Other assets 1.4 1.4 1.2
Total assets 12.1 12.2 8.9
Due to customers 7.8 8.1 5.3
Other liabilities 1.9 1.8 1.5
Shareholders' equity - Group share 1.9 1.8 1.5
Non-controlling interests 0.5 0.5 0.6
Total capital and liabilities 12.1 12.2 8.9
4. Financials

25
Ratios are comfortably above minimum requirements imposed by Basel 3
Management considers Merchant Banking requires additional capital beyond Basel 3
Group solvency ratio Risk weighted assets (in €m)
Solvency ratios under full application of Basel 3 rules
3,048
4,720 4,968
102
171154
2,368
3,0023,120
5,518
7,8938,242
31 March 2016 31 March 2017 31 Dec 2017
Credit risk Market risk Operational risk
20.6%
18.2% 18.7%
22.4%
19.1% 19.5%
31 March 2016 31 March 2017 31 Dec 2017
CET 1 / Tier 1 ratio Global solvency ratio
Capital ratio min: 10.5%
CET 1 with buffer min: 7%
4. Financials
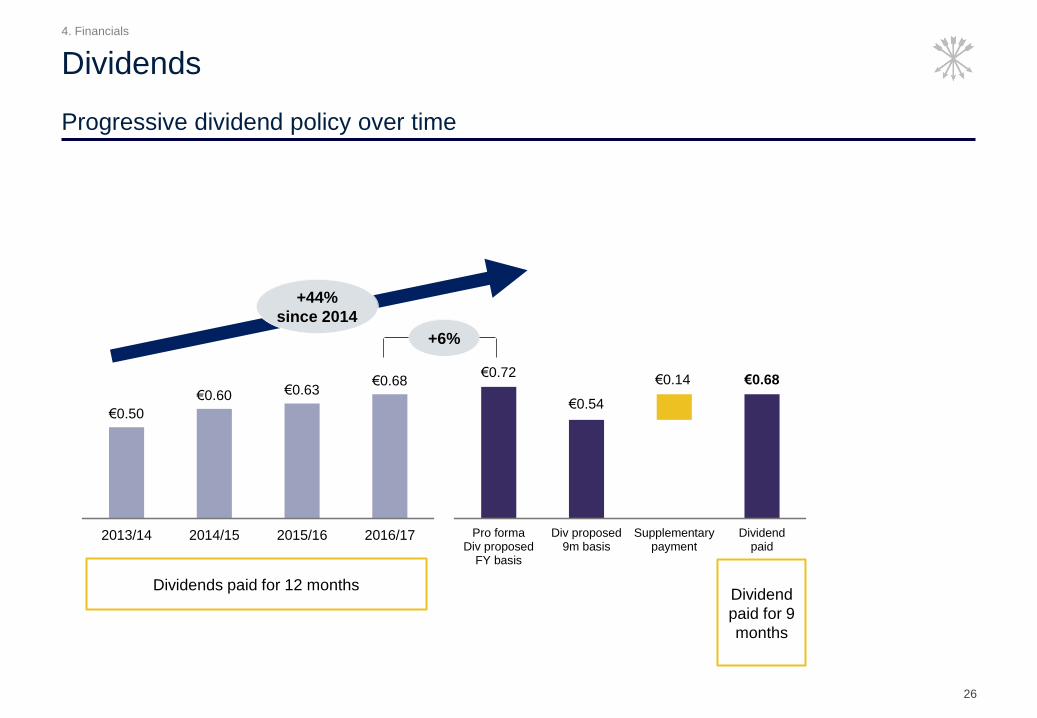
26
Progressive dividend policy over time
Dividends
€0.50
€0.60 €0.63€0.68
2013/14 2014/15 2015/16 2016/17
Dividends paid for 12 months Dividend
paid for 9
months
+6%
+44%
since 2014
€0.72
€0.54
€0.68€0.14
Pro formaDiv proposed
FY basis
Div proposed9m basis
Supplementarypayment
Dividendpaid
4. Financials

27
Financial targets
Notes
1 As adjusted – see slide 24
2 ROTE based on Net income – Group share excl. exceptionals items. Would be 16.4% if exceptionals included (2016: 14.1%)
3 RGA PBT margin pre-US investments. Would be 15.7% if US investments included (2016: 16.2%)
Target 2017
(12m to
Dec)
Low to mid 60’s
through the cycle
10 to 15%
through the cycle
Mid to high-teens
through the cycle
62.4%
17.2%
17.8%
Compensation ratio 1
Return on
tangible equity 2
Global Advisory:
Profit before tax margin 3
Group
targets
Businesses
targets Around 20%
by 2020 16%
Private Wealth and Asset
Management:
Profit before tax margin
2016 (12m to
Dec)
64.0%
14.4%
18.1%
2%
Above 15%
through the cycle 26% Merchant Banking:
3 years average RORAC 25%
2016/2017 (12m to
March)
63.3%
14.6%
18.9%
6%
25%
4. Financials

28
First quarter revenue
In € million
2018 2017 % Var
Rothschild Global Advisory 261.7 328.2 -20%
Rothschild Private Wealth & Asset Management 131.0 128.3 2%
Rothschild Merchant Banking 25.2 19.5 29%
Other 6.9 3.5 97%
Total before IFRS reconciliation 424.8 479.5 -11%
IFRS reconciliation (4.7) 7.7 -161%
Total Group revenues 420.1 487.2 -14%
1st
Quarter
4. Financials

29
Value driven investment leveraged for growth
Why invest in Rothschild & Co?
Three
established
businesses
with strong
synergies
Globally
recognised
brand
known for
outstanding
client advice
and execution
Strong financial
position
with high
operating
leverage
Family
controlled
group focused
on long-term
growth
Sustainable
shareholder
return
1 2 3 4 5
4. Financials

Appendix
A
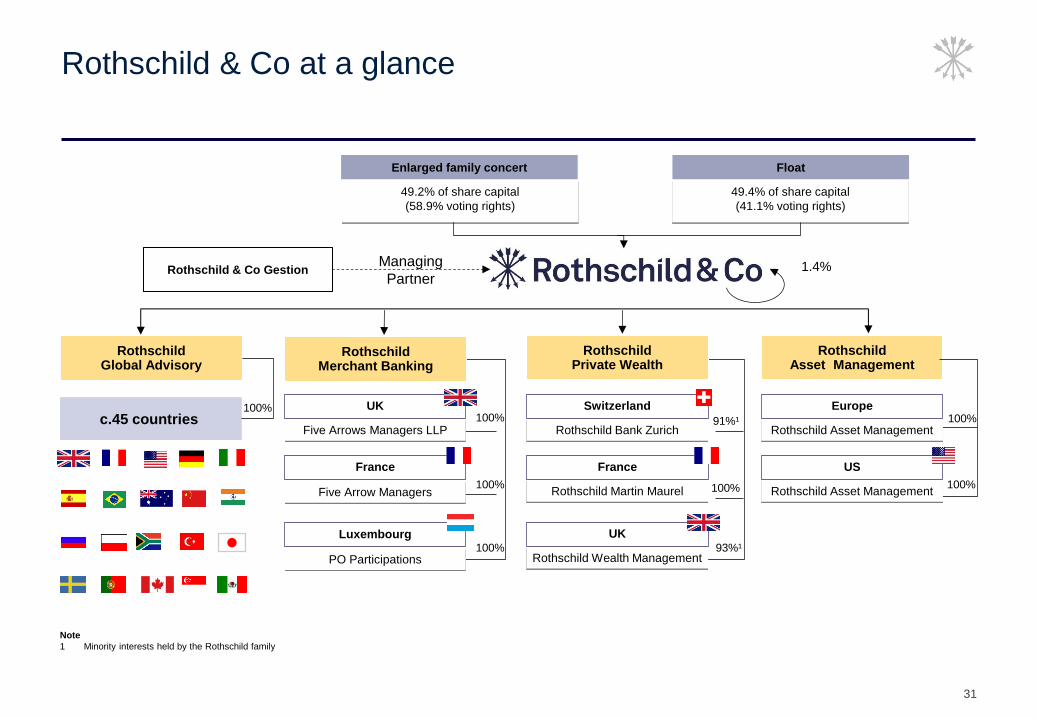
31
Rothschild & Co at a glance
Rothschild Bank Zurich
Switzerland
49.2% of share capital
(58.9% voting rights)
Enlarged family concert
49.4% of share capital
(41.1% voting rights)
Rothschild & Co Gestion Managing
Partner 1.4%
100%
100%
Rothschild Asset Management
Rothschild Global Advisory
c.45 countries
Rothschild Private Wealth
100%
100%
100%
Rothschild Merchant Banking
Luxembourg
PO Participations
France
Five Arrow Managers
Five Arrows Managers LLP
UK
Rothschild Martin Maurel
France
Rothschild Wealth Management
UK
Rothschild Asset Management
Europe
Rothschild Asset Management
US
Float
Note
1 Minority interests held by the Rothschild family
100%
91%¹
93%¹
100%

0
1,000
2,000
Announced M&A RoW Completed M&A - RoW
0
1,000
2,000
Announced M&A Asia Completed M&A - Asia
0
1,000
2,000
3,000
Announced M&A North America Completed M&A - North America
0
1,000
2,000
3,000
Announced M&A Europe Completed M&A - Europe
Fa
cin
g P
ag
e 3
2
Rest of the world Asia
North America Europe
Regional M&A market by deal values (US$bn)
Source Thomson Reuters
Verizon deal has been excluded from European data due to the size ($130bn – announced in 2013 and completed in 2014)
% 2016 vs 2015
Announced: -7%
Completed: +0%
% 2016 vs 2017
Announced: -12%
Completed: -7%
% 2016 vs 2017
Announced: -8%
Completed: -13%
% 2016 vs 2015
Announced: -8%
Completed: -1%
% 2017 vs 2016
Announced: -9%
Completed: -3%
% 2017 vs 2016
Announced: +9%
Completed: +2%
% 2017 vs 2016
Announced: -1%
Completed: -15%
% 2017 vs 2016
Announced: -6%
Completed: -8%

32
-
1,000
2,000
3,000
4,000
5,000
2004 2005 2006 2007 2008 2009 2010 2011 2012 2013 2014 2015 2016 2017
Global announced M&A Global completed M&A
Global M&A by deal values (US$bn)
M&A market by deal values
Source Thomson Reuters
% 2016 vs 2015
Announced: -16%
Completed: -2%
%2017 vs 2016
Announced: +0%
Completed: -11%
Deal Values > $10bn
2015 2016 2017
Announced 1,498 962 837
Completed 955 1,103 726
o/w US
Announced 1,024 762 587
Completed 686 720 534
0
1,000
2,000
3,000
4,000
2008 2009 2010 2011 2012 2013 2014 2015 2016 2017
Announced M&A Asia Completed M&A - Asia
0
1,000
2,000
3,000
4,000
2008 2009 2010 2011 2012 2013 2014 2015 2016 2017
Announced M&A RoW Completed M&A - RoW
0
2,000
4,000
6,000
2008 2009 2010 2011 2012 2013 2014 2015 2016 2017
Announced M&A North America Completed M&A - North America
0
2,000
4,000
6,000
2008 2009 2010 2011 2012 2013 2014 2015 2016 2017
Announced M&A Europe Completed M&A - Europe
Fa
cin
g P
ag
e 3
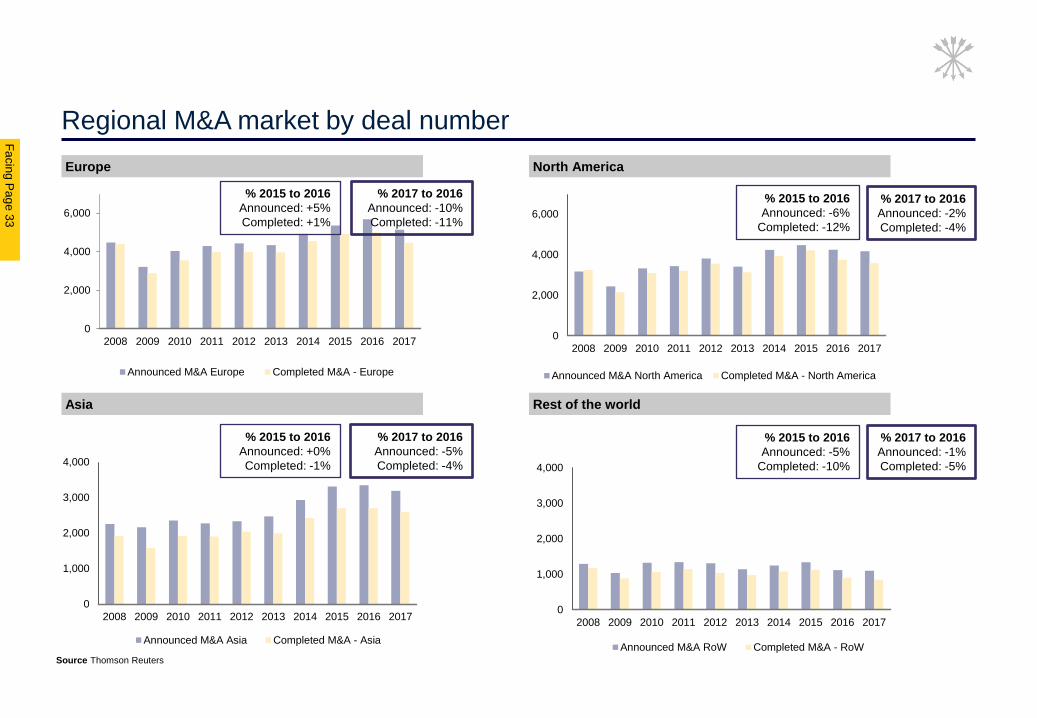
3
Rest of the world Asia
North America Europe
Regional M&A market by deal number
Source Thomson Reuters
% 2015 to 2016
Announced: -6%
Completed: -12%
% 2015 to 2016
Announced: +5%
Completed: +1%
% 2015 to 2016
Announced: -5%
Completed: -10%
% 2015 to 2016
Announced: +0%
Completed: -1%
% 2017 to 2016
Announced: -10%
Completed: -11%
% 2017 to 2016
Announced: -2%
Completed: -4%
% 2017 to 2016
Announced: -5%
Completed: -4%
% 2017 to 2016
Announced: -1%
Completed: -5%

33
0
2,000
4,000
6,000
8,000
10,000
12,000
2008 2009 2010 2011 2012 2013 2014 2015 2016 2017
Global announced M&A Global completed M&A
Global M&A by deal number
M&A market by deal number
Source Thomson Reuters
% 2016 vs 2015
Announced: -1%
Completed: -4%
% 2017 vs 2016
Announced: -5%
Completed: -7%
Deal number > $10bn
2015 2016 2017
Announced 59 37 34
Completed 41 48 31
o/w US
Announced 44 26 22
Completed 29 34 21

34
11
4
25
16
8
27
39
48
26
30
10
4
28
19
7
38
6562
29
48
2008 2009 2010 2011 2012 2013 2014 2015 2016 2017
Value of IPOs (€bn) Number of IPOs
IPO volumes in Europe since 2008 (> €200m)
European IPO market
Source Dealogic
% 2016 vs 2015
Value: -52%
Number: -55%
% 2017 vs 2016
Value: +15%
Number: +66%
Fa
cin
g P
ag
e 3
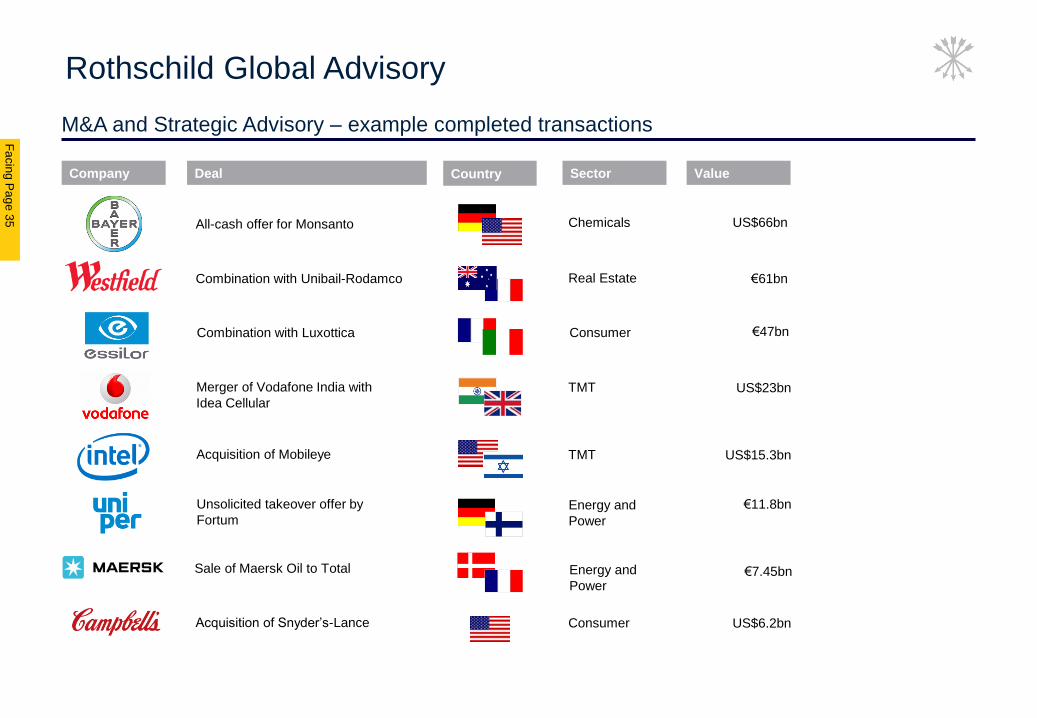
5
Company Deal Country Sector Value
Sale of Maersk Oil to Total
Energy and
Power €7.45bn
Combination with Unibail-Rodamco €61bn Real Estate
Acquisition of Snyder’s-Lance US$6.2bn Consumer
Acquisition of Mobileye US$15.3bn TMT
All-cash offer for Monsanto US$66bn Chemicals
Combination with Luxottica €47bn Consumer
Merger of Vodafone India with
Idea Cellular US$23bn TMT
Unsolicited takeover offer by
Fortum Energy and
Power
€11.8bn
M&A and Strategic Advisory – example completed transactions
Rothschild Global Advisory

35
Financing advisory – example completed transactions
Rothschild Global Advisory
Adviser to First Lien Tern Loan
Lenders on restructuring
Debt advice to Ant Financial on its
US$3.5bn debt raising
Adviser to the Hellenic Republic
(PDMA) on its return to markets with a
€3bn bond and €1.5bn liability
management exercise
US$5bn debt restructuring of Mechel
Government/
Public sector
TMT
Mining
US$18.5bn
US$3.5bn
US$3.5bn
US$5bn
Restructuring of debt facilities Energy and
Power US$3.8bn
Leisure
Company Deal Country Sector Value
Adviser on privatisation IPO of
Allied Irish Banks FIG €3.4bn
Adviser on sell-down of 13.28% stake in
Woodside Petroleum Energy and
Power €3bn
Adviser on IPO of Emaar
Development Real Estate US$1.3bn

36
A history of long term value creation in the mid-cap segment
Selected sample of transactions in Merchant banking
Legal, tax &
accounting
information provider
Denmark
Advertising
company
China
Italian manufacturer
of frozen bakery
products
Italy
Private Equity Private Debt
Leading parking
operator in Europe
Netherlands
Telecoms tower
operator
Africa
IT infrastructure &
data management
software
Global
Multi-regional chain
for routine
laboratory
France
Automotive
insurance and
protection services
France
Specialized
education and care
UK
Debt collection
services company
UK
Digital platform
for the real estate
intermediation
market
France
Leading automotive
finance software
vendor
UK
Disruptive
pharmacy franchise
concept
France
Netherlands
Global corporate
and trust services
provider
Netherlands
Leading anti-virus
software provider
Netherlands
Distributor of
medical devices
and supplies
Netherlands
Dutch cable
operator
Netherlands
European discount
retailer
USA
Global Music based
content company
Nuclear
measurement tools
Global
Provider of
specialist residential
healthcare
UK
Litigation and legal
transcript
management
software
UK
Technology-enabled
insurance
distribution platform
and service provider
Netherlands
Manufacturer and
distributor of
orthopaedic and
dental implants
France
Sample of recent transactions
37
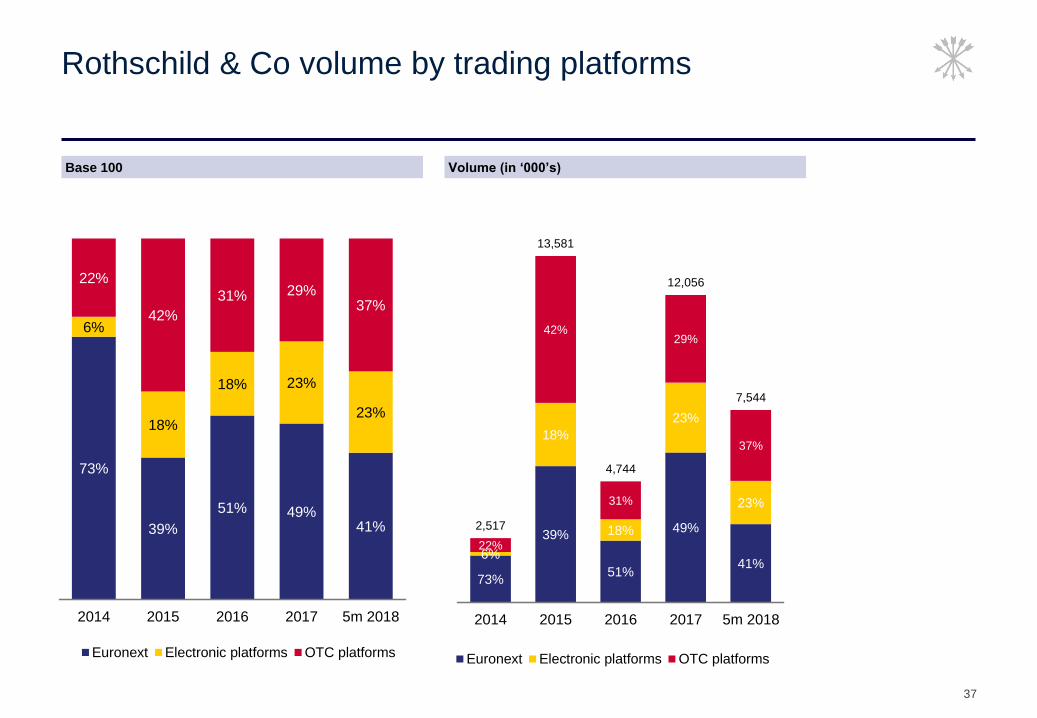
Rothschild & Co volume by trading platforms
Base 100 Volume (in ‘000’s)
73%
39%
51% 49%41%
6%
18%
18% 23%
23%
22%
42%
31% 29%37%
2014 2015 2016 2017 5m 2018
Euronext Electronic platforms OTC platforms
73%
39%
51%
49%
41%6%
18%
18%
23%
23%
22%
42%
31%
29%
37%
2,517
13,581
4,744
12,056
7,544
2014 2015 2016 2017 5m 2018
Euronext Electronic platforms OTC platforms