Rossini Calculating stratified residential property ... · PDF fileCalculating stratified...
17
Eighth Annual Pacific-Rim Real Estate Society Conference Christchurch, New Zealand, 21-23 January 2002 Calculating stratified residential property price indices to test for differences in trend, seasonality and cycle Peter Rossini Centre for Land Economics and Real Estate Research (CLEARER) University of South Australia, Australia Keywords: Residential Real Estate, Housing Markets, Seasonality, Regression Analysis, Time Series Analysis, Hedonic Price Models Abstract: This paper extends work presented at the sixth PRRES conference where the seasonal effects of residential property markets were examined. Work from that paper suggested that there is locational variation in the seasonal effects of transaction volumes and prices in the residential real estate market in Adelaide. This paper uses all residential transactions in Adelaide, South Australia over a eighteen-year period to examine if there are significant variations in the trends, seasonality and cycles of residential property prices when the data is stratified by region, dwelling type and price ranges. This research demonstrates that the use of a non-stratified general index for residential properties may lead to incorrect conclusions about any specific sector of the market particularly in regard to long-term growth rates. Introduction For most Australians the investment in their family home is their greatest investment. In recent years more Australians have moved into the private rental investment market with over 50% of the owners of private rental accommodation being investors who own only one residential investment property (Yates, 1996). Arguably the need for information about what residential market activity is increasing, however much of the information that is provided to home buyers and investors is provided by local real estate agents and investment advisors who have only local knowledge and may be considered to be somewhat biased in their opinions. There is a need for reliable, unbiased information about the long-term performance of residential property. While academic journals and conferences (such as PRRES) provide a forum for discussion by academics and research professionals, it is unlikely that many of the findings become generally disseminated to the community. The Centre of Land Economics and Real Estate Research (CLEARER) has decided to release a series of residential property indices relating to Adelaide and South Australia. The intention is to release these indices on a quarterly basis via the World Wide Web. The purpose of this research is to investigate some of the issues that arise in terms of stratification of the index and the index methodology. Work on developing housing indices has been ongoing, with early works by Bailey et al. (1963) involving a discussion of a regression method for price indexing which was later expanded by Goodman (1978). The principal works are based on hedonic price functions and repeat sales, and were the focus of a great deal of literature in the early 1990’s. (Case & Shiller, 1989 and Mankiw & Weil, 1989 are important examples) These methods involve analysing individual transactions rather than aggregated data. The advantage of these methodologies is that the effect of time and a variety of property characteristics can be considered jointly. The effects of time can then be considered with all other factors being held constant leading to the term constant quality indices. Work on these indices in Australia has concentrated in Adelaide and Perth with discussions on methodologies (Rossini, 1996 & Costello, 1997) and on particular issues such as holding periods (Costello et al, 1996), location (Kershaw & Rossini 1999 & Costello, 2000) and later the effects of seasonality (Rossini, 2000 & Costello, 2001). The choice of methodology depends somewhat on the actual data that is available, its quality and quantity and the characteristics of the market. In some cases a simple median or mean price index may be sufficient to provide vital information while in other cases this may provide misleading results. The experience from the works in Adelaide suggests that most useful result will come from a constant quality index based on a simple hedonic model of raw transaction using a simple natural logarithm transformation of the dependent variable (price). A second issue is the need to stratify the data before index creation. The justification for the stratification is that there may be variations in the sub-markets that make up the broader housing market and that these variations lead to differences in long term performance, seasonality and cycles.
Transcript of Rossini Calculating stratified residential property ... · PDF fileCalculating stratified...

Eighth Annual Pacific-Rim Real Estate Society Conference Christchurch, New Zealand, 21-23 January 2002
Calculating stratified residential property price indices to test for differences in trend, seasonality and cycle
Peter Rossini Centre for Land Economics and Real Estate Research (CLEARER)
University of South Australia, Australia
Keywords: Residential Real Estate, Housing Markets, Seasonality, Regression Analysis, Time Series Analysis, Hedonic Price Models
Abstract: This paper extends work presented at the sixth PRRES conference where the seasonal effects of residential property markets were examined. Work from that paper suggested that there is locational variation in the seasonal effects of transaction volumes and prices in the residential real estate market in Adelaide. This paper uses all residential transactions in Adelaide, South Australia over a eighteen-year period to examine if there are significant variations in the trends, seasonality and cycles of residential property prices when the data is stratified by region, dwelling type and price ranges. This research demonstrates that the use of a non-stratified general index for residential properties may lead to incorrect conclusions about any specific sector of the market particularly in regard to long-term growth rates.
Introduction For most Australians the investment in their family home is their greatest investment. In recent years more Australians have moved into the private rental investment market with over 50% of the owners of private rental accommodation being investors who own only one residential investment property (Yates, 1996). Arguably the need for information about what residential market activity is increasing, however much of the information that is provided to home buyers and investors is provided by local real estate agents and investment advisors who have only local knowledge and may be considered to be somewhat biased in their opinions. There is a need for reliable, unbiased information about the long-term performance of residential property. While academic journals and conferences (such as PRRES) provide a forum for discussion by academics and research professionals, it is unlikely that many of the findings become generally disseminated to the community. The Centre of Land Economics and Real Estate Research (CLEARER) has decided to release a series of residential property indices relating to Adelaide and South Australia. The intention is to release these indices on a quarterly basis via the World Wide Web. The purpose of this research is to investigate some of the issues that arise in terms of stratification of the index and the index methodology.
Work on developing housing indices has been ongoing, with early works by Bailey et al. (1963) involving a discussion of a regression method for price indexing which was later expanded by Goodman (1978). The principal works are based on hedonic price functions and repeat sales, and were the focus of a great deal of literature in the early 1990’s. (Case & Shiller, 1989 and Mankiw & Weil, 1989 are important examples) These methods involve analysing individual transactions rather than aggregated data. The advantage of these methodologies is that the effect of time and a variety of property characteristics can be considered jointly. The effects of time can then be considered with all other factors being held constant leading to the term constant quality indices. Work on these indices in Australia has concentrated in Adelaide and Perth with discussions on methodologies (Rossini, 1996 & Costello, 1997) and on particular issues such as holding periods (Costello et al, 1996), location (Kershaw & Rossini 1999 & Costello, 2000) and later the effects of seasonality (Rossini, 2000 & Costello, 2001).
The choice of methodology depends somewhat on the actual data that is available, its quality and quantity and the characteristics of the market. In some cases a simple median or mean price index may be sufficient to provide vital information while in other cases this may provide misleading results. The experience from the works in Adelaide suggests that most useful result will come from a constant quality index based on a simple hedonic model of raw transaction using a simple natural logarithm transformation of the dependent variable (price). A second issue is the need to stratify the data before index creation. The justification for the stratification is that there may be variations in the sub-markets that make up the broader housing market and that these variations lead to differences in long term performance, seasonality and cycles.
Calculating stratified residential property price indices to test for differences in trend, seasonality and cycle Page 2 In this paper a series of data stratifications is used to empirically determine if there are differences. The paper deals with the issue of property prices (rather than transaction volumes) and examines if there are marked variations across the strata in terms of seasonality of prices, long-term trend (growth) and cyclical behavior. The paper also explores ways to present this data in an easy-to-understand format that can be disseminated to the wider community. Because of this the presentation is largely tabular and graphical rather than statistical.
Methodology:
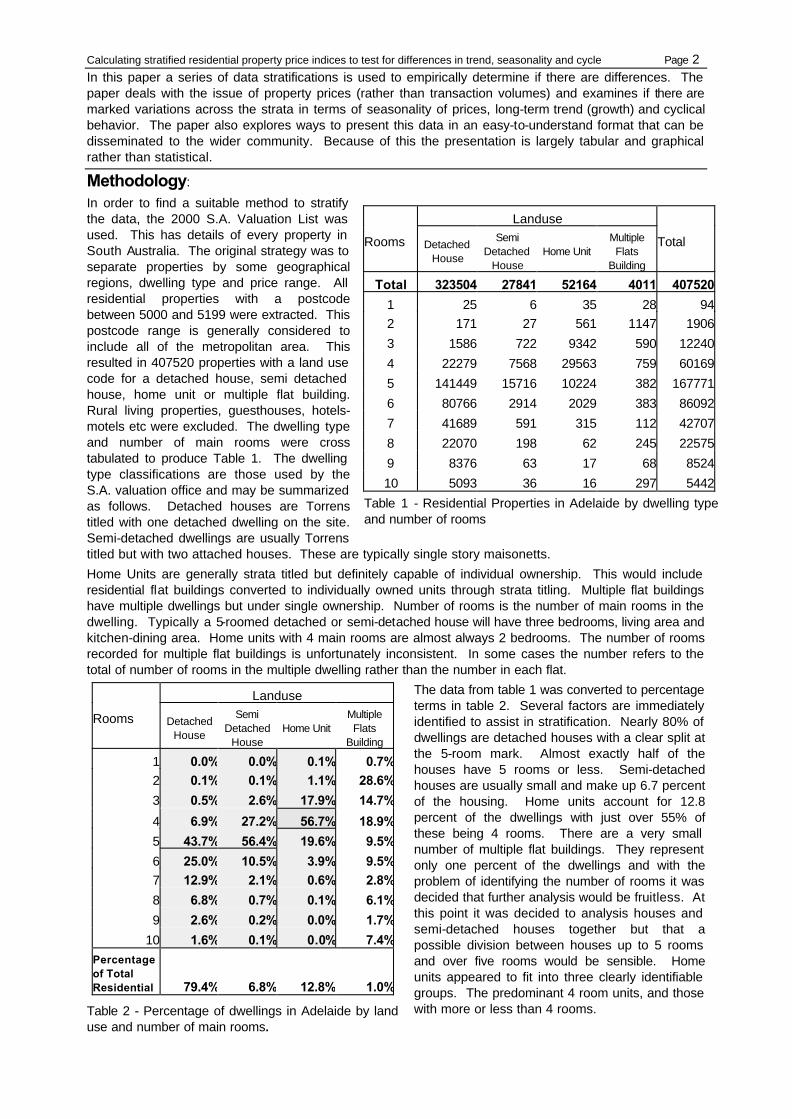
In order to find a suitable method to stratify the data, the 2000 S.A. Valuation List was used. This has details of every property in South Australia. The original strategy was to separate properties by some geographical regions, dwelling type and price range. All residential properties with a postcode between 5000 and 5199 were extracted. This postcode range is generally considered to include all of the metropolitan area. This resulted in 407520 properties with a land use code for a detached house, semi detached house, home unit or multiple flat building. Rural living properties, guesthouses, hotels-motels etc were excluded. The dwelling type and number of main rooms were cross tabulated to produce Table 1. The dwelling type classifications are those used by the S.A. valuation office and may be summarized as follows. Detached houses are Torrens titled with one detached dwelling on the site. Semi-detached dwellings are usually Torrens titled but with two attached houses. These are typically single story maisonetts.
Home Units are generally strata titled but definitely capable of individual ownership. This would include residential flat buildings converted to individually owned units through strata titling. Multiple flat buildings have multiple dwellings but under single ownership. Number of rooms is the number of main rooms in the dwelling. Typically a 5-roomed detached or semi-detached house will have three bedrooms, living area and kitchen-dining area. Home units with 4 main rooms are almost always 2 bedrooms. The number of rooms recorded for multiple flat buildings is unfortunately inconsistent. In some cases the number refers to the total of number of rooms in the multiple dwelling rather than the number in each flat.
The data from table 1 was converted to percentage terms in table 2. Several factors are immediately identified to assist in stratification. Nearly 80% of dwellings are detached houses with a clear split at the 5-room mark. Almost exactly half of the houses have 5 rooms or less. Semi-detached houses are usually small and make up 6.7 percent of the housing. Home units account for 12.8 percent of the dwellings with just over 55% of these being 4 rooms. There are a very small number of multiple flat buildings. They represent only one percent of the dwellings and with the problem of identifying the number of rooms it was decided that further analysis would be fruitless. At this point it was decided to analysis houses and semi-detached houses together but that a possible division between houses up to 5 rooms and over five rooms would be sensible. Home units appeared to fit into three clearly identifiable groups. The predominant 4 room units, and those with more or less than 4 rooms.
Landuse
Rooms Detached House
Semi Detached
House Home Unit
Multiple Flats
Building
Total
Total 323504 27841 52164 4011 407520
1 25 6 35 28 94
2 171 27 561 1147 1906
3 1586 722 9342 590 12240
4 22279 7568 29563 759 60169
5 141449 15716 10224 382 167771
6 80766 2914 2029 383 86092
7 41689 591 315 112 42707
8 22070 198 62 245 22575
9 8376 63 17 68 8524
10 5093 36 16 297 5442
Table 1 - Residential Properties in Adelaide by dwelling type and number of rooms
Landuse
Rooms Detached House
Semi Detached
House Home Unit
Multiple Flats
Building
1 0.0% 0.0% 0.1% 0.7%2 0.1% 0.1% 1.1% 28.6%
3 0.5% 2.6% 17.9% 14.7%
4 6.9% 27.2% 56.7% 18.9%
5 43.7% 56.4% 19.6% 9.5%
6 25.0% 10.5% 3.9% 9.5%7 12.9% 2.1% 0.6% 2.8%
8 6.8% 0.7% 0.1% 6.1%
9 2.6% 0.2% 0.0% 1.7%
10 1.6% 0.1% 0.0% 7.4%Percentage of Total Residential 79.4% 6.8% 12.8% 1.0%
Table 2 - Percentage of dwellings in Adelaide by land use and number of main rooms.

Calculating stratified residential property price indices to test for differences in trend, seasonality and cycle Page 3
Further division of the housing stock was based on the date of construction. Properties built prior to 1900 were bundled together and then 20 year time periods established for the others. Properties were then allocated into the appropriate classification type and the frequencies calculated. Figure 1 is a bar chart of the frequencies of the different dwelling types. It indicates the vast number of houses built since the Second World War. It is also evident that most houses built prior to prior to 1980 were smaller, with newer homes being mainly larger. This is a significant reason for the choice of a constant quality price index compared to a basic median price index. Over the last twenty years (This includes the 18 years of the index) new housing stock is considerably larger than the existing housing stock. On average the housing stock is getting larger. Since living space is usually the primary factor in price variations it is reasonable to expect that a mean or median price index will increase simply because on average the housing stock is getting larger.
The percentage of each dwelling characteristics was mapped at postcode level. Two examples are shown as Figure 2. These show the spatial distribution of properties built from 1961 to 1980. They show that most of the development during this period was in key outer parts of the city. Interestingly there is a large difference between the percentages of large and small homes in most locations. Several postcodes that have a high percentage of smaller houses built during the period have a low percentage of larger housing and visa versa.
Figure 2 - Distribution of housing in Adelaide built from 1961 to 1980
D i s t r i b u t i o n o f R e s i d e n c e s b y P r o p e r t y T y p e
0 . 0 0 % 5 . 0 0 % 1 0 . 0 0 % 1 5 . 0 0 % 2 0 . 0 0 %
H o u s e p r e 1 9 0 1 > 5 r o o m s
H o u s e p r e 1 9 0 1 < = 5 r o o m s
H o u s e 1 9 0 1 - 1 9 2 0 > 5 r o o m s
H o u s e 1 9 0 1 - 1 9 2 0 < = 5 r o o m s
H o u s e 1 9 2 1 - 1 9 4 0 > 5 r o o m s
H o u s e 1 9 2 1 - 1 9 4 0 < = 5 r o o m s
H o u s e 1 9 4 1 - 1 9 6 0 > 5 r o o m s
H o u s e 1 9 4 1 - 1 9 6 0 < = 5 r o o m s
H o u s e 1 9 6 1 - 1 9 8 0 > 5 r o o m s
H o u s e 1 9 6 1 - 1 9 8 0 < = 5 r o o m s
H o u s e 1 9 8 1 - 2 0 0 0 > 5 r o o m sH o u s e 1 9 8 1 - 2 0 0 0 < = 5 r o o m s
H o m e U n i t < 4 r o o m s
H o m e U n i t = 4 r o o m s
H o m e U n i t > 4 r o o m s
Mul t ip le F la t Bu i ld ing
Pro
per
ty T
ype
Percentage
Figure 1 - Distribution of properties by property type.

Calculating stratified residential property price indices to test for differences in trend, seasonality and cycle Page 4
The percentage of each dwellings type in each postcode, together with other housing and housing economic data per plotted in a similar manner. This included housing densities, median prices and median rentals. The purpose was to establish a spatial data set to enable an effective decision about spatial stratification. Statistical methods such as hierarchical clustering were attempted in order to find suitable “groups” of postcodes that might form reasonably homogenous regions. This analysis proved unsuccessful and it was decided to use the spatial mapping to make subjective judgments about regions. These regions were to be defined as groups of postcodes that were contiguous and where housing as reasonably similar. Consideration was also given to the topography of each location, in particular the coastline and the elevated Adelaide Hills. Ten regions were chosen. These were a central region including the CBD, coastal and hills regions, northern and southern regions and a ring of 5 regions around the center. These regions are shown on Figure 3. The aim was to produce indices for each region, broken up by the major dwelling types and then further into low cost, typical cost and high cost. This last stratification became problematic. Low and high cost would normally be defined in terms of price. Possibilities are the lowest and highest quartiles. However as prices change over time this stratification would have to change with the index. Thus for each time period the quartile ranges would change. It is probable that as these change, that individual properties may move between low and typical or high and typical price ranges. This problem of “rolling” price ranges is further compounded if it is calculated for each region and for each dwelling type. Since this solution seems unreasonably complex and difficult to apply on an ongoing basis, it was decided to use a simpler approach. Since the number of rooms could neatly divide houses and units, this was used as the final stratification. Houses and detached houses were broken down into the up to 5 rooms and greater than five rooms categories while units were separated as before around 4 rooms.
Sales data was now collected and stratified on the basis outlined above. The source of data for the indices is the S.A. Sales History File. This is a record of all property transactions that occur and is created through linking data from the titles system and the valuation office. All transactions of residential properties that occurred from January 1,1984 to September 30, 2001 were extracted. Probable non-market transactions were excluded. This data set became the basis for all index work. Basic indices were calculated first using the mean and median prices for each quarter. The hedonic models were then estimated for each stratum of the data. The models were specified as
nn XXddY 3113110 .........* θθβββ ++=
Where Y* = natural log of the observed transaction price
β0 = a constant
d1 = dummy variable for quarter 1
dn = dummy variable for quarter n
β1 = price index for quarter 1
βn = price index for quarter n
X1 = 1st physical attribute variable
Xn = nth physical attribute variable
θ1 = price index for physical attribute 1
θn = price index for physical attribute n
Figure 3 - Spatial Regions

Calculating stratified residential property price indices to test for differences in trend, seasonality and cycle Page 5
The physical attributes used in these models were; land area, building area, condition code and a series of dummy variables for building style, wall cladding and roof cladding.
For each index the base quarter is the first quarter in 1993. This period is chosen because it represents a point at which there is a change in the method for holding data. It is also very conveniently in the middle of the time period.
The creation of the index allows for easy assessment of seasonality, trend and cycles. For this paper seasonal factors are estimated using the ratio to moving average method that is frequently used in classical time series decomposition. This is a straightforward procedure discussed in most business statistics, forecasting and econometric texts (for example Mendenhall & Sincich, 1996, Hanke & Reitsch, 1998, Wilson & Keating, 1999). The disadvantage with this method is the lack of statistical testing. A more robust method is to use a series of seasonal dummy variables in a linear regression. However this procedure is consider unnecessary for this paper. Trend and cycle should be obvious from an inspection of a time series chart of the index. Regression could be used in order to estimate growth rates, however since the data is already in a smoothed index form, the indices can be used to estimate the annual growth as a simple compounding percentage. The comparison procedure for this paper will be to compare directly season factors and growth rates and to search for similar cyclical patterns in the index charts.
Results The calculated indices are shown in appendix 1 to appendix 7. Each appendix has the regional indices for one property type (e.g. all houses, houses of 5 rooms or less) In each case the index is presented for each region with the seasonal factors and annual growth rates at the bottom of the page. Summaries of these are presented in this section for discussion. Appendix 8 contains a comparison of the indices for house prices. Four indices are presented, the constant quality index, mean and median price index and the index for established house prices in Adelaide obtained from the Australian Bureau of Statistics. These indices are plotted in Figure 4. These results demonstrate the need for the quality adjustment of the index. Both the median and mean price indices tend to over estimate growth in house prices (6.64% p.a. and 6.66% p.a. respectively) compared to the constant quality index (5.71%). This is most likely due to the general increase in house size (quality) over the index period. All three indices show similar cycles. There is a noticeable drop in each index in the third quarter of 2000. This coincides with the introduction of the goods and services tax.
There is an interesting difference in the ABS figures. While they track the constant quality index closely over from 1989 onwards, there is considerable variation during the period from 1986 to 1989. The reason for this is unknown but requires investigation. This results in the very low estimate for long-term annual growth of just 3.35%. The ABS index is also considerably “lumpy”.
Figure 4 - Comparison of Various House Indices for Adelaide
Comparison of Various House Indicies in Adelaide
40
50
60
70
80
90
100
110
120
130
140
1984
Q1
1985
Q1
1986
Q1
1987
Q1
1988
Q1
1989
Q1
1990
Q1
1991
Q1
1992
Q1
1993
Q1
1994
Q1
1995
Q1
1996
Q1
1997
Q1
1998
Q1
1999
Q1
2000
Q1
2001
Q1
Quarter
Ind
ex
MedianMean ABSConst Qual

Calculating stratified residential property price indices to test for differences in trend, seasonality and cycle Page 6
Examination of the season indices (Appendix 8) shows some differences. An index of 1 indicates no seasonality. A value of .95 indicates that the seasonal affect on prices would be 95% of the “on average” figure. The values for the constant quality index suggest no real seasonality while the mean and median index suggest some influence with about 1% lower prices in quarter three which would correspond to the winter period. If there were a “down period” in prices it would be expected to be during winter. The ABS index suggests a highly seasonal result with prices in autumn (quarter 2) being over 10% higher than those in spring (quarter 4). This result is against expectations and is inconsistent with the findings by Rossini (2000) and Costello (2001) who found little or no seasonal influence on residential property prices. It is unclear why the ABS index gives results at such variance to other work.
A comparison of the indices by dwelling type is shown in Figure 5. The chart shows that houses with more than 5 rooms slightly out perform houses with 5 rooms or less, however the difference is minimal and both indices follow the same trend. This chart indicates a deficiency in the home unit indices. While the index for home units with 4 rooms is quite stable, those for units with more or less than 4 rooms tend to be erratic. This is typical of a situation where the number of observation used to create the index is insufficient. While the cycle and trend are clear this variation is likely to affect the seasonal figures and suggests that the creation of the index for these properties is not viable. Not withstanding this the trend and cycle pattern does show some points of interest. The pattern for larger home units follows those for houses while the index for the other units seems to follow a different path. All five indices follow roughly the same cycle but clearly the long-term growth for smaller units is lower than for houses and larger home units. This variation in growth rate is indicated in Table 3.
Figure 5 - Comparison of indices by dwelling type
Examination of Table 3 reveals that long-term annual growth rates vary considerably across the regions and across dwelling types. For all dwelling types the central region (region 1) has the highest average annual growth rate. This is followed by the coastal region (region 3). The northern (region 8) and the southern (region 10) regions have the lowest average annual growth rates. The circle of inner regions (regions 2, 4,5,6 & 7) and the Hills (region 9) have similar growth rates in the middle ranges. In all regions the rates for houses are higher than for home units. The pattern of growth rates across the regions is consistent with a trend for purchasers preferring inner city living to outer suburban living.
Examination of the seasonal indices for each region and each dwelling type (refer to Appendix 1 to 7) show that all indices are very close to 1. The seasonal indices for large and small home units are the most variable, but there is no consistent pattern and the small variations in these indices are likely to be due to the significantly, smaller sample size that was used for their creation. Since there is no consistent pattern to the figures and all of figures are close to 1 it is only reasonable to conclude that residential property prices are not affected by seasonal variation.
Comparison Of Indices by Dwelling Type
0.00
20.00
40.00
60.00
80.00
100.00
120.00
140.00
1984
Q1
1984
Q4
1985
Q3
1986
Q2
1987
Q1
1987
Q4
1988
Q3
1989
Q2
1990
Q1
1990
Q4
1991
Q3
1992
Q2
1993
Q1
1993
Q4
1994
Q3
1995
Q2
1996
Q1
1996
Q4
1997
Q3
1998
Q2
1999
Q1
1999
Q4
2000
Q3
2001
Q2
Quarter
Ind
ex
Houses > 5
Houses <=5Units < 4 rooms
Units 4 roomsUnits > 4 rooms

Calculating stratified residential property price indices to test for differences in trend, seasonality and cycle Page 7
Table 3 - Average annual compounding growth rates for various dwelling types by region
Dwelling Type Metro Region
1 Region
2 Region
3 Region
4 Region
5 Region
6 Region
7 Region
8 Region
9 Region
10
Houses 5 rooms or less 5.68% 8.12% 6.70% 7.14% 6.10% 6.55% 6.64% 6.10% 3.88% 5.52% 4.89%
Houses 6 rooms or more 5.70% 7.23% 6.52% 6.35% 5.45% 6.66% 5.77% 4.15% 4.33% 5.98% 5.18%
All Houses 5.71% 7.72% 6.67% 6.81% 6.62% 6.46% 6.58% 6.20% 3.99% 6.72% 4.97%
Units < 4 rooms 4.08% 5.61% 3.49% 4.46% 3.67% N/A 2.30% 3.61% 2.44% N/A 3.71%
Units 4 rooms 4.25% 4.93% 4.36% 4.81% 4.37% 4.27% 3.44% 4.35% 3.12% N/A 3.31%
Units > 4 rooms 4.52% 6.16% 5.00% 5.35% 4.36% 4.51% 3.41% 4.26% 3.40% N/A 3.19%
All Units 4.36% 5.22% 4.83% 4.83% 3.93% 4.20% 4.07% 4.18% 3.25% N/A 3.33%
The chart in Figure 5 showed that across the dwelling types, that the cycles in the property market were remarkably consistent. Figure 6 shows a similar comparison across regions for all houses. Generally the same cyclical pattern is also evident. However examination of the two most extreme regions, central (region 1) and northern (region 8) shows that while the cycle is of roughly the same periodicity, that the amplitude of the cycle for the central region is significantly greater. This greater amplitude leads to the higher overall growth rate.
Figure 6 - Comparison of house price indices by region
Comparison of House Price Index Across Regions
40.00
60.00
80.00
100.00
120.00
140.00
160.00
1984
Q1
1984
Q4
1985
Q3
1986
Q2
1987
Q1
1987
Q4
1988
Q3
1989
Q2
1990
Q1
1990
Q4
1991
Q3
1992
Q2
1993
Q1
1993
Q4
1994
Q3
1995
Q2
1996
Q1
1996
Q4
1997
Q3
1998
Q2
1999
Q1
1999
Q4
2000
Q3
2001
Q2
Quarter
Ind
ex
Region 1 Region 2Region 3 Region 4Region 5 Region 6Region 7 Region 8Region 9 Region 10

Calculating stratified residential property price indices to test for differences in trend, seasonality and cycle Page 8
In simple terms this means that while the market is stable (for example between 1990 and 1995) that all properties are moving approximately together. When the market moves into an expansion phase (around 1997) all sub-markets expand, however the rate of expansion is greatest in the central region and lowest in the northern region. This will result in greater long-term growth, as each expansion phase will result in a widening of the gap between prices in the central and northern regions. So while the timing of the cycles is similar the result of the cyclical movement is considerably different. A similar situation occurs with other dwelling types.
Conclusions This paper leads to several conclusions about index creation and stratification as well as some conclusions about the residential property market in Adelaide.
The research further supports the use of residential price indices that allow for quality adjustment and supports the use of the ratio to moving average method to estimate seasonal indices. By creating indices with different strata, it is clear that stratification can produce more meaningful results and that there are significant differences in the long-term growth of residential property prices across regions and dwelling types.
In terms of the residential property market in Adelaide
• Property prices do not seem to have any significant seasonal variation
• Residential property prices appear to be cyclical with these cycles being quite consistent across different dwelling types and regions. The periodicity and movement points are similar but the amplitude of the cycles vary.
• Growth rates vary considerably across the residential market in Adelaide. Houses and larger home units have similar growth rates but most home units and particularly smaller home units show lower long-term growth. This pattern is typical across all regions.
• Residential properties in Adelaide’s northern and southern regions have shown significantly lower long-term growth than the rest of the city. The best-performed residential markets are in the central and coastal regions.
In terms of future index creation the following recommendations are made in respect of Adelaide residential price indices.
• Stratification by region and dwelling type is essential if the indices are to be used at a local level.
• The regional stratification used in the paper would appear to be sound, however the northern and southern regions should be reconsidered since they are the two largest regions and show significantly different results to the rest of Adelaide. It may be sensible to further divide these regions to account for large areas of new development within much older housing stock.
• An alternate strategy would be to create a new index based on semi-detached houses since these make up a large proportion of the houses in the northern and southern regions and this may be one reason for the lower over all growth in these regions.
• While the trends in larger home unit prices seem to vary from other home unit prices, there is not sufficient data to properly estimate the index for large and small units. It is recommended that only one home unit index be produced.
It is hoped that this paper will assist in the development of these prices indices for release to the community via the World Wide Web.

Calculating stratified residential property price indices to test for differences in trend, seasonality and cycle Page 9
References
Bailey M., Muth R & Nourse, H (1963) “A Regression Method for Real Estate Price Index Construction”, Journal of the American Statistical Association, 58: 933-942, December 1963.
Case, K.E. and Shiller, R.J. (1989) “The Efficiency of the Market for Single - Family Homes”, The American Economic Review, Vol79 No 1 pp125.
Costello, G. & Schwann, G. (1996) “The Impact of Holding Periods on the Measurement of Real Estate Prices” Pacific Rim Real Estate Society Conference, Brisbane, 1996
Costello, G. (1997) “Transaction Based Index Methods for Housing Market Analysis”, Australian Land Economics Review, Vol (3), No 2. pp19 - 27
Costello, G. (2001) “Seasonal Influences in Australian Housing Markets” Pacific Rim Property Research Journal, Vol (7), No 1, pp47-55
Costello, G. (2000) “Location Location Location – Wise Maxim or clever Hoax?” Pacific Rim Property Research Journal, Vol (6), No 1, pp25-35
Goodman A. (1978) “Hedonic Prices, Price Indices and Housing Markets” Journal of Urban Economics, 5: 471-484, 1978.
Hanke, J.E & Reitsch, A.G. (1998) Business Forecasting, 6th Edition, Prentice Hall, USA
Kershaw, P.J. & Rossini, P.A. (1999) "Using Neural Networks to Estimate Constant Quality House Price Indices", proceedings of the International Real Estate Society Conference, Kuala Lumpur 1998
Mankiw N.G. & D.N. Weil.(1989) “The Baby Boom, The Baby Bust, and the Housing Market” Regional Science and Urban Economics, 19: 235-258, 1989.
Mendenhall, W. & Sincich, T. (1996), A Second Course in Statistics, 5th Edition, Prentice Hall, USA
Rossini, P. (1996) “Using Constant Quality House Prices to Assess Property Market Performance” The Valuer and Land Economist , August 1996
Rossini, P. (1998) “Assessing Buyer Search Behavior for Residential House Purchasers in Adelaide”, proceedings of the 4th Pacific Rim Real Estate Society Conference, Perth 1998
Rossini, P. (2000) “Estimating the Seasonal Effects of Residential Property Markets – A Case Study of Adelaide”, proceedings of the 6th Pacific Rim Real Estate Society Conference, Sydney, Australia, 2000
Yates J (1996) Towards a Reassessment of the Private Rental Market Housing Studies 11: 1
Wilson, J.H & Keating, B (1999) Business Forecasting, 3rd Edition, McGraw Hill, USA
Peter Rossini, Lecturer - University of South Australia
School of International Business
North Terrace, Adelaide, Australia, 5000
Phone (61-8) 83020649
Fax (61-8) 83020512
Mobile 041 210 5583
E-mail [email protected]

Appendix 1 - Adelaide Metropolitan Price Index – All Houses
Period Metro Region 1 Region 2 Region 3 Region 4 Region 5 Region 6 Region 7 Region 8 Region 9 Region 101984Q1 49.48 41.07 46.16 49.01 45.53 47.70 41.87 45.39 62.13 46.97 56.011984Q2 54.71 45.73 50.89 56.30 53.46 49.42 53.12 57.64 64.91 53.67 58.071984Q3 58.70 47.52 56.38 56.26 57.69 50.69 59.28 60.75 66.62 48.22 64.441984Q4 61.68 51.68 56.34 59.55 61.80 55.95 63.59 63.28 66.25 56.83 66.741985Q1 64.39 56.11 62.55 63.65 64.75 61.06 65.41 66.53 59.51 53.80 68.861985Q2 67.69 56.62 66.35 65.03 65.95 64.84 66.44 67.36 72.16 61.27 72.411985Q3 68.86 56.24 64.93 64.30 66.15 63.50 67.47 70.60 77.38 61.52 74.571985Q4 69.62 58.05 65.09 65.59 67.03 63.91 67.48 71.34 80.36 64.64 73.971986Q1 69.14 59.20 64.08 65.47 66.88 65.01 65.89 69.22 78.41 66.81 73.581986Q2 68.79 58.89 65.05 64.29 65.48 64.95 66.44 69.13 79.55 63.61 72.651986Q3 68.61 58.63 64.98 65.90 64.91 65.87 64.45 69.04 78.03 65.25 73.081986Q4 69.53 60.11 64.16 64.73 65.45 68.39 65.06 69.84 79.20 67.71 72.791987Q1 69.46 60.15 64.69 64.72 65.65 68.06 65.75 69.21 77.24 67.51 72.931987Q2 69.35 60.25 64.17 64.70 65.83 67.10 66.08 69.91 78.04 67.27 72.881987Q3 70.01 63.16 65.04 66.51 66.36 69.99 63.57 70.48 79.08 66.51 71.851987Q4 71.89 66.41 67.51 68.83 69.14 71.49 68.03 71.55 79.51 68.90 74.081988Q1 73.84 67.94 69.64 71.47 70.69 74.19 70.60 72.90 80.86 70.80 75.631988Q2 75.08 69.81 71.71 74.05 70.77 76.13 70.90 74.72 80.62 72.77 77.561988Q3 77.38 75.52 74.10 76.78 73.80 78.39 74.25 77.03 83.14 75.68 79.851988Q4 80.11 81.44 77.59 80.17 77.46 83.36 76.72 79.95 84.34 76.08 80.871989Q1 84.75 87.15 80.70 84.48 82.76 87.52 79.32 83.88 86.81 83.09 85.251989Q2 86.62 90.25 83.66 87.26 86.88 91.76 79.67 86.41 88.88 83.83 87.271989Q3 87.89 90.91 85.07 87.47 86.05 92.22 81.19 87.54 89.29 88.83 88.681989Q4 88.61 92.58 86.16 88.64 90.16 93.85 85.22 88.28 90.71 89.77 88.901990Q1 91.16 95.28 89.49 91.48 88.96 97.23 83.33 90.53 92.22 89.97 91.771990Q2 93.71 96.41 90.98 93.07 90.59 96.04 88.22 93.52 98.17 92.82 93.961990Q3 92.97 97.85 91.31 91.77 90.79 100.51 91.68 93.85 96.83 89.36 93.491990Q4 94.46 98.63 92.34 95.70 92.52 100.46 93.32 95.80 93.90 92.31 95.311991Q1 94.59 96.26 92.52 94.08 93.73 97.07 93.14 96.55 92.85 92.62 96.091991Q2 96.81 96.05 93.85 97.12 95.21 96.35 92.70 97.46 102.04 94.64 97.341991Q3 98.21 97.91 95.92 97.63 94.41 98.16 95.68 98.18 103.62 97.51 97.941991Q4 97.97 96.15 95.37 97.72 98.98 95.52 97.38 97.96 101.69 99.70 97.711992Q1 98.12 97.25 96.03 98.21 96.44 96.66 97.19 98.20 98.93 98.50 99.551992Q2 98.02 97.37 98.97 98.46 97.49 98.96 95.97 98.41 96.01 97.82 98.311992Q3 98.38 99.18 99.47 97.72 99.58 98.55 96.49 99.68 98.52 95.86 99.211992Q4 99.77 97.87 99.18 97.43 99.69 98.59 98.25 100.11 100.24 93.55 98.691993Q1 100.00 100.00 100.00 100.00 100.00 100.00 100.00 100.00 100.00 100.00 100.001993Q2 99.98 97.87 101.93 99.73 99.80 97.61 99.93 100.93 99.29 101.21 99.301993Q3 98.86 97.37 99.46 99.48 97.68 97.82 95.12 98.96 99.90 100.62 97.961993Q4 99.99 99.51 99.05 101.15 99.71 99.70 99.29 100.84 100.17 105.34 98.661994Q1 100.35 101.89 99.97 101.50 99.84 101.33 100.01 101.45 100.84 103.86 99.071994Q2 100.90 99.41 102.87 102.92 101.11 103.35 99.68 100.29 99.38 103.66 99.831994Q3 100.23 103.25 103.77 104.28 101.66 102.26 97.71 100.18 100.93 103.38 99.081994Q4 100.06 102.31 102.01 103.33 100.23 103.64 97.04 100.66 98.64 100.58 98.831995Q1 98.92 101.36 100.65 100.86 98.94 101.52 98.31 96.05 97.39 103.42 98.311995Q2 97.19 98.64 100.78 99.62 97.76 99.15 93.89 96.59 97.25 101.51 95.961995Q3 95.86 99.49 98.71 98.61 97.28 97.51 93.86 94.45 96.34 103.06 93.251995Q4 95.77 97.53 97.92 98.98 94.03 97.51 90.98 95.16 95.29 101.02 93.711996Q1 95.27 97.87 94.13 100.02 96.70 98.01 93.30 95.03 95.16 101.27 94.011996Q2 95.62 98.61 96.89 95.83 94.82 96.64 92.31 95.16 94.99 98.56 94.141996Q3 94.78 97.16 96.49 97.84 95.16 98.71 90.22 93.61 95.66 100.73 91.871996Q4 96.41 98.79 97.23 99.60 94.61 98.82 92.51 95.66 95.37 97.98 93.791997Q1 97.77 99.40 100.02 100.58 95.94 98.87 90.44 94.79 97.52 101.29 94.011997Q2 98.52 104.77 98.97 100.97 96.09 101.72 94.38 97.45 95.69 97.95 94.921997Q3 97.37 102.00 98.94 100.75 96.52 105.97 93.51 97.68 96.82 98.89 95.761997Q4 99.09 107.22 101.72 104.59 99.85 103.64 93.86 96.96 96.81 94.72 95.631998Q1 100.75 109.28 103.20 107.57 100.16 102.87 98.03 98.79 96.99 104.31 96.991998Q2 101.52 111.14 102.58 105.08 102.82 105.96 98.40 102.59 98.07 107.42 97.871998Q3 101.63 113.06 103.07 109.12 104.75 106.82 97.51 100.82 98.70 102.80 97.471998Q4 102.96 113.20 103.59 110.03 103.41 108.36 96.55 103.02 98.25 110.30 99.381999Q1 104.72 117.76 106.71 113.24 107.49 111.26 98.54 102.67 99.44 111.59 100.831999Q2 108.39 127.48 110.07 118.24 109.22 114.42 103.06 107.38 100.39 114.50 101.171999Q3 108.85 127.93 112.61 120.90 113.77 120.07 101.28 108.39 102.15 109.58 104.351999Q4 112.94 129.25 115.79 127.57 119.49 123.48 108.12 111.66 102.70 123.09 108.212000Q1 116.23 133.61 120.10 132.19 119.18 124.47 109.85 113.75 106.83 129.65 109.832000Q2 118.61 137.10 122.54 136.75 123.61 125.47 111.80 115.04 107.97 129.95 113.602000Q3 114.85 135.85 122.58 136.94 120.30 124.17 111.84 114.74 109.07 127.08 113.262000Q4 119.79 136.16 124.65 139.05 126.05 127.87 118.53 119.76 114.32 136.93 116.602001Q1 123.22 140.50 127.05 139.46 130.57 131.12 120.78 121.36 116.37 131.87 121.662001Q2 127.28 146.22 132.65 149.51 136.60 135.24 123.58 124.33 119.16 142.41 124.712001Q3 130.79 150.80 142.84 155.27 139.89 142.78 127.66 130.07 123.32 146.54 130.81
Q1 1.002 1.004 0.999 1.003 1.002 1.001 1.004 0.998 0.990 1.006 1.003Q2 1.004 1.001 1.007 1.000 1.001 0.999 1.002 1.003 1.003 1.004 1.003Q3 0.994 0.997 0.998 0.996 0.994 1.000 0.990 0.997 1.006 0.991 0.996Q4 1.000 0.998 0.996 1.001 1.002 1.000 1.003 1.003 1.001 0.999 0.998Growth over 70 Quarters 164.35% 267.19% 209.47% 216.82% 207.26% 199.31% 204.92% 186.59% 98.48% 211.97% 133.53%Ave Annual Growth 5.71% 7.72% 6.67% 6.81% 6.62% 6.46% 6.58% 6.20% 3.99% 6.72% 4.97%
No of Obs 264518 29204 27763 21536 18308 17831 12492 37481 47454 5862 46578R Squared 0.660 0.793 0.750 0.752 0.774 0.741 0.758 0.734 0.706 0.749 0.717
Seasonal Factors
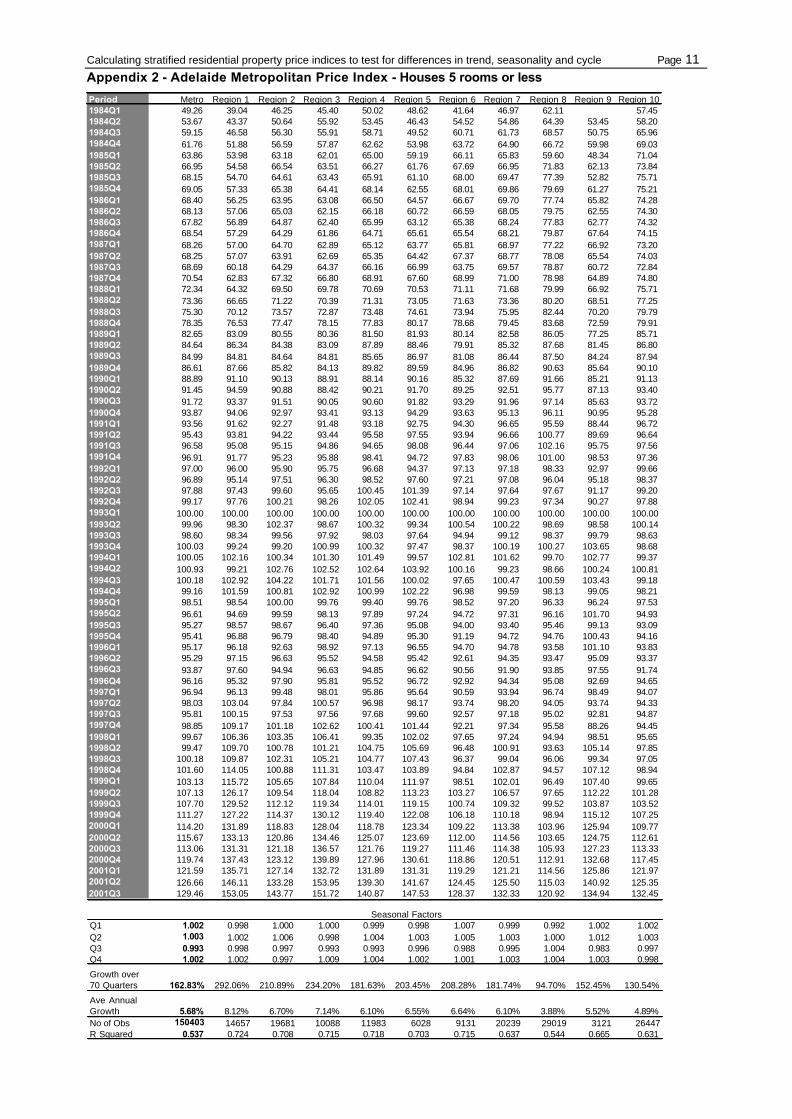
Calculating stratified residential property price indices to test for differences in trend, seasonality and cycle Page 11 Appendix 2 - Adelaide Metropolitan Price Index - Houses 5 rooms or less
Period Metro Region 1 Region 2 Region 3 Region 4 Region 5 Region 6 Region 7 Region 8 Region 9 Region 101984Q1 49.26 39.04 46.25 45.40 50.02 48.62 41.64 46.97 62.11 57.451984Q2 53.67 43.37 50.64 55.92 53.45 46.43 54.52 54.86 64.39 53.45 58.201984Q3 59.15 46.58 56.30 55.91 58.71 49.52 60.71 61.73 68.57 50.75 65.961984Q4 61.76 51.88 56.59 57.87 62.62 53.98 63.72 64.90 66.72 59.98 69.031985Q1 63.86 53.98 63.18 62.01 65.00 59.19 66.11 65.83 59.60 48.34 71.041985Q2 66.95 54.58 66.54 63.51 66.27 61.76 67.69 66.95 71.83 62.13 73.841985Q3 68.15 54.70 64.61 63.43 65.91 61.10 68.00 69.47 77.39 52.82 75.711985Q4 69.05 57.33 65.38 64.41 68.14 62.55 68.01 69.86 79.69 61.27 75.211986Q1 68.40 56.25 63.95 63.08 66.50 64.57 66.67 69.70 77.74 65.82 74.281986Q2 68.13 57.06 65.03 62.15 66.18 60.72 66.59 68.05 79.75 62.55 74.301986Q3 67.82 56.89 64.87 62.40 65.99 63.12 65.38 68.24 77.83 62.77 74.321986Q4 68.54 57.29 64.29 61.86 64.71 65.61 65.54 68.21 79.87 67.64 74.151987Q1 68.26 57.00 64.70 62.89 65.12 63.77 65.81 68.97 77.22 66.92 73.201987Q2 68.25 57.07 63.91 62.69 65.35 64.42 67.37 68.77 78.08 65.54 74.031987Q3 68.69 60.18 64.29 64.37 66.16 66.99 63.75 69.57 78.87 60.72 72.841987Q4 70.54 62.83 67.32 66.80 68.91 67.60 68.99 71.00 78.98 64.89 74.801988Q1 72.34 64.32 69.50 69.78 70.69 70.53 71.11 71.68 79.99 66.92 75.711988Q2 73.36 66.65 71.22 70.39 71.31 73.05 71.63 73.36 80.20 68.51 77.251988Q3 75.30 70.12 73.57 72.87 73.48 74.61 73.94 75.95 82.44 70.20 79.791988Q4 78.35 76.53 77.47 78.15 77.83 80.17 78.68 79.45 83.68 72.59 79.911989Q1 82.65 83.09 80.55 80.36 81.50 81.93 80.14 82.58 86.05 77.25 85.711989Q2 84.64 86.34 84.38 83.09 87.89 88.46 79.91 85.32 87.68 81.45 86.801989Q3 84.99 84.81 84.64 84.81 85.65 86.97 81.08 86.44 87.50 84.24 87.941989Q4 86.61 87.66 85.82 84.13 89.82 89.59 84.96 86.82 90.63 85.64 90.101990Q1 88.89 91.10 90.13 88.91 88.14 90.16 85.32 87.69 91.66 85.21 91.131990Q2 91.45 94.59 90.88 88.42 90.21 91.70 89.25 92.51 95.77 87.13 93.401990Q3 91.72 93.37 91.51 90.05 90.60 91.82 93.29 91.96 97.14 85.63 93.721990Q4 93.87 94.06 92.97 93.41 93.13 94.29 93.63 95.13 96.11 90.95 95.281991Q1 93.56 91.62 92.27 91.48 93.18 92.75 94.30 96.65 95.59 88.44 96.721991Q2 95.43 93.81 94.22 93.44 95.58 97.55 93.94 96.66 100.77 89.69 96.641991Q3 96.58 95.08 95.15 94.86 94.65 98.08 96.44 97.06 102.16 95.75 97.561991Q4 96.91 91.77 95.23 95.88 98.41 94.72 97.83 98.06 101.00 98.53 97.361992Q1 97.00 96.00 95.90 95.75 96.68 94.37 97.13 97.18 98.33 92.97 99.661992Q2 96.89 95.14 97.51 96.30 98.52 97.60 97.21 97.08 96.04 95.18 98.371992Q3 97.88 97.43 99.60 95.65 100.45 101.39 97.14 97.64 97.67 91.17 99.201992Q4 99.17 97.76 100.21 98.26 102.05 102.41 98.94 99.23 97.34 90.27 97.881993Q1 100.00 100.00 100.00 100.00 100.00 100.00 100.00 100.00 100.00 100.00 100.001993Q2 99.96 98.30 102.37 98.67 100.32 99.34 100.54 100.22 98.69 98.58 100.141993Q3 98.60 98.34 99.56 97.92 98.03 97.64 94.94 99.12 98.37 99.79 98.631993Q4 100.03 99.24 99.20 100.99 100.32 97.47 98.37 100.19 100.27 103.65 98.681994Q1 100.05 102.16 100.34 101.30 101.49 99.57 102.81 101.62 99.70 102.77 99.371994Q2 100.93 99.21 102.76 102.52 102.64 103.92 100.16 99.23 98.66 100.24 100.811994Q3 100.18 102.92 104.22 101.71 101.56 100.02 97.65 100.47 100.59 103.43 99.181994Q4 99.16 101.59 100.81 102.92 100.99 102.22 96.98 99.59 98.13 99.05 98.211995Q1 98.51 98.54 100.00 99.76 99.40 99.76 98.52 97.20 96.33 96.24 97.531995Q2 96.61 94.69 99.59 98.13 97.89 97.24 94.72 97.31 96.16 101.70 94.931995Q3 95.27 98.57 98.67 96.40 97.36 95.08 94.00 93.40 95.46 99.13 93.091995Q4 95.41 96.88 96.79 98.40 94.89 95.30 91.19 94.72 94.76 100.43 94.161996Q1 95.17 96.18 92.63 98.92 97.13 96.55 94.70 94.78 93.58 101.10 93.831996Q2 95.29 97.15 96.63 95.52 94.58 95.42 92.61 94.35 93.47 95.09 93.371996Q3 93.87 97.60 94.94 96.63 94.85 96.62 90.56 91.90 93.85 97.55 91.741996Q4 96.16 95.32 97.90 95.81 95.52 96.72 92.92 94.34 95.08 92.69 94.651997Q1 96.94 96.13 99.48 98.01 95.86 95.64 90.59 93.94 96.74 98.49 94.071997Q2 98.03 103.04 97.84 100.57 96.98 98.17 93.74 98.20 94.05 93.74 94.331997Q3 95.81 100.15 97.53 97.56 97.68 99.60 92.57 97.18 95.02 92.81 94.871997Q4 98.85 109.17 101.18 102.62 100.41 101.44 92.21 97.34 95.58 88.26 94.451998Q1 99.67 106.36 103.35 106.41 99.35 102.02 97.65 97.24 94.94 98.51 95.651998Q2 99.47 109.70 100.78 101.21 104.75 105.69 96.48 100.91 93.63 105.14 97.851998Q3 100.18 109.87 102.31 105.21 104.77 107.43 96.37 99.04 96.06 99.34 97.051998Q4 101.60 114.05 100.88 111.31 103.47 103.89 94.84 102.87 94.57 107.12 98.941999Q1 103.13 115.72 105.65 107.84 110.04 111.97 98.51 102.01 96.49 107.40 99.651999Q2 107.13 126.17 109.54 118.04 108.82 113.23 103.27 106.57 97.65 112.22 101.281999Q3 107.70 129.52 112.12 119.34 114.01 119.15 100.74 109.32 99.52 103.87 103.521999Q4 111.27 127.22 114.37 130.12 119.40 122.08 106.18 110.18 98.94 115.12 107.252000Q1 114.20 131.89 118.83 128.04 118.78 123.34 109.22 113.38 103.96 125.94 109.772000Q2 115.67 133.13 120.86 134.46 125.07 123.69 112.00 114.56 103.65 124.75 112.612000Q3 113.06 131.31 121.18 136.57 121.76 119.27 111.46 114.38 105.93 127.23 113.332000Q4 119.74 137.43 123.12 139.89 127.96 130.61 118.86 120.51 112.91 132.68 117.452001Q1 121.59 135.71 127.14 132.72 131.89 131.31 119.29 121.21 114.56 125.86 121.972001Q2 126.66 146.11 133.28 153.95 139.30 141.67 124.45 125.50 115.03 140.92 125.352001Q3 129.46 153.05 143.77 151.72 140.87 147.53 128.37 132.33 120.92 134.94 132.45
Q1 1.002 0.998 1.000 1.000 0.999 0.998 1.007 0.999 0.992 1.002 1.002Q2 1.003 1.002 1.006 0.998 1.004 1.003 1.005 1.003 1.000 1.012 1.003Q3 0.993 0.998 0.997 0.993 0.993 0.996 0.988 0.995 1.004 0.983 0.997Q4 1.002 1.002 0.997 1.009 1.004 1.002 1.001 1.003 1.004 1.003 0.998
Growth over 70 Quarters 162.83% 292.06% 210.89% 234.20% 181.63% 203.45% 208.28% 181.74% 94.70% 152.45% 130.54%
Ave Annual Growth 5.68% 8.12% 6.70% 7.14% 6.10% 6.55% 6.64% 6.10% 3.88% 5.52% 4.89%No of Obs 150403 14657 19681 10088 11983 6028 9131 20239 29019 3121 26447R Squared 0.537 0.724 0.708 0.715 0.718 0.703 0.715 0.637 0.544 0.665 0.631
Seasonal Factors

Calculating stratified residential property price indices to test for differences in trend, seasonality and cycle Page 12 Appendix 3 - Adelaide Metropolitan Price Index - Houses 6 rooms or more
Period Metro Region 1 Region 2 Region 3 Region 4 Region 5 Region 6 Region 7 Region 8 Region 9 Region 101984Q1 50.43 44.23 46.87 54.05 45.66 48.42 60.46 53.581984Q2 57.06 49.32 51.81 56.78 55.97 52.84 47.03 63.33 64.27 57.991984Q3 57.87 48.59 57.37 56.80 56.13 51.44 53.62 58.91 59.93 61.681984Q4 61.58 50.87 55.43 61.38 61.15 59.03 62.79 60.39 61.22 62.861985Q1 65.44 58.73 59.32 64.93 64.75 62.94 63.67 67.77 58.54 59.38 65.681985Q2 69.12 59.09 65.85 66.28 66.41 66.96 61.04 67.65 71.46 60.09 70.201985Q3 70.06 58.48 66.33 64.70 68.20 65.63 65.04 71.64 74.79 73.48 72.731985Q4 70.77 59.31 64.56 66.62 65.47 64.38 65.32 73.59 80.05 68.43 71.991986Q1 70.50 62.41 65.22 67.51 68.15 65.44 63.77 68.40 78.20 67.99 73.011986Q2 69.59 60.34 65.38 66.12 64.48 67.20 65.70 69.90 76.90 63.00 70.431986Q3 69.84 60.02 65.88 69.66 63.28 67.10 61.47 69.90 76.33 67.91 71.491986Q4 70.85 62.94 63.96 67.28 68.05 70.10 63.24 71.26 75.45 67.71 70.531987Q1 71.32 63.19 65.23 66.18 67.36 70.75 65.95 69.28 75.72 65.85 72.731987Q2 71.04 62.75 65.38 66.81 68.05 68.79 62.46 70.96 75.87 68.64 71.851987Q3 72.11 65.88 67.50 68.50 67.50 72.08 63.40 71.02 78.05 71.28 70.841987Q4 73.99 70.30 67.79 70.88 70.02 73.48 65.05 71.80 79.42 75.67 73.361988Q1 76.01 70.92 69.54 73.26 71.13 76.02 68.35 74.36 81.32 76.42 76.331988Q2 77.56 72.29 73.23 77.33 70.82 77.58 68.34 75.76 79.77 77.35 77.921988Q3 80.38 79.93 75.95 80.25 75.17 80.44 74.06 78.17 83.02 79.66 80.061988Q4 82.39 85.49 78.05 81.75 77.60 84.69 71.92 80.25 83.98 81.53 83.081989Q1 87.59 90.99 81.79 88.09 86.13 90.69 75.96 85.33 87.12 90.50 85.051989Q2 89.38 93.23 82.17 92.41 85.88 93.37 78.72 87.18 90.20 85.73 88.321989Q3 91.94 97.78 86.11 90.90 87.19 95.14 80.09 88.62 91.24 94.30 90.301989Q4 91.76 98.58 87.81 94.00 91.59 97.00 86.38 89.58 89.99 95.28 87.941990Q1 94.17 98.65 88.67 93.70 90.92 101.45 76.99 93.45 92.03 96.30 93.541990Q2 97.05 98.80 91.94 96.98 91.86 97.59 85.26 94.47 101.23 98.56 95.401990Q3 94.93 101.18 91.49 93.99 93.12 103.69 85.80 95.77 95.47 94.98 93.831990Q4 95.03 103.49 91.08 98.40 91.90 103.29 92.50 96.18 89.01 91.27 95.091991Q1 95.65 99.76 93.12 95.98 96.58 99.00 90.93 95.78 87.64 97.95 95.661991Q2 98.75 98.39 93.25 99.74 95.52 95.57 89.31 98.26 103.40 99.22 98.821991Q3 100.57 101.51 98.14 100.18 95.59 98.35 94.16 99.20 104.78 99.65 98.811991Q4 99.62 101.23 95.69 99.19 100.51 96.28 96.07 97.19 101.63 97.90 99.651992Q1 99.52 98.90 96.29 99.86 97.06 96.68 97.37 98.95 99.08 106.10 99.581992Q2 99.39 99.36 103.58 100.29 96.33 99.48 91.50 99.82 95.66 99.72 98.471992Q3 98.87 101.00 99.18 100.09 99.11 96.48 94.51 101.68 99.57 99.29 98.961992Q4 100.59 97.38 98.17 97.92 96.89 95.37 96.57 100.30 104.34 95.20 100.901993Q1 100.00 100.00 100.00 100.00 100.00 100.00 100.00 100.00 100.00 100.00 100.001993Q2 100.24 97.39 101.59 101.22 99.50 96.79 98.22 101.00 99.91 102.00 98.631993Q3 99.66 97.07 99.62 101.51 98.68 97.98 96.26 98.45 101.77 100.08 97.421993Q4 100.30 100.36 99.65 101.58 100.12 100.48 100.61 101.15 99.65 106.89 98.661994Q1 101.12 102.34 99.88 102.62 97.71 102.00 91.68 101.03 102.09 104.71 99.081994Q2 101.14 100.35 103.84 103.22 100.29 102.91 98.42 101.61 100.24 106.80 98.871994Q3 100.22 102.84 102.87 105.65 102.79 103.59 97.02 99.80 101.26 102.56 99.411994Q4 101.34 103.14 105.14 103.37 100.57 105.01 97.63 101.41 99.34 101.07 99.861995Q1 99.58 105.17 103.41 102.08 98.97 102.22 96.77 94.91 98.89 111.22 99.081995Q2 97.96 104.02 104.58 100.89 97.91 99.41 92.80 95.37 98.64 100.55 97.031995Q3 96.67 100.89 99.37 101.02 98.84 98.68 92.80 94.83 97.36 105.43 93.611995Q4 95.64 96.87 100.42 99.02 93.57 97.98 91.32 95.01 95.54 99.58 93.451996Q1 95.58 101.26 98.11 101.29 96.43 98.37 89.93 94.81 96.52 101.76 94.401996Q2 96.36 100.82 99.26 96.61 95.38 97.23 91.75 95.48 96.62 100.76 95.301996Q3 96.16 98.20 100.11 99.42 96.94 99.34 89.63 95.11 97.77 103.06 92.861996Q4 96.95 102.04 96.39 103.64 94.15 100.02 91.67 96.61 96.15 102.53 93.221997Q1 98.57 102.19 101.07 102.96 97.32 100.66 89.73 95.55 98.52 102.46 94.091997Q2 99.31 107.28 101.87 102.22 95.91 102.96 95.71 96.22 97.96 100.56 95.431997Q3 99.21 104.34 101.39 104.22 95.43 108.51 96.66 97.60 99.17 105.69 96.981997Q4 100.05 107.69 103.27 107.15 99.99 104.70 98.36 96.47 98.57 100.54 97.191998Q1 102.40 113.36 102.75 108.83 102.66 103.05 98.27 99.74 99.74 110.99 98.851998Q2 104.20 113.04 107.72 108.52 101.15 105.85 101.48 103.41 102.92 109.68 99.071998Q3 103.99 117.82 105.74 113.42 106.15 106.75 100.53 102.00 102.30 106.28 98.091998Q4 104.93 114.61 109.72 109.74 104.17 109.96 101.71 102.86 103.17 110.94 100.251999Q1 107.04 120.75 109.50 118.27 104.48 111.02 98.57 102.82 102.99 114.28 102.891999Q2 110.43 130.17 112.12 118.75 111.51 115.05 102.79 107.96 103.79 116.89 101.911999Q3 111.02 129.25 114.64 122.57 115.57 120.86 103.57 107.39 106.28 115.31 105.651999Q4 115.29 133.03 119.96 126.34 121.15 124.23 111.65 112.93 107.90 130.58 109.552000Q1 118.79 136.63 125.03 135.76 120.02 125.18 111.27 113.18 110.78 131.56 110.182000Q2 122.55 141.66 127.03 139.71 122.19 125.93 112.67 115.39 114.67 133.31 114.952000Q3 117.48 142.44 126.15 137.57 119.19 126.04 113.90 114.62 113.31 126.19 114.282000Q4 120.16 134.96 129.77 139.81 123.69 126.71 118.77 118.44 116.47 140.36 116.252001Q1 125.83 147.90 127.48 143.84 129.98 131.03 124.53 121.10 119.36 137.33 121.772001Q2 128.34 147.08 131.48 146.47 133.66 133.17 123.84 122.50 125.06 144.19 124.712001Q3 133.06 149.99 141.61 158.64 139.71 141.04 129.30 127.61 126.93 154.82 129.67
Q1 1.002 1.009 0.994 1.003 1.006 1.003 0.997 0.997 0.989 1.034 1.004Q2 1.005 0.998 1.010 1.001 0.996 0.996 0.996 1.003 1.008 0.989 1.003Q3 0.996 0.997 1.001 1.000 0.999 1.002 0.995 0.998 1.007 0.991 0.996Q4 0.997 0.996 0.995 0.996 0.999 1.000 1.011 1.002 0.997 0.986 0.997Growth over 70 Quarters 163.84% 239.11% 202.12% 193.48% 149.62% 208.90% 167.03% 101.51% 109.92% 160.71% 141.99%Ave Annual Growth 5.70% 7.23% 6.52% 6.35% 5.45% 6.66% 5.77% 4.15% 4.33% 5.98% 5.18%
No of Obs 111833 13045 7549 11419 6310 11781 3339 17180 18350 2736 20115
R Squared 0.639 0.760 0.727 0.698 0.772 0.687 0.777 0.726 0.692 0.709 0.663
Seasonal Factors

Calculating stratified residential property price indices to test for differences in trend, seasonality and cycle Page 13 Appendix 4 - Adelaide Metropolitan Price Index – All Home Units
Period Metro Region 1 Region 2 Region 3 Region 4 Region 5 Region 6 Region 7 Region 8 Region 9 Region 101984Q1 59.19 56.14 61.43 60.28 61.24 60.94 55.26 58.88 60.93 63.211984Q2 62.85 60.30 63.31 61.36 61.41 58.37 67.95 64.57 64.38 61.011984Q3 64.60 61.96 65.80 66.36 67.28 64.96 68.71 66.77 65.75 62.921984Q4 67.41 64.28 69.09 68.43 73.11 64.14 68.22 67.86 75.07 63.441985Q1 69.85 65.87 69.73 71.35 75.36 66.86 72.30 72.35 77.06 63.951985Q2 73.49 66.73 77.84 73.57 77.38 68.00 78.62 73.27 77.60 71.841985Q3 73.13 70.07 72.89 72.20 75.85 68.72 81.72 76.35 78.07 75.931985Q4 74.80 72.24 75.63 72.36 74.00 71.23 81.32 76.37 81.82 73.001986Q1 72.23 69.44 76.49 71.84 74.34 68.53 75.32 75.64 86.19 73.711986Q2 72.39 67.26 72.06 72.49 72.68 63.48 76.88 76.29 84.84 72.821986Q3 72.28 72.24 70.94 68.95 74.21 67.58 74.56 74.00 80.38 70.421986Q4 73.04 71.24 72.34 70.41 71.84 67.49 77.56 73.44 82.09 71.961987Q1 71.73 68.72 72.16 70.82 68.71 69.46 79.36 73.13 83.27 72.211987Q2 71.76 68.17 70.14 69.86 71.39 71.45 74.96 71.80 79.40 73.601987Q3 71.18 67.78 71.67 70.09 70.76 69.08 73.11 75.03 83.69 73.311987Q4 74.32 70.88 73.80 72.99 73.54 73.03 81.99 77.28 77.61 74.011988Q1 75.08 72.17 73.90 74.82 74.63 73.48 80.06 79.01 80.83 74.411988Q2 76.51 76.48 75.18 76.54 76.63 73.77 78.76 79.63 81.83 65.231988Q3 77.69 77.10 77.89 78.95 78.95 76.99 82.27 80.47 81.12 77.541988Q4 80.39 79.65 82.64 80.84 80.97 82.36 80.58 83.12 81.45 76.341989Q1 82.64 86.44 81.77 83.92 81.96 81.70 84.14 85.60 89.02 80.531989Q2 85.18 87.99 81.54 86.33 84.99 84.25 85.48 90.21 90.05 79.781989Q3 87.79 84.29 87.06 89.51 82.12 94.24 87.37 88.96 88.21 84.601989Q4 86.89 89.29 87.36 88.94 84.32 93.05 85.28 90.92 88.72 83.821990Q1 91.76 97.60 92.40 91.21 88.86 89.86 93.21 89.51 94.60 85.081990Q2 92.99 93.58 94.80 92.93 92.29 98.70 96.42 91.60 99.53 88.001990Q3 94.17 93.96 95.83 92.63 93.81 92.10 95.95 93.44 94.47 91.321990Q4 95.10 92.88 96.52 95.94 95.08 98.31 102.99 96.98 102.07 88.951991Q1 96.13 97.27 96.43 96.83 95.84 98.06 98.41 99.91 100.53 89.751991Q2 98.46 98.07 98.47 100.70 97.39 97.51 103.25 99.23 101.51 92.531991Q3 99.02 104.88 101.69 96.90 95.52 101.17 100.05 101.20 104.94 90.391991Q4 101.99 107.82 101.22 98.56 96.93 102.30 102.07 102.20 102.78 95.721992Q1 100.35 105.86 105.34 97.28 100.64 96.96 101.42 101.08 96.64 97.471992Q2 101.29 104.52 103.29 100.18 97.81 92.55 102.79 100.80 97.52 98.991992Q3 100.90 103.00 105.82 99.21 102.48 97.92 102.84 100.75 100.22 95.821992Q4 101.35 100.03 104.94 101.93 101.92 97.85 103.78 105.36 97.80 101.281993Q1 100.00 100.00 100.00 100.00 100.00 100.00 100.00 100.00 100.00 100.001993Q2 100.91 104.19 107.08 100.54 102.63 96.97 95.59 101.94 102.33 95.851993Q3 101.03 104.09 100.97 102.30 100.25 97.20 98.17 102.69 105.65 99.531993Q4 102.21 105.89 102.89 102.28 99.19 105.17 95.14 101.44 98.04 95.491994Q1 101.53 106.49 103.06 102.07 99.65 100.57 95.71 101.62 99.92 96.221994Q2 104.80 107.56 107.58 104.65 102.91 103.32 102.26 100.37 102.36 96.231994Q3 103.05 110.29 99.91 102.63 101.02 101.92 99.39 100.08 97.72 94.771994Q4 104.57 106.82 106.17 104.16 102.45 101.56 99.44 98.16 99.17 93.521995Q1 100.00 99.27 105.29 102.91 95.18 95.34 95.89 98.88 100.99 91.621995Q2 99.51 102.09 105.21 103.51 95.10 97.20 102.75 96.09 90.07 95.011995Q3 98.33 99.99 101.65 99.67 93.81 92.46 100.28 93.18 92.03 88.391995Q4 98.16 98.70 105.36 98.96 89.14 97.64 97.22 95.95 95.52 85.691996Q1 97.73 97.94 100.37 97.06 90.42 94.16 95.62 94.68 94.62 89.601996Q2 94.94 98.30 92.91 91.16 89.63 93.34 93.56 89.51 97.60 85.291996Q3 93.67 93.30 91.48 94.88 91.18 97.70 84.86 91.55 90.81 84.851996Q4 95.44 98.86 93.62 95.76 89.31 92.11 90.14 89.32 92.71 89.201997Q1 95.45 97.38 97.04 98.11 90.40 94.76 90.55 90.78 85.41 86.261997Q2 95.60 98.64 95.22 98.69 88.96 94.99 93.63 92.07 90.02 88.571997Q3 99.24 107.52 93.18 101.41 90.35 94.42 93.26 95.80 96.73 90.521997Q4 99.56 101.49 97.18 102.11 91.09 92.72 91.75 95.23 89.70 84.911998Q1 99.14 103.84 96.35 100.32 91.18 92.92 97.45 95.46 93.42 87.191998Q2 100.37 109.59 95.67 105.02 95.91 95.78 92.00 93.90 85.52 88.761998Q3 98.57 106.05 93.76 99.01 94.81 96.03 93.23 96.17 92.80 87.691998Q4 99.02 103.04 95.81 102.65 94.30 98.61 98.75 95.38 94.17 90.441999Q1 99.52 102.83 98.38 104.63 92.80 106.15 95.52 96.27 99.76 89.081999Q2 102.07 110.50 100.29 106.79 99.38 98.79 93.61 97.20 93.44 90.701999Q3 104.28 112.29 106.01 103.11 100.97 98.00 96.48 97.37 94.09 92.541999Q4 105.34 114.66 104.84 110.95 99.23 103.36 99.82 99.72 102.91 98.752000Q1 107.80 117.11 106.11 114.91 101.54 108.36 106.33 107.20 98.77 96.322000Q2 109.59 116.72 110.97 117.84 102.38 104.20 102.90 102.03 99.11 99.452000Q3 110.16 117.25 103.60 124.37 108.52 107.20 106.43 106.56 103.25 97.012000Q4 111.85 122.41 116.31 119.64 108.76 100.93 105.72 108.16 98.34 105.212001Q1 114.63 122.77 119.60 125.85 108.23 108.16 111.34 109.03 104.45 104.412001Q2 121.97 134.66 115.80 135.03 114.57 116.57 111.28 115.85 107.37 110.452001Q3 124.92 136.86 124.14 137.71 120.13 125.31 111.12 120.46 106.65 112.11
Q1 0.996 0.996 1.000 1.000 0.993 1.000 1.001 1.003 1.008 0.998Q2 1.002 1.002 1.006 1.006 1.006 0.992 1.002 0.994 0.997 0.998Q3 0.998 1.002 0.994 0.994 1.004 0.999 0.993 1.000 1.000 1.001Q4 1.004 1.000 1.000 1.000 0.997 1.009 1.004 1.003 0.995 1.002
Growth over 70 Quarters 111.05% 143.79% 128.47% 128.47% 96.16% 105.61% 101.09% 104.59% 75.04% 77.36%
Ave Annual Growth 4.36% 5.22% 4.83% 4.83% 3.93% 4.20% 4.07% 4.18% 3.25% 3.33%
No of Obs 70979 16171 10867 13663 8079 3340 3101 8109 4092 57 3491
R Squared 0.504 0.503 0.598 0.789 0.745 0.833 0.741 0.754 0.698 0.707
Seasonal Factors

Calculating stratified residential property price indices to test for differences in trend, seasonality and cycle Page 14 Appendix 5 - Adelaide Metropolitan Price Index – 4 roomed Home Units
Period Metro Region 1 Region 2 Region 3 Region 4 Region 5 Region 6 Region 7 Region 8 Region 9 Region 101984Q1 59.45 55.59 57.08 62.19 53.13 60.57 64.69 56.09 65.90 64.171984Q2 62.11 59.32 60.51 60.38 58.67 57.85 67.68 63.42 67.85 61.981984Q3 66.25 59.85 64.80 67.08 64.65 65.85 76.04 66.87 76.57 62.381984Q4 69.33 64.61 68.10 69.63 70.29 66.41 74.91 68.77 82.97 61.591985Q1 70.12 65.11 66.10 72.75 71.67 70.59 71.66 70.81 79.54 63.771985Q2 74.11 68.17 73.48 73.28 73.68 70.33 81.41 72.38 84.08 72.441985Q3 72.50 65.76 68.53 74.78 72.97 71.30 84.41 74.83 77.78 78.871985Q4 74.07 68.03 71.27 74.00 71.19 69.44 83.84 78.70 82.85 74.591986Q1 72.55 69.12 75.04 75.18 70.30 66.47 82.53 76.47 88.36 75.051986Q2 72.19 66.34 72.14 74.10 70.26 65.34 78.55 73.03 85.64 71.381986Q3 70.21 67.74 70.33 68.29 70.04 66.84 78.28 73.74 81.32 71.261986Q4 71.67 69.50 72.23 71.64 69.22 65.57 79.20 71.70 87.36 72.411987Q1 71.81 66.97 73.68 73.15 64.81 67.96 85.52 73.80 84.75 73.161987Q2 71.63 68.04 69.90 71.92 67.42 69.90 79.69 71.95 83.91 72.031987Q3 71.69 69.26 71.97 69.47 66.26 67.58 75.46 75.80 85.19 75.451987Q4 73.96 69.21 72.08 73.07 70.70 71.60 80.79 76.86 84.38 74.601988Q1 74.89 72.34 70.32 75.80 70.56 71.50 83.03 76.96 85.71 77.491988Q2 74.70 73.65 74.60 73.86 73.14 72.68 79.01 78.52 85.04 61.531988Q3 77.95 77.56 78.48 80.46 73.95 73.90 85.58 81.82 80.99 76.611988Q4 81.08 83.41 81.95 81.75 77.02 82.27 89.10 81.55 86.28 76.721989Q1 82.26 83.45 78.60 83.52 78.78 79.52 88.39 83.89 91.74 80.871989Q2 84.20 84.97 79.17 86.45 81.96 85.61 86.97 87.97 95.52 81.451989Q3 88.50 86.94 88.30 90.33 81.69 87.62 93.46 88.19 94.79 86.281989Q4 89.88 93.74 88.53 91.97 80.40 88.60 87.40 92.43 95.15 86.001990Q1 90.65 94.29 89.22 92.11 84.17 88.38 97.48 88.28 98.69 88.421990Q2 91.80 94.18 93.63 91.01 86.56 91.90 98.60 93.72 100.48 85.191990Q3 94.38 96.44 96.80 94.57 89.07 94.41 102.46 96.53 96.50 96.481990Q4 93.89 94.45 95.28 94.23 91.79 99.05 109.44 95.85 104.24 87.941991Q1 96.16 95.20 95.35 97.38 93.00 94.78 103.79 100.62 105.82 90.811991Q2 98.52 97.56 99.03 102.01 94.98 99.47 102.12 99.94 108.48 92.201991Q3 96.41 100.14 101.72 97.18 91.79 96.78 101.95 100.63 109.89 94.061991Q4 100.08 103.20 102.41 102.68 94.99 106.78 108.47 99.25 105.96 98.181992Q1 99.59 103.57 104.79 97.61 96.27 97.53 104.72 100.47 103.15 100.851992Q2 100.39 106.98 102.94 100.42 93.91 95.22 102.68 100.11 100.18 101.531992Q3 100.07 101.07 104.12 101.00 96.62 98.16 106.08 101.06 98.51 97.191992Q4 100.84 98.87 104.65 102.13 96.56 102.41 105.57 103.89 101.65 102.611993Q1 100.00 100.00 100.00 100.00 100.00 100.00 100.00 100.00 100.00 100.001993Q2 101.29 100.99 106.64 102.63 98.05 101.61 101.69 101.36 104.63 97.261993Q3 100.55 103.45 103.11 102.29 95.57 96.62 100.50 101.49 105.30 100.891993Q4 100.47 102.35 103.77 103.51 95.24 100.04 97.70 101.55 102.27 97.791994Q1 99.65 100.99 103.14 104.37 94.68 100.43 104.12 100.17 100.14 95.961994Q2 101.70 104.08 103.53 104.90 96.35 100.93 105.94 99.99 103.80 97.581994Q3 101.32 106.08 99.48 102.56 98.57 102.28 108.73 99.78 99.76 95.381994Q4 100.71 100.60 103.96 104.19 99.39 98.32 106.97 96.28 100.78 96.541995Q1 98.36 98.57 102.60 100.44 91.21 97.59 99.92 98.30 104.19 95.291995Q2 98.80 102.36 106.65 105.89 91.61 94.28 104.15 92.10 97.77 95.971995Q3 95.78 96.92 98.33 100.84 88.86 89.88 106.42 93.42 102.34 89.331995Q4 95.27 91.61 107.52 101.93 85.76 97.25 96.69 92.26 99.04 85.291996Q1 95.46 92.62 101.86 98.63 83.68 94.79 97.71 91.89 95.84 94.791996Q2 92.53 92.46 95.46 91.41 84.57 91.45 96.33 90.66 101.97 86.361996Q3 91.34 94.46 87.47 95.15 87.34 96.52 91.25 86.21 94.64 88.731996Q4 94.32 94.13 93.67 93.18 86.11 89.12 100.86 89.67 98.08 83.831997Q1 93.79 93.40 92.62 97.04 87.89 92.66 96.46 88.96 92.94 83.781997Q2 94.70 95.11 94.69 97.43 86.12 94.63 98.25 92.47 94.13 88.731997Q3 94.84 98.82 90.86 98.50 86.72 95.88 98.77 95.48 103.74 89.431997Q4 96.02 98.64 96.24 100.57 84.58 95.80 98.99 95.68 93.33 84.631998Q1 96.44 95.54 93.43 100.31 88.79 91.64 107.39 95.83 91.39 90.951998Q2 95.51 98.03 96.63 101.40 88.17 92.06 88.36 93.93 89.34 88.661998Q3 94.60 96.92 90.37 100.67 90.01 88.48 98.45 94.54 91.79 88.871998Q4 97.35 99.25 95.01 103.02 88.14 96.69 107.96 97.20 94.43 92.041999Q1 96.40 101.04 93.72 103.90 86.73 101.08 94.64 95.93 98.80 87.721999Q2 101.08 104.23 98.20 106.74 93.85 103.18 93.62 98.41 95.11 90.161999Q3 102.60 107.65 103.22 105.12 93.99 99.47 96.86 99.58 95.18 94.561999Q4 103.35 108.16 104.85 112.37 93.08 100.66 101.03 101.81 101.55 101.932000Q1 106.26 111.98 107.40 115.12 97.93 107.66 106.80 102.36 101.85 95.772000Q2 107.62 113.61 107.30 119.63 97.03 103.28 111.98 101.70 102.27 97.112000Q3 107.96 114.22 98.39 126.42 101.22 103.68 116.57 104.35 101.95 96.032000Q4 110.12 114.97 110.42 120.70 101.46 98.75 106.57 107.07 99.59 107.622001Q1 113.02 114.90 117.15 123.69 103.89 107.20 114.68 111.37 107.27 106.032001Q2 118.59 128.86 113.40 134.08 109.85 113.25 118.71 116.75 108.55 110.592001Q3 123.24 129.09 120.45 141.44 112.27 125.82 116.85 118.26 112.83 113.41
Q1 0.998 0.993 0.998 1.000 0.996 0.999 1.003 0.999 1.003 1.004Q2 1.003 1.003 1.006 1.001 1.004 1.000 0.986 0.995 1.005 0.985Q3 0.995 1.003 0.985 0.995 1.003 0.993 1.003 1.002 0.992 1.009Q4 1.004 1.000 1.011 1.003 0.998 1.009 1.008 1.004 1.000 1.002Growth over 70 Quarters 107.29% 132.21% 111.04% 127.44% 111.30% 107.72% 80.62% 110.84% 71.21% 76.74%Ave Annual Growth 4.25% 4.93% 4.36% 4.81% 4.37% 4.27% 3.44% 4.35% 3.12% 3.31%No of Obs 39257 7467 6451 7557 5455 2007 1540 4317 2156 28 2270R Squared 0.584 0.716 0.507 0.755 0.726 0.779 0.684 0.708 0.659 0.674
Seasonal Factors

Calculating stratified residential property price indices to test for differences in trend, seasonality and cycle Page 15 Appendix 6 - Adelaide Metropolitan Price Index – Home Units Less than 4 rooms
Period Metro Region 1 Region 2 Region 3 Region 4 Region 5 Region 6 Region 7 Region 8 Region 9 Region 101984Q1 59.88 53.57 69.26 63.14 72.68 57.21 62.00 59.781984Q2 65.93 55.98 70.44 71.93 72.74 66.12 67.18 66.02 74.391984Q3 66.80 62.05 71.66 70.99 75.36 61.73 72.60 70.36 65.31 63.591984Q4 69.14 68.05 74.64 67.12 82.99 67.75 64.52 67.77 75.11 69.331985Q1 71.73 68.44 77.97 72.79 92.23 96.59 66.29 73.74 79.31 70.231985Q2 75.74 68.14 88.63 70.86 92.83 60.96 81.68 74.93 73.96 76.811985Q3 73.88 71.43 83.28 74.85 87.43 75.77 78.52 77.03 78.73 73.841985Q4 74.24 71.67 77.95 73.35 81.47 54.93 83.92 75.23 81.28 65.421986Q1 74.60 70.08 78.41 71.30 91.41 66.49 82.95 77.60 83.41 74.631986Q2 72.31 72.69 71.80 71.34 81.60 63.88 69.17 78.55 84.43 83.591986Q3 71.24 67.96 72.31 67.53 85.22 62.54 72.73 72.03 83.79 71.581986Q4 70.43 72.97 73.73 64.11 78.83 65.24 73.75 73.11 83.36 70.681987Q1 70.02 68.68 70.49 68.33 78.00 64.41 74.20 71.53 84.44 75.161987Q2 70.16 68.23 74.86 67.00 79.37 69.91 74.30 70.81 78.42 75.381987Q3 68.08 67.57 73.09 64.25 75.66 73.56 67.96 70.18 79.13 71.851987Q4 73.32 71.42 74.82 70.09 77.62 72.11 79.68 76.47 78.87 81.281988Q1 74.87 69.83 81.56 71.61 86.05 70.31 68.48 80.29 84.10 74.191988Q2 73.64 72.11 76.93 70.45 84.62 79.52 74.01 80.05 80.77 76.731988Q3 77.26 77.72 79.97 75.46 97.16 81.24 72.70 79.21 85.21 82.581988Q4 78.47 77.03 82.23 76.72 90.35 73.15 73.05 82.72 77.89 79.161989Q1 79.52 80.90 81.44 77.03 91.56 80.10 78.37 86.02 86.34 81.031989Q2 81.68 88.10 82.04 81.95 90.04 80.15 81.47 91.00 84.47 81.831989Q3 83.86 84.35 87.16 79.81 90.76 84.14 81.95 87.36 85.25 81.721989Q4 84.73 89.08 85.61 83.99 97.32 96.09 80.29 85.08 78.90 87.591990Q1 88.78 90.53 103.34 84.43 91.87 82.23 86.53 89.43 90.08 89.751990Q2 88.04 88.79 97.88 87.84 99.31 89.64 90.34 88.64 91.64 97.891990Q3 88.95 92.00 91.16 94.83 112.19 95.14 93.40 87.96 86.91 94.891990Q4 95.93 98.38 103.54 98.44 107.39 88.80 99.56 96.92 98.14 95.201991Q1 92.02 97.05 99.27 94.24 93.72 97.54 90.25 98.06 92.35 89.711991Q2 100.04 110.57 102.27 93.22 100.86 95.01 96.19 95.70 92.77 98.301991Q3 105.34 128.20 98.63 92.69 104.36 89.43 94.56 99.54 104.24 94.391991Q4 108.68 127.26 97.25 88.62 104.10 91.05 89.10 103.09 99.68 105.671992Q1 99.09 111.72 101.89 93.39 109.43 94.24 99.17 101.25 87.90 94.321992Q2 104.80 113.66 100.13 98.51 101.63 73.19 102.75 99.13 85.08 96.101992Q3 103.41 115.84 104.85 97.95 117.92 102.47 94.82 98.87 105.17 97.621992Q4 99.95 106.55 97.32 92.01 118.44 112.92 94.78 99.10 94.90 94.661993Q1 100.00 100.00 100.00 100.00 100.00 100.00 100.00 100.00 100.00 100.001993Q2 101.13 111.94 99.40 91.99 118.33 106.74 88.86 99.19 94.71 100.801993Q3 98.61 104.54 94.79 96.92 105.24 88.95 86.75 100.06 91.72 96.841993Q4 99.76 106.66 99.58 100.63 101.58 107.00 90.03 94.29 92.63 97.531994Q1 97.99 110.01 104.58 98.58 109.22 93.86 85.09 100.98 94.92 93.821994Q2 103.41 104.43 113.61 97.86 113.87 95.09 98.91 100.26 90.03 92.451994Q3 99.64 102.99 98.43 97.46 99.21 117.53 100.47 97.25 93.89 93.431994Q4 104.50 105.28 105.83 97.48 104.87 83.73 105.37 96.72 91.81 101.771995Q1 99.30 99.19 96.16 101.54 104.13 90.83 101.20 93.01 94.97 96.271995Q2 97.06 100.58 92.02 96.09 107.27 90.84 98.27 91.83 76.28 97.731995Q3 90.66 95.47 98.23 95.54 110.31 61.66 86.13 88.99 70.75 93.801995Q4 92.02 98.62 91.13 91.15 104.48 110.31 102.11 94.58 79.71 98.671996Q1 90.54 95.33 87.19 92.36 103.37 82.82 90.03 92.51 81.95 93.111996Q2 84.76 90.10 89.04 91.74 100.09 100.75 91.08 87.54 91.85 94.281996Q3 86.94 87.24 89.34 90.25 103.77 84.82 80.90 87.06 84.73 75.031996Q4 85.53 89.60 80.86 92.29 96.64 86.71 78.69 85.60 81.42 92.531997Q1 88.37 93.01 92.58 89.68 90.87 78.42 83.00 85.46 65.43 89.411997Q2 89.23 97.40 87.53 90.61 91.97 77.35 87.32 88.19 78.10 86.661997Q3 94.75 101.99 88.69 95.06 95.84 83.72 78.84 90.39 76.60 88.331997Q4 90.17 89.80 92.47 94.08 99.88 94.99 86.84 89.01 68.41 90.981998Q1 90.53 97.09 88.95 86.05 92.41 74.84 88.28 87.43 89.78 84.231998Q2 91.90 106.50 91.18 92.55 119.15 82.71 79.22 88.70 67.55 94.681998Q3 90.53 97.46 86.43 88.66 78.88 79.05 79.01 92.47 78.67 87.401998Q4 89.26 100.04 84.50 93.34 100.94 83.73 89.13 87.64 84.44 92.671999Q1 98.61 102.61 95.78 96.58 106.28 95.92 99.95 90.73 92.38 92.961999Q2 93.72 106.53 90.23 95.14 103.94 95.14 86.66 90.94 80.64 87.071999Q3 98.91 107.90 96.53 96.93 100.78 95.75 87.95 94.81 84.95 91.061999Q4 98.30 110.69 95.62 97.27 112.48 98.16 92.15 95.97 91.75 101.062000Q1 100.69 108.86 92.61 110.68 100.08 101.94 94.44 105.71 80.89 97.462000Q2 97.16 104.87 97.18 107.81 107.64 110.97 89.79 97.09 85.50 96.652000Q3 104.29 118.27 106.94 110.75 119.51 102.03 92.33 99.15 92.26 100.422000Q4 101.04 114.15 100.91 116.07 119.21 96.40 98.54 78.20 96.662001Q1 105.39 118.92 108.00 116.41 116.64 106.95 99.20 87.10 110.242001Q2 116.14 135.12 108.36 129.66 118.69 96.96 104.17 93.30 111.602001Q3 120.52 139.16 126.20 135.59 136.58 99.39 115.42 91.20 118.10
Q1 0.999 0.986 1.009 1.005 0.986 1.002 1.009 1.019 0.994Q2 0.999 1.005 1.005 0.998 1.011 1.006 1.000 0.979 1.016Q3 1.001 1.005 0.998 0.999 1.001 0.980 0.993 1.010 0.979Q4 1.002 1.004 0.989 0.998 1.003 1.012 0.997 0.992 1.011Growth over 70 Quarters 101.25% 159.75% 82.20% 114.75% 87.94% 47.93% 86.16% 52.56% 85.72%
Ave Annual Growth 4.08% 5.61% 3.49% 4.46% 3.67% 2.30% 3.61% 2.44% 3.71%No of Obs 14601 3999 2470 2231 1000 325 959 2141 903 80 561
R Squared 0.509 0.684 0.439 0.824 0.591 0.631 0.623 0.581 0.818
Seasonal Factors

Calculating stratified residential property price indices to test for differences in trend, seasonality and cycle Page 16 Appendix 7- Adelaide Metropolitan Price Index – Home Units - More than 4 rooms
Period Metro Region 1 Region 2 Region 3 Region 4 Region 5 Region 6 Region 7 Region 8 Region 9 Region 101984Q1 60.20 47.26 60.04 53.39 63.77 58.22 60.57 61.381984Q2 61.62 47.18 65.75 57.53 54.89 72.02 62.05 61.91 58.65 63.311984Q3 60.69 49.79 57.64 60.23 62.23 63.39 53.15 53.50 61.42 70.441984Q4 66.47 57.61 58.05 64.66 70.70 66.64 56.54 55.57 69.14 60.451985Q1 72.73 65.33 69.20 66.77 71.54 63.52 63.98 59.50 69.46 61.301985Q2 72.67 65.25 73.21 71.79 72.63 63.49 63.04 67.69 72.71 62.401985Q3 73.45 68.48 74.03 65.36 73.10 75.01 69.20 71.37 72.83 64.331985Q4 74.75 69.71 82.51 66.09 75.58 66.16 66.89 69.94 76.43 69.361986Q1 73.31 65.06 79.30 66.06 71.82 72.31 66.22 67.67 74.09 71.391986Q2 72.41 61.78 75.14 68.31 71.01 65.19 65.37 73.97 67.12 80.391986Q3 75.06 67.59 73.94 69.39 73.78 71.95 65.57 72.56 68.36 65.451986Q4 75.22 67.93 71.17 68.79 71.71 78.17 68.75 73.45 69.59 72.391987Q1 73.39 68.04 72.15 66.88 69.27 72.35 67.81 67.86 79.30 67.461987Q2 74.14 69.10 66.61 68.11 70.03 78.82 59.71 74.30 69.54 79.731987Q3 75.13 65.29 72.82 72.05 72.14 73.83 66.40 72.50 71.381987Q4 73.31 63.29 78.95 71.29 73.83 81.24 82.49 75.07 60.83 69.041988Q1 79.57 77.44 74.95 73.14 75.18 80.73 78.59 74.30 70.91 70.071988Q2 84.56 79.34 80.70 85.83 76.97 86.22 76.07 82.13 70.93 74.011988Q3 83.84 79.05 72.42 78.32 79.98 97.39 71.77 68.39 71.17 76.551988Q4 85.50 77.62 84.61 82.23 82.78 96.85 72.04 83.57 74.67 78.741989Q1 91.12 89.27 86.53 84.83 83.43 90.89 75.79 85.55 80.18 77.421989Q2 94.42 90.37 90.33 86.90 87.01 94.28 71.21 92.09 84.46 70.371989Q3 91.41 83.40 81.47 90.52 81.02 113.12 63.86 84.72 78.21 80.631989Q4 95.99 100.42 93.11 83.88 81.06 120.67 61.34 98.00 90.53 73.341990Q1 96.58 96.55 86.09 90.30 94.00 102.85 85.41 94.80 90.97 72.061990Q2 100.50 94.77 91.80 96.80 96.13 107.04 86.50 91.82 91.12 91.211990Q3 98.18 102.47 101.96 91.07 96.36 107.56 76.06 95.13 94.70 78.821990Q4 99.02 93.34 97.19 95.48 90.19 106.50 84.78 103.04 97.52 91.201991Q1 100.49 99.30 105.33 94.24 98.39 105.26 90.51 105.33 90.52 86.731991Q2 99.24 95.11 96.09 102.93 96.87 103.83 129.46 95.31 95.60 90.841991Q3 99.78 93.31 106.80 96.69 95.87 110.97 94.26 103.05 92.00 80.021991Q4 100.89 103.37 102.50 97.94 95.92 105.56 92.46 107.62 94.07 88.471992Q1 101.29 99.31 113.97 97.08 100.99 109.55 89.91 101.92 89.30 93.641992Q2 100.95 97.92 109.50 100.30 101.50 96.70 92.35 100.07 101.08 95.361992Q3 100.54 98.91 104.76 95.01 107.99 109.19 90.30 103.81 97.29 92.121992Q4 104.66 92.85 102.43 106.04 104.79 98.46 93.60 113.51 91.81 84.851993Q1 100.00 100.00 100.00 100.00 100.00 100.00 100.00 100.00 100.00 100.001993Q2 100.22 94.72 109.81 99.22 100.29 104.44 94.84 103.18 95.39 92.531993Q3 102.55 95.03 106.13 101.46 102.57 106.79 95.42 105.88 114.98 97.981993Q4 102.90 100.38 107.14 99.77 103.32 118.58 93.81 105.31 93.46 89.201994Q1 103.06 96.15 110.39 99.91 101.02 109.67 84.82 102.75 99.18 95.091994Q2 108.40 103.39 106.64 105.73 106.03 107.44 87.36 100.57 102.06 98.051994Q3 105.36 108.26 104.40 104.22 102.19 110.39 88.90 98.41 94.86 94.451994Q4 104.91 99.72 114.73 104.63 103.01 106.87 79.69 103.89 101.01 81.161995Q1 101.05 99.16 120.76 104.56 95.05 98.66 85.76 104.09 101.56 83.841995Q2 99.37 95.79 112.91 101.43 99.04 100.85 92.32 107.31 92.47 90.601995Q3 100.78 95.38 112.28 100.14 97.09 99.83 88.47 100.20 94.58 86.531995Q4 96.20 95.76 109.35 95.57 91.08 99.36 86.20 101.89 101.22 81.941996Q1 97.72 96.23 109.91 95.11 98.05 97.16 91.88 96.46 100.22 75.731996Q2 97.50 94.78 107.69 91.09 96.19 101.64 84.53 90.66 99.83 79.911996Q3 95.60 95.15 102.66 93.71 94.09 101.39 78.61 102.52 93.34 81.411996Q4 97.59 96.23 111.22 101.30 84.74 99.61 76.04 92.80 92.94 97.861997Q1 99.24 93.06 107.93 102.78 94.19 95.40 80.37 97.54 90.68 87.721997Q2 101.21 96.60 116.11 104.31 89.22 104.45 82.98 94.12 90.82 90.041997Q3 107.49 105.36 109.72 107.85 90.87 97.88 85.97 103.36 90.04 95.601997Q4 108.38 110.88 111.14 105.32 98.33 95.14 77.16 102.83 98.61 77.491998Q1 103.81 100.71 106.70 104.88 93.75 103.36 85.63 102.80 98.83 80.001998Q2 108.26 104.50 102.21 117.70 99.69 107.18 99.09 99.56 94.41 107.621998Q3 105.75 99.96 110.93 103.12 103.89 112.32 92.71 102.17 105.35 81.081998Q4 106.92 103.27 117.13 105.89 103.08 111.23 83.67 102.46 97.65 80.841999Q1 107.40 102.30 121.30 109.63 100.53 122.09 93.48 101.11 104.98 95.131999Q2 107.36 106.17 113.84 113.27 108.47 104.17 108.21 97.53 99.03 93.771999Q3 106.04 107.83 123.60 104.08 109.41 110.63 102.72 98.87 99.39 91.091999Q4 111.63 114.29 111.42 115.70 103.75 119.32 106.84 95.92 114.08 89.872000Q1 116.54 114.26 115.05 117.46 106.43 117.31 101.94 120.58 108.31 97.502000Q2 119.96 118.40 130.60 122.85 107.08 119.38 92.29 113.05 99.91 112.012000Q3 119.48 110.37 122.87 128.41 120.58 126.17 75.91 120.40 112.73 102.172000Q4 121.52 118.54 134.61 117.31 116.19 114.64 118.21 123.19 115.11 100.332001Q1 126.19 130.24 134.87 137.53 116.54 108.15 96.89 118.37 114.99 96.672001Q2 132.42 123.57 138.67 144.41 117.92 133.06 112.59 131.23 113.13 108.922001Q3 130.49 134.54 141.02 132.99 134.64 131.56 104.77 125.68 109.26 102.97
Q1 1.000 1.009 1.008 0.994 0.996 0.982 1.010 0.996 1.034 0.983Q2 1.005 0.997 0.998 1.024 1.004 0.981 1.031 0.995 1.011 1.049Q3 0.996 0.993 0.985 0.991 1.010 1.025 0.971 0.993 0.933 0.991Q4 0.999 1.002 1.009 0.990 0.990 1.012 0.988 1.016 1.022 0.976
Growth over 70 Quarters 116.76% 184.68% 134.88% 149.06% 111.12% 107.12% 79.94% 107.49% 78.01% 67.98%Ave Annual Growth 4.52% 6.16% 5.00% 5.35% 4.36% 4.51% 3.41% 4.26% 3.40% 3.19%
No of Obs 16186 4264 1737 3800 1611 985 562 1575 968 24 651
R Squared 0.625 0.655 0.729 0.742 0.716 0.793 0.845 0.686 0.709 0.999 0.700
Seasonal Factors

Calculating stratified residential property price indices to test for differences in trend, seasonality and cycle Page 17 Appendix 8 - Various Adelaide Metropolitan House Price Indices
PeriodConstant
Quality HedonicMedian Mean
ABS Existing House Prices
1984Q1 49.48 46.70 46.241984Q2 54.71 52.48 50.271984Q3 58.70 54.48 53.241984Q4 61.68 58.00 56.861985Q1 64.39 62.61 61.791985Q2 67.69 64.35 64.081985Q3 68.86 64.35 64.581985Q4 69.62 65.22 65.341986Q1 69.14 65.65 67.411986Q2 68.79 64.35 66.60 75.521986Q3 68.61 63.48 66.17 74.431986Q4 69.53 66.07 68.39 75.071987Q1 69.46 64.35 66.57 75.431987Q2 69.35 65.22 67.90 74.611987Q3 70.01 65.22 68.27 75.701987Q4 71.89 66.09 69.42 76.881988Q1 73.84 68.70 73.03 77.881988Q2 75.08 69.57 74.24 78.881988Q3 77.38 71.30 75.91 79.691988Q4 80.11 73.91 79.67 83.501989Q1 84.75 78.26 85.39 83.861989Q2 86.62 80.43 87.28 84.041989Q3 87.89 81.74 89.21 88.031989Q4 88.61 82.61 89.81 91.661990Q1 91.16 85.22 91.79 90.391990Q2 93.71 86.96 93.20 92.381990Q3 92.97 86.96 93.10 93.741990Q4 94.46 88.70 94.11 95.011991Q1 94.59 91.30 95.06 100.361991Q2 96.81 93.04 95.75 96.011991Q3 98.21 92.61 98.67 94.741991Q4 97.97 95.65 98.11 95.921992Q1 98.12 95.65 97.54 98.551992Q2 98.02 95.65 97.38 97.101992Q3 98.38 94.78 96.26 97.551992Q4 99.77 97.39 96.13 96.281993Q1 100.00 100.00 100.00 100.001993Q2 99.98 99.13 99.51 105.531993Q3 98.86 95.91 97.30 98.101993Q4 99.99 100.00 100.85 97.551994Q1 100.35 100.87 102.28 99.551994Q2 100.90 101.74 103.59 100.271994Q3 100.23 100.00 100.91 102.721994Q4 100.06 100.00 102.17 100.451995Q1 98.92 100.00 103.77 101.181995Q2 97.19 100.00 101.03 100.821995Q3 95.86 97.39 99.38 99.731995Q4 95.77 95.65 99.51 97.461996Q1 95.27 95.65 100.97 97.641996Q2 95.62 97.93 101.42 97.821996Q3 94.78 95.65 99.08 97.731996Q4 96.41 97.83 102.14 96.741997Q1 97.77 100.00 103.40 99.091997Q2 98.52 102.17 105.81 98.821997Q3 97.37 99.13 102.28 99.551997Q4 99.09 102.61 108.08 100.451998Q1 100.75 104.35 110.68 103.351998Q2 101.52 106.09 111.11 103.081998Q3 101.63 104.35 110.43 102.541998Q4 102.96 107.22 111.25 102.451999Q1 104.72 108.70 115.82 103.081999Q2 108.39 113.04 118.43 105.621999Q3 108.85 112.17 118.78 108.881999Q4 112.94 115.65 123.42 110.612000Q1 116.23 119.48 129.06 112.062000Q2 118.61 123.48 131.75 115.052000Q3 114.85 114.78 121.31 115.682000Q4 119.79 121.74 127.78 115.322001Q1 123.22 126.09 133.50 120.672001Q2 127.28 131.30 137.27 123.752001Q3 130.79 134.78 142.88
Q1 1.002 1.006 1.010 0.967Q2 1.004 1.010 1.007 1.060Q3 0.994 0.985 0.986 1.024Q4 1.000 0.998 0.996 0.948Growth over 70 Quarters 164.35% 188.64% 208.98% N/AAve Annual Growth 5.71% 6.24% 6.66% 3.35%
Seasonal Factors