Switching On the Growth Engine in Your Small Consulting Practice
date post
22-Dec-2015Category
view
226download
0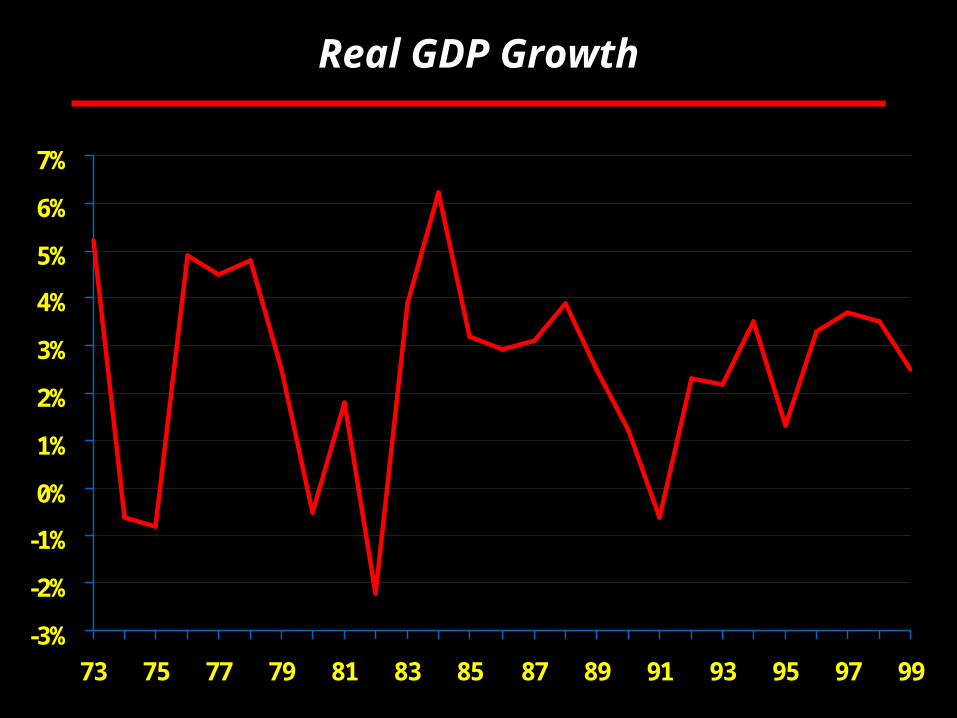
Rosen Consulting Group
Real GDP Growth
-3%
-2%
-1%
0%
1%
2%
3%
4%
5%
6%
7%
73 75 77 79 81 83 85 87 89 91 93 95 97 99
Rosen Consulting Group
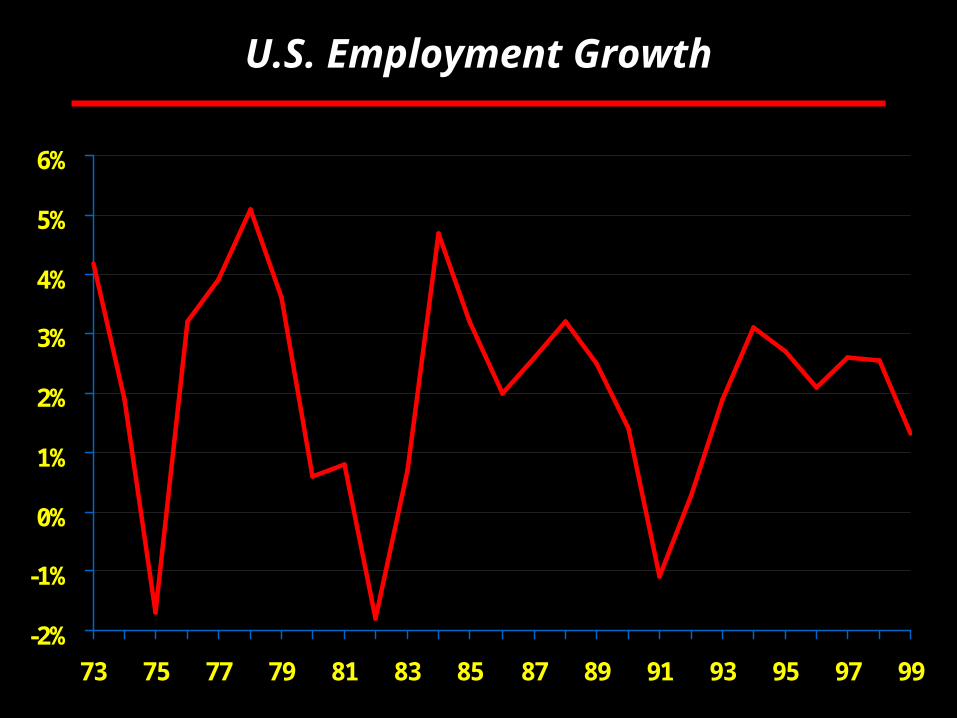
U.S. Employment Growth
-2%
-1%
0%
1%
2%
3%
4%
5%
6%
73 75 77 79 81 83 85 87 89 91 93 95 97 99
Rosen Consulting Group
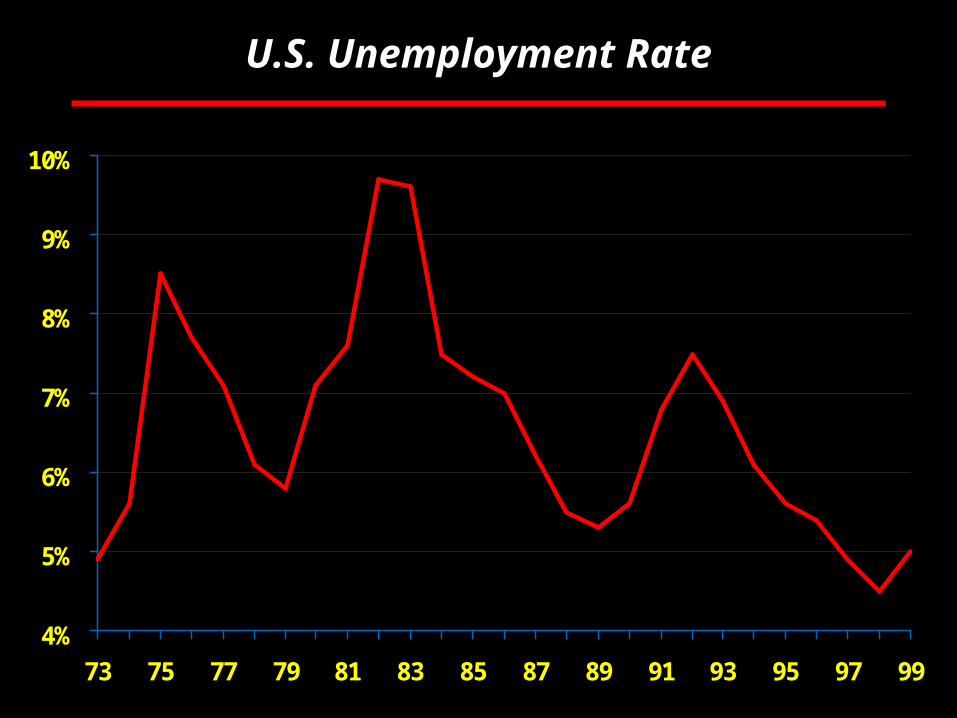
U.S. Unemployment Rate
4%
5%
6%
7%
8%
9%
10%
73 75 77 79 81 83 85 87 89 91 93 95 97 99
Rosen Consulting Group
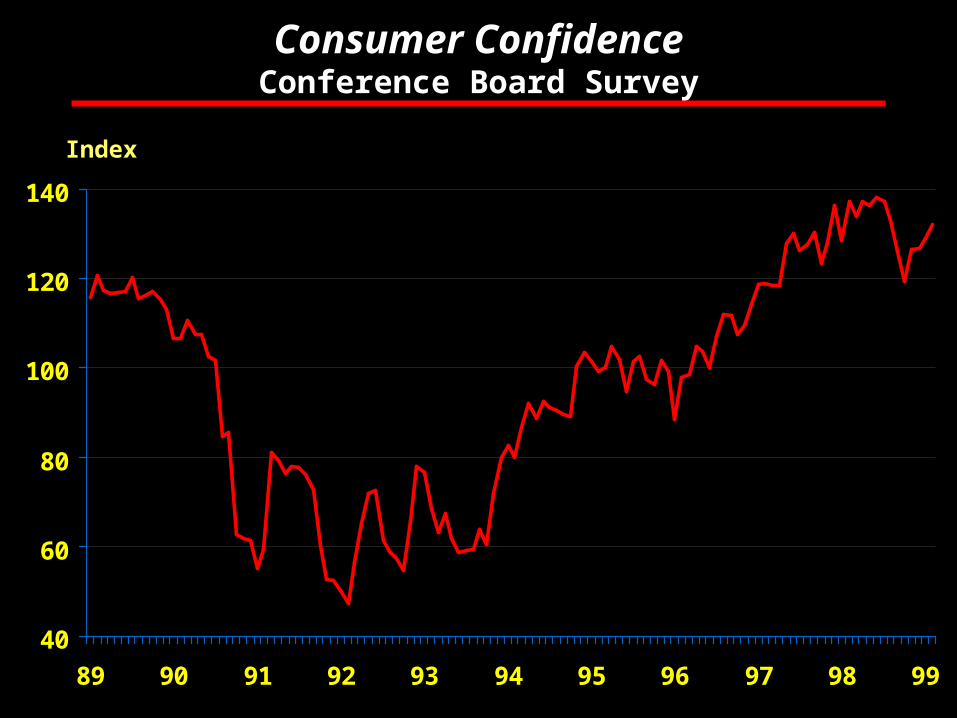
Consumer ConfidenceConference Board Survey
40
60
80
100
120
140
89 90 91 92 93 94 95 96 97 98 99
Index

Rosen Consulting Group
U.S. Merchandise Exports to East Asia plus Japan
11,000
11,500
12,000
12,500
13,000
13,500
14,000
14,500
15,000
15,500
1995 1996 1997 1998
3-Month Moving Average
$Million per Month
Rosen Consulting Group
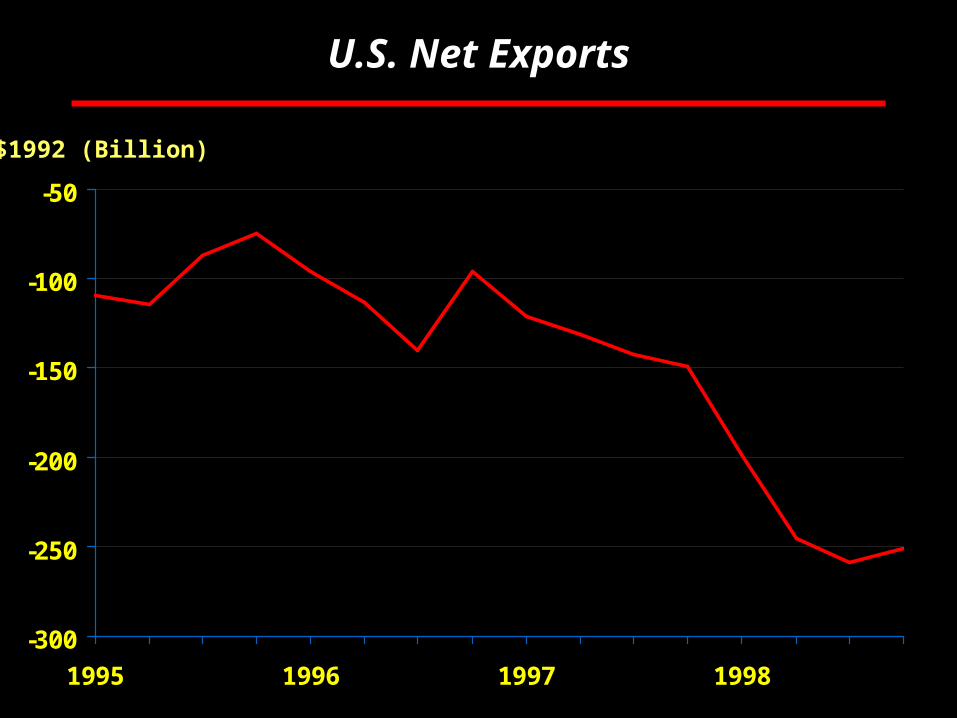
U.S. Net Exports
-300
-250
-200
-150
-100
-50
1995 1996 1997 1998
$1992 (Billion)
Rosen Consulting Group
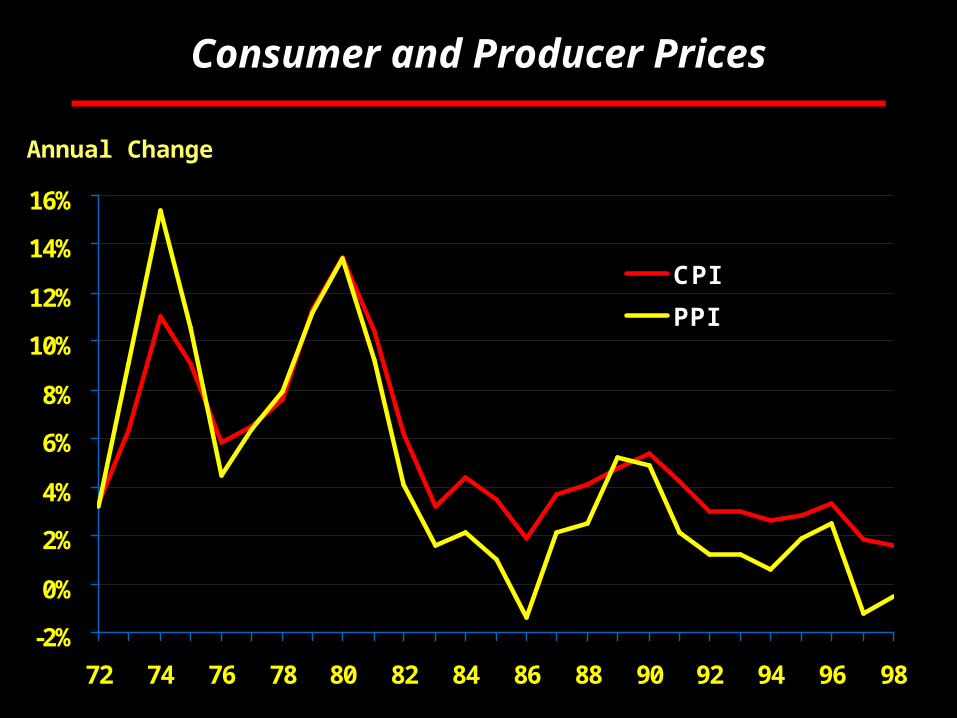
Consumer and Producer Prices
-2%
0%
2%
4%
6%
8%
10%
12%
14%
16%
72 74 76 78 80 82 84 86 88 90 92 94 96 98
CPI
PPI
Annual Change

Rosen Consulting Group
3-Month T-Bill vs. 10-Year T-Bond
0%
2%
4%
6%
8%
10%
12%
14%
16%
18%
80 81 82 83 84 85 86 87 88 89 90 91 92 93 94 95 96 97 98 99
3-Month
10-Year

Rosen Consulting Group
U.S. Employment Growth
Growth Rate
less than 0%
0% to 1.3%
1.5% to 2.4%
2.5% and above
Rosen Consulting Group
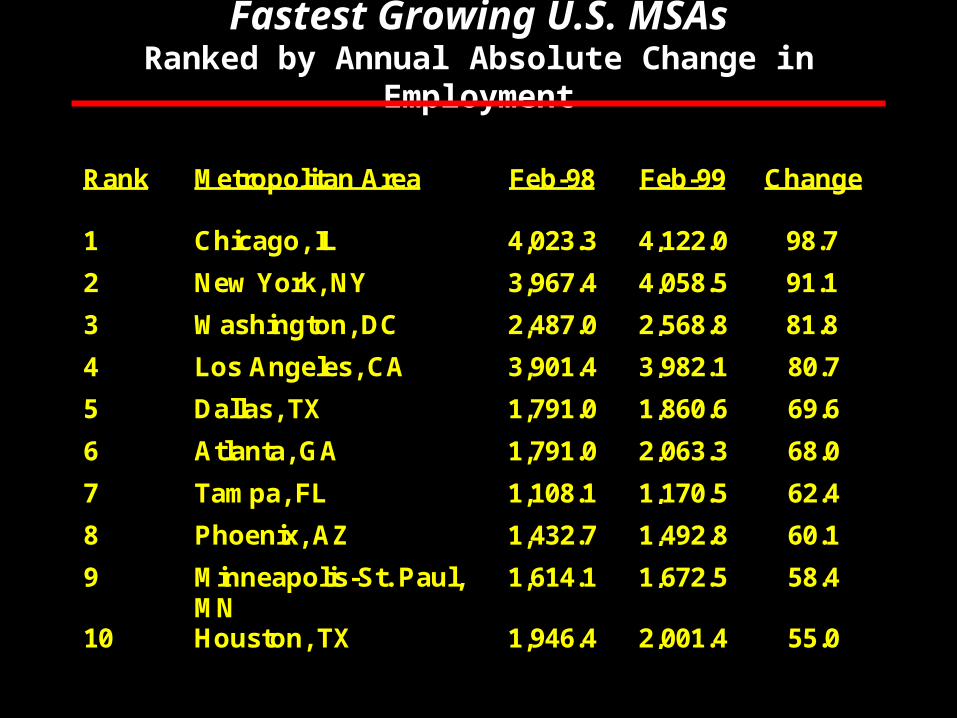
Fastest Growing U.S. MSAsRanked by Annual Absolute Change in Employment
Rank Metropolitan Area Feb-98 Feb-99 Change
1 Chicago, IL 4,023.3 4,122.0 98.7
2 New York, NY 3,967.4 4,058.5 91.1
3 Washington, DC 2,487.0 2,568.8 81.8
4 Los Angeles, CA 3,901.4 3,982.1 80.7
5 Dallas, TX 1,791.0 1,860.6 69.6
6 Atlanta, GA 1,791.0 2,063.3 68.0
7 Tampa, FL 1,108.1 1,170.5 62.4
8 Phoenix, AZ 1,432.7 1,492.8 60.1
9 Minneapolis-St. Paul,MN
1,614.1 1,672.5 58.4
10 Houston, TX 1,946.4 2,001.4 55.0
Rosen Consulting Group
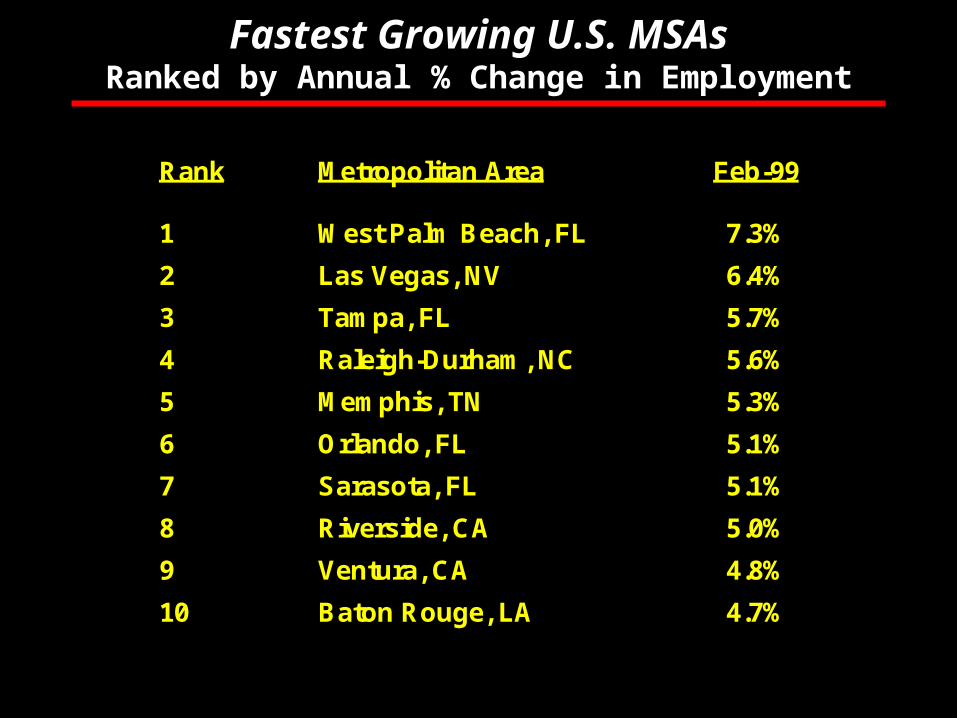
Fastest Growing U.S. MSAsRanked by Annual % Change in Employment
Rank Metropolitan Area Feb-99
1 West Palm Beach, FL 7.3%
2 Las Vegas, NV 6.4%
3 Tampa, FL 5.7%
4 Raleigh-Durham, NC 5.6%
5 Memphis, TN 5.3%
6 Orlando, FL 5.1%
7 Sarasota, FL 5.1%
8 Riverside, CA 5.0%
9 Ventura, CA 4.8%
10 Baton Rouge, LA 4.7%
Rosen Consulting Group
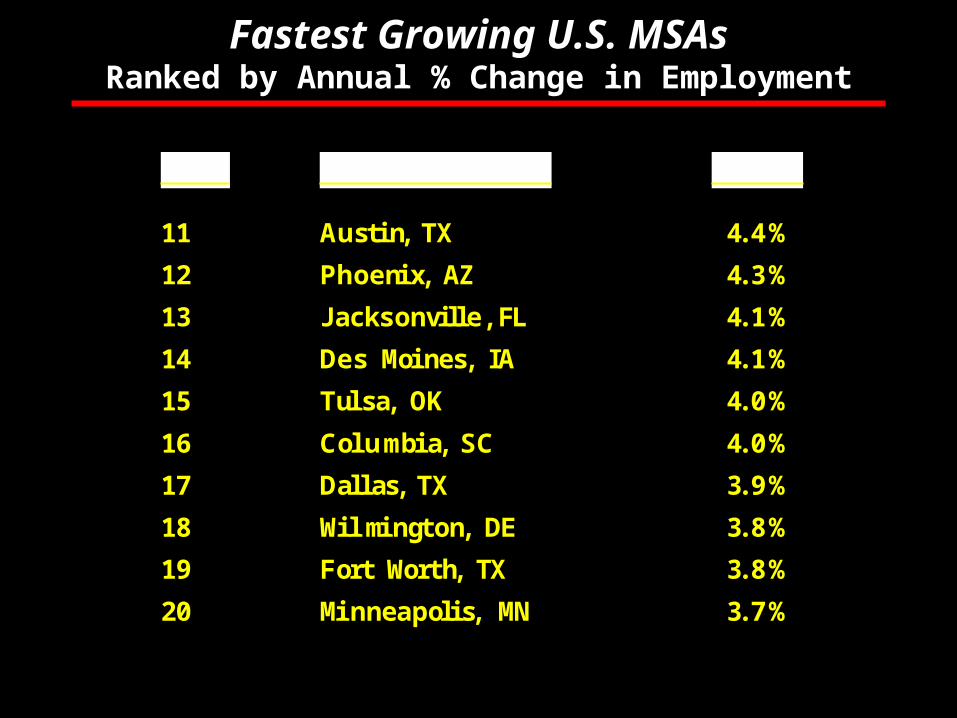
Fastest Growing U.S. MSAsRanked by Annual % Change in Employment
Rank Metr opolitan Area Feb- 99
11 Austi n, TX 4. 4%
12 Phoeni x, AZ 4. 3%
13 Jacksonvill e, FL 4. 1%
14 Des Moi nes, IA 4. 1%
15 Tul sa, OK 4. 0%
16 Col umbi a, SC 4. 0%
17 Dall as, TX 3. 9%
18 Wi l mi ngt on, DE 3. 8%
19 Fort Wort h, TX 3. 8%
20 Mi nneapoli s, MN 3. 7%
Rosen Consulting Group
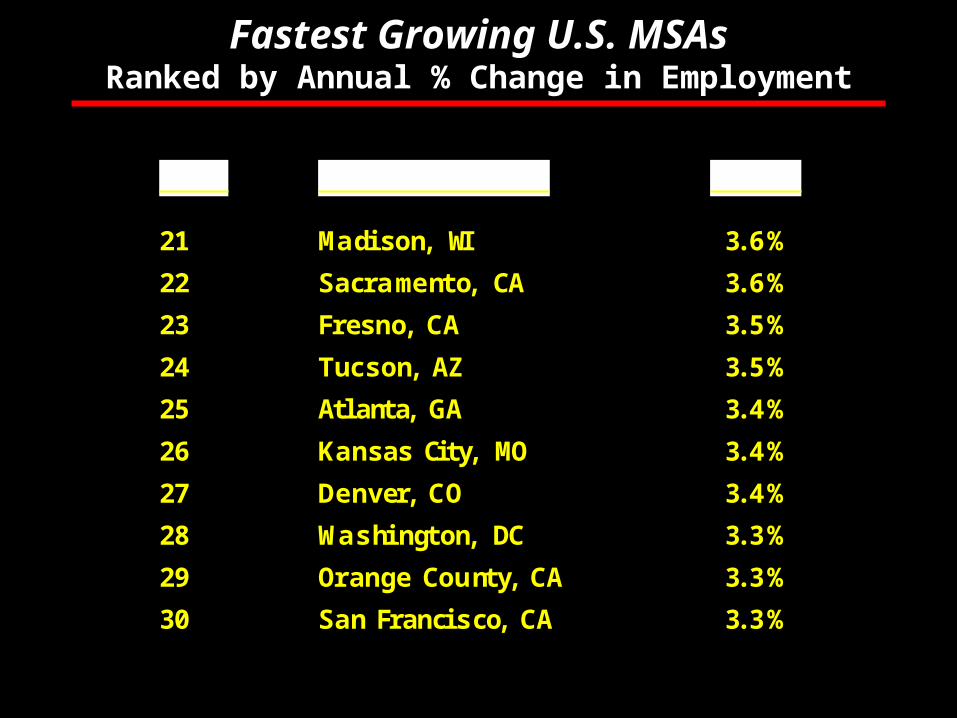
Fastest Growing U.S. MSAsRanked by Annual % Change in Employment
Rank Metr opolitan Area Feb- 99
21 Madi son, WI 3. 6%
22 Sacra ment o, CA 3. 6%
23 Fresno, CA 3. 5%
24 Tucson, AZ 3. 5%
25 Atl ant a, GA 3. 4%
26 Kansas City, MO 3. 4%
27 Denver, CO 3. 4%
28 Washi ngt on, DC 3. 3%
29 Or ange Count y, CA 3. 3%
30 San Franci sco, CA 3. 3%
Rosen Consulting Group
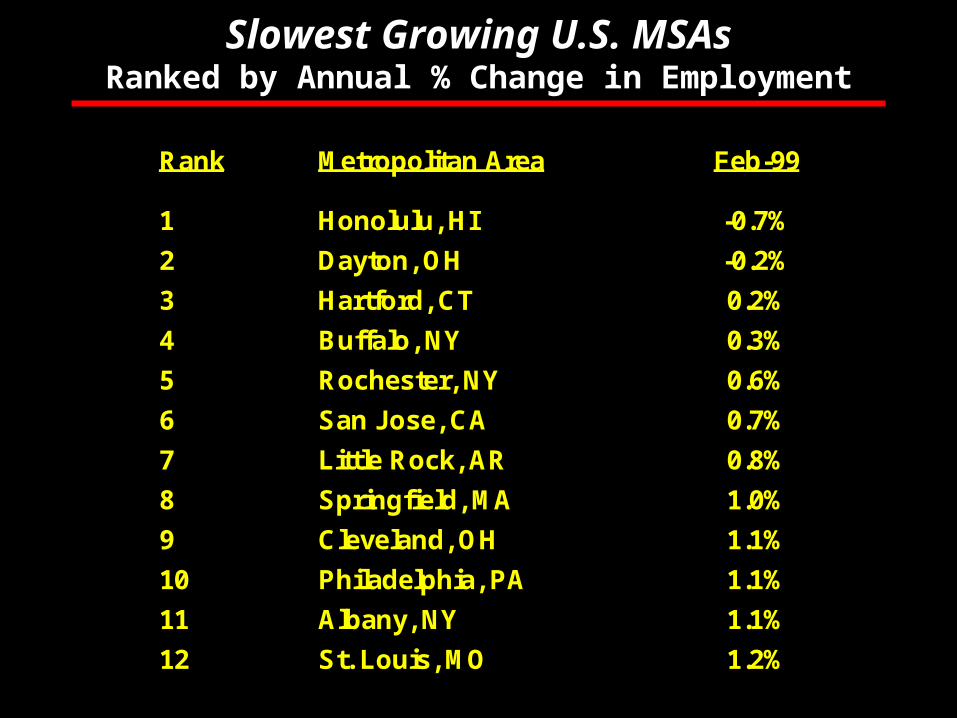
Slowest Growing U.S. MSAsRanked by Annual % Change in Employment
Rank Metropolitan Area Feb-99
1 Honolulu, HI -0.7%
2 Dayton, OH -0.2%
3 Hartford, CT 0.2%
4 Buffalo, NY 0.3%
5 Rochester, NY 0.6%
6 San Jose, CA 0.7%
7 Little Rock, AR 0.8%
8 Springfield, MA 1.0%
9 Cleveland, OH 1.1%
10 Philadelphia, PA 1.1%
11 Albany, NY 1.1%
12 St. Louis, MO 1.2%
Rosen Consulting Group
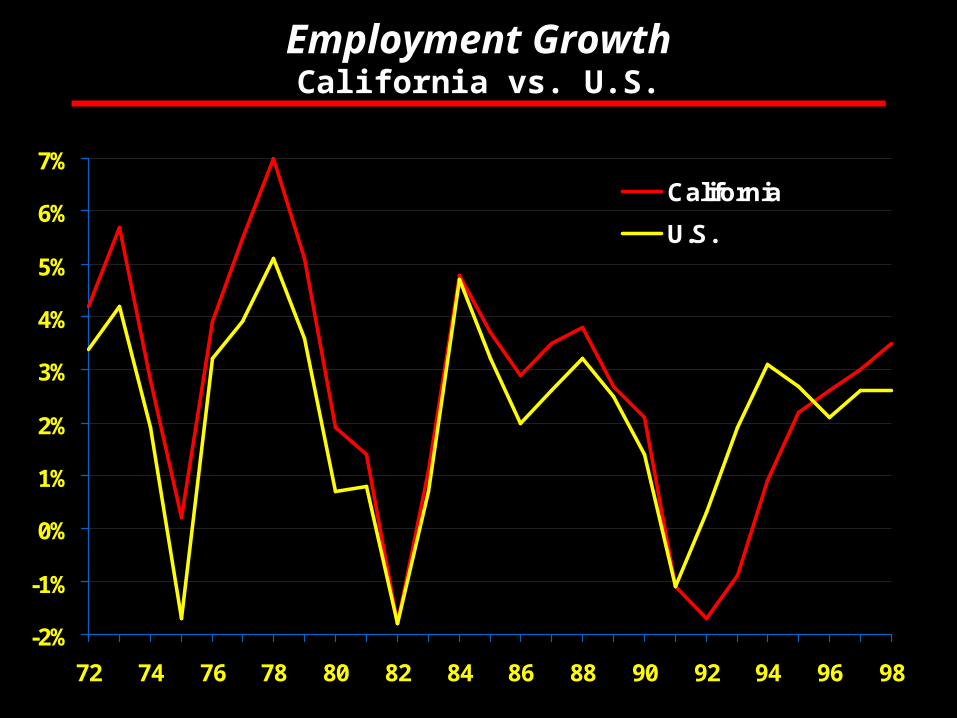
Employment GrowthCalifornia vs. U.S.
-2%
-1%
0%
1%
2%
3%
4%
5%
6%
7%
72 74 76 78 80 82 84 86 88 90 92 94 96 98
California
U.S.
Rosen Consulting Group
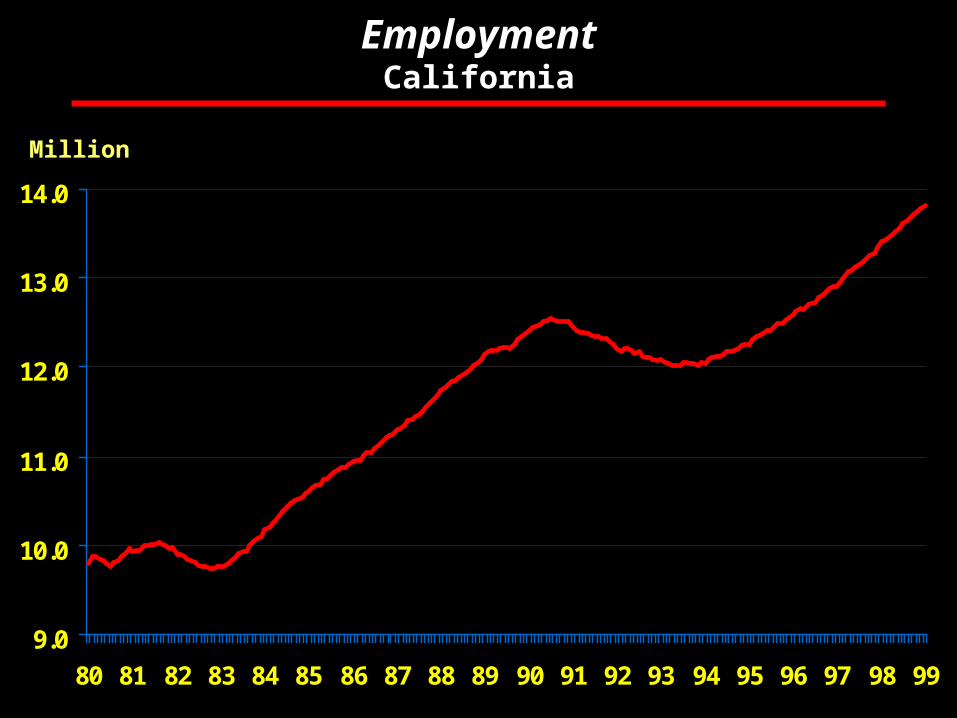
EmploymentCalifornia
9.0
10.0
11.0
12.0
13.0
14.0
80 81 82 83 84 85 86 87 88 89 90 91 92 93 94 95 96 97 98 99
Million
Rosen Consulting Group
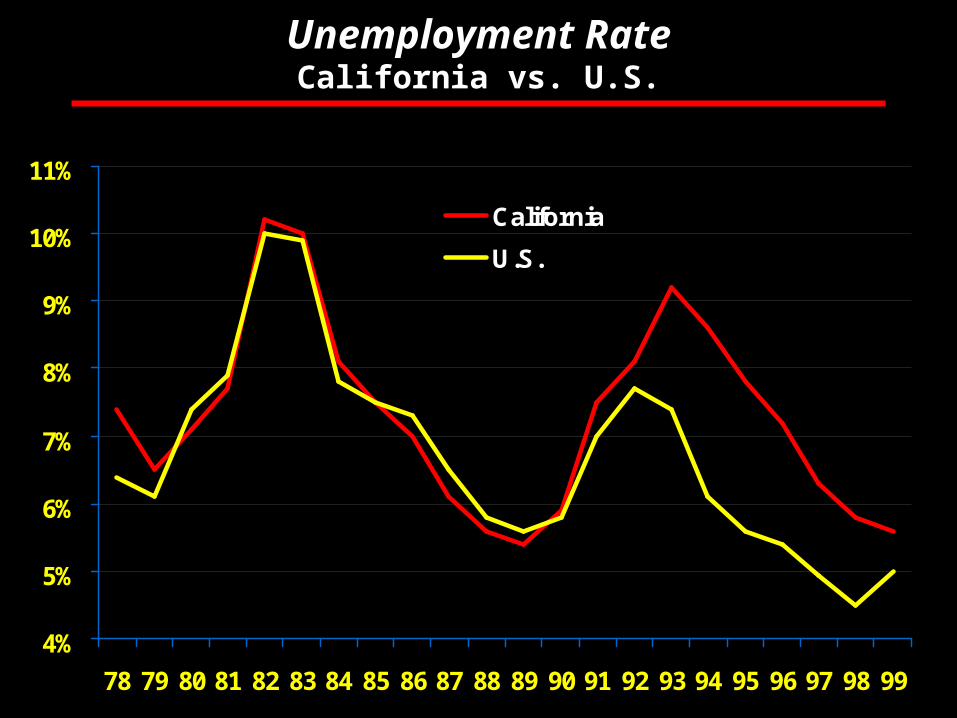
Unemployment RateCalifornia vs. U.S.
4%
5%
6%
7%
8%
9%
10%
11%
78 79 80 81 82 83 84 85 86 87 88 89 90 91 92 93 94 95 96 97 98 99
California
U.S.
Rosen Consulting Group
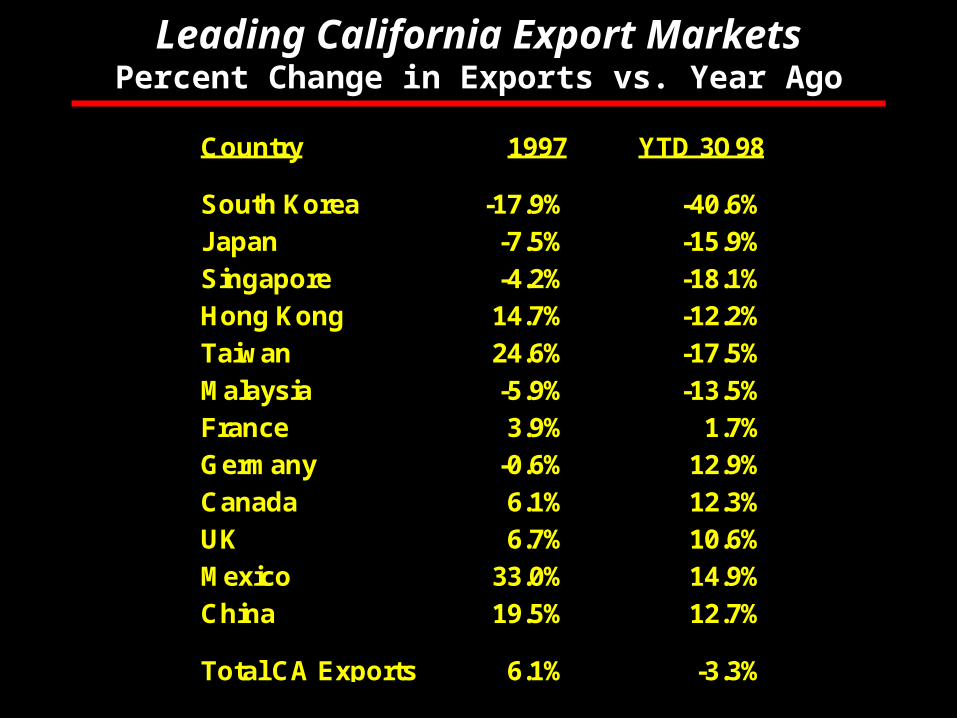
Leading California Export MarketsPercent Change in Exports vs. Year Ago
Country 1997 YTD 3Q98
South Korea -17.9% -40.6%
Japan -7.5% -15.9%
Singapore -4.2% -18.1%
Hong Kong 14.7% -12.2%
Taiwan 24.6% -17.5%
Malaysia -5.9% -13.5%
France 3.9% 1.7%
Germany -0.6% 12.9%
Canada 6.1% 12.3%
UK 6.7% 10.6%
Mexico 33.0% 14.9%
China 19.5% 12.7%
Total CA Exports 6.1% -3.3%
Rosen Consulting Group
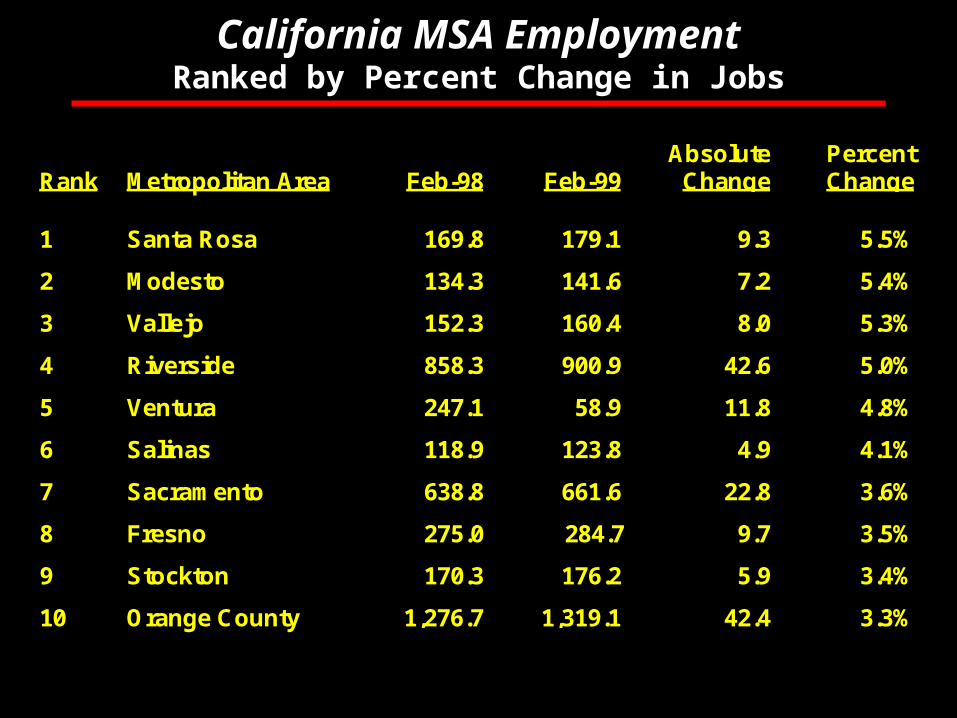
California MSA EmploymentRanked by Percent Change in Jobs
Rank Metropolitan Area Feb-98 Feb-99Absolute
ChangePercentChange
1 Santa Rosa 169.8 179.1 9.3 5.5%
2 Modesto 134.3 141.6 7.2 5.4%
3 Vallejo 152.3 160.4 8.0 5.3%
4 Riverside 858.3 900.9 42.6 5.0%
5 Ventura 247.1 58.9 11.8 4.8%
6 Salinas 118.9 123.8 4.9 4.1%
7 Sacramento 638.8 661.6 22.8 3.6%
8 Fresno 275.0 284.7 9.7 3.5%
9 Stockton 170.3 176.2 5.9 3.4%
10 Orange County 1,276.7 1,319.1 42.4 3.3%
Rosen Consulting Group
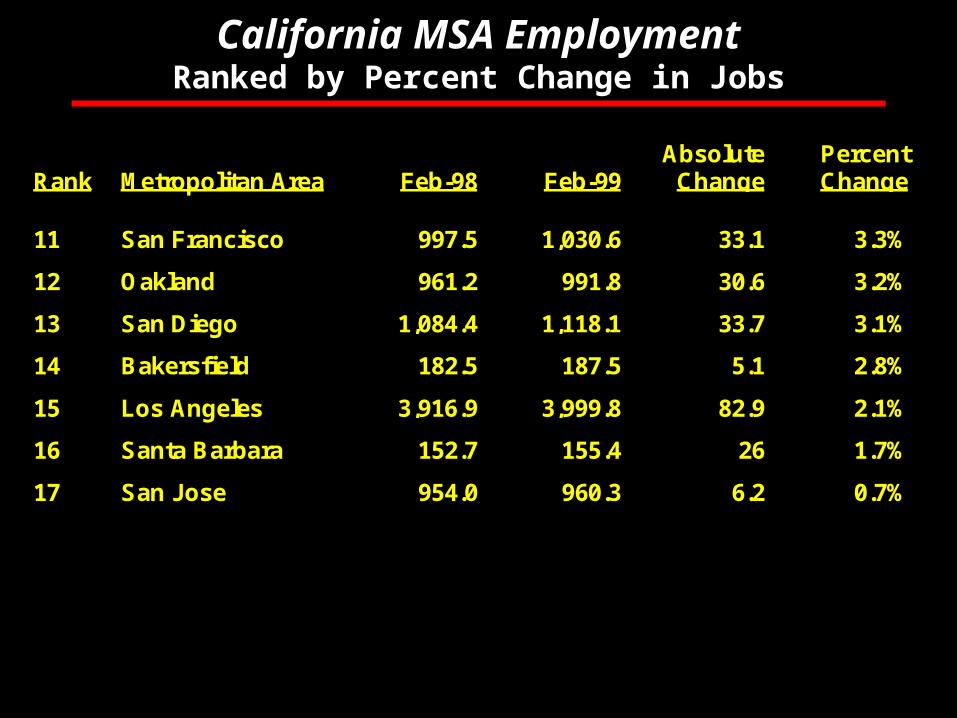
California MSA EmploymentRanked by Percent Change in Jobs
Rank Metropolitan Area Feb-98 Feb-99Absolute
ChangePercentChange
11 San Francisco 997.5 1,030.6 33.1 3.3%
12 Oakland 961.2 991.8 30.6 3.2%
13 San Diego 1,084.4 1,118.1 33.7 3.1%
14 Bakersfield 182.5 187.5 5.1 2.8%
15 Los Angeles 3,916.9 3,999.8 82.9 2.1%
16 Santa Barbara 152.7 155.4 26 1.7%
17 San Jose 954.0 960.3 6.2 0.7%
Rosen Consulting Group
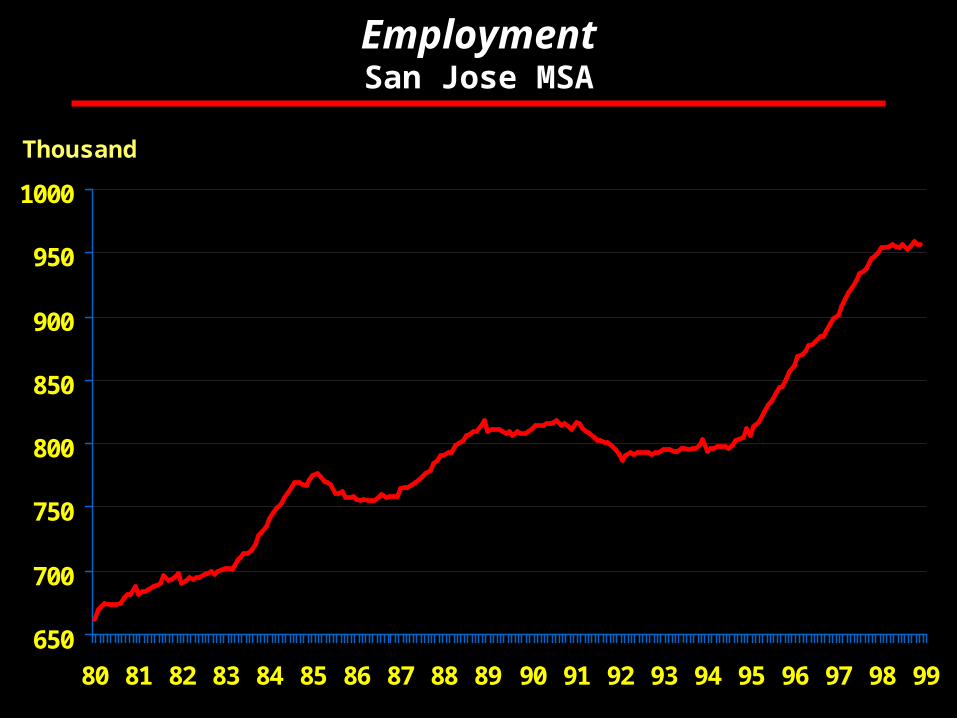
EmploymentSan Jose MSA
650
700
750
800
850
900
950
1000
80 81 82 83 84 85 86 87 88 89 90 91 92 93 94 95 96 97 98 99
Thousand
Rosen Consulting Group
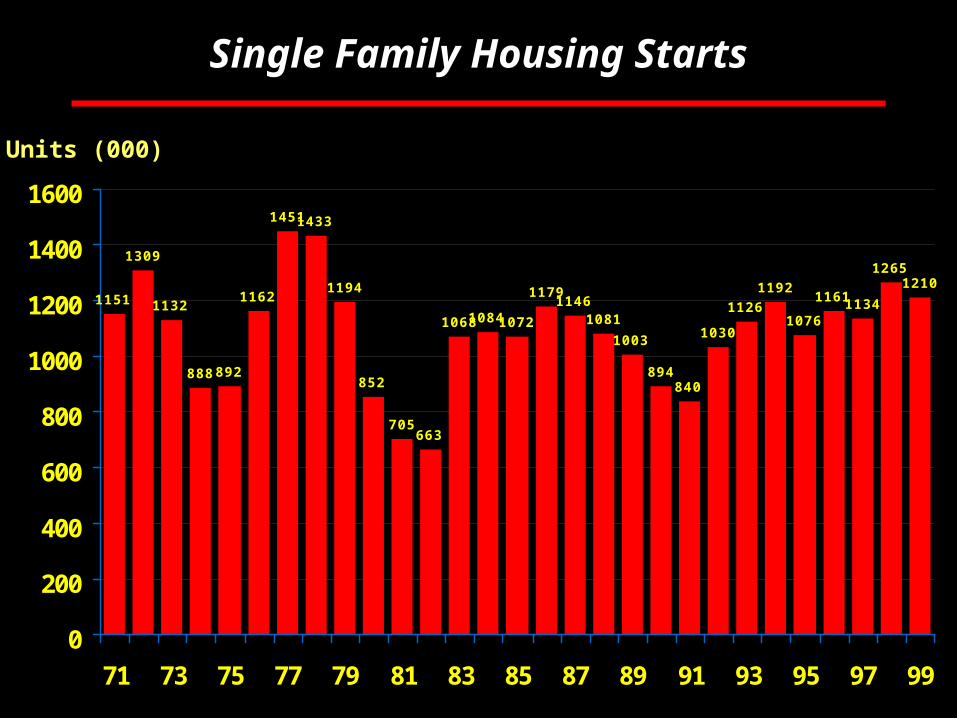
Single Family Housing Starts
1151
1309
1132
888892
1162
14511433
1194
852
705663
106810841072
11791146
1081
1003
894840
1030
11261192
1076
11611134
12651210
0
200
400
600
800
1000
1200
1400
1600
71 73 75 77 79 81 83 85 87 89 91 93 95 97 99
Units (000)
Rosen Consulting Group
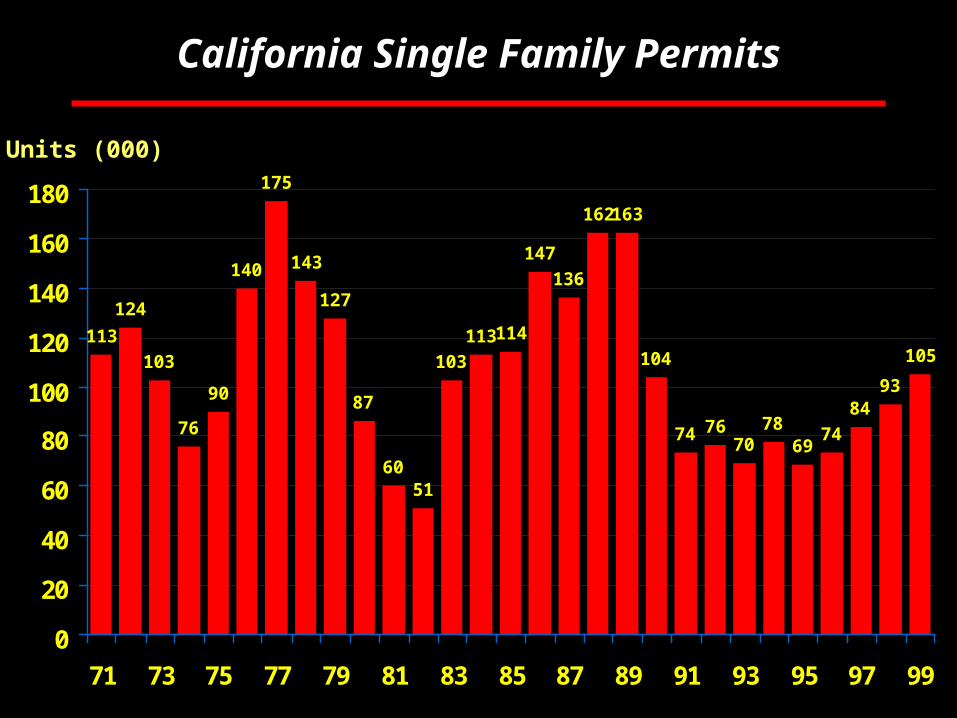
California Single Family Permits
113
124
103
76
90
140
175
143
127
87
6051
103
113114
147
136
162163
104
74 7670
7869
74
8493
105
0
20
40
60
80
100
120
140
160
180
71 73 75 77 79 81 83 85 87 89 91 93 95 97 99
Units (000)
Rosen Consulting Group
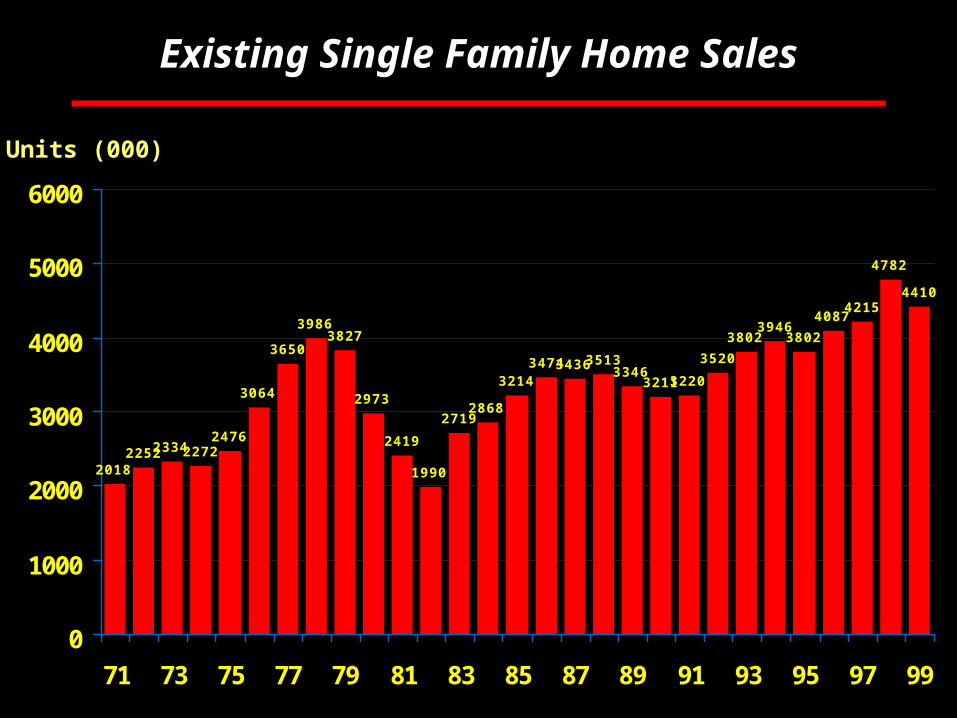
Existing Single Family Home Sales
2018225223342272
2476
3064
3650
39863827
2973
2419
1990
27192868
32143474343635133346
32113220
3520
38023946
3802
40874215
4782
4410
0
1000
2000
3000
4000
5000
6000
71 73 75 77 79 81 83 85 87 89 91 93 95 97 99
Units (000)
Rosen Consulting Group
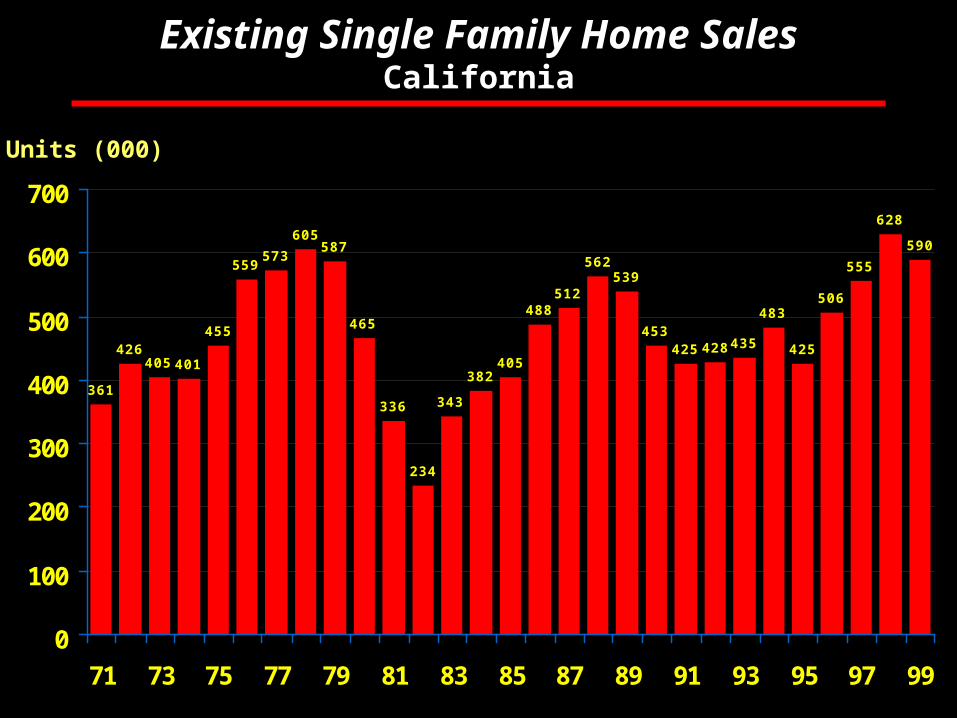
Existing Single Family Home SalesCalifornia
361
426405401
455
559573
605587
465
336
234
343
382405
488512
562539
453425428435
483
425
506
555
628
590
0
100
200
300
400
500
600
700
71 73 75 77 79 81 83 85 87 89 91 93 95 97 99
Units (000)
Rosen Consulting Group
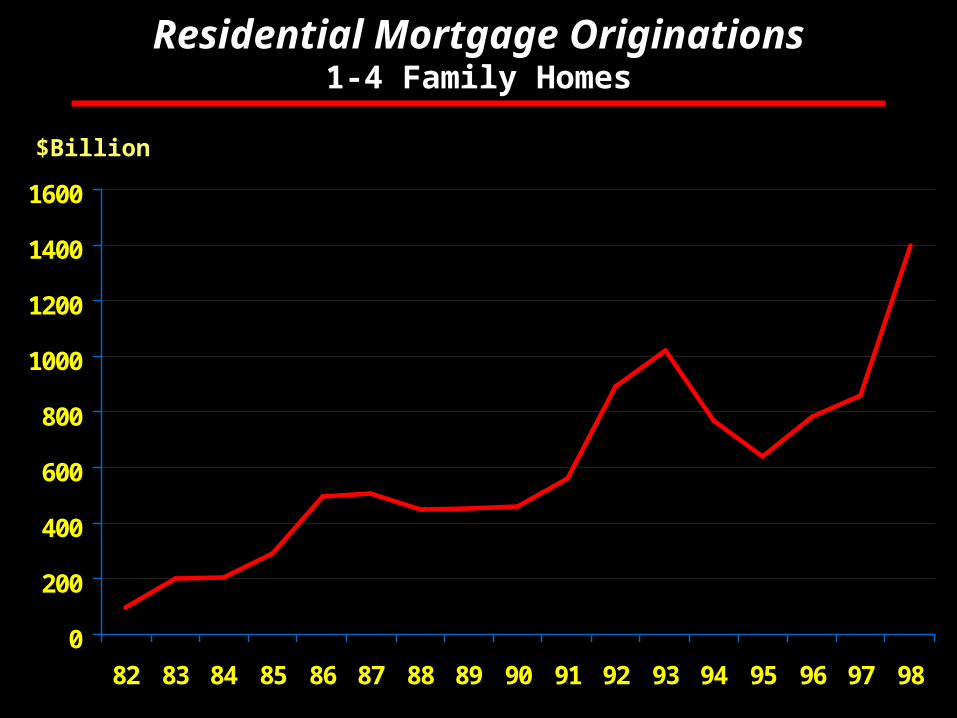
Residential Mortgage Originations1-4 Family Homes
0
200
400
600
800
1000
1200
1400
1600
82 83 84 85 86 87 88 89 90 91 92 93 94 95 96 97 98
$Billion

Rosen Consulting Group
Residential Mortgage RatesFixed and Adjustable
5%
6%
7%
8%
9%
10%
11%
12%
13%
85 86 87 88 89 90 91 92 93 94 95 96 97 98 99
FRM
ARM
Rosen Consulting Group
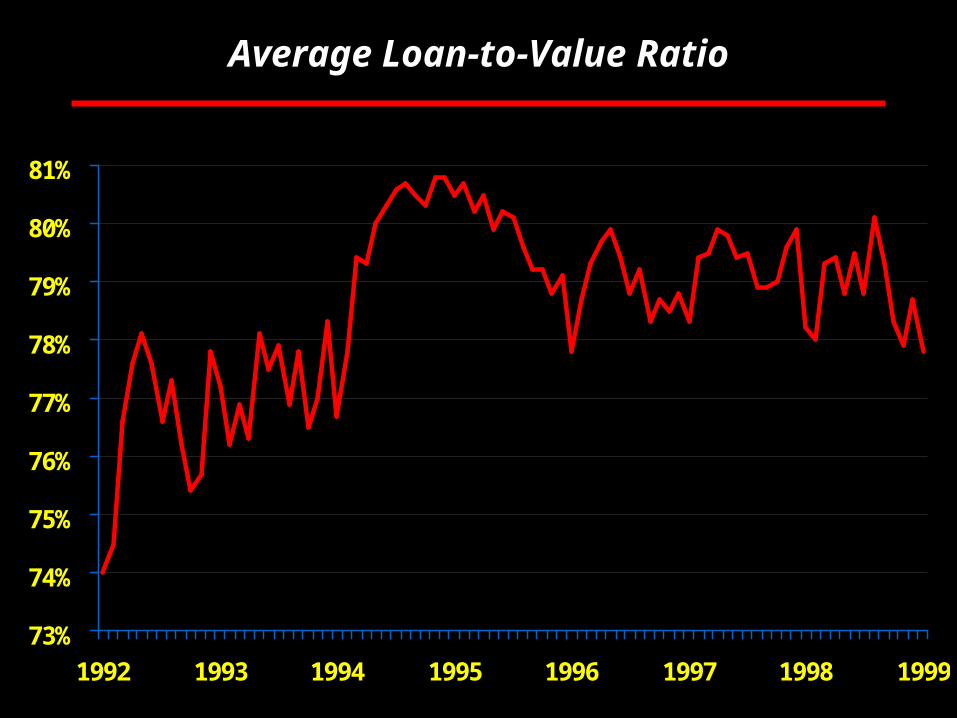
Average Loan-to-Value Ratio
73%
74%
75%
76%
77%
78%
79%
80%
81%
1992 1993 1994 1995 1996 1997 1998 1999
Rosen Consulting Group
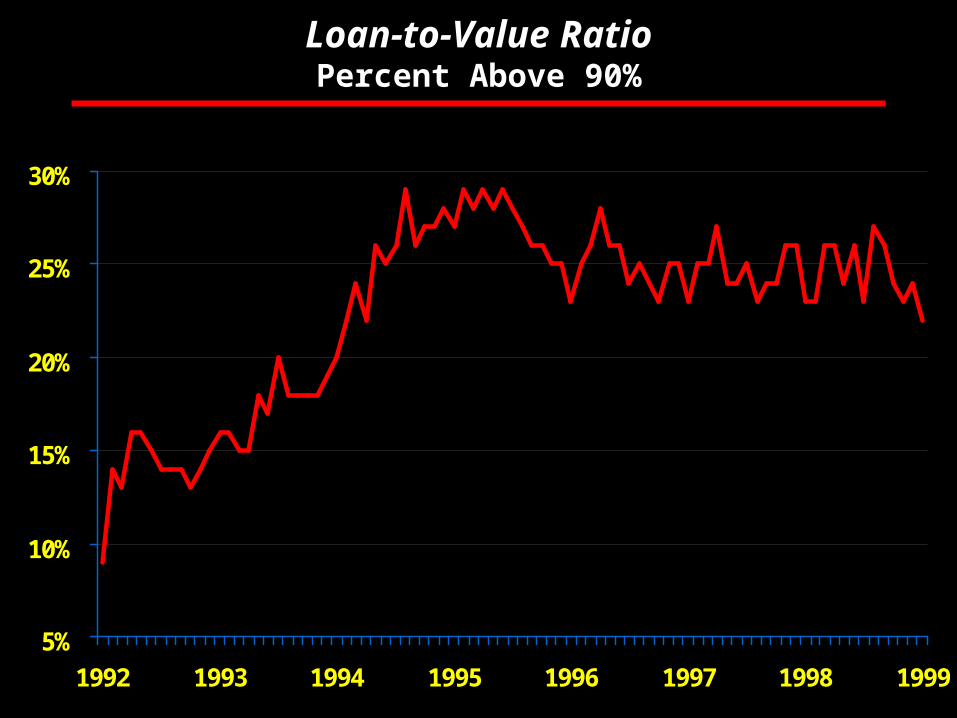
Loan-to-Value RatioPercent Above 90%
5%
10%
15%
20%
25%
30%
1992 1993 1994 1995 1996 1997 1998 1999
Rosen Consulting Group
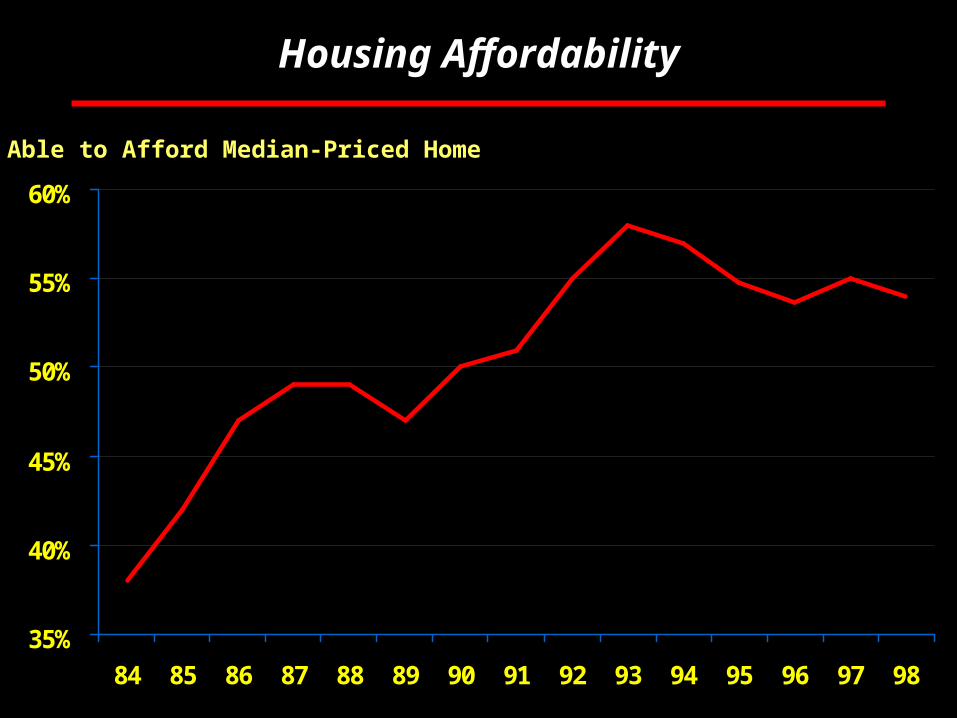
Housing Affordability
35%
40%
45%
50%
55%
60%
84 85 86 87 88 89 90 91 92 93 94 95 96 97 98
% Able to Afford Median-Priced Home
Rosen Consulting Group
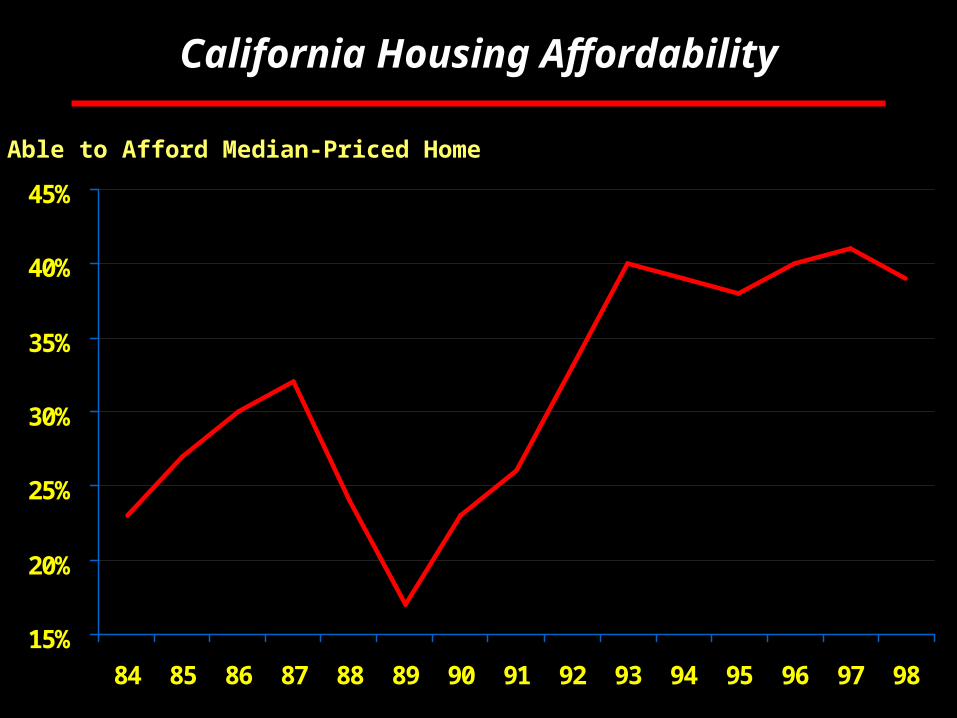
California Housing Affordability
15%
20%
25%
30%
35%
40%
45%
84 85 86 87 88 89 90 91 92 93 94 95 96 97 98
% Able to Afford Median-Priced Home

Rosen Consulting Group
Existing Median Home Price Appreciation
8.2
10.710.3
7.9
12.6
13.514.4
11.7
6.8
2.1
3.73.0
4.3
6.4 6.6
4.3 4.3
2.6
5.0
3.43.0 2.8 2.8
4.7 5.0 5.2
4.1
0
2
4
6
8
10
12
14
16
73 75 77 79 81 83 85 87 89 91 93 95 97 99
Annual % Change

Rosen Consulting Group
Existing Median Home Price AppreciationCalifornia
9.210.0
20.2
16.9
28.1
13.8
18.718.3
8.2
3.82.3
-0.1
4.9
11.5
6.3
18.416.6
-1.2
3.8
-1.6
-4.6
-1.7-3.7
-0.6
5.0
8.0
5.0
-10
-5
0
5
10
15
20
25
30
73 75 77 79 81 83 85 87 89 91 93 95 97 99
Annual % Change
Rosen Consulting Group
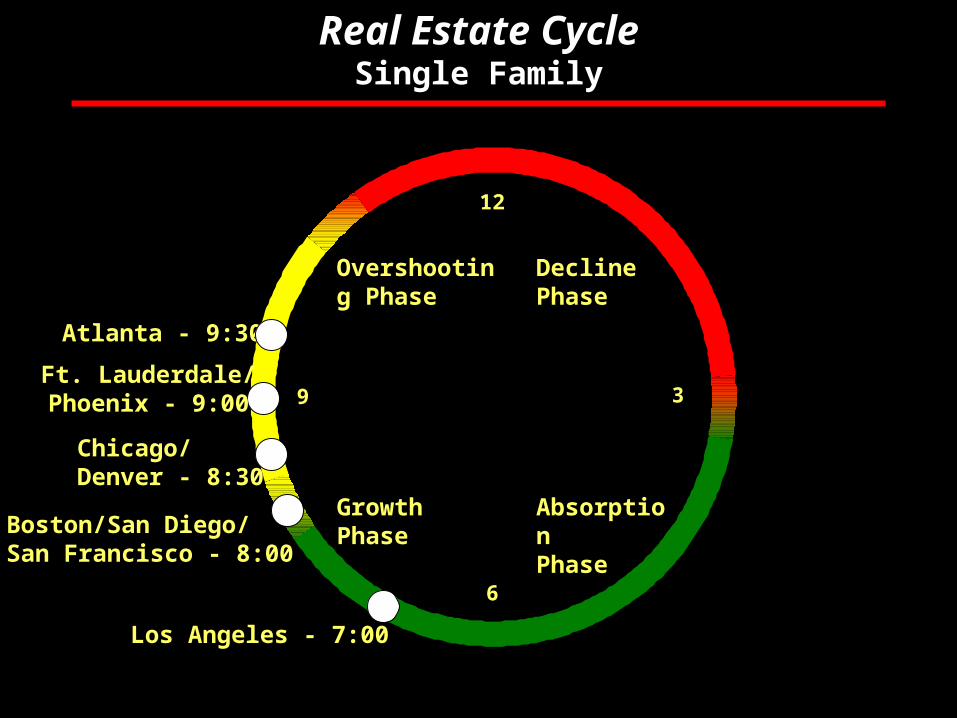
Real Estate CycleSingle Family
Overshooting Phase
AbsorptionPhase
DeclinePhase
GrowthPhase
Chicago/Denver - 8:30
12
9 3
6
Boston/San Diego/San Francisco - 8:00
Atlanta - 9:30
Los Angeles - 7:00
Ft. Lauderdale/Phoenix - 9:00
Rosen Consulting Group
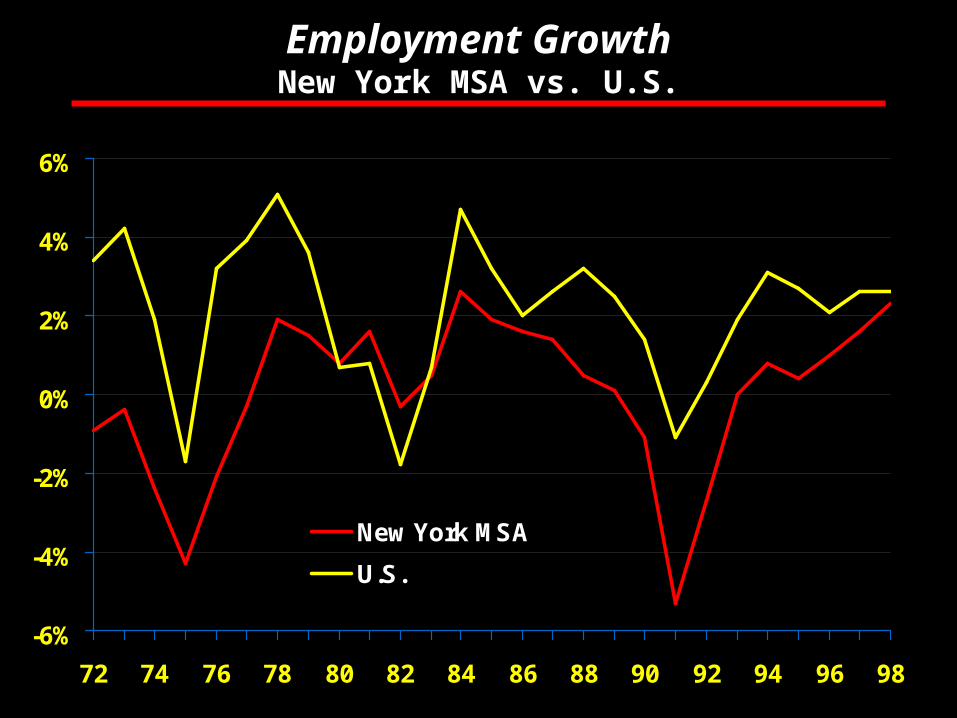
Employment GrowthNew York MSA vs. U.S.
-6%
-4%
-2%
0%
2%
4%
6%
72 74 76 78 80 82 84 86 88 90 92 94 96 98
New York MSA
U.S.
Rosen Consulting Group
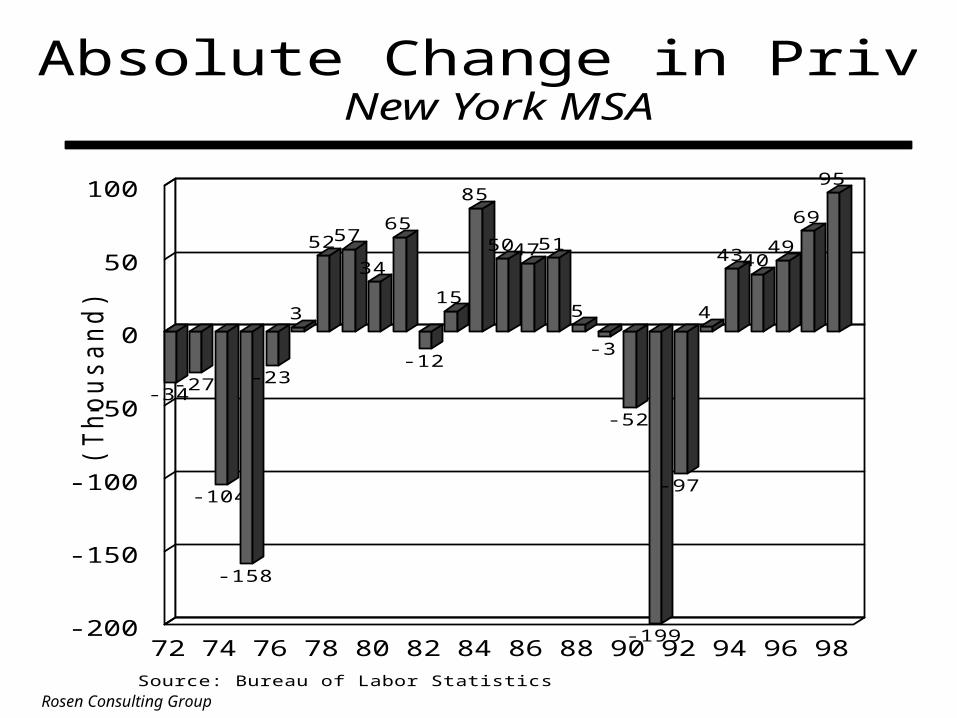
-200
-150
-100
-50
0
50
100
(Th
ou
sa
nd
)
72 74 76 78 80 82 84 86 88 90 92 94 96 98
-34 -27
-104
-158
-23
3
52 57
34
65
-12
15
85
50 47 51
5
-3
-52
-199
-97
4
43 40 49
69
95
Absolute Change in Private EmploymentNew York MSA
Source: Bureau of Labor Statistics
Rosen Consulting Group
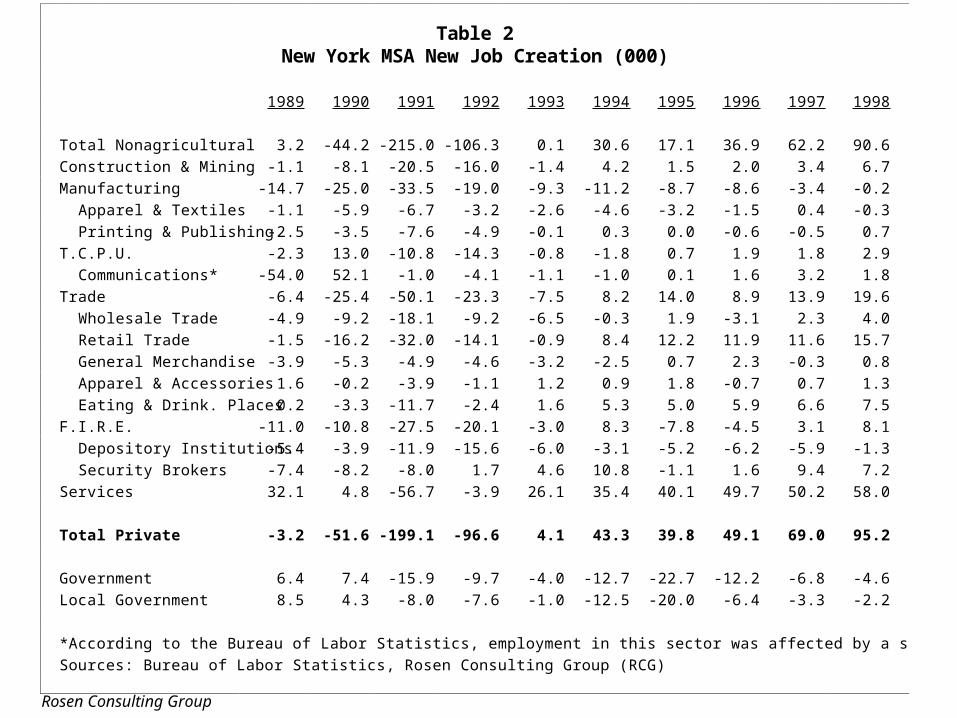
Table 2New York MSA New Job Creation (000)
1989 1990 1991 1992 1993 1994 1995 1996 1997 1998
Total Nonagricultural 3.2 -44.2 -215.0 -106.3 0.1 30.6 17.1 36.9 62.2 90.6
Construction & Mining -1.1 -8.1 -20.5 -16.0 -1.4 4.2 1.5 2.0 3.4 6.7
Manufacturing -14.7 -25.0 -33.5 -19.0 -9.3 -11.2 -8.7 -8.6 -3.4 -0.2
Apparel & Textiles -1.1 -5.9 -6.7 -3.2 -2.6 -4.6 -3.2 -1.5 0.4 -0.3
Printing & Publishing -2.5 -3.5 -7.6 -4.9 -0.1 0.3 0.0 -0.6 -0.5 0.7
T.C.P.U. -2.3 13.0 -10.8 -14.3 -0.8 -1.8 0.7 1.9 1.8 2.9
Communications* -54.0 52.1 -1.0 -4.1 -1.1 -1.0 0.1 1.6 3.2 1.8
Trade -6.4 -25.4 -50.1 -23.3 -7.5 8.2 14.0 8.9 13.9 19.6
Wholesale Trade -4.9 -9.2 -18.1 -9.2 -6.5 -0.3 1.9 -3.1 2.3 4.0
Retail Trade -1.5 -16.2 -32.0 -14.1 -0.9 8.4 12.2 11.9 11.6 15.7
General Merchandise -3.9 -5.3 -4.9 -4.6 -3.2 -2.5 0.7 2.3 -0.3 0.8
Apparel & Accessories 1.6 -0.2 -3.9 -1.1 1.2 0.9 1.8 -0.7 0.7 1.3
Eating & Drink. Places 0.2 -3.3 -11.7 -2.4 1.6 5.3 5.0 5.9 6.6 7.5
F.I.R.E. -11.0 -10.8 -27.5 -20.1 -3.0 8.3 -7.8 -4.5 3.1 8.1
Depository Institutions -5.4 -3.9 -11.9 -15.6 -6.0 -3.1 -5.2 -6.2 -5.9 -1.3
Security Brokers -7.4 -8.2 -8.0 1.7 4.6 10.8 -1.1 1.6 9.4 7.2
Services 32.1 4.8 -56.7 -3.9 26.1 35.4 40.1 49.7 50.2 58.0
Total Private -3.2 -51.6 -199.1 -96.6 4.1 43.3 39.8 49.1 69.0 95.2
Government 6.4 7.4 -15.9 -9.7 -4.0 -12.7 -22.7 -12.2 -6.8 -4.6
Local Government 8.5 4.3 -8.0 -7.6 -1.0 -12.5 -20.0 -6.4 -3.3 -2.2
*According to the Bureau of Labor Statistics, employment in this sector was affected by a strike in 1989.
Sources: Bureau of Labor Statistics, Rosen Consulting Group (RCG)
Rosen Consulting Group
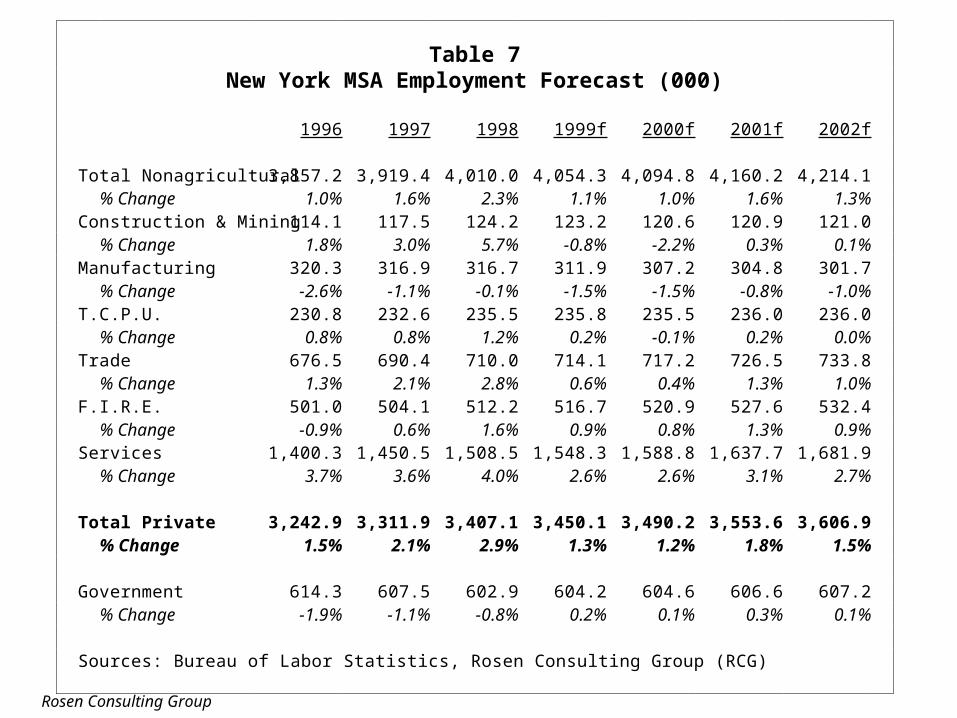
Table 7New York MSA Employment Forecast (000)
1996 1997 1998 1999f 2000f 2001f 2002f
Total Nonagricultural 3,857.2 3,919.4 4,010.0 4,054.3 4,094.8 4,160.2 4,214.1% Change 1.0% 1.6% 2.3% 1.1% 1.0% 1.6% 1.3%
Construction & Mining 114.1 117.5 124.2 123.2 120.6 120.9 121.0% Change 1.8% 3.0% 5.7% -0.8% -2.2% 0.3% 0.1%
Manufacturing 320.3 316.9 316.7 311.9 307.2 304.8 301.7% Change -2.6% -1.1% -0.1% -1.5% -1.5% -0.8% -1.0%
T.C.P.U. 230.8 232.6 235.5 235.8 235.5 236.0 236.0% Change 0.8% 0.8% 1.2% 0.2% -0.1% 0.2% 0.0%
Trade 676.5 690.4 710.0 714.1 717.2 726.5 733.8% Change 1.3% 2.1% 2.8% 0.6% 0.4% 1.3% 1.0%
F.I.R.E. 501.0 504.1 512.2 516.7 520.9 527.6 532.4% Change -0.9% 0.6% 1.6% 0.9% 0.8% 1.3% 0.9%
Services 1,400.3 1,450.5 1,508.5 1,548.3 1,588.8 1,637.7 1,681.9% Change 3.7% 3.6% 4.0% 2.6% 2.6% 3.1% 2.7%
Total Private 3,242.9 3,311.9 3,407.1 3,450.1 3,490.2 3,553.6 3,606.9% Change 1.5% 2.1% 2.9% 1.3% 1.2% 1.8% 1.5%
Government 614.3 607.5 602.9 604.2 604.6 606.6 607.2% Change -1.9% -1.1% -0.8% 0.2% 0.1% 0.3% 0.1%
Sources: Bureau of Labor Statistics, Rosen Consulting Group (RCG)
Rosen Consulting Group
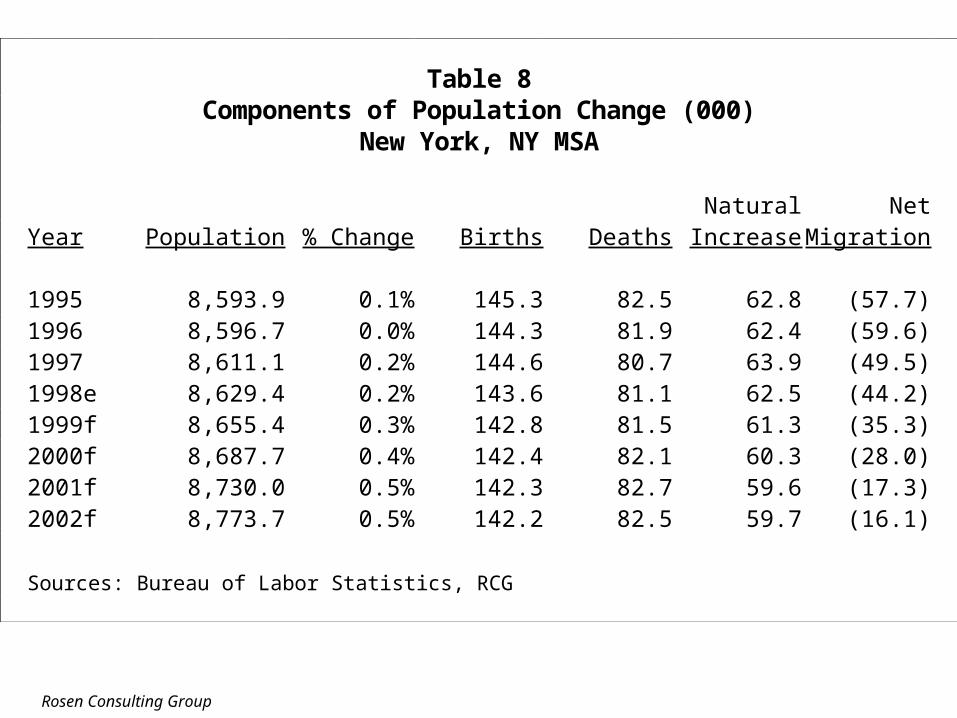
Table 8Components of Population Change (000)
New York, NY MSA
Natural NetYear Population % Change Births Deaths Increase Migration
1995 8,593.9 0.1% 145.3 82.5 62.8 (57.7)1996 8,596.7 0.0% 144.3 81.9 62.4 (59.6)1997 8,611.1 0.2% 144.6 80.7 63.9 (49.5)1998e 8,629.4 0.2% 143.6 81.1 62.5 (44.2)1999f 8,655.4 0.3% 142.8 81.5 61.3 (35.3)2000f 8,687.7 0.4% 142.4 82.1 60.3 (28.0)2001f 8,730.0 0.5% 142.3 82.7 59.6 (17.3)2002f 8,773.7 0.5% 142.2 82.5 59.7 (16.1)
Sources: Bureau of Labor Statistics, RCG
Rosen Consulting Group
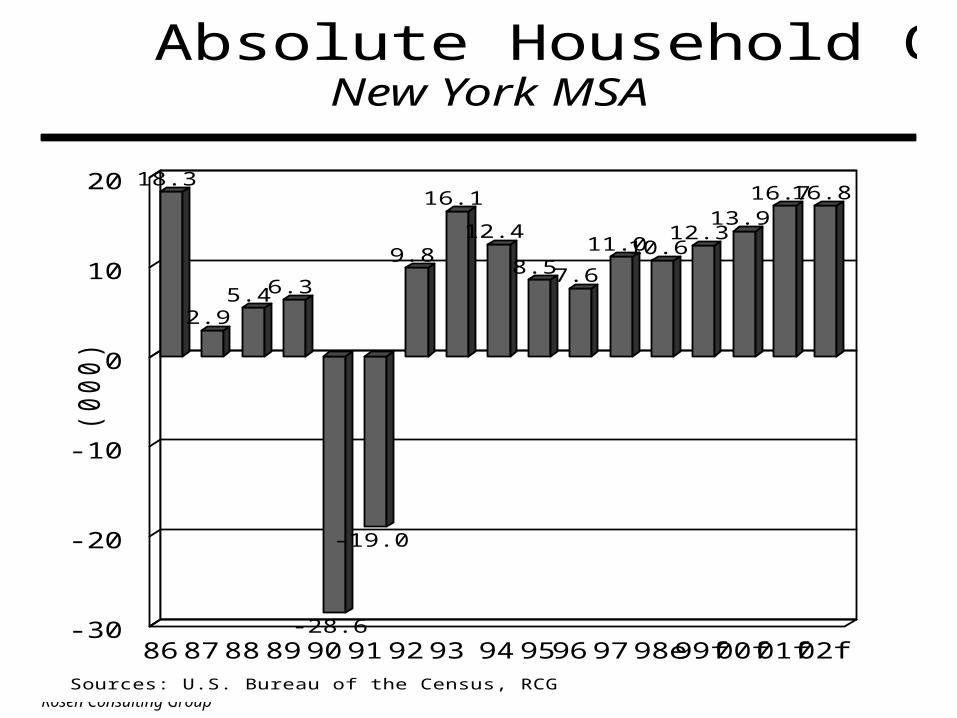
-30
-20
-10
0
10
20
(00
0)
86 87 88 89 90 91 92 93 94 9596 97 98e99f00f01f02f
18.3
2.9 5.4 6.3
-28.6
-19.0
9.8
16.1
12.4
8.5 7.6
11.0 10.6 12.3
13.9 16.7 16.8
Absolute Household GrowthNew York MSA
Sources: U.S. Bureau of the Census, RCG
Rosen Consulting Group
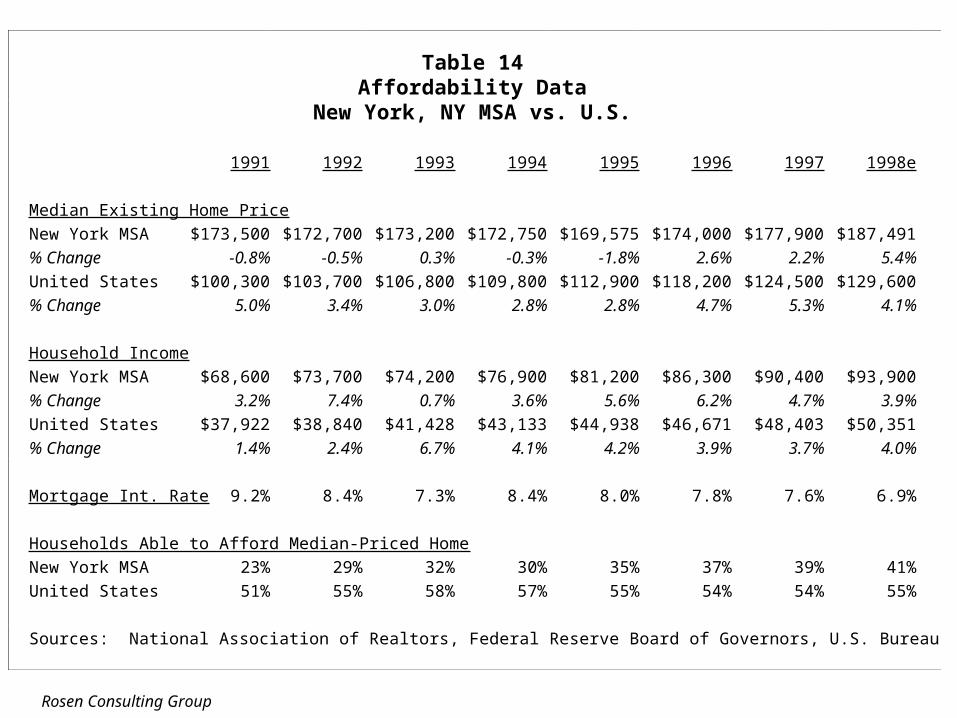
Table 14Affordability Data
New York, NY MSA vs. U.S.
1991 1992 1993 1994 1995 1996 1997 1998e
Median Existing Home Price
New York MSA $173,500 $172,700 $173,200 $172,750 $169,575 $174,000 $177,900 $187,491
% Change -0.8% -0.5% 0.3% -0.3% -1.8% 2.6% 2.2% 5.4%
United States $100,300 $103,700 $106,800 $109,800 $112,900 $118,200 $124,500 $129,600
% Change 5.0% 3.4% 3.0% 2.8% 2.8% 4.7% 5.3% 4.1%
Household Income
New York MSA $68,600 $73,700 $74,200 $76,900 $81,200 $86,300 $90,400 $93,900
% Change 3.2% 7.4% 0.7% 3.6% 5.6% 6.2% 4.7% 3.9%
United States $37,922 $38,840 $41,428 $43,133 $44,938 $46,671 $48,403 $50,351
% Change 1.4% 2.4% 6.7% 4.1% 4.2% 3.9% 3.7% 4.0%
Mortgage Int. Rate 9.2% 8.4% 7.3% 8.4% 8.0% 7.8% 7.6% 6.9%
Households Able to Afford Median-Priced Home
New York MSA 23% 29% 32% 30% 35% 37% 39% 41%
United States 51% 55% 58% 57% 55% 54% 54% 55%
Sources: National Association of Realtors, Federal Reserve Board of Governors, U.S. Bureau of the Census, RCG
Rosen Consulting Group
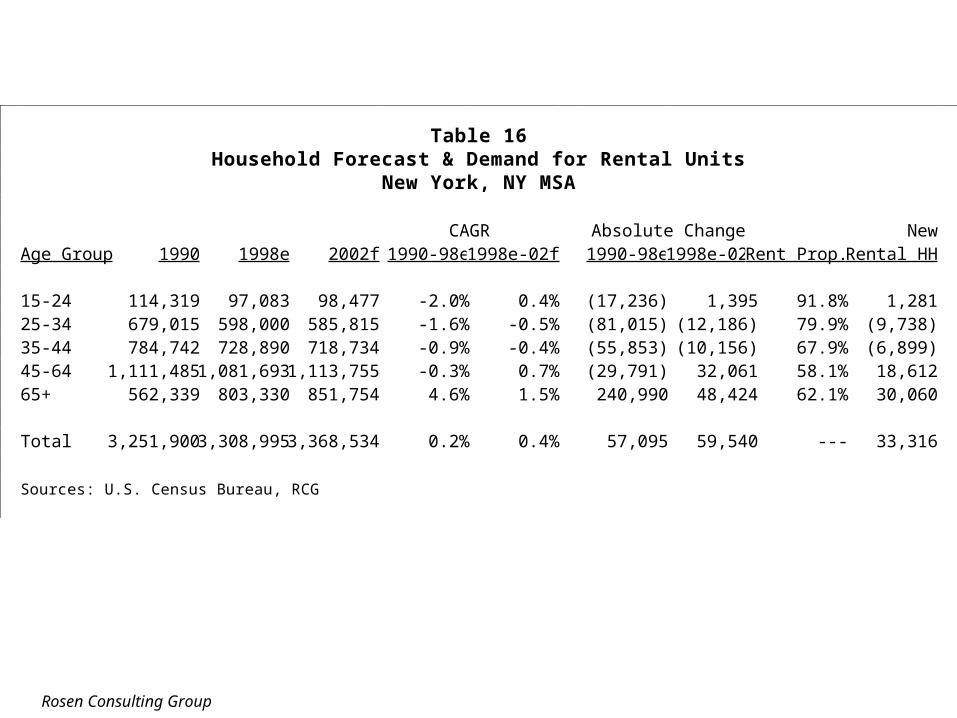
Table 16Household Forecast & Demand for Rental Units
New York, NY MSA
CAGR Absolute Change NewAge Group 1990 1998e 2002f 1990-98e 1998e-02f 1990-98e 1998e-02f Rent Prop. Rental HH
15-24 114,319 97,083 98,477 -2.0% 0.4% (17,236) 1,395 91.8% 1,28125-34 679,015 598,000 585,815 -1.6% -0.5% (81,015) (12,186) 79.9% (9,738)35-44 784,742 728,890 718,734 -0.9% -0.4% (55,853) (10,156) 67.9% (6,899)45-64 1,111,485 1,081,693 1,113,755 -0.3% 0.7% (29,791) 32,061 58.1% 18,61265+ 562,339 803,330 851,754 4.6% 1.5% 240,990 48,424 62.1% 30,060
Total 3,251,900 3,308,995 3,368,534 0.2% 0.4% 57,095 59,540 --- 33,316
Sources: U.S. Census Bureau, RCG
Rosen Consulting Group
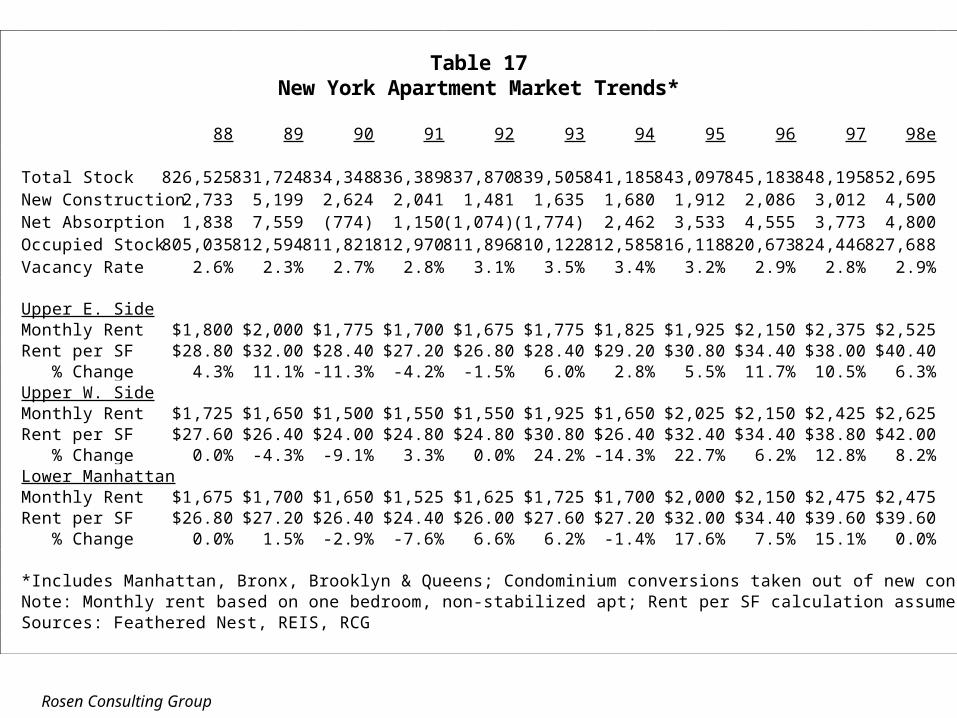
Table 17New York Apartment Market Trends*
88 89 90 91 92 93 94 95 96 97 98e
Total Stock 826,525 831,724 834,348 836,389 837,870 839,505 841,185 843,097 845,183 848,195 852,695New Construction 2,733 5,199 2,624 2,041 1,481 1,635 1,680 1,912 2,086 3,012 4,500Net Absorption 1,838 7,559 (774) 1,150 (1,074) (1,774) 2,462 3,533 4,555 3,773 4,800Occupied Stock 805,035 812,594 811,821 812,970 811,896 810,122 812,585 816,118 820,673 824,446 827,688Vacancy Rate 2.6% 2.3% 2.7% 2.8% 3.1% 3.5% 3.4% 3.2% 2.9% 2.8% 2.9%
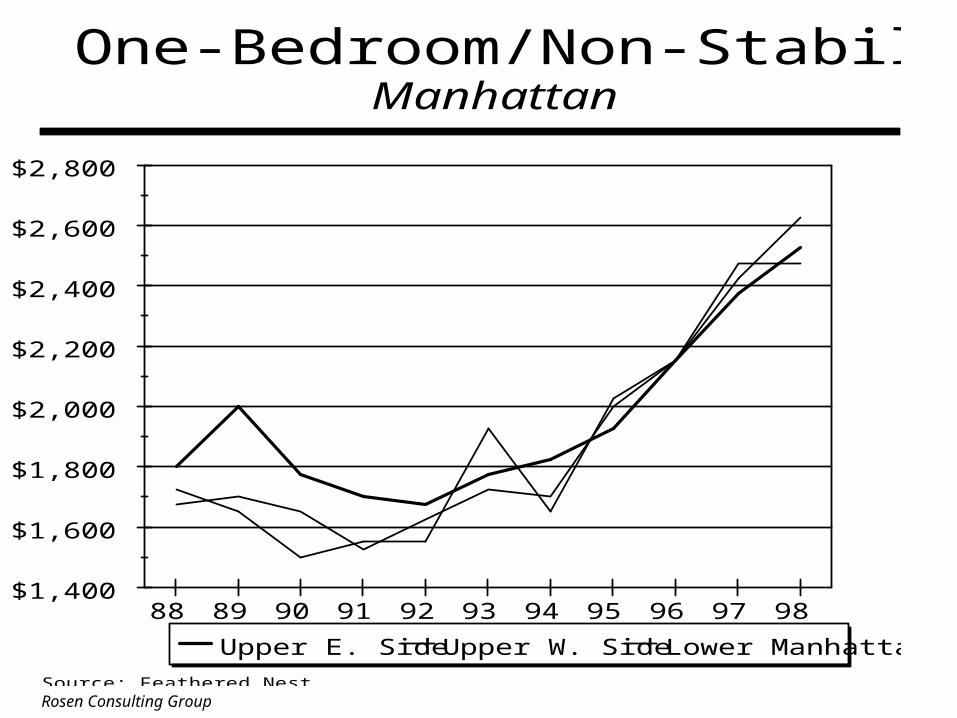
Upper E. SideMonthly Rent $1,800 $2,000 $1,775 $1,700 $1,675 $1,775 $1,825 $1,925 $2,150 $2,375 $2,525Rent per SF $28.80 $32.00 $28.40 $27.20 $26.80 $28.40 $29.20 $30.80 $34.40 $38.00 $40.40 % Change 4.3% 11.1% -11.3% -4.2% -1.5% 6.0% 2.8% 5.5% 11.7% 10.5% 6.3%Upper W. SideMonthly Rent $1,725 $1,650 $1,500 $1,550 $1,550 $1,925 $1,650 $2,025 $2,150 $2,425 $2,625Rent per SF $27.60 $26.40 $24.00 $24.80 $24.80 $30.80 $26.40 $32.40 $34.40 $38.80 $42.00 % Change 0.0% -4.3% -9.1% 3.3% 0.0% 24.2% -14.3% 22.7% 6.2% 12.8% 8.2%Lower ManhattanMonthly Rent $1,675 $1,700 $1,650 $1,525 $1,625 $1,725 $1,700 $2,000 $2,150 $2,475 $2,475Rent per SF $26.80 $27.20 $26.40 $24.40 $26.00 $27.60 $27.20 $32.00 $34.40 $39.60 $39.60 % Change 0.0% 1.5% -2.9% -7.6% 6.6% 6.2% -1.4% 17.6% 7.5% 15.1% 0.0%
*Includes Manhattan, Bronx, Brooklyn & Queens; Condominium conversions taken out of new construction seriesNote: Monthly rent based on one bedroom, non-stabilized apt; Rent per SF calculation assumes 750 SF per aptSources: Feathered Nest, REIS, RCG
Rosen Consulting Group
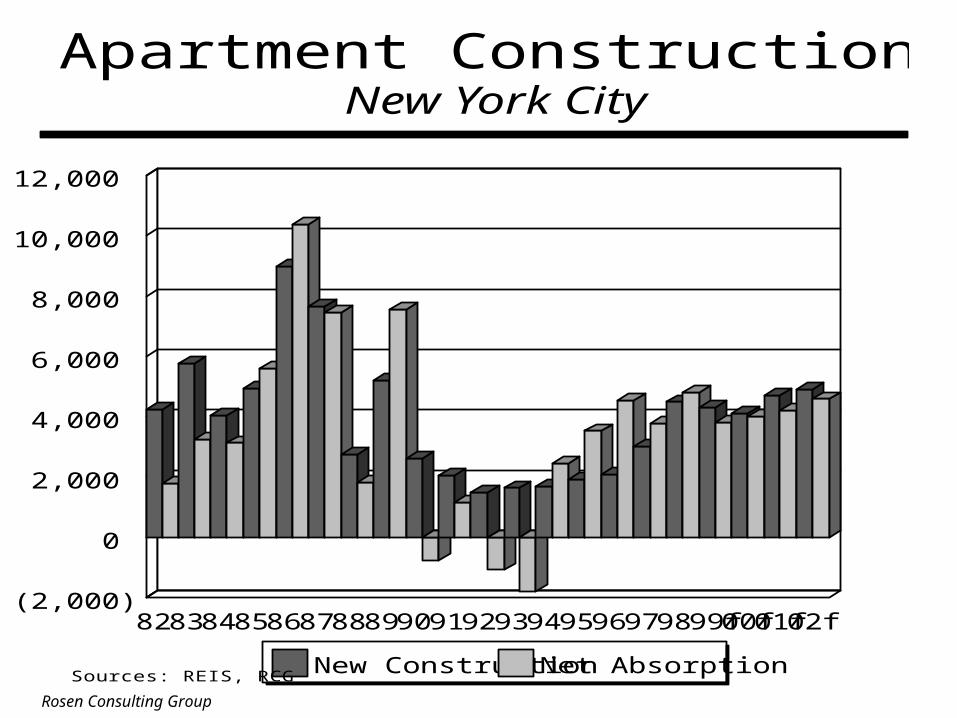
(2,000)
0
2,000
4,000
6,000
8,000
10,000
12,000
82 83 84 85 86 87 88 89 90 91 92 93 94 95 96 97 98 99f00f01f02f
New ConstructionNet Absorption
Apartment Construction & AbsorptionNew York City
Sources: REIS, RCG
Rosen Consulting Group
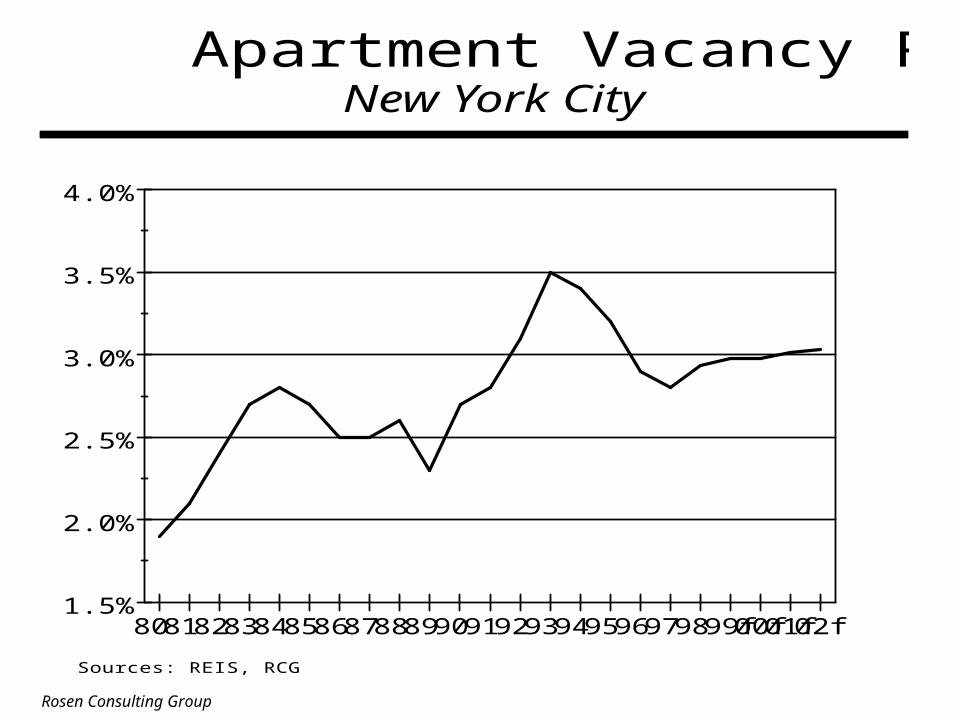
1.5%
2.0%
2.5%
3.0%
3.5%
4.0%
80 81 82 83 84 85 86 87 88 89 90 91 92 93 94 95 96 97 98 99f00f01f02f
Apartment Vacancy RateNew York City
Sources: REIS, RCG
Rosen Consulting Group
$1,400
$1,600
$1,800
$2,000
$2,200
$2,400
$2,600
$2,800
88 89 90 91 92 93 94 95 96 97 98
Upper E. Side Upper W. Side Lower Manhattan
One-Bedroom/Non-Stabilized RentsManhattan
Source: Feathered Nest
Rosen Consulting Group
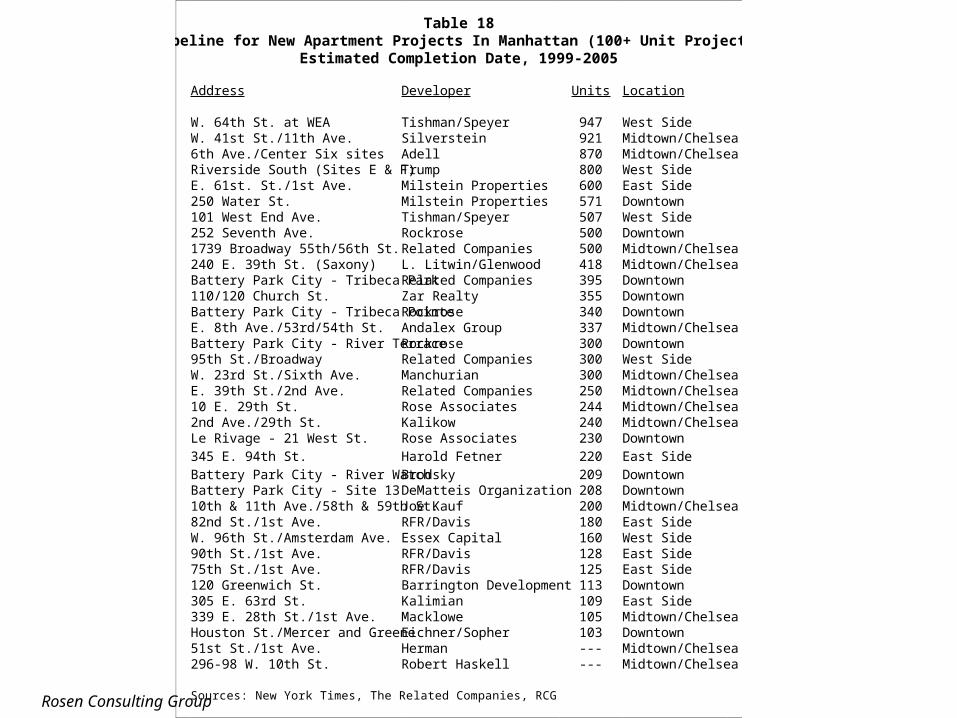
Table 18Pipeline for New Apartment Projects In Manhattan (100+ Unit Projects)
Estimated Completion Date, 1999-2005
Address Developer Units Location
W. 64th St. at WEA Tishman/Speyer 947 West SideW. 41st St./11th Ave. Silverstein 921 Midtown/Chelsea6th Ave./Center Six sites Adell 870 Midtown/ChelseaRiverside South (Sites E & F) Trump 800 West SideE. 61st. St./1st Ave. Milstein Properties 600 East Side250 Water St. Milstein Properties 571 Downtown101 West End Ave. Tishman/Speyer 507 West Side252 Seventh Ave. Rockrose 500 Downtown1739 Broadway 55th/56th St. Related Companies 500 Midtown/Chelsea240 E. 39th St. (Saxony) L. Litwin/Glenwood 418 Midtown/ChelseaBattery Park City - Tribeca Park Related Companies 395 Downtown110/120 Church St. Zar Realty 355 DowntownBattery Park City - Tribeca Pointe Rockrose 340 DowntownE. 8th Ave./53rd/54th St. Andalex Group 337 Midtown/ChelseaBattery Park City - River Terrace Rockrose 300 Downtown95th St./Broadway Related Companies 300 West SideW. 23rd St./Sixth Ave. Manchurian 300 Midtown/ChelseaE. 39th St./2nd Ave. Related Companies 250 Midtown/Chelsea10 E. 29th St. Rose Associates 244 Midtown/Chelsea2nd Ave./29th St. Kalikow 240 Midtown/ChelseaLe Rivage - 21 West St. Rose Associates 230 Downtown345 E. 94th St. Harold Fetner 220 East SideBattery Park City - River Watch Brodsky 209 DowntownBattery Park City - Site 13 DeMatteis Organization 208 Downtown10th & 11th Ave./58th & 59th St. Joe Kauf 200 Midtown/Chelsea82nd St./1st Ave. RFR/Davis 180 East SideW. 96th St./Amsterdam Ave. Essex Capital 160 West Side90th St./1st Ave. RFR/Davis 128 East Side75th St./1st Ave. RFR/Davis 125 East Side120 Greenwich St. Barrington Development 113 Downtown305 E. 63rd St. Kalimian 109 East Side339 E. 28th St./1st Ave. Macklowe 105 Midtown/ChelseaHouston St./Mercer and Greene Eichner/Sopher 103 Downtown51st St./1st Ave. Herman --- Midtown/Chelsea296-98 W. 10th St. Robert Haskell --- Midtown/Chelsea
Sources: New York Times, The Related Companies, RCG
Rosen Consulting Group
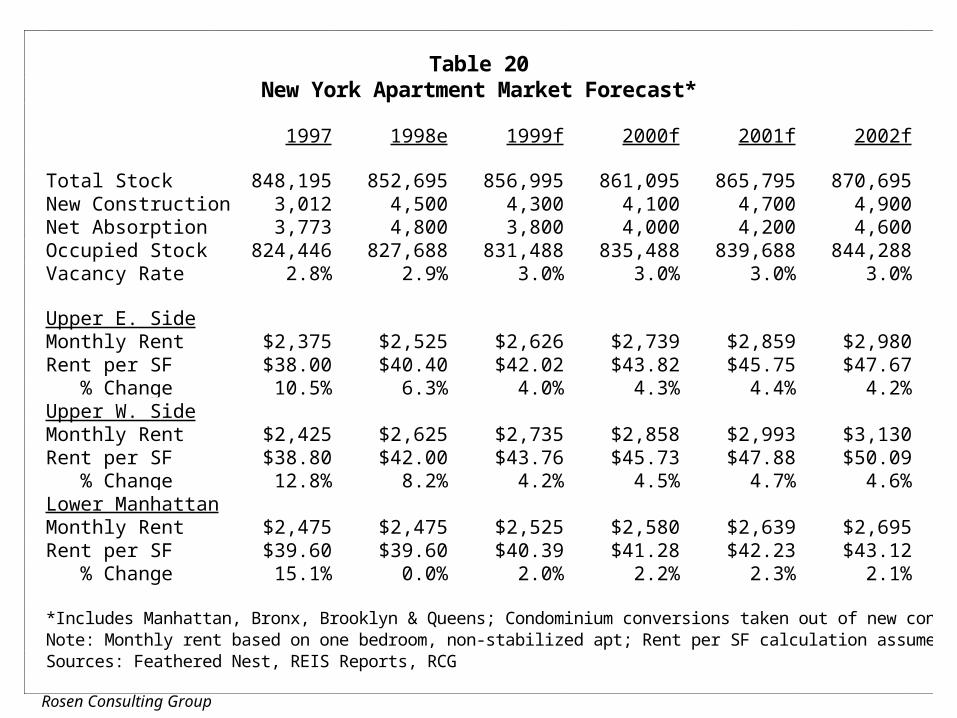
Table 20New York Apartment Market Forecast*
1997 1998e 1999f 2000f 2001f 2002f
Total Stock 848,195 852,695 856,995 861,095 865,795 870,695New Construction 3,012 4,500 4,300 4,100 4,700 4,900Net Absorption 3,773 4,800 3,800 4,000 4,200 4,600Occupied Stock 824,446 827,688 831,488 835,488 839,688 844,288Vacancy Rate 2.8% 2.9% 3.0% 3.0% 3.0% 3.0%
Upper E. SideMonthly Rent $2,375 $2,525 $2,626 $2,739 $2,859 $2,980Rent per SF $38.00 $40.40 $42.02 $43.82 $45.75 $47.67 % Change 10.5% 6.3% 4.0% 4.3% 4.4% 4.2%Upper W. SideMonthly Rent $2,425 $2,625 $2,735 $2,858 $2,993 $3,130Rent per SF $38.80 $42.00 $43.76 $45.73 $47.88 $50.09 % Change 12.8% 8.2% 4.2% 4.5% 4.7% 4.6%Lower ManhattanMonthly Rent $2,475 $2,475 $2,525 $2,580 $2,639 $2,695Rent per SF $39.60 $39.60 $40.39 $41.28 $42.23 $43.12 % Change 15.1% 0.0% 2.0% 2.2% 2.3% 2.1%
*Includes Manhattan, Bronx, Brooklyn & Queens; Condominium conversions taken out of new construction seriesNote: Monthly rent based on one bedroom, non-stabilized apt; Rent per SF calculation assumes 750 SF per aptSources: Feathered Nest, REIS Reports, RCG