ROSEBANK URBAN DEVELOPMENT FRAMEWORK · LUM Land Use Management System MOE ... RUDF Rosebank Urban...
10
CITY OF JOHANNESBURG Development Planning and Urban Management ROSEBANK URBAN DEVELOPMENT FRAMEWORK February 2008
Transcript of ROSEBANK URBAN DEVELOPMENT FRAMEWORK · LUM Land Use Management System MOE ... RUDF Rosebank Urban...
CITY OF JOHANNESBURG
Development Planning and Urban Management
ROSEBANK
URBAN DEVELOPMENT FRAMEWORK
February 2008

Prepared for
Department of Development Planning and Urban Management:
Development Planning and Facilitation
Prepared by

CONTENTS 2008
i
Contents
1. Introduction .......................................................................................................................................................................................................................................... 1
2. Objectives and Structure .................................................................................................................................................................................................................... 2
3. Rosebank Context ............................................................................................................................................................................................................................... 4
4. Policy Context ...................................................................................................................................................................................................................................... 5
5. Methodology ........................................................................................................................................................................................................................................ 6
6. Conclusion ............................................................................................................................................................................................................................................ 8
PART 2 - OBJECTIVES AND OUTCOMES ....................................................................................................................................................................................................... 9
1. National and Provincial Development Principles and Objectives ............................................................................................................................................... 10
2. City Response ..................................................................................................................................................................................................................................... 12
2.1 A Spatial Response ................................................................................................................................................................................................................. 13
2.2 A Transportation Response .................................................................................................................................................................................................... 15
2.3 Conclusion ............................................................................................................................................................................................................................... 17
PART 3 – STATUS QUO ................................................................................................................................................................................................................................. 18
1. The Study Area ................................................................................................................................................................................................................................... 18
2. Movement .......................................................................................................................................................................................................................................... 20
2.1 Transportation .......................................................................................................................................................................................................................... 22
2.2 Public Transport ........................................................................................................................................................................................................................ 25
2.2.1 Rosebank Gautrain Rapid Rail Link (GRRL) ...................................................................................................................................................................... 26
2.2.2 Bus Rapid Transit (BRT) ........................................................................................................................................................................................................ 29
2.2.3 Metro-Bus ............................................................................................................................................................................................................................. 29
2.2.4 Metered Taxi’s ..................................................................................................................................................................................................................... 31
2.2.5 Mini-Bus Taxi’s ...................................................................................................................................................................................................................... 31

CONTENTS 2008
ii
2.3 Accessibility .............................................................................................................................................................................................................................. 33
2.3.1 Urban Grain and Layout Geometry .................................................................................................................................................................................. 33
2.3.2 Urban Grain & Layout Geometry: Point Depth from Rosebank Station Entrances ...................................................................................................... 38
2.3.3 Baseline Spatial Analysis: Ease of movement and spatial accessibility analysis .......................................................................................................... 38
2.3.4 Potential Linkages ............................................................................................................................................................................................................... 43
2.4.1 Traffic Volumes .................................................................................................................................................................................................................... 47
2.4.2 Traffic Operations ............................................................................................................................................................................................................... 51
2.4.3 Traffic Volume Growth Rates ............................................................................................................................................................................................. 54
2.4.4 The stabilisation of the City of Johannesburg Traffic Signal System .............................................................................................................................. 56
2.4.5 Travel Demand Management Measures and Intelligent Transport Systems (ITS)......................................................................................................... 57
2.4.6 Parking ................................................................................................................................................................................................................................. 58
2.4.7 The Problem with Current Methodologies ........................................................................................................................................................................ 60
3.1 Land Use ................................................................................................................................................................................................................................... 63
3.1.1 Business ................................................................................................................................................................................................................................ 63
3.1.2 Residential ........................................................................................................................................................................................................................... 63
3.1.3 Vacant Land ....................................................................................................................................................................................................................... 64
3.1.4 Social Facilities .................................................................................................................................................................................................................... 64
3.2 Heritage Sites ........................................................................................................................................................................................................................... 72
3.3 Council Owned Land .............................................................................................................................................................................................................. 72
3.4 Zoning ....................................................................................................................................................................................................................................... 72
3.5 Building Height ......................................................................................................................................................................................................................... 72
3.6 Property Market ....................................................................................................................................................................................................................... 75
4. Infrastructure ...................................................................................................................................................................................................................................... 78
4.1 Water and Sanitation .............................................................................................................................................................................................................. 78
4.2 Electricity .................................................................................................................................................................................................................................. 80

CONTENTS 2008
iii
5. Public Participation ................................................................................................................................................................................................................................ 81
PART 4 - KEY FINDINGS AND CHALLENGES ............................................................................................................................................................................................... 83
1. General Assessment .......................................................................................................................................................................................................................... 83
2. Goals and Objectives ....................................................................................................................................................................................................................... 84
PART 5 - DEVELOPMENT FRAMEWORK ...................................................................................................................................................................................................... 86
1. Introduction ........................................................................................................................................................................................................................................ 86
2. Intent ................................................................................................................................................................................................................................................... 87
3. Objectives, Principles, and Standards ............................................................................................................................................................................................. 87
4. Strategies, Mechanisms and Guidelines.......................................................................................................................................................................................... 89
4.1 Define and delineate the nodal area ................................................................................................................................................................................... 89
4.2 Support an efficient movement system and network ......................................................................................................................................................... 93
4.3 Develop appropriate urban form, land use and urban design guidelines ..................................................................................................................... 103
4.3.1 Form and Mix of Uses ........................................................................................................................................................................................................ 103
4.3.2 Landmarks ......................................................................................................................................................................................................................... 108
4.3.4 Public open space – parks and squares ........................................................................................................................................................................ 110
4.4 Manage and monitor infrastructure and services provision ............................................................................................................................................. 112
4.5 Promote communication, co-ordination and engagement ............................................................................................................................................ 115
4.6 Develop a monitoring and evaluation system ................................................................................................................................................................... 117
PART 6 – IMPLEMENTATION ....................................................................................................................................................................................................................... 119
1. District Application ........................................................................................................................................................................................................................... 120
2. Interventions ..................................................................................................................................................................................................................................... 158

CONTENTS 2008
iv
FIGURES
FIGURE 1: INITIAL STUDY AREA & PROPOSED FRAMEWORK AREA ................................................................................................................................................................................... 3
FIGURE 2: ROSEBANK AS A DECENTRALISED NODE ALONG OXFORD ROAD ................................................................................................................................................................... 4
FIGURE 3: PROJECT METHODOLOGY ...................................................................................................................................................................................................................... 6
FIGURE 4: ENGAGEMENT PROCESS ........................................................................................................................................................................................................................ 7
FIGURE 5: GENERAL LEGISLATIVE AND POLICY FRAMEWORK ....................................................................................................................................................................................... 9
FIGURE 6: SPATIAL PLAN EXAMPLE ........................................................................................................................................................................................................................ 13
FIGURE 7: PUBLIC TRANSPORT ROUTES .................................................................................................................................................................................................................. 15
FIGURE 8: BRT PHASE 1 FEEDER AND COMPLEMENTARY ROUTES ................................................................................................................................................................................ 16
FIGURE 9: ROSEBANK AS REGIONAL NODE ............................................................................................................................................................................................................ 18
FIGURE 10: THE ROSEBANK STUDY AREA ............................................................................................................................................................................................................... 19
FIGURE 11: ROSEBANK STATION AND IMPACT AREA ................................................................................................................................................................................................ 21
FIGURE 12: FUNCTIONAL ROAD HIERARCHY/CLASSIFICATION .................................................................................................................................................................................. 24
FIGURE 13: PUBLIC TRANSPORT HIERARCHY ........................................................................................................................................................................................................... 25
FIGURE 14: LOCATION OF THE ROSEBANK GRRL STATION ....................................................................................................................................................................................... 27
FIGURE 15: PEDESTRIAN MOVEMENT NETWORK ...................................................................................................................................................................................................... 32
FIGURE 16: BLOCK SIZE ANALYSIS ROSEBANK ........................................................................................................................................................................................................ 35
FIGURE 17: BLOCK SIZE ANALYSIS ROSEBANK ........................................................................................................................................................................................................ 36
FIGURE 18: WALKING TIME & DISTANCE ANALYSIS ROSEBANK .................................................................................................................................................................................. 37
FIGURE 19: GLOBAL ACCESSIBILITY FOR MOTOR VEHICLES IN ROSEBANK ................................................................................................................................................................... 40
FIGURE 20: GLOBAL ACCESSIBILITY FOR PEDESTRIANS IN ROSEBANK .......................................................................................................................................................................... 41
FIGURE 21: LOCAL ACCESSIBILITY ROSEBANK......................................................................................................................................................................................................... 42
FIGURE 22: EXISTING & POTENTIAL LOCAL ACCESSIBILITY LINKAGES ........................................................................................................................................................................... 44
FIGURE 23: EXISTING & POTENTIAL GLOBAL ACCESSIBILITY LINKAGES ......................................................................................................................................................................... 46
FIGURE 24: HEAVIEST TRAFFIC VOLUMES ON THROUGH ROUTES (AM PEAK) ................................................................................................................................................................ 48
FIGURE 25: HEAVIEST TRAFFIC VOLUMES ON THROUGH ROUTES (PM PEAK) ................................................................................................................................................................. 48
FIGURE 26: FORWARD PROJECTIONS ON TRAFFIC LINK VOLUMES (AM) ...................................................................................................................................................................... 50
FIGURE 27: FORWARD PROJECTIONS ON TRAFFIC LINK VOLUMES (PM) ....................................................................................................................................................................... 50
FIGURE 28: CAPACITY ANALYSIS BASE YEAR SCENARIO .......................................................................................................................................................................................... 52
FIGURE 29: CAPACITY ANALYSIS 2016 SCENARIO ................................................................................................................................................................................................. 52
FIGURE 30: LEVEL OF SERVICE (AM PEAK) ............................................................................................................................................................................................................ 53

CONTENTS 2008
v
FIGURE 31: LEVEL OF SERVICE (PM PEAK) ............................................................................................................................................................................................................ 53
FIGURE 32: TRAFFIC GROWTH RATES (AM PEAK) .................................................................................................................................................................................................. 55
FIGURE 33: TRAFFIC GROWTH RATES (PM PEAK) ................................................................................................................................................................................................... 55
FIGURE 34: TRAFFIC SIGNALS EARMARKED FOR IMPROVEMENT ................................................................................................................................................................................... 56
FIGURE 35: EXISTING PARKING WITHIN THE ROSEBANK STUDY AREA ............................................................................................................................................................................ 59
FIGURE 36: LOCATION OF EXISTING SOCIAL FACILITIES IN ROSEBANK ......................................................................................................................................................................... 66
FIGURE 37: ROSEBANK STUDY AREA CALCULATION ZONES ...................................................................................................................................................................................... 71
FIGURE 38: COUNCIL OWNED LAND ................................................................................................................................................................................................................... 73
FIGURE 39: ROSEBANK AVAILABLE WATER INFRASTRUCTURE ..................................................................................................................................................................................... 79
FIGURE 40: ELECTRICITY BULK INFRASTRUCTURE....................................................................................................................................................................................................... 80
FIGURE 41: ENGAGEMENT PROCESS FOLLOWED .................................................................................................................................................................................................... 81
FIGURE 42: DIAGRAM REPRESENTING WALKING DISTANCES FROM ROSEBANK STATION, WITH ISOLINES AT 5 MINUTE INTERVALS SET WITHIN AN 800 M RADIUS, BASED ON INFORMATION FROM THE
SPACE SYNTAX STUDY. .............................................................................................................................................................................................................................. 90
FIGURE 43: ROSEBANK STUDY AREA BOUNDARY .................................................................................................................................................................................................... 92
FIGURE 44: CONCEPT PEDESTRIAN-ORIENTATED ROADS & AND RELIEF ROADS .............................................................................................................................................................. 93
FIGURE 45: REVISED ROAD HIERARCHY ................................................................................................................................................................................................................ 94
FIGURE 46: TRANSPORTATION NETWORK ............................................................................................................................................................................................................... 95
FIGURE 47: PEDESTRIAN MOVEMENT NETWORK ...................................................................................................................................................................................................... 97
FIGURE 48: AN URBAN TOD ............................................................................................................................................................................................................................ 103
FIGURE 49: PROPOSED HEIGHTS ........................................................................................................................................................................................................................ 105
FIGURE 50: PROPOSED PREDOMINANT LAND USE ................................................................................................................................................................................................. 106
FIGURE 51: VISUAL CONCEPTUAL REPRESENTATION OF LAND USE PROPOSAL ............................................................................................................................................................. 107
FIGURE 52: PROPOSED LANDMARKS .................................................................................................................................................................................................................. 109
FIGURE 53: URBAN OPEN SPACE NETWORK .......................................................................................................................................................................................................... 111
FIGURE 54: PROPOSED MANAGEMENT DISTRICTS ................................................................................................................................................................................................. 114
FIGURE 55: ENGAGEMENT CYCLE...................................................................................................................................................................................................................... 115
FIGURE 56: INSTITUTIONAL ARRANGEMENT ........................................................................................................................................................................................................... 116
FIGURE 58: IMPLEMENTATION FRAMEWORK ......................................................................................................................................................................................................... 119
FIGURE 59: MANAGEMENT DISTRICTS ................................................................................................................................................................................................................. 120
FIGURE 60: PROPOSED PREDOMINANT LAND USES ................................................................................................................................................................................................. 121
FIGURE 61: PROPOSED HEIGHTS ......................................................................................................................................................................................................................... 122
FIGURE 62: IMPLEMENTATION SCHEDULE .............................................................................................................................................................................................................. 168

CONTENTS 2008
vi
ABBREVIATIONS
BNG Breaking New Ground
BRT Bus Rapid Transit
CBD Central Business District
CID City Improvement District
CIF Capital Investment Framework
CoJ City of Johannesburg
DFA Development Facilitation Act, 65 of 1995
DPF Development Planning and Facilitation
DSDF Draft Spatial Development Framework
EIA Environmental Impact Assessment
GDS Growth and Development
GPD Gauteng Planning and Development Act (Act 3 of 2003)
GRRL Gautrain Rapid Rail Link
GSDF Gauteng Spatial Development Framework
GSDP Gauteng Spatial Development Perspective
HOV High Occupancy Vehicle
IDP Integrated Development Plan
ITP Integrated Transport Plan
ITS Intelligent Transport Systems

CONTENTS 2008
vii
JRA Johannesburg Roads Agency
JW Johannesburg Water
LUM Land Use Management System
MOE’s Municipal Owned Entities
MUD Mixed Use Development
NSDP National Spatial Development Perspective
POI Point of Interest
PTAI Public Transport Accessibility Index
PTAL Public Transport Accessibility Levels
RSDF Regional Spatial Development Framework
RUDF Rosebank Urban Development Framework
SANRL South African National Roads Agency
SAP Service Access Point
SDF Spatial Development Framework
SPTN Strategic Public Transport Network
TCC Transport Co-ordination Committee
TDM Travel Demand Management
TIA Traffic Impact Assessment
TOD Transit Orientated Development
UDF Urban Development Framework
VMS Variable Message Signs
1
PART 2: OBJECTIVES AND OUTCOMES 2008
PART 1 - INTRODUCTION AND BACKGROUND
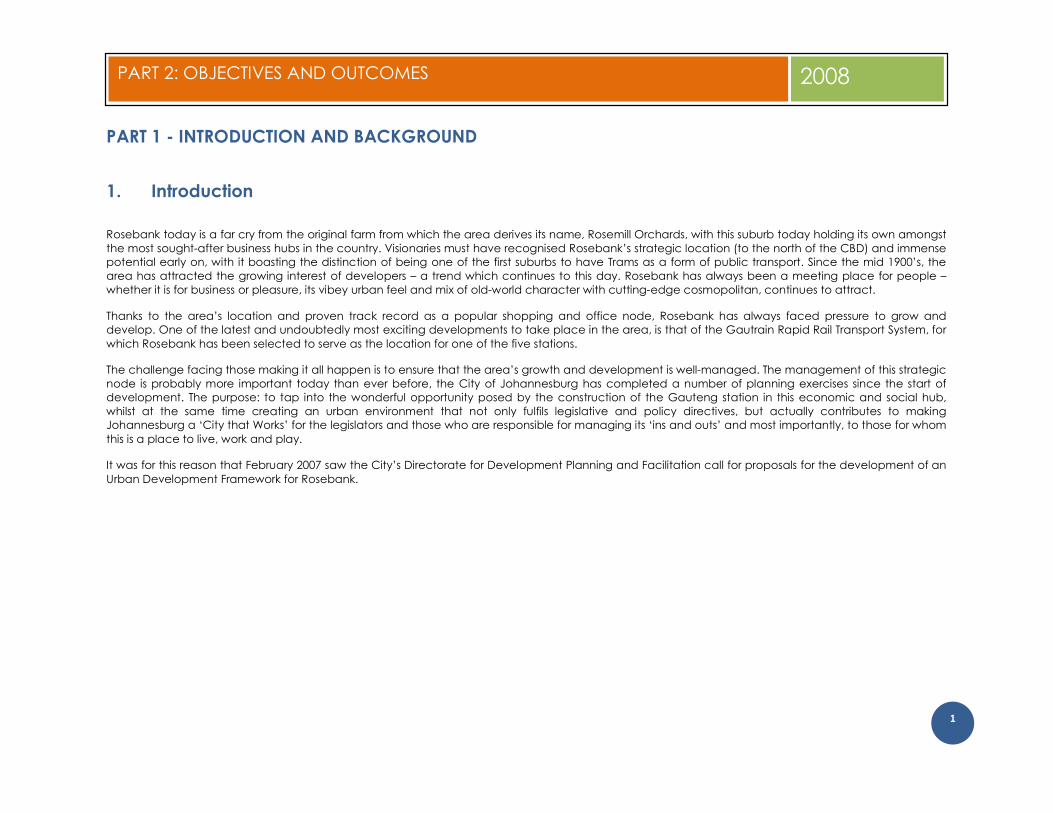
1. Introduction
Rosebank today is a far cry from the original farm from which the area derives its name, Rosemill Orchards, with this suburb today holding its own amongst the most sought-after business hubs in the country. Visionaries must have recognised Rosebank’s strategic location (to the north of the CBD) and immense potential early on, with it boasting the distinction of being one of the first suburbs to have Trams as a form of public transport. Since the mid 1900’s, the area has attracted the growing interest of developers – a trend which continues to this day. Rosebank has always been a meeting place for people – whether it is for business or pleasure, its vibey urban feel and mix of old-world character with cutting-edge cosmopolitan, continues to attract.
Thanks to the area’s location and proven track record as a popular shopping and office node, Rosebank has always faced pressure to grow and develop. One of the latest and undoubtedly most exciting developments to take place in the area, is that of the Gautrain Rapid Rail Transport System, for
which Rosebank has been selected to serve as the location for one of the five stations.
The challenge facing those making it all happen is to ensure that the area’s growth and development is well-managed. The management of this strategic node is probably more important today than ever before, the City of Johannesburg has completed a number of planning exercises since the start of development. The purpose: to tap into the wonderful opportunity posed by the construction of the Gauteng station in this economic and social hub, whilst at the same time creating an urban environment that not only fulfils legislative and policy directives, but actually contributes to making Johannesburg a ‘City that Works’ for the legislators and those who are responsible for managing its ‘ins and outs’ and most importantly, to those for whom
this is a place to live, work and play.
It was for this reason that February 2007 saw the City’s Directorate for Development Planning and Facilitation call for proposals for the development of an
Urban Development Framework for Rosebank.