Roots of Prosperity: The Economics and Finance ... - wri. · PDF fileRoots of Prosperity: The...
80
WRI.ORG ROOTS OF PROSPERITY The Economics and Finance of Restoring Land HELEN DING, SOFIA FARUQI, ANDREW WU, JUAN CARLOS ALTAMIRANO, ANDRÉS ANCHONDO ORTEGA, MICHAEL VERDONE, RENÉ ZAMORA CRISTALES, ROBIN CHAZDON, AND WALTER VERGARA
Transcript of Roots of Prosperity: The Economics and Finance ... - wri. · PDF fileRoots of Prosperity: The...

iRoots of Prosperity: The Economics and Finance of Restoring Land
WRI.ORG
ROOTS OF PROSPERITYThe Economics and Finance of Restoring Land
HELEN DING, SOFIA FARUQI, ANDREW WU, JUAN CARLOS ALTAMIRANO, ANDRÉS ANCHONDO ORTEGA, MICHAEL VERDONE, RENÉ ZAMORA CRISTALES, ROBIN CHAZDON, AND WALTER VERGARA
iiiRoots of Prosperity: The Economics and Finance of Restoring Land
TABLE OF CONTENTS1 Foreword
3 Executive Summary
9 Introduction 10 Purpose of This Report11 Why Is Land Degradation a Problem?11 How Can Degraded Land Be Restored? 15 Overcoming Barriers to the Financing
of Forest and Landscape Restoration16 State of Play: Current Financing for
Landscape Restoration17 Financing Institutions and Instruments18 What Stymies Investment in Restoration?34 Recommendations
37 Estimating the Full Set of Benefits and Costs of Forest and Landscape Restoration
40 Distinguishing between Private and Public Benefits41 Using Economic Analysis to Inform Decision-Making
on Restoration58 Recommendations
61 Conclusions
64 Abbreviations
65 Endnotes
72 References
74 Acknowledgments

WRI.org iv

1Roots of Prosperity: The Economics and Finance of Restoring Land
There has never been a more pressing moment to restore the world’s degraded landscapes. Around 2 billion hectares of land—twice the size of China—was once forested but is now degraded, with little economic or ecological value. Rarely, if ever, have humans wasted a valuable resource with such abandon. It has been estimated that land degradation costs countries more than $6 trillion per year.
But a revolution is brewing. Governments from around the world have committed to restore 160 million hectares. This is because smart politicians are now recognizing that they can gain up to 30 times their initial economic investment by restoring land. It’s good for the economy, for jobs, food security, and the planet—and it provides resilience in the face of a changing climate. However, despite these extraordinary benefits, restoration remains markedly underfunded, and the sector faces a funding gap of around US$300 billion per year.
This report provides a comprehensive analysis of the benefits and costs of restoring land in countries around the world, from Costa Rica to Norway, and from Ethiopia to the United States, demonstrating how smart policies and innovative financing can turn the tide.
The opportunity for restoration is clear. More than 20 percent of the world’s forests, agricultural land, and pastures have suffered degradation since the mid-twentieth century, impoverishing those who live off the land and contributing to greenhouse gas emissions. The report finds that finance, both public and private, for restoration is inadequate for several reasons. Environmental and social benefits are difficult to monetize, and the short-term incentives to degrade land often outweigh those to restore it. A poorly designed livestock subsidy, for example, may promote overgrazing and lead to devastating erosion. In addition, restoration projects are often small and perceived as risky investments that take too long to deliver a payout. Climate finance is inadequate and hard to access.
The authors show how these barriers are surmountable. For example, ministries of finance, agriculture, environment, and energy should work collaboratively to integrate restoration activities and offer tax credits to support the initial cost of restoration projects. Development banks can provide guarantees to mitigate risk, attracting new investors to the sector. Investors can aggregate restoration projects, diversifying their portfolios and improving financial returns.
Policymakers can use this report to better understand the economic implications of restoring land. The authors outline the main steps involved in carrying out economic analyses, bringing to light the full value of ecosystem services and social benefits as well as the costs of degradation. These insights can help governments to develop policy instruments and financing mechanisms that promote restoration on the ground. They can also help financial institutions incorporate non-monetized public benefits into financing decisions. Clean air, freshwater, and fertile soil may seem priceless, but government economists must put an accurate dollar value on their supply if their countries are to meet their restoration targets and support the hundreds of millions of people whose livelihoods depend on forests and land.
Land health is national wealth. I hope that, in reading this report, policymakers will recognize restoration as an amazing opportunity for growth, and design policy to inspire change.
FOREWORD
Andrew SteerPresident World Resources Institute

WRI.org 2

3Roots of Prosperity: The Economics and Finance of Restoring Land
EXECUTIVE SUMMARYAlmost one-quarter of the world’s land area has been degraded over
the past 50 years because of soil erosion, salinization, peatland and
wetland drainage, and forest degradation. The resulting damage,
in terms of lost ecosystem goods and services, costs the world an
estimated US$6.3 trillion a year.

▪ Forest and land degradation is estimated to cost the world more than US$6.3 trillion a year—equivalent to 8.3 percent of global GDP in 2016—and jeopardizes the livelihoods of half a billion people who depend on forests and land resources.
▪ Restoring degraded forests generates an estimated $7–30 in economic benefits for every dollar invested. Despite this favorable benefit-cost ratio, funding for landscape restoration falls short by about $300 billion a year.
▪ Investment is inadequate for several key reasons. For example, many of the benefits are public goods, which are difficult to monetize; the long-term nature of investments does not match investors’ desire for liquidity; and projects are perceived to be risky.
▪ Policy solutions and financial mechanisms exist to address these factors. Governments can shift incentives from land degradation toward restoration, implement carbon taxes and direct revenues to restoration, adopt an integrated approach across ministries, and support risk mitigation mechanisms that attract private investment.
▪ Adopting a standardized economic valuation framework would enable comparison among site- or country-level studies. Collecting analyses in a central repository would help prevent duplication of effort and provide policymakers and practitioners with access to knowledge that could lead to better decision-making.
HIGHLIGHTS Almost a quarter of the world’s land area has been degraded over the past 50 years. This is the result of soil erosion, salinization, peatland and wetland drainage, and forest degradation. The scale of the resulting damage is staggering: It costs the world an estimated $6.3 trillion a year (8.3 percent of global GDP in 2016) in lost ecosystem service value, which includes agricultural products, clean air, fresh water, climate regulation, recreational opportunities, and fertile soils (Sutton et al. 2016). Land degradation also jeopardizes the livelihoods of half a billion mostly poor people who depend on forests and agricultural lands. Declining land productivity undermines sustainable development, threatens food and water security, and leads to involuntary human migration and even civil conflict.
At the global scale, land degradation compromises the integrity of the biosphere. Biodiversity loss represents a reduction of the world’s genetic resources as well as an incalculable diminution in the richness of life on earth. Forests help to regulate the global hydrological cycle, and plant vegetation and soils are a major carbon sink helping to offset human-caused emissions of carbon dioxide. Restoring forests and other landscapes should be an urgent global priority.
In 2011, the Bonn Challenge was launched in recognition of the importance of land restoration. The goal is to restore 150 million hectares of the world’s deforested and degraded land by 2020 and 350 million hectares by 2030. As of November 2017, 39 countries had made commitments. These governments now need to turn the pledges they made into action on the ground by implementing feasible, affordable solutions that provide multiple benefits to society.

5Roots of Prosperity: The Economics and Finance of Restoring Land
About This ReportThe premise of this report is that there is an urgent need to increase financing for restoration, and there are many pathways to make this happen. This publication explains seven key barriers to investment in restoration and highlights policy solutions and financial mechanisms—many of which are already in play—that can be used to overcome these barriers. Through a discussion of the financial and economic issues surrounding restoration, the report encourages governments and practitioners to conduct analyses and enact strategies that support forest and landscape restoration.
Economic analysis can encourage investment in restoration by clearly laying out the benefits and costs of restoration projects and their distribution among stakeholders. This report helps policymakers understand the full suite of benefits and costs associated with restoration and outlines the four main analytical tools that can be used to carry out this economic analysis. The report also summarizes existing research on the economic costs and benefits of restoration in Africa and Latin America and makes the case for developing a central database of research findings on restoration.
Key Findings Restoration can be a good investment. Studies estimate that every $1 invested in restoring degraded forests can yield between $7 and $30 in economic benefits (Verdone and Seidl 2017). The impact extends well beyond the environmental sphere: Restoring 150 million hectares of degraded agricultural land could generate $85 billion in net benefits to national and local economies,1 and provide $30–40 billion a year in extra income for smallholder farmers and additional food for close to 200 million people (GCEC 2014).
Although the economic case is clear, financing for restoration activities falls well short of the need. For example, public climate finance totaled $128 billion in 2015, of which only $7 billion (about 5 percent of total climate finance) was used for financing land-use projects (Buchner et al. 2015). Funding for restoration-specific projects was a small fraction of the land-use category. In contrast, annual funding needs for conservation and restoration are estimated to range from $300 to $400 billion per year, indicating a massive financing gap (Credit Suisse et al. 2014).

WRI.org 6
Investment is currently falling short for seven main reasons:
▪ Environmental and social benefits usually have no market value. Evaluated strictly in terms of financial gains, most restoration projects generate returns that are too low to attract private investors.
▪ Incentives to degrade land outweigh incentives to restore it. Agricultural subsidies and poor enforcement of laws banning illegal logging encourage harmful practices.
▪ Land restoration is essential to mitigate climate change, yet climate finance is difficult to access. Transaction costs and bureaucracy make it time-consuming and costly for governments and other stakeholders in developing countries to access these funds.
▪ Funding for restoration is sometimes limited to small environmental budgets. Lack of awareness and coordination among ministries of environment, agriculture, and other sectors means that restoration projects tend to be underfunded.
▪ Many restoration projects are too small to be attractive to institutional investors. They may
require only $1–10 million in capital, while institutional investors often look for minimum investment sizes of at least $50–100 million.
▪ Many restoration projects have very long investment horizons of 10 to 20 years because restoration is a multiyear process. This long time frame significantly limits investor interest.
▪ Restoration is considered risky as there is no investment track record, and countries where restoration is needed most may have gover-nance and land tenure issues.
Estimating the full benefits and costs of restoration can help to prioritize projects. Economic analysis can document successes, help prioritize projects based on specific objectives, and estimate the effects of restoration on job creation, GDP growth, poverty alleviation, food security, and greenhouse gas emissions. Analyses should cover not only restored sites but also their surrounding areas, so that conclusions can be drawn about the impacts at the landscape level. The results can be used to engage a wide range of stakeholders, such as water utilities and municipal governments, that might benefit from restoration efforts coordinated at a landscape scale.

7Roots of Prosperity: The Economics and Finance of Restoring Land
Economic analysis can identify who benefits from restoration and who pays the costs. Benefit and cost estimates should be disaggregated across stakeholders to better understand who gains and who pays. Furthermore, costs and benefits can be entered into various economic tools and analytical models—such as cost-benefit analysis, cost-effectiveness analysis, spatial restoration optimization analysis, and macroeconomic analysis—that can be used to support policy and financing decisions.
Quantifying the multiple public benefits of restoration can provide the basis for blending different sources of capital. Quantification can help to allocate capital by identifying who bears the upfront costs and tailoring the structure of an investment to provide incentives for landowners. Quantification can also help to scale investment in landscape restoration by blending different sources of capital, including climate, conservation, and development finance.
RecommendationsTo increase investment in forest and land restoration, governments need to take the following actions, among others:
▪ Remove perverse incentives—such as agricultural subsidies—that make it profitable to degrade land and introduce new mechanisms that incentivize restoration.
▪ Explore the extent to which climate and development finance and revenues from carbon taxes can be directed toward restoration. This will unlock billions in funding from existing sources.
▪ Integrate restoration actions into many government bodies—such as ministries of agriculture, finance, energy, and the treasury—because land generates benefits for many areas of the economy and should not be treated as a purely environmental concern.
▪ Work with multilateral banks, philanthropic organizations, and civil society to develop financial mechanisms to leverage public and philanthropic capital and attract private investment. Mechanisms that reduce risk—including insurance guarantees, tax credits, and first-loss capital structures—can help to bring in new investors.
An improved information base and a standardized evaluation framework would enhance restoration planning and implementation in the following ways:
▪ Creating a standardized valuation framework that assesses restoration benefits and costs at both the national and community levels would enhance the robustness and comparability of economic estimates and identify where large investments in restoration could pay dividends for current and future generations. A high-level panel of social scientists—similar to the NOAA Blue Ribbon Panel created to evaluate the robustness of nonmarket valuation methods—could be established to provide guidance in the context of landscape restoration (Arrow et al. 1993).
▪ A database that includes information on the estimated costs and benefits of restoration would allow practitioners and decision-makers to share and develop knowledge. Such a repository would reduce duplication of effort, direct scarce resources to activities where more research is needed, and allow practitioners and decision-makers to quickly access the information they need. The database would be particularly useful for parties that cannot afford to conduct their own research. To do this, a global initiative that is similar to The Economics of Ecosystems and Biodiversity (TEEB), could be developed to gather evidence of restoration interventions in different regions and to make the benefits of restoration visible to the world.
Given the strong political impetus for restoration, now is the time to accelerate action on the ground. We hope this report will help to develop the foundation of a thriving restoration economy.

WRI.org 8

9Roots of Prosperity: The Economics and Finance of Restoring Land
SECTION 1
INTRODUCTIONThe world is at a critical juncture. There is momentum to accelerate
restoration implementation on the ground, and the demand for forest
and landscape restoration is expected to grow exponentially; yet
financial resources for new investments for restoration must still be
found and justified.
WRI.org 10
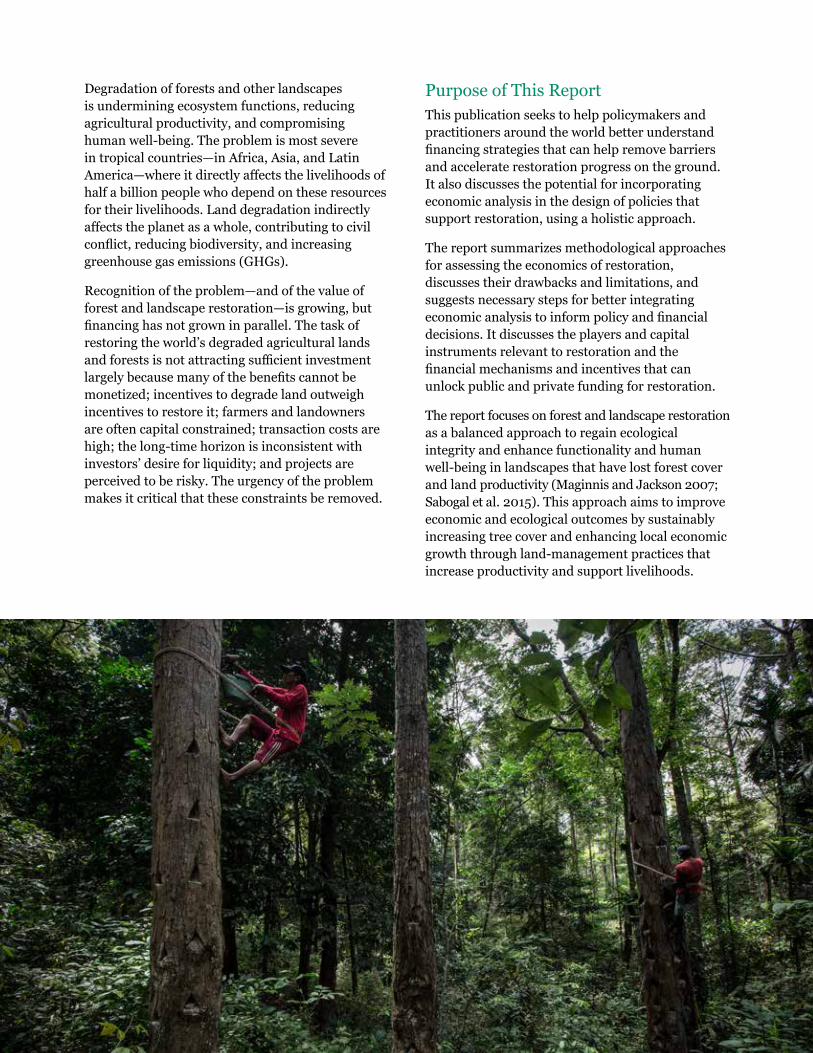
Degradation of forests and other landscapes is undermining ecosystem functions, reducing agricultural productivity, and compromising human well-being. The problem is most severe in tropical countries—in Africa, Asia, and Latin America—where it directly affects the livelihoods of half a billion people who depend on these resources for their livelihoods. Land degradation indirectly affects the planet as a whole, contributing to civil conflict, reducing biodiversity, and increasing greenhouse gas emissions (GHGs).
Recognition of the problem—and of the value of forest and landscape restoration—is growing, but financing has not grown in parallel. The task of restoring the world’s degraded agricultural lands and forests is not attracting sufficient investment largely because many of the benefits cannot be monetized; incentives to degrade land outweigh incentives to restore it; farmers and landowners are often capital constrained; transaction costs are high; the long-time horizon is inconsistent with investors’ desire for liquidity; and projects are perceived to be risky. The urgency of the problem makes it critical that these constraints be removed.
Purpose of This ReportThis publication seeks to help policymakers and practitioners around the world better understand financing strategies that can help remove barriers and accelerate restoration progress on the ground. It also discusses the potential for incorporating economic analysis in the design of policies that support restoration, using a holistic approach.
The report summarizes methodological approaches for assessing the economics of restoration, discusses their drawbacks and limitations, and suggests necessary steps for better integrating economic analysis to inform policy and financial decisions. It discusses the players and capital instruments relevant to restoration and the financial mechanisms and incentives that can unlock public and private funding for restoration.
The report focuses on forest and landscape restoration as a balanced approach to regain ecological integrity and enhance functionality and human well-being in landscapes that have lost forest cover and land productivity (Maginnis and Jackson 2007; Sabogal et al. 2015). This approach aims to improve economic and ecological outcomes by sustainably increasing tree cover and enhancing local economic growth through land-management practices that increase productivity and support livelihoods.

11Roots of Prosperity: The Economics and Finance of Restoring Land
Why Is Land Degradation a Problem? Degraded land has lost some of its natural productivity as a result of human-caused processes, natural disturbances, and their interaction. Land degradation is driven by unsustainable management practices adopted by individuals, communities, governments, companies, and financial institutions. These practices suffer from the “tragedy of the commons” (Hardin 1968), which occurs when stakeholders of a shared resource act independently, based on their own self-interest, and those actions collectively result in the depletion or degradation of the resource.
About 25 percent of global land area is subject to some degree of degradation, including soil erosion, salinization, peatland and wetland drainage, and forest degradation (FAO 2011a). More than one-quarter of agricultural lands are classified as severely degraded (FAO 2011b).
Agriculture is the most significant driver of deforestation (DeFries et al. 2010). Increasing demand for beef, soy, and palm oil have put tremendous pressures on native forests in emerging and developing countries, causing deforestation and degradation. At the same time, unsustainable timber harvesting and hunting pressures are eroding the last remaining intact forests. Globally, the intact forest landscape area decreased by 91.9 million hectares—7 percent—between 2000 and 2013, with tropical regions contributing 60 percent of the reduction (Potapov et al. 2017).
A direct consequence of deforestation and land degradation is the decline in the productivity of forest and agricultural ecosystems (Turner et al. 2016), which can cost the world as much as $6.3 trillion a year in terms of lost ecosystem service value, which includes agricultural products, clean air, freshwater, disturbance regulation, climate regulation, recreational opportunities, and fertile soils (Sutton et al. 2016). Landscape degradation and deforestation also contribute to global warming and exacerbate losses in biodiversity. They pose major threats to local communities and drive global trends such as rural unemployment, mass migration, and civil conflict as productive and healthy land becomes increasingly scarce (Potapov et al. 2017; Hansen et al. 2013; Venter et al. 2016).
How Can Degraded Land Be Restored? Forest and landscape restoration is not only about recovering the ecological functionalities of degraded terrestrial ecosystems. It is also about changing land-management practices in ways that sustain local economic growth—through rotational grazing or reductions in stocking rates on degraded pastures, for example (Calle et al. 2012). For severely degraded landscapes, restoration may require the replacement of existing land uses with alternative land uses that support the recovery of landscape functionality, provide habitats for biodiversity, stop losses from degradation, and provide economic benefits to stakeholders (Brancalion and Chazdon 2017).
Generally speaking, land restoration efforts can be classified as active or passive. Active restora-tion includes reforestation, silvopastoral practices, forest conservation, agroforestry, and soil conser-vation practices whereas passive restoration may require the land to be set aside to recover naturally for a period of time, making it a difficult approach when the land is critical to local livelihoods. Often, active restoration approaches cost more than pas-sive restoration practices, and the cost of prevent-ing land degradation is much lower than the cost
Launched in September 2011, the Bonn Challenge is a global effort to restore 150 million hectares of the world’s deforested and degraded land by 2020 and 350 million hectares by 2030. Since its inception, the Bonn Challenge has attracted 47 commitments submitted by national governments, states and regional programs to restore 156 million hectares of land and leveraged billions of dollars of public and private finance for implementation on the ground. The International Union for Conservation of Nature (IUCN) estimates that the annual net benefit to national and local economies of restoring 150 million hectares is approximately $85 billion per year. About 90 percent of this value is market-related benefits, bringing direct additional income opportunities for rural communities. It is estimated that achieving the 350-million-hectare goal will generate about $170 billion per year in net benefits from watershed protection and improved crop yields and forest products and could sequester up to 1.7 gigatons of carbon dioxide equivalent annually.
Source: http://www.bonnchallenge.org/content/challenge.
BOX 1.1 | WHAT IS THE BONN CHALLENGE?

WRI.org 12
AFR100 partner countries have committed to restore 83.3 million hectares of land by 2030. Nearly $1 billion of public finance and $500 million of private investment has been earmarked to support the effort. In the Sahel dryland region, millions of hectares have already been restored by smallholders through planting and stewarding the growth of billions of trees on land that had been barren for decades. In East Africa, countries have committed to restore tens of millions of hectares through multiple restoration interventions that create ecosystem benefits. Site-level analyses of individual restoration activities—such as agroforestry, improved woodlot management, and improved farm fallows—show that these activities can increase the annual incomes of individual smallholders by $111–125 per household (Franzel 2005).
In Latin America and the Caribbean, 16 national governments, three states, and three regional programs have pledged to restore 53.2 million hectares through Initiative 20x20. They have attracted $2.1 billion in impact investment pledges from 19 financial partners. Since 2014, with the support of Initiative 20x20, nearly 40 private finance projects are now at various stages of implementation, with close to 10 million hectares under restoration.a These projects have restored intact and/or degraded forested lands and nonforested lands, including cropland and pasture.
The common goal of restoration in the region is to improve livelihoods in rural areas and reduce poverty. Practices and priorities vary across countries. In Mexico, for example, about 88 percent of
restoration pledges focus on improving agricultural land with climate-smart practices. Guatemala plans to fulfill its pledge to restore 1.2 million hectares with agroforestry, silvopastoral practices, and reforestation activities. Agroforestry and silvopastoral practices have helped increase agricultural productivity in Costa Rica, El Salvador, and Mexico. Reforestation (including natural regeneration of forests) has significantly increased carbon sequestration and improved flood control in Brazil and Guatemala and generated substantial economic benefits from ecotourism and recreation in Colombia and Costa Rica.
BOX 1.2 | RESTORING LAND IN AFRICA AND LATIN AMERICA AND THE CARIBBEAN
of rehabilitating already severely degraded lands or physically replacing lost soil and nutrients (Shif-eraw et al. 2015; Chazdon and Uriarte 2016).
The international community, including the private sector, recognizes the urgent need to restore forests and other lands. As of November 2017, 39 countries have committed to restore more than 150 million hectares through the Bonn Challenge (Box 1.1).
Several regional initiatives have emerged to support countries’ efforts to achieve the Bonn Challenge. They include Initiative 20x20 in Latin America and the Caribbean, AFR100 in Africa, and ministerial roundtables in Latin America, East and Central Africa, and the Asia-Pacific region. As of October 2017, there were 47 commitments to the Bonn Challenge to restore 156 million hectares of land.2 The largest commitments were from AFR1003 (53 percent) and Initiative 20x204 (34 percent), both of which were country-led restoration efforts chaired by World Resources Institute (Box 1.2).
However, implementation of the pledges made by countries has lagged, in part due to a major shortfall in funding. For example, only a tiny fraction of climate finance goes to restoration,
despite the strong link between forests and climate. Mobilizing financing has been difficult partly because there are systemic barriers in place: Most of the value generated by restoration is not monetized, and there are perverse incentives that support degradation rather than restoration. Fortunately, there are solutions to these problems, and some countries have already begun to act on them.
This report discusses how to accelerate flows of public and private capital to support restoration programs of strategic importance to countries and regions. For instance, governments can adopt carbon taxes and direct tax proceeds to restoration, while climate funds can incorporate restoration projects into their investment pipeline because planting trees and other vegetation is a critical solution for climate change. At the same time, there are ways to bring more private investors to the table through risk mitigation instruments and aggregation of projects.
Economic analysis is needed to make the full value of ecosystem services and the costs of degradation visible. Such analysis should estimate the full benefits and costs of investing in restoration—not
Note: a http://www.wri.org/news/2017/11/statement-landmark-21-billion-earmarked-restore-degraded-lands-latin-america-offering.

13Roots of Prosperity: The Economics and Finance of Restoring Land
only the benefits and costs to the people making the investment but also the benefits to the world as a whole (such as carbon sequestration, biodiversity, and improved water and soil retention); not only the short-term returns but also the benefits over the long term (including benefits that may not accrue for decades or longer). Economic analysis should describe the time frame for both investments and benefits and incorporate the cost of inaction because doing nothing will cost more in the long run.
Landscape restoration must thus be approached as an integral part of national green growth strategies. It requires a holistic approach to strengthen collaboration among government ministries and channel financial support from climate funds, environmental defense funds, and sustainable development funds into restoration initiatives.
Given the strong political impetus for restoration, now is a critical moment to accelerate restoration implementation on the ground. Any postponed action or inaction is the most expensive course in the long run—not only in terms of money, but also in the form of human progress.
Landscape restoration must thus be approached as an
integral part of national green growth strategies. It
requires a holistic approach to strengthen collaboration
among government ministries and channel financial support from
climate funds, environmental defense funds, and
sustainable development funds into restoration
initiatives.

WRI.org 14
15Roots of Prosperity: The Economics and Finance of Restoring Land
SECTION 2
OVERCOMING BARRIERS TO THE FINANCING OF FOREST AND LANDSCAPE RESTORATIONFunding to restore degraded land falls far short of what is needed.
Governments and investors have an opportunity to expand both public
and private finance for restoration, making it possible for people and the
planet to benefit from healthier landscapes around the world.
WRI.org 16
State of Play: Current Financing for Landscape RestorationRestoring degraded land has the potential to offer numerous environmental, social, and economic benefits, from carbon sequestration to job creation and improved agricultural productivity. However, financing of forest and land restoration is inad-equate, with possibly catastrophic implications for sustainable development and the environment.
What can be done to increase finance for restoration? How can both the public and private sectors be mobilized? In this section, we cover the key barriers to restoration finance, including those mentioned above, and present financial mechanisms and policy solutions that can bridge the investment gap. We start by providing a brief background on the investors and financial instruments that are relevant to restoration.
Financing Institutions and InstrumentsFinance is a branch of the economy that consists of capital (i.e., money, assets, investments, credits, etc.), institutions, instruments, markets, and investors that make up the financial system. The words finance, capital, investments, funds, and funding are often used interchangeably.
The finance world can be divided into three categories:
▪ Private finance, which is capital managed with the primary goal of earning a financial return for the investor.
▪ Public finance, which is funding from govern-ment bodies. While a financial return to the government agency providing the funds may be present in some cases, public investments are largely made to generate social, environmental, and economic benefits for the public.
Source: WRI.
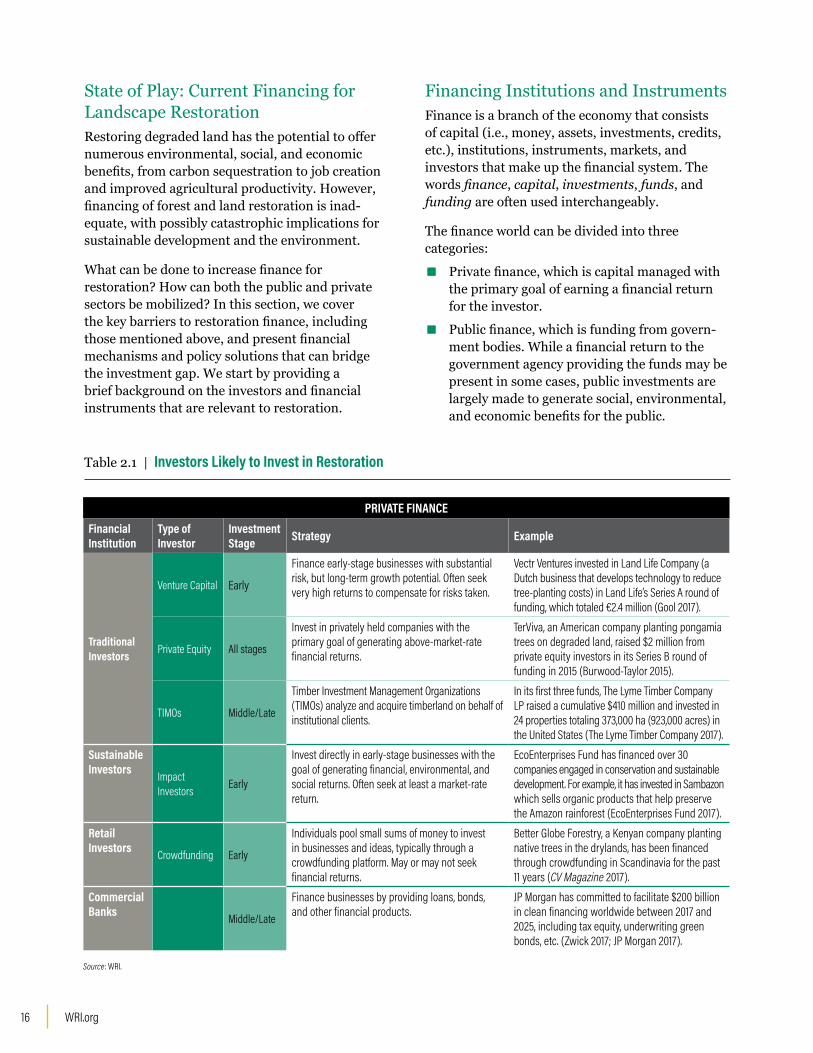
Table 2.1 | Investors Likely to Invest in Restoration
PRIVATE FINANCEFinancial Institution
Type of Investor
Investment Stage Strategy Example
Traditional Investors
Venture Capital Early
Finance early-stage businesses with substantial risk, but long-term growth potential. Often seek very high returns to compensate for risks taken.
Vectr Ventures invested in Land Life Company (a Dutch business that develops technology to reduce tree-planting costs) in Land Life’s Series A round of funding, which totaled €2.4 million (Gool 2017).
Private Equity All stages
Invest in privately held companies with the primary goal of generating above-market-rate financial returns.
TerViva, an American company planting pongamia trees on degraded land, raised $2 million from private equity investors in its Series B round of funding in 2015 (Burwood-Taylor 2015).
TIMOs Middle/Late
Timber Investment Management Organizations (TIMOs) analyze and acquire timberland on behalf of institutional clients.
In its first three funds, The Lyme Timber Company LP raised a cumulative $410 million and invested in 24 properties totaling 373,000 ha (923,000 acres) in the United States (The Lyme Timber Company 2017).
Sustainable Investors Impact
Investors Early
Invest directly in early-stage businesses with the goal of generating financial, environmental, and social returns. Often seek at least a market-rate return.
EcoEnterprises Fund has financed over 30 companies engaged in conservation and sustainable development. For example, it has invested in Sambazon which sells organic products that help preserve the Amazon rainforest (EcoEnterprises Fund 2017).
Retail Investors Crowdfunding Early
Individuals pool small sums of money to invest in businesses and ideas, typically through a crowdfunding platform. May or may not seek financial returns.
Better Globe Forestry, a Kenyan company planting native trees in the drylands, has been financed through crowdfunding in Scandinavia for the past 11 years (CV Magazine 2017).
Commercial Banks Middle/Late
Finance businesses by providing loans, bonds, and other financial products.
JP Morgan has committed to facilitate $200 billion in clean financing worldwide between 2017 and 2025, including tax equity, underwriting green bonds, etc. (Zwick 2017; JP Morgan 2017).

17Roots of Prosperity: The Economics and Finance of Restoring Land
Table 2.1 | Investors Likely to Invest in Restoration (continued)
Source: WRI.
PUBLIC FINANCE AND PHILANTHROPYFinancial Institution
Type of Investor
Investment Stage Strategy Example
National Banks Middle/Late
Government-owned banks that provide financing for projects that further national interests. Financing may be at market or below-market rates.
BNDES (National Bank for Economic and Social Development) launched its Atlantic Forest Initiative in Brazil, investing R$36 million ($12 million) to restore 3,000 ha across 14 projects (BNDES 2015).
Multilateral Development Banks
Early/Middle
Finance projects and businesses for the purpose of economic development, typically with social and/or environmental benefits in mind. Often provide financing at below-market rates, including grants and no-cost loans.
The $775 million Forest Investment Program, managed by the Climate Investment Funds (CIF) under the World Bank, provides grants and low-interest loans to reduce deforestation and forest degradation in developing countries (CIF 2017).
Governments
Bilateral Governments Early/Middle
Assistance from one government to another in order to achieve development, philanthropic, and/or political goals. The assistance may take the form of financial aid, capacity building, or other forms of structural support.
In 2016, the government of Norway pledged $50 million to continue its environmental funding partnership with the government of Indonesia, which aims to restore 2 million ha of peatland by 2020 (Ecosystem Marketplace 2016).
Municipal & State Governments
Early
Develop programs and implement projects at the municipal or state level. The government is primarily interested in creating public benefit and is interested in a mix of economic, social, and environmental returns.
Reflorestar is a statewide program in Espirito Santo, Brazil, that pays farmers to implement sustainable land-use practices that restore land. Through the program, the state seeks to restore 80,000 ha by the end of 2018 (De Miranda Benini et al. 2015; Padovezi 2015).
Federal Governments Early
Develop policies and programs and implement incentives and projects at the national level. The government is primarily interested in creating public benefit and is interested in a mix of economic, social, and environmental returns.
In 1997, Costa Rica’s government implemented a 3.5% tax on fossil fuels to fund environmental services, including reforestation and conservation (GOCR 1996).
Philanthropy
Civil Society Early
Engage in a wide variety of actions, from implementing projects and fundraising to research and advocacy.
The Nature Conservancy has developed a portfolio of 32 Water Funds worldwide, where water users provide funding to reforest and conserve watersheds. More than 2.8 million ha of watersheds stand to benefit (TNC 2017).
Foundations Early
Develop programs to implement projects directly or build capacity through research and policy. Foundations may contribute their own funds or attract investment from public and private partners.
The Restore the Earth Foundation is collaborating with stakeholders to restore 400,000 ha of land in the Mississippi River Basin. To date, the foundation has raised $40 million from public and private partners and restored over 20,000 ha of land (Restore the Earth Foundation 2016).
Wealthy Individuals
Wealthy Individuals
Finance projects through a variety of means, either by donating to existing groups and projects or developing their own organizations. Projects are developed based on their personal interests and typically do not seek a financial return.
The Inikea Sow-a-Seed Project, a personal endeavor for IKEA’s founder, Ingvar Kamprad, has been restoring a degraded forest in Borneo and plans to reach 18,500 ha by 2020 (IKEA 2017).
▪ Philanthropic finance, which is charitable giving by individuals or organizations, typically with no intention of earning a financial return. In this regard, philanthropic finance and public finance are similar; subsequent references to
“public finance” in this report refer to both public and philanthropic capital.
Table 2.1 summarizes the institutions and investors that are most likely to invest in restoration.

WRI.org 18
Impact investors are private investors that invest in early- and mid-stage companies with the intention of generating financial, social, and environmental returns. In a recent survey conducted by the Global Impact Investing Network (GIIN), the pool of impact investing capital is greater than $114 billion, with over $22 billion invested in 2016 (Mudaliar et al. 2017). This pool has grown significantly, increasing by 18 percent compounded annually between 2013 and 2015 (Mudaliar et al. 2016).
Like other private investors, most impact investors look for attractive financial returns. In a survey of impact investors conducted by GIIN, only a third of respondents indicated that they were interested in investments that might yield below-market-rate returns.
Impact investors are already involved in restoration. Through WRI’s Initiative 20x20 and AFR100, impact investors have earmarked over $2 billion to invest in restoration. Given the potential for restoration to deliver on the triple-bottom line—yielding social, environmental, and financial returns—impact investors may play an increasing role in financing.
BOX 2.1 | WHAT DO IMPACT INVESTORS WANT?
Figure 2.1 | Expectations of Returns Vary across Investor Types
Philanthropy Government fundingNational and
development banksPublic-private partnerships Impact investors Traditional investors
Source: Adapted from FAO and UNCCD 2015.
Different investors have different expectations with respect to returns (Figure 2.1). Their goals also differ. Some investors in the public sector, such as the government, may be primarily driven by social and environmental benefits. On the other hand, most traditional investors in the private
sector focus on financial returns. For example, only 26 percent of all professionally managed assets globally are related to sustainable investing (GSIA 2017). Notably, impact investment seeks to invest in private companies that earn a financial return and also have social and environmental impact (Box 2.1).
For money to flow, a financial instrument or mechanism is required to channel funding from investors to investees. Private-sector financial instruments include equity, loans, and bonds (including green bonds, see Box 2.2). Fiscal instruments include grants, subsidies, taxes, and other incentives (Table 2.2).
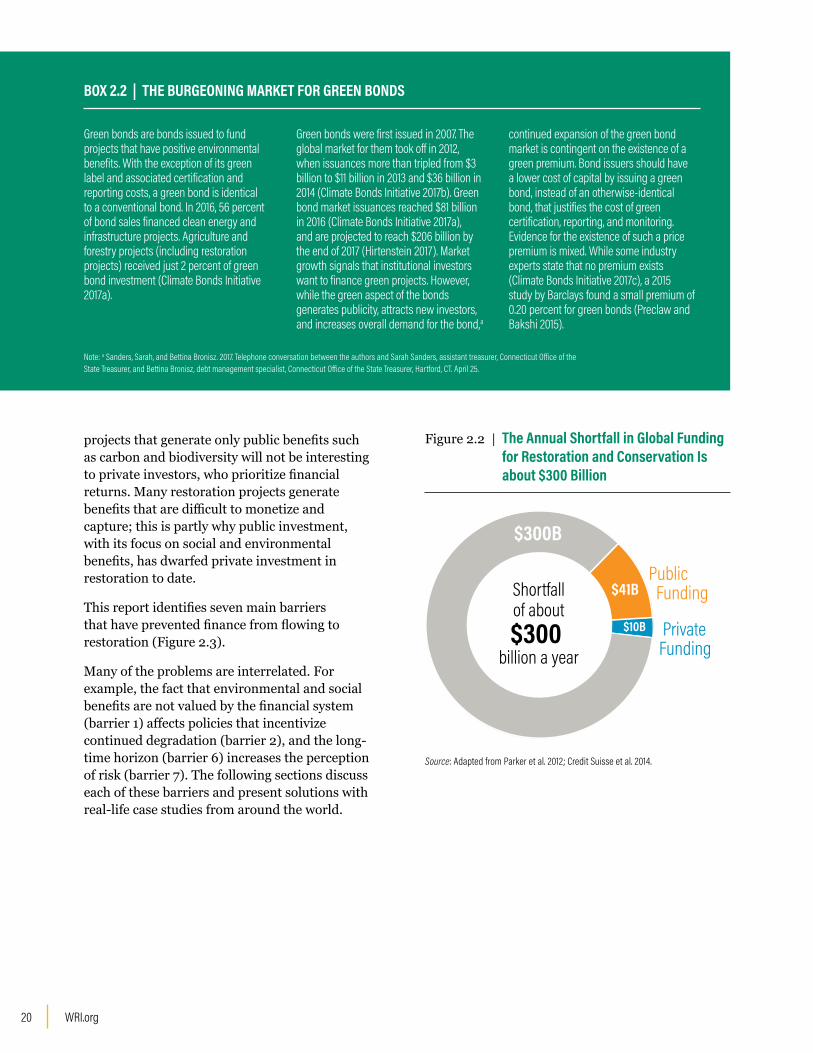
What Stymies Investment in Restoration?Upholding the targets set by the Bonn Challenge of restoring 150 million hectares of degraded lands globally by 2020 could create $84 billion in annual material benefits (IUCN 2012). But the investment needed to generate these benefits is not being made. Indeed, it is estimated that approximately $350 billion is needed for conservation and restoration, but only $50 billion is available (Credit Suisse et al. 2014), and 80 percent of that comes from public sources (Parker et al. 2012). Private investment is only about $10 billion a year (Figure 2.2).
ENVIRONMENTAL AND/OR SOCIAL RETURN FINANCIAL RETURN

19Roots of Prosperity: The Economics and Finance of Restoring Land
Given the sheer size of private capital markets, the potential of private finance to fund restoration has been a topic of much debate. The world’s private financial stock, including stock market capitalization, bonds, and loans, rose to $171 trillion
Table 2.2 | Financial Instruments and Fiscal Measures Relevant to Restoration
TYPE INSTRUMENT CHARACTERISTICS RELEVANCE TO RESTORATION EXAMPLE
PRIV
ATE
Equity
▪ Investor provides capital in exchange for ownership stake in the business
▪ Value of equity is tied to performance of underlying venture
Investment in commercial activities where there may be significant risk
Komaza raised over $4 million in equity from Novastar Ventures and Mulago Foundation during its Series A investment round (AngelList 2017).
Loan
▪ Investor lends capital to borrower, who repays the principal amount, with a specified rate of interest, over a period of time
▪ Loan is provided by a single lending source
▪ Periodic interest payments, typically twice a year
Suited to restoration projects that generate regular cash flow
The U.S. Small Business Administration offers loans up to $5 million for small and medium-size businesses (SBA 2017).
Bond
▪ Debt instrument where issuer borrows funds, to be repaid with interest over a specified period of time
▪ Similar to loans, but is often syndicated among many lenders and is thus suited to raise large amounts of capital
▪ Periodic interest payments, typically twice a year
Large-scale restoration businesses that produce regular cash flow
In 2013, the state of Massachusetts issued $100 million worth of green bonds, $24 million of which financed environmental remediation and habitat restoration projects (duPont et al. 2015).
PUBL
IC
Grant
▪ Funds given to an organization or individual for a particular purpose
▪ Grants are nonrepayable
▪ May be one-time or renewable
Can help projects reach an investment-ready stage
Brazil’s Amazon Fund makes grants to projects that contribute to reducing deforestation in the Amazon forest (Amazon Fund 2017).
Subsidy
▪ A financial benefit from governments to groups or industries, lowering costs for the producer
▪ Typically in the form of a cash payment or tax break
Improves the economic returns as the government bears a portion of the cost
From 2011 to 2014, the Indonesian government subsidized around $12 billion in infrastructure investments annually for palm oil-producing regions (McFarland et al. 2015).
Tax
▪ Imposed by governments on individual’s or organization’s incomes or profits
▪ Can also be added to the price of goods and services
▪ Goal is to redistribute benefits equitably and to fund government programs
Includes taxes on carbon and fossil fuels
The Brazilian state of Espírito Santo levies a 3 percent tax on oil and gas products. With the revenues from the tax, the state’s government aims to restore 80,000 ha of Atlantic Forest by the end of 2018 (Padovezi 2015).
Other Incentives
Direct or indirect payment to procure a desired behavior or return
Includes interest rate concessions and credit guarantees
The World Bank Group offers multiple incentives, such as Partial Credit Guarantees, to cover debt investments in private projects (World Bank Group 2016).
Source: Adapted from FAO and UNDCC 2015.
in 2010, compared to $63 trillion of world GDP in the same year (Roxburgh et al. 2011; World Bank 2011). However, investor interest in a specific restoration project will depend on what benefits are generated and to whom they accrue. For example,
WRI.org 20
projects that generate only public benefits such as carbon and biodiversity will not be interesting to private investors, who prioritize financial returns. Many restoration projects generate benefits that are difficult to monetize and capture; this is partly why public investment, with its focus on social and environmental benefits, has dwarfed private investment in restoration to date.
This report identifies seven main barriers that have prevented finance from flowing to restoration (Figure 2.3).
Many of the problems are interrelated. For example, the fact that environmental and social benefits are not valued by the financial system (barrier 1) affects policies that incentivize continued degradation (barrier 2), and the long-time horizon (barrier 6) increases the perception of risk (barrier 7). The following sections discuss each of these barriers and present solutions with real-life case studies from around the world.
Green bonds are bonds issued to fund projects that have positive environmental benefits. With the exception of its green label and associated certification and reporting costs, a green bond is identical to a conventional bond. In 2016, 56 percent of bond sales financed clean energy and infrastructure projects. Agriculture and forestry projects (including restoration projects) received just 2 percent of green bond investment (Climate Bonds Initiative 2017a).
Green bonds were first issued in 2007. The global market for them took off in 2012, when issuances more than tripled from $3 billion to $11 billion in 2013 and $36 billion in 2014 (Climate Bonds Initiative 2017b). Green bond market issuances reached $81 billion in 2016 (Climate Bonds Initiative 2017a), and are projected to reach $206 billion by the end of 2017 (Hirtenstein 2017). Market growth signals that institutional investors want to finance green projects. However, while the green aspect of the bonds generates publicity, attracts new investors, and increases overall demand for the bond,a
continued expansion of the green bond market is contingent on the existence of a green premium. Bond issuers should have a lower cost of capital by issuing a green bond, instead of an otherwise-identical bond, that justifies the cost of green certification, reporting, and monitoring. Evidence for the existence of such a price premium is mixed. While some industry experts state that no premium exists (Climate Bonds Initiative 2017c), a 2015 study by Barclays found a small premium of 0.20 percent for green bonds (Preclaw and Bakshi 2015).
BOX 2.2 | THE BURGEONING MARKET FOR GREEN BONDS
Figure 2.2 | The Annual Shortfall in Global Funding for Restoration and Conservation Is about $300 Billion
Shortfallof about$300
billion a year
Public Funding
PrivateFunding
$10B
$41B
$300B
Source: Adapted from Parker et al. 2012; Credit Suisse et al. 2014.
Note: a Sanders, Sarah, and Bettina Bronisz. 2017. Telephone conversation between the authors and Sarah Sanders, assistant treasurer, Connecticut Office of the State Treasurer, and Bettina Bronisz, debt management specialist, Connecticut Office of the State Treasurer, Hartford, CT. April 25.

21Roots of Prosperity: The Economics and Finance of Restoring Land
Barrier #1: Environmental and Social Benefits Usually Have No Market ValueProblemRestoration creates a plethora of benefits for society, but many of them do not translate into financial returns (Milcu et al. 2013). Only a small share of the benefits from natural landscapes accrue to the market (Figure 2.4).
Figure 2.3 | Main Barriers to Scaling Up Restoration Finance
S Y S T EM I C B A R R I E R S
Environmental and social benefits often have no market value
Incentives to degrade land outweigh incentives to restore land
B A R R I E R S TO P U B L I C F I N A N C E
Climate finance is difficult to access
Restoration funding is often confined to small environmental budgets
B A R R I E R S TO P R I VAT E F I N A N C E
Many restoration projects are too small in size to attract private finance
Restoration often requiresa long investment time
horizon (e.g. 10–20 years)
Restoration is considered to be a risky investment
Source: WRI authors.
Coastal wetlands
Inland wetlands
Tropical forests
Temperate forests
Woodlands
Grasslands
0% 20% 40% 60% 80% 100%
% Market value % Non-market value
15%
35%
22%
16%
45%
6%
85%
65%
78%
84%
55%
94%
Figure 2.4 | Average Proportion of Market vs. Non-market Value by Land Type
Source: Adapted from De Groot 2012.
By excluding restoration’s environmental and social benefits from the calculation and focusing only on monetary benefits, financial analysis portrays restoration as delivering lower returns than other investments. Without policies or mechanisms to remedy this problem, many restoration projects will remain unattractive to private investment.

WRI.org 22
Solutions QUANTIFYING THE FULL NET BENEFITS OF RESTORATION BY INTERNALIZING ENVIRONMENTAL AND SOCIAL BENEFITS
Quantifying the full set of benefits of restoration is crucial. (Section 3 discusses the various methods that can be used to do so.) Private investors may be willing to finance a subset of restoration projects that provide clear revenue streams. Figure 2.5 shows four potential ways in which restoration can generate commercial returns.
To shift the financing paradigm in a way that allows restoration to be financed at scale, financial systems must internalize the environmental and social benefits of restoration projects. Where markets do not exist, government intervention is required to put institutions and markets in place to reflect these public goods.
One strategy is to develop favorable policy instru-ments that will reallocate financial resources and/or redirect incentives toward restoration activi-ties. In a Payments for Ecosystem Services (PES) system, the government pays farmers and landown-ers to implement practices that deliver a bundle of ecosystem benefits. PES has been widely applied
Figure 2.5 | Sources of Revenue from Restoration
Source: Faruqi and Wu 2017.
To shift the financing paradigm in a way that allows restoration to be
financed at scale, financial systems must internalize
the environmental and social benefits of
restoration projects.
to capture the values of carbon sequestration and water yields, improving the financial returns from restoring land. Carbon pricing is another common approach to channel financing into low-carbon projects, including restoration, and can be used by public and private actors alike (Box 2.3).
23Roots of Prosperity: The Economics and Finance of Restoring Land
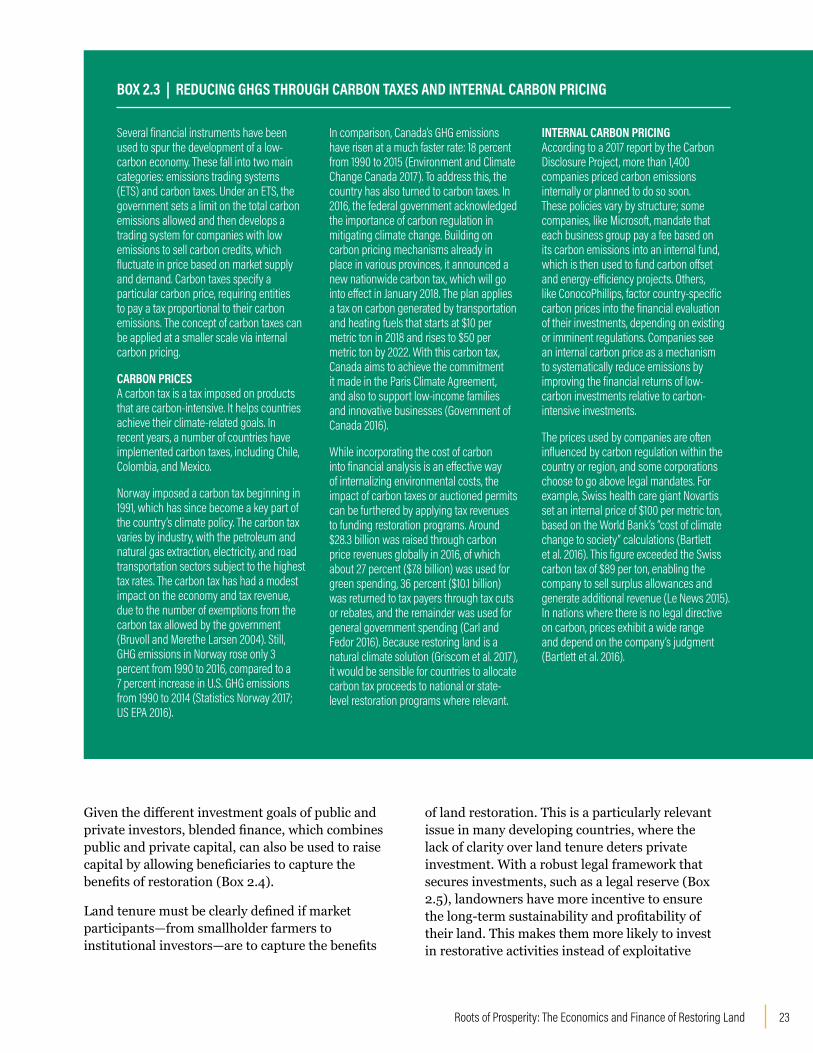
Several financial instruments have been used to spur the development of a low-carbon economy. These fall into two main categories: emissions trading systems (ETS) and carbon taxes. Under an ETS, the government sets a limit on the total carbon emissions allowed and then develops a trading system for companies with low emissions to sell carbon credits, which fluctuate in price based on market supply and demand. Carbon taxes specify a particular carbon price, requiring entities to pay a tax proportional to their carbon emissions. The concept of carbon taxes can be applied at a smaller scale via internal carbon pricing.
CARBON PRICESA carbon tax is a tax imposed on products that are carbon-intensive. It helps countries achieve their climate-related goals. In recent years, a number of countries have implemented carbon taxes, including Chile, Colombia, and Mexico.
Norway imposed a carbon tax beginning in 1991, which has since become a key part of the country’s climate policy. The carbon tax varies by industry, with the petroleum and natural gas extraction, electricity, and road transportation sectors subject to the highest tax rates. The carbon tax has had a modest impact on the economy and tax revenue, due to the number of exemptions from the carbon tax allowed by the government (Bruvoll and Merethe Larsen 2004). Still, GHG emissions in Norway rose only 3 percent from 1990 to 2016, compared to a 7 percent increase in U.S. GHG emissions from 1990 to 2014 (Statistics Norway 2017; US EPA 2016).
In comparison, Canada’s GHG emissions have risen at a much faster rate: 18 percent from 1990 to 2015 (Environment and Climate Change Canada 2017). To address this, the country has also turned to carbon taxes. In 2016, the federal government acknowledged the importance of carbon regulation in mitigating climate change. Building on carbon pricing mechanisms already in place in various provinces, it announced a new nationwide carbon tax, which will go into effect in January 2018. The plan applies a tax on carbon generated by transportation and heating fuels that starts at $10 per metric ton in 2018 and rises to $50 per metric ton by 2022. With this carbon tax, Canada aims to achieve the commitment it made in the Paris Climate Agreement, and also to support low-income families and innovative businesses (Government of Canada 2016).
While incorporating the cost of carbon into financial analysis is an effective way of internalizing environmental costs, the impact of carbon taxes or auctioned permits can be furthered by applying tax revenues to funding restoration programs. Around $28.3 billion was raised through carbon price revenues globally in 2016, of which about 27 percent ($7.8 billion) was used for green spending, 36 percent ($10.1 billion) was returned to tax payers through tax cuts or rebates, and the remainder was used for general government spending (Carl and Fedor 2016). Because restoring land is a natural climate solution (Griscom et al. 2017), it would be sensible for countries to allocate carbon tax proceeds to national or state-level restoration programs where relevant.
INTERNAL CARBON PRICINGAccording to a 2017 report by the Carbon Disclosure Project, more than 1,400 companies priced carbon emissions internally or planned to do so soon. These policies vary by structure; some companies, like Microsoft, mandate that each business group pay a fee based on its carbon emissions into an internal fund, which is then used to fund carbon offset and energy-efficiency projects. Others, like ConocoPhillips, factor country-specific carbon prices into the financial evaluation of their investments, depending on existing or imminent regulations. Companies see an internal carbon price as a mechanism to systematically reduce emissions by improving the financial returns of low-carbon investments relative to carbon-intensive investments.
The prices used by companies are often influenced by carbon regulation within the country or region, and some corporations choose to go above legal mandates. For example, Swiss health care giant Novartis set an internal price of $100 per metric ton, based on the World Bank’s “cost of climate change to society” calculations (Bartlett et al. 2016). This figure exceeded the Swiss carbon tax of $89 per ton, enabling the company to sell surplus allowances and generate additional revenue (Le News 2015). In nations where there is no legal directive on carbon, prices exhibit a wide range and depend on the company’s judgment (Bartlett et al. 2016).
BOX 2.3 | REDUCING GHGS THROUGH CARBON TAXES AND INTERNAL CARBON PRICING
Given the different investment goals of public and private investors, blended finance, which combines public and private capital, can also be used to raise capital by allowing beneficiaries to capture the benefits of restoration (Box 2.4).
Land tenure must be clearly defined if market participants—from smallholder farmers to institutional investors—are to capture the benefits
of land restoration. This is a particularly relevant issue in many developing countries, where the lack of clarity over land tenure deters private investment. With a robust legal framework that secures investments, such as a legal reserve (Box 2.5), landowners have more incentive to ensure the long-term sustainability and profitability of their land. This makes them more likely to invest in restorative activities instead of exploitative

WRI.org 24
In the western United States, forest fires are a major environmental hazard, devastating ecosystems and communities while releasing massive amounts of carbon into the air. Restoration treatments, typically carried out by the U.S. Forest Service, are essential to keep forest fires under control. However, in recent years, tightening budgets have forced the government agency to shift funds away from restoration, spending it on fighting existing fires instead. This forms a vicious cycle, as worsening forest fires prevent the U.S. Forest Service from investing in restoration needed to keep the fires in check.
The Forest Resilience Bond—a blended finance model developed by the American Forest Foundation, Blue Forest Conservation, and WRI—uses private capital to fund restoration activities that deliver long-term cost savings for water utilities, electric companies, and the U.S. Forest Service. Beneficiaries pass along savings to investors through payments to the Forest Resilience Bond. This public-private partnership effectively breaks the cycle of worsening forest fires by funding restoration projects that otherwise would not occur (Blue Forest Conservation 2017).
BOX 2.4 | FINANCING RESTORATION THROUGH FOREST RESILIENCE BONDS
Countries in the Organisation for Economic Co-operation and Development (OECD) provided $672 billion in support to agriculture between 2013 and 2015 (OECD 2016). Between 2010 and 2012, China provided $160 billion, the United States $145 billion, and Europe $121 billion. Annual subsidies to the agricultural sector in Indonesia and Brazil—the countries that have suffered the greatest forest loss since 2000—are currently estimated at $27 billion and $10 billion, respectively (McFarland et al. 2015). These figures represent 3 percent of Indonesia GDP and 0.6 percent of GDP in Brazil (World Bank 2017a). These subsidies dwarf the economic incentives to reduce deforestation and land degradation.
Agricultural subsidies are often justified on the grounds that they help small farmers. For example, the Malawi government has invested great sums in its Agricultural Inputs Support Programme ($117 million in 2007–2008, equivalent to 9 percent of the government budget) on the basis of improving smallholder self-sufficiency in maize production (Baltzer et al. 2012). But many programs are structured as direct payments to farmers on a per-hectare basis, disproportionately benefiting large industrial farms. In the United States, for example, the top 1 percent of crop subsidy recipients received an average subsidy of $227,000 a year in crop insurance in 2011, whereas the bottom 80 percent received just $5,000 (EWG 2016).
To compound the problem, in the forestry sector, governance and enforcement are often lacking. People who illegally harvest timber face very little risk of getting caught (FAO and ITTO 2005). A 2015 investigation by Greenpeace revealed that a Brazilian logging company, Agropecuaria Santa Efigenia Ltd., exploited the anonymity of the global timber market to sell more than $7 million of illegal wood, filing fraudulent paperwork to claim unreasonably high levels of logging in legal areas, and then illegally deforesting other parts of the Amazon (Greenpeace 2015). Without sufficient incentives to halt deforestation and to start restoration, high prices for endangered tree species will continue to drive land degradation.
activities that generate short-term returns at the cost of degrading land. In one example, Ding et al. (2016b) estimated that securing land rights in the Amazon would generate up to $1.5 trillion in returns.
Barrier #2: Incentives to Degrade Land Outweigh Incentives to Restore It ProblemMaking the economic case for restoration is very difficult when governments provide incentives for continued land degradation by promoting and subsidizing unsustainable practices. Such incentives are common in agriculture, where governments pay farmers directly and subsidize the inputs they use (e.g., water, fertilizers, electricity, fuel) (OECD 2010; ITC 2017). Partly as a result, 73 percent of forest loss in tropical and subtropical countries is caused by agricultural expansion (FAO 2016).

25Roots of Prosperity: The Economics and Finance of Restoring Land
SolutionsElimination of environmentally harmful agricul-tural subsidies would reduce the incentives to degrade land. Efforts to bolster transparency and enforcement in the timber sector would also shift incentives away from deforestation.
Eliminating or reforming subsidies is difficult, however, because large agricultural enterprises have outsized influence in political spheres (The Economist 2015). Agricultural subsidies have been a politically charged topic for decades, in part because they are often seen as a means of ensuring food security or stimulating development (Melendez-Ortiz et al. 2009).
An argument can be made for increasing subsidies for restoration. Pigouvian subsidies—subsidies that support economic activity with external benefits—can spur restoration projects; such subsidies can improve social welfare by capturing the environ-mental and social benefits that are not reflected in market prices (Lawn 2016). This approach may be more politically palatable than eliminat-ing agricultural subsidies, because it is framed as
Brazil’s forest code requires all private rural properties to maintain a fixed proportion of their land in natural vegetation. This share ranges from 20 percent in the Atlantic forest to 80 percent in the Amazon (May et al. 2015). This legal reserve was put in place in 1934 to ensure the supply of wood for fuel (Mueller and Alston 2007). Although the original objective has become irrelevant, the regulation has remained in place and has become a valuable tool for promoting biodiversity conservation and restoration.
Brazil’s legal reserve indirectly helps to raise finance for restoration by penalizing parties that do not comply with the law. Some banks take this liability into account when lending by deducting the liability from the amount of the collateral (the land value). This reduces the funds available to those who don’t comply, thereby indirectly placing a value on natural capital.
BOX 2.5 | PROMOTING CONSERVATION AND RESTORATION THROUGH ESTABLISHMENT OF A “LEGAL RESERVE” IN BRAZIL
stimulating the economy instead of taking benefits away. Another option is to reform existing subsidies rather than trying to create new incentives. This is the approach Costa Rica took (Box 2.6).
Barrier #3: Climate Finance Is Difficult to Access ProblemIn response to the growing urgency of climate change, several multilateral funds have been established to finance climate solutions (Table 2.3). In 2017, funds such as the Amazon Fund ($1.7 billion), the Forest Investment Program ($722 million), and the United Nations Convention to Combat Desertification (UNCCD) Land Degradation Neutrality Fund ($300 million) support countries’ efforts to reduce degradation and promote land restoration (CFU 2017; UNCCD 2017). The Amazon Fund and the Forest Investment Program are part of the REDD+ (Reducing Emissions from Deforestation and Forest Degradation) financing mechanism. Nearly 90 percent of REDD+’s funding comes from the public sector, with the Norwegian government being the largest donor (Norman and Nakhooda 2015).
Unfortunately, these funds are the select few that focus on land use and forests. Most climate finance is aimed at renewable energy, energy efficiency, and transportation (Denier et al. 2015). According to a report by the Climate Policy Initiative, public climate finance from development institutions and international finance totaled $128 billion in 2015. Financing for land use projects accounted for just $7 billion of that total (Buchner et al. 2015), and only a fraction of those funds went to restoration. Despite current trends, climate funds are a promising source of financing for restoration projects because of the clear link with land use. Indeed, restoration and avoided forest conversion can provide more than one-third of the climate mitigation needed to keep global warming below 2°C in 2030 (Griscom et al. 2017).
The climate funds listed in table 2.3 have funded several restoration projects. Table 2.4 describes some of them.

WRI.org 26
In 1943, 77 percent of Costa Rica’s land area was covered with forest; by 1987 the country’s forest had declined to just 21 percent (GOCR 2011). The significant reduction in forest land, especially between 1950 and 1985, was driven by a national strategy that looked to agriculture for economic growth, resulting in the expansion of croplands and pastures (World Bank 2000).
The phase-out of subsidies to the beef industry in the 1980s, as well as a drop in the price of beef and dairy in
international markets, contributed to a rapid decline in Costa Rica’s livestock population (Calvo-Alvarado et al. 2009). Reduced competition for forestland from cattle ranching became the most significant enabler of land restoration in the country (Buckingham and Hanson 2015).
Other factors also contributed to the revival of Costa Rica’s forests, including growth in the ecotourism industry and improvements in land tenure. Policy also mattered. In 1997 the government
implemented a payment for an ecosystem services scheme, funded by a 3.5% tax on fossil fuels, that encouraged reforestation and the conservation of thousands of hectares of forests (GOCR 1996).
These factors, particularly the elimination of cattle subsidies in 1991, increased the country’s forest cover from 29 percent in 1991 to 54 percent in 2015 (GOCR 2011; World Bank 2017b).
BOX 2.6 | REVERSING THE DECLINE IN FOREST COVER IN COSTA RICA
Table 2.3 | Descriptions of Multilateral Climate Funds
FUND THEMATIC FOCUS FINANCIAL INSTRUMENTS USED
ELIGIBILITY FOR FUNDING
CUMULATIVE PLEDGED FUNDING ( US$ BILLIONS)
AVERAGE TIME FOR PROJECT APPROVAL
Adaptation Fund Climate adaptation GrantsDeveloping country Parties in the Kyoto Protocol particularly vulnerable to climate change
$0.54 8–13 months
Global Environment Facility - 5 and 6a
Climate mitigation; capacity building
Grants; concessional loans; equity; risk mitigation
Developing country Parties and conventions served by the GEF; Parties eligible to receive World Bank funding or UNDP technical assistance
$3.03 18–22 months
Green Climate Fund Climate mitigation; climate adaptation
Grants; concessional loans; risk mitigation; equity
All developing country Parties to the UNFCCC $10.3 -
Least Developed Countries Fund Climate adaptation Grants Least developed countries
(LDCs) $1.19 19 months
Pilot Program for Climate Resilience
Climate adaptation; capacity building
Grants; concessional loans; equity; risk mitigation
World’s most vulnerable countries and small islands $1.19 19–45 months
Strategic Climate Fund
Climate mitigation; climate adaptation
Grants; concessional loans; risk mitigation; equity
Official development assistance-eligible developing countries with active multilateral development bank (MDB) country programs
$2.74 18 months
Note: a In addition to climate, GEF focuses on biodiversity conservation. Source: Adapted from Amerasinghe et al. 2017.

27Roots of Prosperity: The Economics and Finance of Restoring Land
When evaluated for climate funding, restoration proposals may face barriers, including unclear revenue streams, the lack of an investment track record, and the possibility of project failure (Sunding 2011; Godefroid et al. 2011; Wuethrich 2007). In addition, the multitude of funds—each with different rules, requirements, steps, and procedures—has led to high transactions costs.
These inefficiencies are particularly burdensome for least developed countries, which lack the resources and expertise needed to meet the administrative challenges. Well-intentioned efforts to ensure accountability in climate funding have made it difficult to deploy capital. The approval process can take two years or more, increasing costs and bureaucracy and limiting access to funding.
Table 2.4 | Examples of Restoration Projects Funded by Global Climate Funds
FUND PROJECT YEAR FUNDED
DURATION (YEARS) DESCRIPTION AMOUNT FUNDED
($ MILLIONS)
Adaptation Fund Ecosystem-based approaches for reducing the vulnerability of food security to the impacts of climate change in the Chaco region (Paraguay)
2017 3.5 Aims to contribute through the conservation and restoration of forests, agroforestry, agro-ecological farming, etc., to reducing the vulnerability of food security to the impacts of climate change in the El Chaco region of Paraguay
7.12
Green Climate Fund (GCF)
Sustainable landscapes (Madagascar)
2016 10 Sustainable landscape measures (restoration included) to enhance the resilience of smallholders, reducing greenhouse gas emissions and channeling private finance into climate-smart investments in agriculture
69.8 (23 percent cofinanced)
Global Environmental Facility (GEF) – 6
Forest landscape restoration in the Mayaga region (Rwanda)
2017 5 To secure biodiversity and carbon benefits while simultaneously strengthening the resilience of livelihoods through forest and landscape restoration
32.2 (79 percent cofinanced)
Pilot Project for Climate Resilience
Sustainable land and water resources management project (Mozambique
2014 5 Project seeking to strengthen capacity of Mozambique’s rural communities to address challenges of climate
35.8 (56 percent cofinanced)
Source: Adapted from AF 2017; GCF 2016a; GEF 2016; and PPCR 2017.
The Green Climate Fund (GCF) was founded in 2010 by the United Nations Framework Convention on Climate Change (UNFCCC). It supports developing countries’ efforts to implement actions for climate adaptation and mitigation.
To accomplish its goals, the GCF uses a variety of financial instruments, including grants, loans, and equity investments. It has funded a variety of projects based on restoration, including sustainable landscape management in Madagascar and the development of Argan tree plantations in degraded areas of Morocco (GCF 2016b).
The GCF implemented a fast-track process that simplifies the accreditation process for entities already accredited by other funds, such as the Adaptation Fund and the Global Environment Facility (Masullo et al. 2015). Fast-track accreditation has reduced the accreditation process from more than six months to a maximum of three months (GCF 2016c).
BOX 2.7 | FAST-TRACK PROCESS

WRI.org 28
SolutionsStructural reform and greater flexibility of funding institutions are key to increasing the number of restoration projects that receive funding (Thomas et al. 2010). The application process for global climate funds can be shortened by coordinating to reduce duplication and inefficiency. In lieu of broad, overlapping areas of investment, funds could agree to target specific, complementary thematic areas, reducing confusion over who funds what. Developing standardized requirements and procedures across different funds would also simplify access, increase speed, and reduce transaction costs for applicants (Amerasinghe et al. 2017). These issues are not unique to climate funds but have been endemic in the development world for decades.
Financing from climate funds often consists of grants or concessional loans that can be layered with other capital sources that have higher hurdle rates for financial return. When structuring deals, climate funds can leverage capital from other sources. Each dollar of climate funding reportedly attracts an average of $2.20–9.70 in cofinancing (Amerasinghe et al. 2017). The Green Climate Fund (Box 2.7) recently announced a commitment of $500 million to absorb risks for low-carbon projects; such funds could help create the risk-return profiles necessary to attract private capital (GCF 2017).
Targeted policies can also help to increase the flow of climate finance toward restoration. Governments should explicitly acknowledge restoration as part of their climate mitigation strategies, known under the Paris Agreement as Nationally Determined Contributions (NDCs); actively track funds that are appropriated for restoration; and set specific targets for restoration finance. When seeking access to global climate funds, governments should be able to channel funds into restoration while providing transparency to funders. While land-use projects, including restoration, only receive a slim fraction of climate funds, these policy actions would signal to global climate funds the importance of restoration and increase the percentage of climate funds directed toward restoration.
Barrier #4: Funding for Restoration Often Comes Only from Small Environmental Budgets ProblemMany governments have begun to allocate funding to restoration projects. But government officials may treat restoration as a purely environmental concern and confine it to the environmental budget. This is often the case in Africa, based on WRI’s experience through AFR100.
The impact of restoration extends well beyond the environmental sphere. Restoring 150 million hectares of degraded agricultural land can provide $30–40 billion a year in extra income for smallholder farmers and additional food for close to 200 million people (GCEC 2014). Lack of awareness and coordination between ministries of agriculture and environment on restoration policies means that restoration projects may fail to be funded.
There are also strong connections between restoration and energy. For example, erosion from deforested and degraded lands near hydroelectric plants can cause sedimentation in reservoirs, affecting electricity production (Sáenz et al. 2014). Restoring land is strongly linked to energy in sub-Saharan Africa, where trees supply about 70 percent of energy needs in the form of fuelwood (DIE 2016). These ties are ignored when restoration is limited to the environmental sphere.
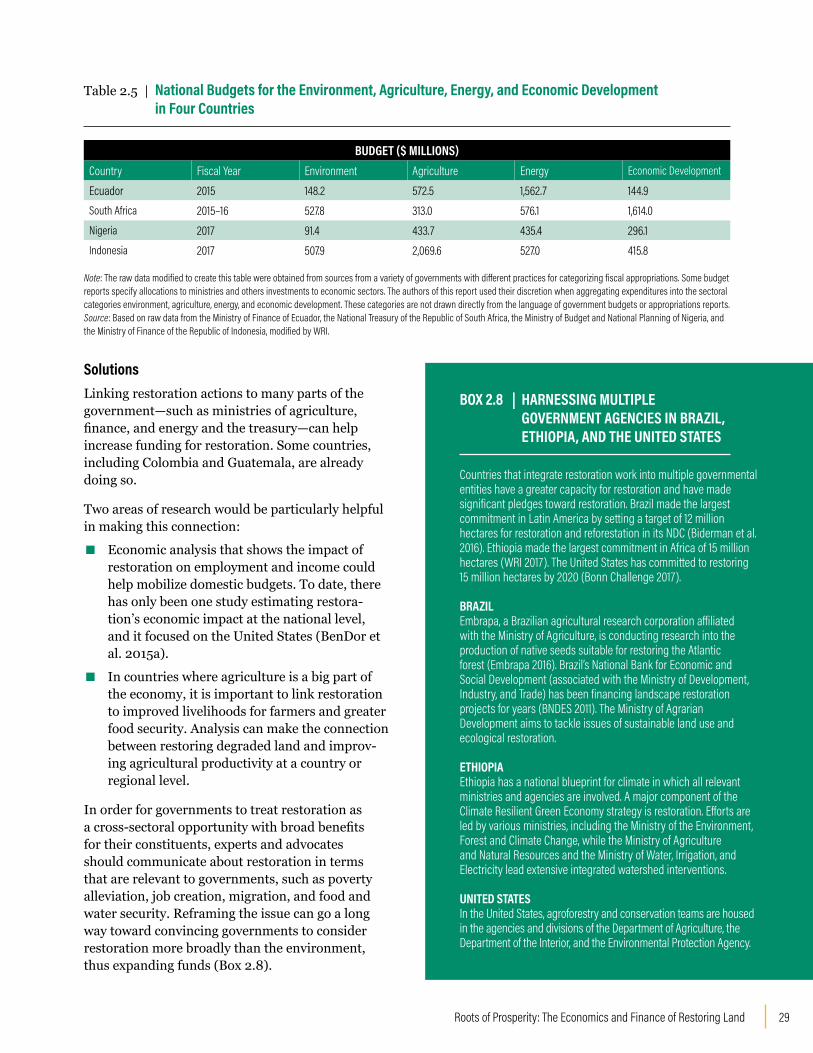
Environmental ministries often have smaller budgets than other government bodies. Table 2.5 compares national budgets for four sectors of the economy in a sample of four countries, chosen on the basis of geographic diversity. In this set of countries, environmental expenditure is on average 40 percent lower than agricultural spending, 45 percent lower than energy spending, and 28 percent lower than spending on economic development. These figures grossly understate the gap in financing for restoration, as restoration usually receives only a small share of the environmental budget.
29Roots of Prosperity: The Economics and Finance of Restoring Land
SolutionsLinking restoration actions to many parts of the government—such as ministries of agriculture, finance, and energy and the treasury—can help increase funding for restoration. Some countries, including Colombia and Guatemala, are already doing so.
Two areas of research would be particularly helpful in making this connection:
▪ Economic analysis that shows the impact of restoration on employment and income could help mobilize domestic budgets. To date, there has only been one study estimating restora-tion’s economic impact at the national level, and it focused on the United States (BenDor et al. 2015a).
▪ In countries where agriculture is a big part of the economy, it is important to link restoration to improved livelihoods for farmers and greater food security. Analysis can make the connection between restoring degraded land and improv-ing agricultural productivity at a country or regional level.
In order for governments to treat restoration as a cross-sectoral opportunity with broad benefits for their constituents, experts and advocates should communicate about restoration in terms that are relevant to governments, such as poverty alleviation, job creation, migration, and food and water security. Reframing the issue can go a long way toward convincing governments to consider restoration more broadly than the environment, thus expanding funds (Box 2.8).
Table 2.5 | National Budgets for the Environment, Agriculture, Energy, and Economic Development in Four Countries
BUDGET ($ MILLIONS)Country Fiscal Year Environment Agriculture Energy Economic Development
Ecuador 2015 148.2 572.5 1,562.7 144.9South Africa 2015–16 527.8 313.0 576.1 1,614.0Nigeria 2017 91.4 433.7 435.4 296.1Indonesia 2017 507.9 2,069.6 527.0 415.8
Note: The raw data modified to create this table were obtained from sources from a variety of governments with different practices for categorizing fiscal appropriations. Some budget reports specify allocations to ministries and others investments to economic sectors. The authors of this report used their discretion when aggregating expenditures into the sectoral categories environment, agriculture, energy, and economic development. These categories are not drawn directly from the language of government budgets or appropriations reports.Source: Based on raw data from the Ministry of Finance of Ecuador, the National Treasury of the Republic of South Africa, the Ministry of Budget and National Planning of Nigeria, and the Ministry of Finance of the Republic of Indonesia, modified by WRI.
Countries that integrate restoration work into multiple governmental entities have a greater capacity for restoration and have made significant pledges toward restoration. Brazil made the largest commitment in Latin America by setting a target of 12 million hectares for restoration and reforestation in its NDC (Biderman et al. 2016). Ethiopia made the largest commitment in Africa of 15 million hectares (WRI 2017). The United States has committed to restoring 15 million hectares by 2020 (Bonn Challenge 2017).
BRAZILEmbrapa, a Brazilian agricultural research corporation affiliated with the Ministry of Agriculture, is conducting research into the production of native seeds suitable for restoring the Atlantic forest (Embrapa 2016). Brazil’s National Bank for Economic and Social Development (associated with the Ministry of Development, Industry, and Trade) has been financing landscape restoration projects for years (BNDES 2011). The Ministry of Agrarian Development aims to tackle issues of sustainable land use and ecological restoration.
ETHIOPIAEthiopia has a national blueprint for climate in which all relevant ministries and agencies are involved. A major component of the Climate Resilient Green Economy strategy is restoration. Efforts are led by various ministries, including the Ministry of the Environment, Forest and Climate Change, while the Ministry of Agriculture and Natural Resources and the Ministry of Water, Irrigation, and Electricity lead extensive integrated watershed interventions.
UNITED STATESIn the United States, agroforestry and conservation teams are housed in the agencies and divisions of the Department of Agriculture, the Department of the Interior, and the Environmental Protection Agency.
BOX 2.8 | HARNESSING MULTIPLE GOVERNMENT AGENCIES IN BRAZIL, ETHIOPIA, AND THE UNITED STATES

WRI.org 30
Barrier #5: Many Restoration Projects Are Too Small to Attract Investors ProblemGlobally, capital is concentrated in large funds that manage billions of dollars. Whether these funds are public or private, deal size matters: A $5 billion fund is not interested in making a $5 million investment, because the transaction costs (expressed as a percent-age of the investment) make such an investment unat-tractive. Large funds look for minimum investment sizes of $50–100 million, as the larger deal size lowers transaction costs. As global markets grow, minimum investment sizes continue to increase, making it increasingly important to aggregate small projects.
Most restoration projects require $1–10 million in capital. Their small size means they are usually of limited interest to institutional investors. Most smallholders and investors in developing countries are not able to make these investments because domestic capital markets in their countries are unde-veloped, and banks are unwilling to lend to projects for which transactions costs and risk are high.
Restoration projects with attractive financial returns exist, but there is no standard medium or process to define or identify them, making the search process more time-consuming and costly (Credit Suisse and McKinsey 2016). In contrast, multiple venues exist to pitch business ideas and attract capital for industries like technology and clean energy.5
The small size of investments and the lack of a simple method to identify projects means that promising investments are often overlooked and underfinanced. Interviews indicate that restoration is not on the radar of many impact investors, much less mainstream investors. Without a clear signal that financing is available for restoration, entrepre-neurs and businesses may be deterred from enter-ing the space, thereby limiting the project pipeline.
Solutions Financial mechanisms to aggregate assets and bundle projects are an established means of addressing small investments (d’Olier-Lees et al. 2017). These mechanisms have been used to finance small-scale energy efficiency projects (UNIDO
Since 1995, the ForestFinance Group has been investing retail investors’ savings in the restoration of degraded forest landscapes in Colombia, Panama, Peru, and Vietnam. On its own, any one of the restoration projects would be too small to attract funding. By aggregating them
under one umbrella, ForestFinance is able to raise capital.
The company offers various investment products in developed countries (Table B2.9.1). It manages forest investments of about $100 million for more than 18,000 clients, using the funds to reforest
degraded pasturelands and grow mixed-species forests. After 25 years, ForestFinance harvests some of the trees and sells the timber. As of 2016, ForestFinance had 17,500 hectares of forests under management, of which it has restored more than 7,500.
BOX 2.9 | AGGREGATING PROJECTS TO ATTRACT CAPITAL: THE EXPERIENCE OF FORESTFINANCE GROUP
Table B2.9.1 | Investment Products Offered by ForestFinance Group
CONTRACT TERM (YEARS) INVESTMENT AREA RESTORED RETURN FORECAST PAYOUTS RESTORATION CONCEPT
25 Twelve monthly payments of €38 or one payment of €396
From 0.0125 hectares
About 6% About €1,745 after 25 years
Mixed forest
25 One payment of €3,250
From 0.1 hectares About 6% Annually from year 6; totaling about €7,735
Cacao cultivation and rain forest protection
12 One payment of €2,625
From 0.25 hectares
About 6% On years 3, 5, 7, 9, and 12; totaling about €4,990
Mixed forest
Source: ForestFinance Group 2017.

31Roots of Prosperity: The Economics and Finance of Restoring Land
2017) and to convert retail assets (such as cars) into institutional products (such as asset-backed securities). Intermediaries that aggregate restoration projects could help bundle projects to make them more attractive to institutional investors (Kissinger 2014). Since 1995, the ForestFinance Group has been doing just that (Box 2.9).
As a first step, it makes sense to focus on restoration models that have an established proof-of-concept and have demonstrated the ability to deliver finan-cial and environmental returns. For aggregation to be effective, it is important to include comparable and replicable restoration projects (Credit Suisse et al. 2014). Public investors can play an important role in demonstrating proof of concept by supporting emergent businesses with the intention of expanding models that work.
Addressing the high transactions costs of restoration projects can be a chicken-and-egg situation: Investors have limited interest in restoration because of lack of awareness of and inability to find investments, but efforts to develop such a process can be successful only if there is sufficient interest from investors. Efforts therefore need to be made in tandem to establish restoration as a viable investment opportunity and attract investor interest while developing a pipeline of large-scale investable projects and a platform that allows investors to easily identify and evaluate potential investments.
Barrier #6: Many Restoration Projects Have Very Long (10- to 20-Year) Investment Horizons ProblemRestoration is a multiyear process. Its benefits can span decades, and projects may take a decade or more just to break even. For example, teak plantations require a minimum of 20 to 25 years before the wood is ready for harvest (Ladrach 2009). Obtaining financing that matches the time frame of the restoration project becomes essential to maintain the benefits of restora-tion because, without sustained financing, there is the risk of reversion to degrading activities, rendering restoration efforts void. This long time frame can signifi-cantly limit investor interest because a dollar today is worth more than the same dollar in the future. This means that profits received in the distant future have lower value than those in the near term, and long-term restoration projects are discounted in favor of investments that deliver more immediate returns. (See Box 3.4 in Section 3 for detailed discussions of how discounting may affect investment decisions.)
On a similar note, private investors also consider the liquidity of investments—the ease of trading an asset and converting it to cash without major changes in price. In recent years, institutional investors are increasingly valuing liquidity and shorter-term investments (OECD 2011). Figure 2.6 shows how investment holding periods have declined across major stock markets around the world.
Figure 2.6 | Average Holding Periods of Various Stock Exchanges
19910
1
2
3
4
5
6
1993 1995 1997 1999 2001 2003
NASDAQ
NYSE
Tokyo SE
DeutscheBörse
London SE
Euronext
2005 2007 2009
Years
Source: OECD 2011.

WRI.org 32
This trend appears to affect even investors who focus on long-term investments: A 2010 study of 900 long-term equity strategies found that more than two-thirds sold their investments more quickly than expected (Mercer LLC 2010).
For conservation and restoration projects, which are often long-term and illiquid, the broader market trend toward short-termism limits the appetite of private investors. The long time horizon required is also a barrier to entrepreneurs and landown-ers interested in restoration because the costs are incurred up front while the multiple restoration benefits are realized over time.
SolutionsSeveral approaches could make investing in restoration more attractive to investors. First, projects could focus on business models that mix long-term and short-term cash flows. Agroforestry models, for example, combine high-value, short-term crops with the planting of high-quality, long-term trees. This approach allows for short-term profits as well as long-term, high-value investments, delivering more attractive returns on investment (Gold et al. 2011).
Second, project developers could seek out investors with longer investment horizons, such as impact investors, family foundations, and pension funds (Rosen and Sappington 2015). These categories of investors are more likely to be comfortable with the patient capital needed for restoration investments, provided that the investments fulfill other require-ments in deal size and/or return expectations. Box 2.10 provides an example.
Securitization—aggregating an illiquid group of assets and transforming them into a security—is another option. Securitizing long-term projects can create liquidity for investors with shorter time frames. One example is the bundling of mortgages in the United States into mortgage-backed securities.
Securitization offers many advantages:
▪ The greater liquidity provided by an aggregated fund (versus individual projects) reduces transaction costs dramatically, making it easier and less expensive to invest in restoration.
▪ Pooling the risks of different projects reduces investors’ exposure to downturns in single ventures, reducing risk.
▪ Projects of $1–20 million can be aggregated to form much larger funds, allowing a broader range of investors—including pension funds, mutual funds, and retail investors—to participate.
Barrier #7: Restoration Is Considered a Risky Investment ProblemInvestments are based on expectations of future returns and thus carry an element of risk. Risks vary widely, from financial risks (e.g., changes in market conditions) to sociopolitical risks (e.g., political upheaval) to environmental risks (e.g., natural disasters). Also, investors are highly subjec-tive in their consideration of risks, meaning that two investors considering the same opportunity may think about risks differently. When making an investment, investors weigh the trade-off between risk and return, comparing the risk-adjusted returns of various alternatives. For restoration to attract more private capital, it must not only be attractive on an absolute basis, it must also be more attractive than other investments being considered by the investor.
The Moringa Fund, founded in 2012, is a private equity fund that invests in restoration projects in Latin America and sub-Saharan Africa. It focuses on agroforestry projects (the incorporation of trees in croplands or pastures) that can potentially deliver attractive investment returns while generating environmental and community benefits (Mercer et al. 2014). The fund’s projects provide a diverse range of revenue streams over different time frames, from shorter-term sales of fruits, nuts, and crops to longer-term sales of firewood and timber.
With its strategy of making equity or quasi-equity investments in established agroforestry projects, Moringa aims to generate competitive market returns of 10 to 12 percent a year for its investors. To date, it has financed restoration projects of $3–7 million, with a total investment of $96 million. It is willing to invest in projects of 500 to 10,000 ha, such as Nicafrance, a 1,500-ha coffee farm in Nicaragua in which it invested in 2015 (Moringa 2017).
BOX 2.10 | INVESTING IN RESTORATION PROJECTS IN DEVELOPING COUNTRIES: THE MORINGA FUND

33Roots of Prosperity: The Economics and Finance of Restoring Land
To calculate expected returns from an investment, investors estimate the future stream of revenues of an investment and discount them to estimate their present value. Private investors typically use higher discount rates than public investors when evaluating investments, reflecting the high opportunity costs they face. In addition, the fact that restoration is a relatively new area for most private investors and that it is perceived as risky means that the discount rate is usually high. This bodes poorly for restoration investments—where costs are often loaded up front but cash flows are generated years later, sometimes a decade or more—as high discount rates depress the value of future benefits and assign more weight to present costs. Given a high discount rate and a back-loaded cash flow profile, restoration investments are often viewed by private investors as having poor risk-adjusted returns. (Box 3.4 in Section 3 explains discount rates in more detail.)
This explains why private investment makes up a low share of total investment in restoration. In a survey managed by the GIIN, impact capital allo-cated toward food/agriculture or forestry/timber (using the two sectors as a proxy for restoration) constituted only 7 percent and 4 percent, respec-tively, of total assets under management in 2016 (Mudaliar et al. 2017). While impact capital is only a small fraction of available private capital, and figures
for the two sectors are imperfect proxies for restora-tion, the percentages highlight that relatively little private investment is allocated toward restoration.
SolutionsRisk can be mitigated in several ways. Public and philanthropic institutions typically possess lower discount rates, as they place higher value on ben-efits generated for future generations. As such, they can leverage private investment through financial mechanisms such as first-loss guarantees. Under first-loss guarantees, in the event that an invest-ment loses money, the public investor agrees to bear the initial losses before any remaining losses are spread to the rest of the investors. This gives private investors greater confidence by reducing their potential loss. Over time, as private investors become more familiar with investing in a sector, their perception of risk decreases and they are more willing to invest without continued support. The strategic use of public and philanthropic capital can unlock models for restoration that would not be realized by private investment alone.
Governments can also offer investment tax credits to shoulder part of the initial cost of the investment, thereby mitigating risk. Investment guarantees are also an important tool to mitigate risk. These mechanisms are detailed in Box 2.11.
TAX CREDITS The Solar Investment Tax Credit (ITC) is a U.S. tax credit first passed in 2005. The tax, which has since been extended to 2021, provides a 30 percent tax credit on residential and commercial installations of solar panels.
The ITC is a very important incentive because, similar to land restoration, the up-front cost of solar energy is high. The ability to claim the tax deduction in the year of installation significantly improves the economics of the solar investment and has helped capital flow to solar energy.
The ITC helped solar installation grow by more than 1,600% since it was passed
in 2005 (an annual compound growth rate of 76%). The number of Americans employed in the solar industry is expected to more than double, from 200,000 in 2015 to 420,000 by 2020 while spurring $140 billion in economic activity. Having catalyzed solar investment in the United States, the ITC will be reduced, falling to 26 percent in 2020, 22 percent in 2021, and 10 percent thereafter (SEIA 2017).
INVESTMENT GUARANTEESThe Multilateral Investment Guarantee Agency (MIGA)—part of the World Bank Group—encourages foreign direct investment in developing countries by providing guarantees to investors
(MIGA 2015a). Its guarantees cover the noncommercial risks—war, civil disturbance, transfer restrictions, expropriation—of investments in certain sectors of the economy that provide environmental, social, and financial returns.
MIGA issued guarantees to EcoPlanet Bamboo, a U.S. company restoring degraded lands with bamboo plantations, of $27 million (2012) and $22 million (2015) for its investments in Nicaragua. Over a 15-year period, the protection will cover EcoPlanet Bamboo against the risks of expropriation, war, and civil disturbance in Nicaragua (MIGA 2012; MIGA 2015b).
BOX 2.11 | USING INVESTMENT GUARANTEES AND TAX CREDITS TO SPUR PRIVATE-SECTOR INVESTMENT IN RESTORATION

WRI.org 34
Recommendations Restoration faces a huge funding gap, as a result of the seven barriers discussed in this section. These barriers are surmountable. National and international efforts are already under way to develop policies and financial mechanisms that facilitate public and private financial flows.
Governments can catalyze investment in restoration in several ways. The suite of policies they implement are not only influential but essential to an industry’s success. To accelerate the pace of restoration, governments and practitioners should consider the following actions:
▪ Impose carbon prices and use the revenues to fund restoration. Carbon taxes or auctioned permits are gaining momentum and are being implemented in dozens of nations and states. For countries that are not yet engaged in a carbon emissions trading scheme or have not implemented a carbon tax, we recommend exploring these options as a means
of promoting low-carbon development. For nations that have already implemented such policies, we urge them to direct some of the proceeds to restoration and other climate solutions.
▪ Redirect incentives. Governments should reform their current incentive systems, which often make it profitable to degrade land. This can be done by removing existing incentives—such as many agricultural subsidies—that contribute to land degradation, and introducing new mechanisms that incentivize private investment in restoration.
▪ Leverage climate finance for restoration. Climate funds should promote restoration as a means of achieving nations’ climate goals by explicitly acknowledging restoration as part of their climate mitigation and adaptation strategies and reducing bureaucracy in the application processes.

35Roots of Prosperity: The Economics and Finance of Restoring Land
▪ Take a cross-sector approach. As restoration generates benefits for multiple areas of the economy, governments should develop an integrated approach that crosses ministries and government bodies. Brazil, Ethiopia, and the United States have demonstrated how integrating restoration into multiple branches of government can bolster the government’s capacity for restoration.
▪ Mitigate risk. Governments, multilateral development banks, foundations, and civil society should develop financial mechanisms that mitigate risk and bundle projects in order to attract more private investment. Mechanisms, such as insurance guarantees, tax credits, and first-loss capital structures, can help to bring private investors to the table.
▪ Bundle projects. Aggregating projects is an established financing strategy in multiple sectors, including solar energy and automobiles. Bundling restoration projects would increase investment size and enhance liquidity while reducing project-specific risk through diversification.
These barriers are surmountable. National
and international efforts are already under way
to develop policies and financial mechanisms
that facilitate public and private financial flows.

WRI.org 36

37Roots of Prosperity: The Economics and Finance of Restoring Land
SECTION 3
ESTIMATING THE FULL SET OF BENEFITS AND COSTS OF FOREST AND LANDSCAPE RESTORATION The overwhelming evidence is that restoration, done correctly,
creates benefits in excess of its costs at the national, subnational, and
community level. Economic analysis has an essential role in making the
value of restoration benefits and costs visible to support better-informed
policy and investment decisions.

WRI.org 38
Restoring the productivity of the world’s degraded land has become a recognized global priority since the 2011 launch of the Bonn Challenge (see Box 1.1). Restoration increases the supply and quality of ecosystem goods and services for individuals (private benefits) and society (public benefits). Cost-benefit analysis suggests that achieving the objective of restoring 350 million hectares of degraded forest lands globally could create $2–9 trillion in net benefits over a 50-year period (or approximately $170 billion per year) when accounted for the value of public benefits (Verdone and Seidl 2017). Failure to incorporate all the benefits of restoration (see Figure 3.1) leads to a much lower estimate of $0.7 trillion in net benefits (Verdone and Seidl 2017) and reduces the attractiveness of investing in it.
Economic analysis should pay particular attention to identifying who benefits from restoration proj-ects and who pays the costs; what the trade-offs are between different benefits and beneficiaries; and what share of the benefits is public and what share is private. Clear answers to these questions can help direct financial analysis to identify the most appropriate public and private financing means and mechanisms to support restoration at scale.
Despite the unifying vision of restoring degraded landscapes, the ecosystem benefits targeted by restoration projects can be very different across dif-ferent economies (Aronson et al. 2010; Blignaut et al. 2014; Adams et al. 2016). Table 3.1 provides an overview of the specific restoration benefits that are of most interest to different income country groups.
Figure 3.1 | Restoration Interventions Create a Wide Variety of Benefits
Identified degraded land uses
Private and Public Ecosystem Benefits
Approaches to restore ecosystem functionality
Potential restoration benefits resulting from restoration interventions
Natural forest regeneration
Provisioning services • Timber & fuelwood• Crops• Meat & milk
Cultural services• Tourism & recreation• Amenity
Regulating services• Water yields for irrigation or
hydropower• Soil carbon storage, soil organic
matter, erosion control
Supporting services• Biodiversity
Degraded forest ecosystems Degraded croplands Degraded pasture lands
Planted forests and woodlots Improved fallow
Restoration of degraded forest
fragments
Farmer-managed natural
regeneration
Agroforestry system
Sustainable soil management
Sustainable livestock
management
Silvopastoral system
Employment
National GDP
Health
Food security
Migration
Social Benefits
Source: WRI authors, based on restoration opportunities defined in IUCN and WRI 2014 and ecosystem service typology defined in Millennium Ecosystem Assessment 2005.

39Roots of Prosperity: The Economics and Finance of Restoring Land
Based on the results from a meta-analysis of 1,575 research papers, Table 3.1 shows that the primary focus of restoration in low-income countries tends to be livelihood improvement, mostly through boosting landscape productivity, improving food and water security, and increasing climate change resilience (Benayas et al. 2008; Lawler et al. 2006). For example, in some areas of Africa and the Philippines, restoration has been viewed as a way to improve food security and help local communities build resilience against climate change and natural disasters (Gregorio et al. 2015; Republic of Malawi 2017). Box 3.2 shows an example.
Table 3.1 | Targeted Ecosystem Benefits of Restoration Efforts in Low-, Middle-, and High-Income Countries
TARGETED ECOSYSTEM SERVICE BENEFITS THROUGH LANDSCAPE RESTORATION
LEVEL OF EMPHASIS IN ECOSYSTEM SERVICE BENEFITS BY INCOME LEVEL
LOW-INCOME COUNTRIES MIDDLE-INCOME COUNTRIES HIGH-INCOME COUNTRIES
Soil erosion control 5 5 5
Water yields & runoff 5 5 2
Soil carbon content 3 5 1
Soil organic matter 5 5 3
Timber 3 5 3
Crops for food security 5 3 1
Meat & dairy products for export 2 5 3
Fuelwood 5 3 1
Biodiversity 1 3 5
Recreational value 1 5 5
Aesthetic value 1 3 5
Source: WRI, based on the findings of a meta-analysis of 1,575 peer-reviewed papers on restoration conducted by Blignaut et al. 2013; Table 3 on page 350 in Lele et al. 2013; and consultation with restoration specialists.
In contrast, the primary focus of restoration in high-income countries is to restore ecological functionality of natural habitats and improve cultural and ecological values such as biodiversity and scenic beauty of the landscape (Blignaut et al. 2013). For instance, some 338 integrated landscape initiatives have been implemented in 33 European countries over the past 30 years (García-Martín et al. 2016). Most of these initiatives have a focus on nature conservation and enhancing local economic activities (such as tourism and the production of organic food).

WRI.org 40
In the Tigray region of Ethiopia, local investment supported some four dozen activities intended to reduce dependence on food aid. Most activities focused on erosion control, rehabilitation of degraded soils, tree planting, and water capture and control and rehabilitated 400,000 ha of degraded land, benefiting 125,000 people (40% of them women). Average crop production tripled, and the number of households relying on aid during droughts fell from 90% in 2002 to 10% in 2012 (Denier et al. 2015).
BOX 3.2 | TRANSFORMING LIVES IN ETHIOPIA THROUGH EROSION CONTROL AND LAND REHABILITATION
Distinguishing between Private and Public Benefits Restoration benefits can be classified into two main categories: private and public.
Private BenefitsPrivate ecosystem benefits refer to the on-site benefits that private landowners or other individu-als reap from the direct use or commercial sale of a good or service, such as timber, nontimber forest products (NTFPs), crops, meat, and milk, as a result of restoration interventions on farmland, rangelands, or managed or restored forests.6 These goods and services can help people meet their survival needs or be sold in the market to generate income. In developing countries, a high proportion of household income comes from subsistence and small-scale agriculture. Acceleration of agricultural productivity can have huge effects on household income among the rural poor in low-income coun-tries (Box 3.3).
Restoration can also improve farmers’ incomes by creating on-farm employment opportunities or providing government subsidies or fiscal transfers, such as Payment for Ecosystem Services (PES), which are payments that governments make to farmers if they stop engaging in unsustainable farming practices and land conversions (Adams et al. 2016). Farmers in China and Latin America have also generated off-farm cash incomes through government payments and subsidies provided
by restoration projects (Liu et al. 2013; Liang et al. 2012; Pagiola et al. 2005). The payments and subsidies account for about 10 percent of household income for the majority of participants in the PES program in Costa Rica (Ortiz Malavasi et al. 2003). Reinvesting part of the income derived from resto-ration back in the communities increases villagers’ access to health care and education.
Land tenure reform in China and Vietnam that transferred state land to individual households or communities was another important driver of national reforestation programs, which also reduced rural poverty by boosting land productivity on privately owned or managed lands (Clement and Amezaga 2008; Liang et al. 2012; Sandewall et al. 2015).
Restoration projects that yield private benefits are well-suited to attract both private and public invest-ment, as discussed in Section 2.
Public BenefitsPublic ecosystem benefits are benefits that affect society as a whole. Direct public benefits of land restoration include cleaner air, increased control of soil erosion, soil and water retention, increased organic matter in soil, carbon sequestration, and biodiversity.
Forest restoration improves crop production by maintaining pollinating insects and supporting bird and bat populations that control insect herbivores. One study of a cacao agroforestry system found a 31 percent reduction in crop yield when both birds and bats were prevented from foraging in cacao trees, leading to an estimated loss of $730 per hectare (Maas et al. 2013). Animal-mediated pollination is required for 75 percent of the world’s leading food crops (Klein et al. 2007). A study of more than 40 important crops showed that wild pollinators improved pollination efficiency, doubling the rate of fruit set (Garibaldi et al. 2013).
Improving the regulation of ecosystem services can safeguard living conditions, stabilize crop produc-tion, and buffer environmental impacts on health and food security. These benefits are particularly important in developing countries where people have little resilience when it comes to climate change and other disasters.

41Roots of Prosperity: The Economics and Finance of Restoring Land
Using Economic Analysis to Inform Decision-Making on Restoration Figure 3.2 illustrates the steps involved in con-ducting economic analysis. It indicates the kind of restoration-related decisions that can be informed by different types of economic analytical tools.
Step 1: Model the Changes in Ecosystem Service Flows Resulting from Restoration InterventionsVarious ecosystem modeling tools have been developed and applied to assessing the impacts of land management practices (Christin et al. 2016). De Groot et al. (2017) find 80 ecosystem modeling tools that quantify changes in ecosystem services. They include InVEST,7 ARIES,8 Co$ting Nature,9
and many others. Some tools incorporate the uncertainty inherent in biological systems. For example, Monte Carlo simulations are often used to determine the tipping points and thresholds in the system (Blignaut et al. 2014).10 A few guiding documents have been developed to help users com-pare and select the appropriate models (Bagstad et al. 2013; Christin et al. 2016; Bullock and Ding forthcoming).
There is also a growing demand that ecosystem ser-vices modeling should incorporate landscape spa-tial patterns and temporal dynamics, coupled with consideration of political scale (jurisdictional and administrative); the socio-cultural characteristics of stakeholders (knowledge systems, value pluralism); governance and institutional settings; and the deci-sion objectives and scope (IPBES 2016).
Modeling of ecosystem service flows under Step 1 should be performed for at least two scenarios: a restoration scenario and a status quo (baseline) scenario. Comparison of the two describes the effect of action. Changes in ecosystem service flows will eventually have an impact on human well-being via constraints on consumption and production. Figure 3.3 illustrates how the biophysical changes of ecosystem services are linked with socioeconomic systems. Clearly, any postponed action or inaction to restore degraded forest and landscape will result in high costs in the form of reduced ecosystem ser-vice flows and thus jeopardize long-term economic prosperity.
Adopting farmer-managed natural regeneration helped increase annual gross income of the Maradi region of Niger by between $17 million and $21 million and has contributed an additional 900,000 to 1,000,000 trees to the local environment (Haglund et al. 2011). This natural regeneration resulted in at least 500,000 additional tons of grain produced a year—equivalent to the consumption needs of 2.5 million people (Reij et al. 2009). In East Africa, new agroforestry systems for feeding livestock have increased smallholder production and income from cattle and small ruminants, such as sheep and goats (Franzel et al. 2014). In China, Ethiopia, Sweden, and Vietnam, increasing forest plantations has increased incomes for many households, contributing some 10 to 25% of household cash income (Sandewall et al. 2015). However, direct income benefits in the form of NTFPs—fruits and nuts, vegetables, medicinal plants, resins, essences, a range of barks and fibers like bamboo and rattan, and a host of other palms and grasses—to forest communities or landowners from restoration activities are poorly documented. Many of the NTFPs may take years to materialize because it takes time for ecosystem functionality to recover after being restored.
BOX 3.3 | INCREASING INCOMES THROUGH FARMER-MANAGED NATURAL REGENERATION AND OTHER PRACTICES
Forest ecosystems are also essential to the spiritual and cultural value of local communities. In many regions, forest and landscape restoration is creating opportunities for ecotourism, which can become an important source of income for landowners and others in the community. The increasing demand for public benefits provided by forest landscapes in Costa Rica has created demand for restoration in the region (Broadbent et al. 2012; Zambrano et al. 2010).
Although public benefits have value for society, it is often hard to monetize them, which reduces the incentives for private actors to invest in restoration. For example, pollinators like bees can fly from one field to another, making it difficult for individual farmers who invest in beehives to capture the full benefits of their investment. As a result, restoration projects that consist largely of public benefits find it hard to attract private financing. These projects are better suited to public funding from governments and civil society.

WRI.org 42
Figure 3.2 | Economic Analysis Can Improve Decision-Making for Restoration
STEP 1
STEP 2
STEP 3
MODEL CHANGES IN ECOSYSTEM SERVICE (ES) FLOWS DUE TO FOREST AND LANDSCAPE DEGRADATION
ECONOMIC VALUATION OF BENEFITS AND COSTS OF RESTORATION
PERFORMING ECONOMIC ANALYSIS TO SUPPORT DECISIONS FOR RESTORATION
Public and private ecosystem benefits
ECOSYSTEM SERVICES
FOREST SERVICES
Before degradation After degradation Recovery after restoration
E C O N O M I C A N A LY T I C A L TO O L S A P P L I C AT I O N S
Cost-benefit analysis Justify investment & design payment mechanisms Cost-effectiveness analysis Compare the effectiveness of restoration programs Spatial restoration optimization analysis Prioritize restoration areas for maximum benefitsMacroeconomic analysis Forecast sectoral impacts on the entire economy
Socioeconomic benefits Costs of restoration intervention
Opportunity costs
High level of ecosystem services (A–D)
Loss of a dominant species to
disease
Compensatory response
by other tree species
Most ecosystem services decline Some services recover (+) while others remain permanently harmed (-)
DATA INPUTS
DATA INPUTS
A + + ––B C D
Source: WRI authors, adapted from Boyd et al. 2013.
Step 2: Quantify the Benefits and Costs of Restoration InterventionsThe estimated biophysical changes of ecosystem services generated in Step 1 are translated into monetary terms using market and nonmarket valu-ation methods.
Several methods have been developed to assess and capture the contributions of ecosystems to the pub-lic and private spheres. The foundation for valuing natural capital and ecosystem services in monetary terms is the total economic value (TEV) framework, which distinguishes between use and non-use values that contribute to well-being in a direct or
indirect manner. Figure 3.4 classifies restoration ecosystem benefits using the TEV framework and shows the corresponding economic valuation meth-ods used to assess these benefits.
Direct use value includes private benefits derived from consumptive use of ecosystem goods and services, such as food, timber, and fuelwood, as well as from nonconsumptive uses, such as recreational use of a forest or natural reserve. The valuation of the direct use is straightforward. It is based on pro-duction function and market-price-based valuation approaches to assess the change in ecosystem goods and services through the change in value of output (Table 3.2).

43Roots of Prosperity: The Economics and Finance of Restoring Land
Nature systems Socioeconomic systems
Continued degradation of soil and ecosystems Costs of land degradation
Improved biophysical structure &
process (e.g., agroforestry
system)
Improved ecosystem
function (e.g., regenerate
organic soil matter; water
retention)
Value(e.g., estimated market value of crop harvest)
Benefits(e.g., contributing to food security & farm income)
REDUCED SERVICE FLOWS
Policy scenarios
Figure 3.3 | Economic Modeling Demonstrates How Restoration Can Improve Natural and Socioeconomic Systems
Baseline Scenario, i.e.
Restoration inaction
Forest and Landscape Restoration
Scenario(e.g., improved land
productivity and ecosystem function due to restoration
interventions)
IMPACT
IMPACT
LANDSCAPE ECOSYSTEMS HUMAN WELL-BEING
INCREASED SERVICE FLOWS
(E.G., WATER YIELD, CROP PRODUCTIV-
ITY)
Source: Adapted from Liquete et al. 2013 and based on Farber et al. 2006.
Figure 3.4 | The Total Economic Value (TEV) Framework Provides a Way to Classify and Value Restoration Benefits
TEV CATEGORIES
Direct use valueConsumptive
Nonconsumptive
▪ Timber & fuelwood
▪ Crops
▪ Meat & dairy products
▪ Tourism/recreation/ amenity
Indirect use value
▪ Soil erosion control
▪ Water yields
▪ Soil carbon
▪ Soil organic matter
Option valueBequest value,
Quasi-option value
▪ Biodiversity
▪ Future tourism and recreational uses
Existence value
▪ Amenity appeal
COMMONLY USED
VALUATION METHODS
APPLICABLE RESTORATION
BENFEFITS
Source: WRI authors, based on chapter 5 of Kumar 2010; Ding et al. 2016a; Barbier 2007; and Farber et al. 2006.
NON-USE VALUE
TOTAL ECONOMIC VALUE (TEV)
Production function,Revealed-preference
methods
Stated-preference methods
Production function,Cost-based approaches,
Stated-preference methods
Stated-preference methods
B E N E F I T T R A N S F E R
PRI VAT E BENEF ITS (MARK E T VALUE )
PUBL IC BENEF ITS(NONMARK E T VALUE )
USE VALUE
*More tangible and more likely to be dealt with by the market
I N TA N G I B L ETA N G I B L E *

WRI.org 44
The value of tourism and recreational use of the restored landscape can be assessed through the travel-cost method, which measures the consump-tive value of the environmental attributes. It assumes that the price an individual places on the environmental good is equal to the opportunity cost of time and travel incurred in traveling to the recre-ational site. The scenic value of a healthy landscape could also be assessed using the hedonic pricing method. This method is often used to assess, for example, how the improved amenity of a landscape can affect the price of nearby properties, through constructed econometric models.
Indirect use value refers to the functional benefits of ecosystems, such as soil erosion control, water and nutrient regulation, and soil carbon storage, that support the delivery of ecosystem goods and services indirectly. Ideally, these values would be assessed using a production function method that
Table 3.2 | Tools Used to Estimate the Value of Ecosystems
APPROACH/TOOL DESCRIPTIONProduction Function Approach
Production function method
Estimates how much an ecosystem service contributes to the delivery of another service or commodity that is traded on an existing market
Market-price-based method Estimates the economic value of ecosystem products or services that are bought and sold in commercial markets
Travel cost method
Estimates economic-use values associated with ecosystems (and biodiversity) or sites that are used for recreation. The values of recreational sites are assumed to be associated with a cost (direct expenses and opportunity costs of time). The value of a change in the quality or quantity of a recreational site (resulting from changes in biodiversity and ecosystem) can be inferred from estimating the demand function for visiting the site being studied.
Revealed-Preferences Approach
Hedonic pricing
Evaluates the attributes of a nonmarket characteristic (e.g., scenic beauty) on market prices of a relevant commodity (e.g., real estate) using information about the implicit demand for an environmental attribute of marketed commodities. It has been widely applied to assess how changes in environment quality may have impacts on people’s willingness to pay for a property.
Stated-Preferences Approaches
Contingent valuation Uses questionnaires to ask people how much they would be willing to pay for increasing or enhancing the provision of an ecosystem service or, alternatively, how much they would be willing to accept for its loss or degradation.
Conjoint analysis/choice experiment
Questionnaire-based technique that presents respondents with two or more alternatives of a service in order to estimate people’s willingness to pay for improved attributes of the ecosystem services to be valued.
Cost-Based Approaches
Replacement costs Estimates costs incurred by replacing ecosystem services with artificial technologies.
Avoided damage costs Estimates expenditures on infrastructure or measures to protect ecosystems from further damage.
assesses how ecosystem changes affect the delivery of goods or services sold in the market. These links are often hard to model, and information for such analysis is often unavailable.
Alternative approaches to valuing the indirect use value of ecosystem services are cost-based meth-ods, such as avoided damage or replacement cost methods. These methods use conventional market information, such as environmental defensive expenditures (e.g., flood insurance) to minimize environmental damages, soil replacement costs, and relocation costs, to estimate the cost savings (or benefits) of avoided damages. If cost data are not available, a contingent valuation can be performed by estimating how much farmers would be willing to pay to adopt climate-smart agriculture practices that would avoid further resource degradation or improve land productivity.

45Roots of Prosperity: The Economics and Finance of Restoring Land
Option value refers to the value individuals are willing to pay for the option of preserving natural resources for future use by themselves or future generations. Existence value is the value individuals attach to the mere existence of a natural resource or environmental asset, unrelated to current or optional use. These values are usually assessed using contingent valuation or conjoint analysis and choice experiment methods.
If primary data are not available at a particular location, estimates from other studies of similar situations can be used. Using estimates from other studies (known as benefit transfer) can involve the simple unit value transfer method or the more complex function transfer method (Navrud and Ready 2010). Benefit transfer has been used in sev-eral large-scale ecosystem value studies (Costanza et al. 2014; Chiabai et al. 2011).
A Review of Estimated Ecosystem Benefits of Large-Scale Restoration Efforts Estimates of the annual net benefits of restoring degraded forests range from $23 billion in the Latin America and Caribbean to $3.3 trillion a year glob-ally (Table 3.3).
Using a simple benefit transfer method, Costanza et al. (2014) show that the conversion of forest landscapes to other land uses between 1997 and 2011 resulted in a loss of ecosystem services worth an estimated $3.3 trillion a year. Chiabai et al. (2011) use a range of methodologies (listed in Figure 3.4) to estimate the economic loss of forest ecosystem degradation by 2050 that stems from the lack of enforceable conservation policies in 10 world regions plus Brazil, China, and Russia. They report that the total economic losses derived from timber and NTFPs, carbon stocks, and recreation
Table 3.3 | Estimates of Net Benefits of Large-Scale Restoration Initiatives
STUDY RESEARCH QUESTION METRIC AREA ESTIMATED BENEFIT GOODS AND SERVICES CONSIDERED
Costanza et al. (2014)
What is the global value of ecosystem services provided by different biomes?
Change in ecosystem value from forest degradation between 1997 and 2011
Global $3.3 trillion a year 17 ecosystem servicesa
Chiabai et al. (2011)
What is the cost of policy inaction that leads to the loss of forest area?
Change in ecosystem value from forest degradation between 2000 and 2050
Africa $858 billion a year Timber products, NTFPs, carbon sequestration, recreation, and passive use
Verdone and Seidl (2017)
What are the net economic gains of achieving the Bonn Challenge of restoring 350 million ha of degraded lands?
Change in ecosystem value from forest restoration between 2015 and 2065
Global $2–9 trillion in net benefits over a 50-year period (or approximately $170 billion a year)
Timber products; NTFPs; carbon sequestration, recreation, and passive use
What are the net economic gains of restoring 40 million ha of degradated lands in Africa?
Change in ecosystem value from forest restoration between 2015 and 2065
Africa $65.5–339.9 billion in net present value, (approximately $1.3–6.7 billion a year)
Timber forest products, NTFPs, carbon sequestration, recreation, and passive use
Vergara et al. (2016)
What is the average gain in value of restoring 20 million ha of degraded lands in Latin America?
Change in ecosystem value from restored forests, savannas, and agricultural landscapes over 50-year period
Latin America and the Caribbean
$23 billion in net present value (approximately $460 million a year)
Timber forest products, NTFPs, ecotourism income, agricultural products, avoided food premium, carbon sequestration
Note: a Costanza et al. (2014) considered 17 services in their benefit calculation: gas regulation, climate regulation, disturbance regulation, water regulation, water supply, erosion control and sediment retention, soil formation, nutrient cycling, waste treatment, pollination, biological control, refugia, food production, genetic resources, recreation, and cultural services.

WRI.org 46
and cultural values in Africa are in the order of $858 billion as a result of land-use change over a period of 50 years. These cost estimates of land conversions and degradations can be used as approximations to ecosystem benefit gains, if world or land conversion and degradation were avoided. However, their study do not consider the costs of policy actions for averting land conversion or degradation.
Several large-scale land restoration benefits assess-ments are built upon Chiabai et al. (2011), but some also extend to cover lands other than forests. Vergara et al. (2016) estimate that restoring 20 million hectares of degraded forests, savannas, and agricultural landscapes in Latin America would yield net economic benefits of $23 billion ($1,140 per hectare) over a 50-year period. Three-quarters of these benefits come from the sales of timber and agricultural products. Another quarter are non-market benefits, achieved through carbon benefits and reduced food insecurity. Verdone and Seidl (2017) report that restoring 350 million hectares of world degraded forest landscapes can generate $2–9 trillion in net benefits over a 50-year period. Among others, 40 million hectares of degraded forest landscapes will be restored in Africa, creating
$65.5–340 billion of net public and private benefits over a 50-year period. These studies used social discount rates of 1.3 to 4.3 percent to reflect differ-ent social discounting philosophies.
The estimates of large-scale economic valuation studies are not consistent across regions, partly because they use different ecosystem service models, valuation methods, and discount rates and are based on data of varying quality. The quality of the data used has an impact on the accuracy of the model results. Ecosystem services that are included in the economic valuation also affect the estimates of total economic benefits. The failure of capturing the cobenefits (especially the nonmarket benefits) of restoration interventions will lead to a lower benefit-cost ratio, and make restoration projects generating public benefits that are greater than private benefits less favorable from the perspective of private investors and landowners.
The methods used to value entire ecosystems are also limited by their ability to account for changing values driven by changes in demands and sup-plies. As the area (i.e., supply) of an ecosystem and its associated services is reduced, the demand for the services provided by the remaining area will

47Roots of Prosperity: The Economics and Finance of Restoring Land
increase, pushing up the value. Current methods do not account for this dynamic, leaving global benefit estimates open to criticism. To better understand the dynamics of ecosystem value changes, eco-nomic analysis must take a broader scope that goes beyond the valuation of individual ecosystem services. It requires the analysis of trade-offs of restoration impacts at a landscape level or within a macroeconomic framework.
A Review of Estimated Ecosystem Benefits of Local and National Restoration EffortsAt the national and subnational levels, a handful of studies were found focusing on benefit assessments for specific landscape restoration interventions. A summary of the major restoration benefits studies for Africa and Latin America and the Caribbean is provided below.
As shown in Table 3.4, most of the restoration benefit analysis in Africa focused on agricultural activities, including agroforestry, fodder shrubs, improved woodlot management, natural regenera-tion, and improved fallows. The most important ecosystem benefits included in these studies are timber, fuelwood, food, carbon sequestration, and watershed protection. Most economic studies focus on a small subset of benefits or a small group of beneficiaries, based on the primary objectives of a given restoration initiative or activity. Few, if any, studies have documented all the benefits that resto-ration can yield. As a result, the societal economic gains that restoration provides—in particular, non-market benefits, such as water regulation and biodi-versity—are underestimated and underappreciated.
Land restoration efforts in Latin America include reforestation, silvopasture, forest conservation, agroforestry, and soil conservation. In addition to timber and carbon sequestration benefits, countries restore degraded land to increase the productivity of cash crops, meat, and dairy products. In Costa Rica, the benefits of ecotourism and recreational value of improved landscapes were assessed.
Comparison of results across countries makes little sense because of the inconsistent use of units of measurement and time frame. But for the same ecosystem service, it seems that the net benefits are higher in countries in Latin America and the Carib-bean. Two factors affect the estimated benefits: the per-unit price of the ecosystem services under consideration and the quantity of the same service
provided by the ecosystem. For instance, the use of different carbon prices leads to very different esti-mates of the economic values of carbon sequestra-tion. Brancalion et al. (2012) report that reforesta-tion in Brazil leads to annual carbon sequestration benefits of $3,959 per hectare, using a carbon price of $11 per ton of carbon. Using a much lower carbon price ($1.2–3.7 per ton of carbon), Carriazo et al. (2003) estimate that forest conservation in Colom-bia would generate annual carbon sequestration benefits on the order of $411–1,236 per hectare.
Frequently used carbon prices range from a few dollars per ton of carbon (reflecting current rates in voluntary carbon markets) to more than a hundred dollars per ton, to account for the marginal cost of global damage because of climate change. The latter price is known as the social cost of carbon. It incor-porates a low probability of high-damage events. The former price is often used to pay large private owners for carbon credits generated through forest conservation or avoided forestland conversion (for example, through the REDD+ program).
Interpreting and comparing the results of different studies requires a careful review of the assumptions and data used for ecosystem and economic model-ing and the market information used to calculate benefits. It would be useful if all studies adopted a
The most important ecosystem benefits included in these
studies are timber, fuelwood, food, carbon sequestration, and
watershed protection. Most economic studies focus on a small subset of benefits or a small group of beneficiaries,
based on the primary objectives of a given restoration initiative or
activity.

WRI.org 48
Table 3.4 | Estimated Net Benefits from National-Level Restoration Assessments in Africa and Latin America and the Caribbean
RESTORATION ACTIVITY COUNTRY ECOSYSTEM GOODS AND
SERVICES CONSIDERED NET BENEFIT STUDY
AFRICA
Agroforestry
Kenya Food production $111–175 per household year Franzel (2005)
Kenya Fuelwood and food production $94 per hectare over 2 years Swinkels and Franzel (1997)
Rwanda Food and timber production; carbon seq.; erosion control
Ranging between $701–$1,100 per hectare in net present value depending on beans and maize prod. over 30 years
RNRA and IUCN (2015)
Malawi Crop and timber yields; carbon seq; watershed protection
$1,904 per hectare in net present value over 30 years Republic of Malawi (2017)
Fodder shrubs Mali Reduced input costs $145–273 in net present value per community over 4 years Franzel (2007)
Improved woodlot management
Rwanda Food and timber yield; carbon seq.; erosion control
$487 per hectare in net present value over 30 years RNRA and IUCN (2015)
Tanzania Timber and fuelwood production $543 per hectare in net present value over 5 years Franzel (2005)
Uganda Timber yields; carbon seq.; watershed protection
$754 per hectare in net present value over 30 years MWE and IUCN (2016)
Community woodlots Malawi Timber yields, carbon seq.; watershed
protection$180 per hectare in net present value over 30 years Republic of Malawi (2017)
Natural regeneration Uganda Timber yields; carbon seq.; watershed
protection$828 per hectare in net present value over 30 years MWE and IUCN (2016)
Improved fallows
Zimbabwe Food production and reduced inputs costs $9–41 per household per year Mudhara and Hildebrand
(2005)
Zambia Fuelwood and food production $296 per hectare in net present value over 5 years Franzel (2005)
Kenya Fuelwood and food production and reduced input costs $208 per hectare over 2 years Swinkels and Franzel
(1997)
LATIN AMERICA AND CARIBBEAN
Reforestation
Brazil Carbon sequestration $3,959 per hectare/year ($11/tC) Brancalion et al. (2012)
Chile Wood forest products from native species
$1,897 to $2,539 per hectare in net present value over 52 years Rojas et al. (2012)
Guatemala Carbon offsets and flood control $457 per hectare (C) & $16,934 per hectare (FC) in net present value over 30 years
Zamora-Cristales et al. (In preparation)
SilvopastureCosta Rica Meat production $1091 per hectare in net present value over 10
years Jansen et al. (1997)
Mexico Milk production $3,285 in net present value over 10 years Gonzalez (2013)
Forest conservation
Costa Rica Ecotourism $700 per hectare/year Menkaus and Lober (1996)
Costa Rica Recreational use value $59.7 per hectare/year De Sena (1997)
Colombia Carbon sequestration $411–1,236 per hectare/year ($1.2/tC to $3.7/tC) Carriazo et al. (2003)
AgroforestryEl Salvador coffee productivity (>1200m above
sea level)$2,275 per hectare in net present value over 20 years Raes et al. (in preparation)
Mexico Increases in agricultural productivity $5,533 in net present value over 18 years Lopez-Sanchez and Musalem (2007)
Soil conservation practices Mexico Soil erosion and agricultural
productivity$19.40–$38.80 per hectare for each cm of soil loss Cotler et al. (2011)

49Roots of Prosperity: The Economics and Finance of Restoring Land
standard valuation framework that provides clear guidance on which ecosystem services, valuation methods, discount rates, time frames, and socioeco-nomic contexts have been considered in assessing the benefits of specific restoration interventions, so that valuation results could be compared across locations. It would be helpful to create a central database similar to The Economics of Ecosys-tems and Biodiversity—Valuation Database.11 The database would serve as an inventory of original economic valuation studies and provide detailed information on each study in terms of the assessed restoration benefits, valuation techniques used, years of the study, geographic areas covered, and other factors.
Estimating the Economy-wide Benefits of Restoration The degradation of natural resources and the accompanying loss in biodiversity affects the rural poor by reducing household consumption and employment tied directly to natural resource use (Ghermandi et al. 2013). When restoration activities are successful, the benefits are transmitted across the economy, as the sale of agricultural and forestry products produced by restored landscapes increases employment and rural incomes, leading to additional spending in other sectors of the economy.
The effects of restoration activities can be transmitted throughout the economy in a variety of ways (Bellu and Vega, 2009), including:
▪ increasing the production of agricultural and forestry goods and services;
▪ fostering demand for inputs from other sectors to support augmented production;
▪ changing the availability of production factors in the agricultural and other sectors (e.g., capital, labor, and land used for other purposes);
▪ increasing revenues for the government (e.g., via an increase in tax revenues from restoration-related economic sectors) and private institutions and trade (e.g., exports of agricultural products);
▪ capturing revenues from ecosystem service markets (e.g., carbon markets); and
▪ fostering reinvestment from public and private sectors in maintaining or extending restoration activities.
The economic impacts of restoration can be evaluated ex ante or ex post. An ex ante evaluation assesses and compares the simulated effects of a range of restoration activities in order to
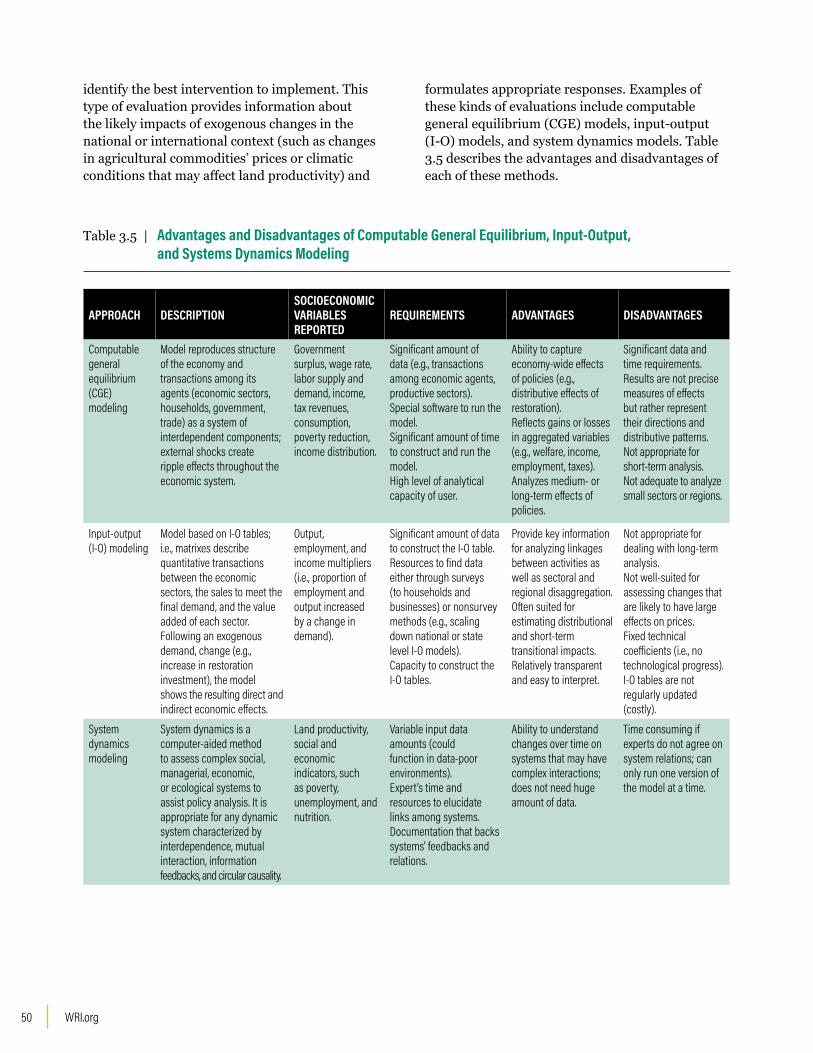
WRI.org 50
identify the best intervention to implement. This type of evaluation provides information about the likely impacts of exogenous changes in the national or international context (such as changes in agricultural commodities’ prices or climatic conditions that may affect land productivity) and
formulates appropriate responses. Examples of these kinds of evaluations include computable general equilibrium (CGE) models, input-output (I-O) models, and system dynamics models. Table 3.5 describes the advantages and disadvantages of each of these methods.
Table 3.5 | Advantages and Disadvantages of Computable General Equilibrium, Input-Output, and Systems Dynamics Modeling
APPROACH DESCRIPTIONSOCIOECONOMIC VARIABLES REPORTED
REQUIREMENTS ADVANTAGES DISADVANTAGES
Computable general equilibrium (CGE) modeling
Model reproduces structure of the economy and transactions among its agents (economic sectors, households, government, trade) as a system of interdependent components; external shocks create ripple effects throughout the economic system.
Government surplus, wage rate, labor supply and demand, income, tax revenues, consumption, poverty reduction, income distribution.
Significant amount of data (e.g., transactions among economic agents, productive sectors). Special software to run the model.Significant amount of time to construct and run the model. High level of analytical capacity of user.
Ability to capture economy-wide effects of policies (e.g., distributive effects of restoration).Reflects gains or losses in aggregated variables (e.g., welfare, income, employment, taxes).Analyzes medium- or long-term effects of policies.
Significant data and time requirements.Results are not precise measures of effects but rather represent their directions and distributive patterns.Not appropriate for short-term analysis.Not adequate to analyze small sectors or regions.
Input-output (I-O) modeling
Model based on I-O tables; i.e., matrixes describe quantitative transactions between the economic sectors, the sales to meet the final demand, and the value added of each sector.Following an exogenous demand, change (e.g., increase in restoration investment), the model shows the resulting direct and indirect economic effects.
Output, employment, and income multipliers (i.e., proportion of employment and output increased by a change in demand).
Significant amount of data to construct the I-O table.Resources to find data either through surveys (to households and businesses) or nonsurvey methods (e.g., scaling down national or state level I-O models).Capacity to construct the I-O tables.
Provide key information for analyzing linkages between activities as well as sectoral and regional disaggregation.Often suited for estimating distributional and short-term transitional impacts. Relatively transparent and easy to interpret.
Not appropriate for dealing with long-term analysis. Not well-suited for assessing changes that are likely to have large effects on prices.Fixed technical coefficients (i.e., no technological progress).I-O tables are not regularly updated (costly).
System dynamics modeling
System dynamics is a computer-aided method to assess complex social, managerial, economic, or ecological systems to assist policy analysis. It is appropriate for any dynamic system characterized by interdependence, mutual interaction, information feedbacks, and circular causality.
Land productivity, social and economic indicators, such as poverty, unemployment, and nutrition.
Variable input data amounts (could function in data-poor environments).Expert’s time and resources to elucidate links among systems.Documentation that backs systems' feedbacks and relations.
Ability to understand changes over time on systems that may have complex interactions; does not need huge amount of data.
Time consuming if experts do not agree on system relations; can only run one version of the model at a time.

51Roots of Prosperity: The Economics and Finance of Restoring Land
Ex post evaluations assess the site-scale socioeconomic impacts of restoration projects after they have been implemented. These evaluations are often based on household surveys and can assess the financial and social benefits received directly by smallholders. Ex post evaluation surveys may cover a range of socioeconomic indicators including income, job creation, poverty reduction, food security, and new opportunities for women. For example, in Wuqi County, Shaanxi Province, China, the sloping land conservation program increased local incomes by 164 percent and off-farm income by 20 times between 1998 and 2011 (Li et al. 2015).
Better understanding of how restoring land may affect GDP and job creation is important for informing macroeconomic policies. Macroeconomic analysis is very important for demonstrating the impacts of restoration to high-level decision-makers, such as finance ministers and multinational development agencies. This analysis needs to show how forest and landscape restoration in developing countries affects consumption, employment, imports, and exports. Effects should be documented with evidence from household surveys and statistical analysis.
Despite limited research in the literature (Wagner and Shropshire, 2009; Nielsen-Pincus and Moseley, 2013), BenDor et al. (2015a) examined the impacts of ecological restoration in the United States. They report that the sector directly employs about 126,000 workers and generates about $9.5 billion in annual GDP; indirectly, it supports another 95,000 jobs and $15 billion in GDP.
Estimating the Actual Costs of Restoration Restoration projects involve four types of costs:
▪ Establishment costs are the up-front capital investment in restoration. Depending on the project, they can include costs of engineering works, site preparation, planting or seeding, and fencing.
▪ Maintenance costs include ongoing management, administration, and monitoring.
▪ Transactions costs include the costs of searching for suitable sites, sourcing and researching potential investments, negotiating and signing contracts, conducting due diligence, paying legal fees, and incurring governance-related institutional costs. For many projects, these costs can be substantial.
▪ Opportunity costs refer to the income private landowners would have received had the land set aside for restoration been used for something else, such as cropland or rangeland.
Estimates of restoration costs for different categories of degradation are lacking because a single standard of reporting does not exist (Blignaut et al. 2014). These costs vary by location and over time. The Economics of Ecosystems and Biodiversity (TEEB) study assumed average costs of restoring forests of $2,390–3,450 per hectare (TEEB 2009). Other studies assume the cost of restoring forest ecosystems is equal to 75–100 percent of the maximum restoration costs (De Groot et al. 2013).
The perceived high costs of many restoration
projects may preclude restoration from even
being considered.

WRI.org 52
The costs of restoration are based on various factors, including the degradation level, the type of ecosystem, the climate, the ease of access to the restoration site, the type of restoration intervention, the status of land tenure, the number of stakeholders involved, and other factors. The perceived high costs of many restoration projects may preclude restoration from even being considered. Clearly estimated up-front costs of restoration, as well as the short- and long-term benefits, are therefore essential for making the case for investing in restoration.
Not all approaches to restoration require large sums of money. Costs vary widely from site to site, depending on whether passive (e.g., natural regeneration) or active (e.g., establishing agroforestry or silvopastoral systems on agricultural lands) approaches are adopted (Ghazoul and Chazdon, 2017). Passive restoration may require that the land not be used for other activities, making it a difficult approach in heavily populated areas.
Active restoration approaches cost more than passive restoration practices. The cost of prevent-ing land degradation is much lower than the cost of rehabilitating already severely degraded lands or replacing lost soil and nutrients (Shiferaw et al. 2015; Chazdon and Uriarte 2016). Farmer-managed natural regeneration—halting the cause of degradation and allowing trees to regrow natu-rally—is considered one of the least expensive interventions (Haglund et al. 2011; Chazdon and Guariguata 2016). Selective removal of pioneer species is another potential restoration intervention that is relatively inexpensive (Swinfield et al. 2016).
Tables 3.6 and 3.7 provide estimates of restoration costs in several African and Latin American coun-tries. The reported costs in Africa range from $14 to $1,505 per hectare (Table 3.6). The average across the sample was $440, which is significantly lower than the global average of $1,276 found by Verdone and Seidl (2017).
Table 3.6 | Estimated Costs of Implementing Restoration Activities in Selected Countries in Africa
RESTORATION ACTIVITY COUNTRY COST PER HECTARE (DOLLARS) STUDY
Community management of forest resources, sustainable fuelwood production Benin 1,362 World Bank Project Database
Fodder shrubs Kenya 14 Franzel (2005)
Improved fallowsZambia 266 Franzel (2005)
Kenya 22 Swinkels and Franzel (1997)
AgroforestryKenya 590 Swinkels and Franzel (1997)
Malawi 425 Republic of Malawi (2017)
Uganda 357 MWE and IUCN (2016)
Plantation establishment in Masoala corridors Madagascar 279 Halloway et al. (2009)
Plantation forestry Malawi 334 Republic of Malawi (2017)
Restoration of rain forest corridors by sourcing and planting trees Madagascar 938 Halloway and Tingle (2009)
Conservation agriculture Malawi 215 Republic of Malawi (2017)
Community woodlots Malawi 166 Republic of Malawi (2017)
Improved woodlot management Tanzania 385 Franzel (2005)
Improved woodlot management Uganda 1,505 MWE and IUCN (2016)
Farmer-managed natural regeneration Malawi 153 Republic of Malawi (2017)
Natural regeneration Uganda 26 MWE and IUCN (2016)
Average 440

53Roots of Prosperity: The Economics and Finance of Restoring Land
The lowest-cost restoration activities tend to be ones that involve few inputs. Adopting improved farm fallow, planting fodder shrubs, allowing degraded forests to regenerate naturally, and farmer-managed natural regeneration cost as little as $14–153 per hectare. More labor- and input-intensive restoration activities, such as agroforestry ($590 per hectare) and woodlot management ($1,505 per hectare) cost much more.
Costs in Latin America and the Caribbean—at least $900 per hectare—are considerably higher than in Africa (Table 3.7), mainly because landscape restoration has focused on high-input restoration interventions, such as establishing agroforestry and silvopastoral systems, and labor costs are higher. Sometimes higher-cost interventions are warranted because of the higher revenues they generate.
Table 3.7 | Costs of Restoration Activities in Selected Countries in Latin America and the Caribbean
ACTIVITY COUNTRY ESTABLISHMENT COST (DOLLARS)
ANNUAL MAINTENANCE COST (DOLLARS)
STUDY
Agroforestry: Brazil nut, perennial shrubs, black pepper, banana, cupuassu tree Brazil 2,086 per hectare 1,569 per hectare Gama (2003)
Agroforestry: trees in borders of agricultural farms Costa Rica 530 per kilometer 158 per kilometer Gómez and Reiche (1996)
Agroforestry: windbreak trees Costa Rica 815 per kilometer N/A Gómez and Reiche (1996)
Agroforestry: coffee with trees Costa Rica 2,138 per hectare N/A Gómez and Reiche (1996)
Ecuador 1,072 per hectare 165 per hectare Ramírez (2005)
Agroforestry: beans with trees Costa Rica 944 per hectare N/A Gómez and Reiche (1996)
Silvopasture: cows with trees for milk production Mexico 2,894 per hectare 262 per hectare Gonzalez (2013)
Silvopasture: cows with trees for meat productionBrazil 2,805 per hectare N/A Vinholis et al. (2010)
Brazil 1,712 per hectare 702 per hectare Dos Santos and Grzebieluckas (2014)
Costa Rica 1,315 per kilometer 152 per kilometer Villanueva et al. (2008)
Silvopasture: cows with sauco and kukuyo trees for meat production Colombia 1,107 per hectare N/A Rocha et al. (2013)
Silvopasture: cows with leucaena trees for meat production Colombia 2,553 per hectare 230 per hectare Montagnini et al. (2015)
Reforestation: assisted natural regeneration Brazil 639 per hectare N/A Nunes et al. (2017)
Reforestation: eucalyptus and native species Brazil 2900 per hectare 775 per hectare Brancalion et al. (2012)
Reforestation native speciesChile 1156 per hectare 138 per hectare CONAF (2011)
Colombia 1060 per hectare 176 per hectare CONIF, (2012)
Reforestation Costa Rica 910 per hectare 243 per hectare Gómez and Reiche (1996)
Reforestation riparian zones Guatemala 1343 per hectare 446 per hectare Zamora-Cristales et al. (In preparation)
Note: N/A indicates that the costs of maintenance were either not available or not reported because of the insignificant amount involved.
Estimating the Opportunity Costs of RestorationThe allocation of public land to ecological restora-tion or protection may impose a cost on society in the form of the forgone economic gains from commercial development. The opportunity costs of restoring private lands can be estimated based on data on agricultural productivity, land rental costs, and land prices (Stefanes et al. 2016; Budiharta et al. 2016). This analysis can be used to estimate the compensation that needs to be offered to landown-ers when land conservation or restoration activi-ties are undertaken on their lands (Mewes et al. 2015). Opportunity cost has been widely applied to estimating the level of compensation paid to Costa Rican farmers who adopted agroforestry or silvo-pastoral systems. This cost has also been used to determine the price paid per unit of carbon stocks saved via the REDD+ program.

WRI.org 54
On severely degraded forest and agriculture lands that are no longer suitable for cultivation and are abandoned, opportunity costs may equal zero. This is the case in some parts of African countries, such as Malawi.
Opportunity costs do not need to be considered when institutional arrangements make it legally impossible to pursue other uses (e.g., commercial), other than in the case of subsistence uses by indigenous communities (Ding et al. 2016b).
Step 3: Conduct Economic Analysis to Improve Decisions and Design Better Policy and Financial Instruments The benefits and costs of restoration activities are inputs for economic analytical tools such as cost-benefit analysis, cost-effectiveness analysis, spatial restoration optimization analysis, and macroeconomic analysis. Results of these economic analyses will provide important economic evidence to justify investment in restoration projects. For example, cost-benefit analysis can help prioritize investment by comparing the expected net benefits of two different restoration projects.
Economic analysis can also be used to develop policy instruments that will improve the economic efficiency of the provision of public environmental goods. For instance, macroeconomic analysis can estimate the welfare impacts of policies that aim to redirect subsidies from sectors or economic activities with harmful impacts on lands and deforestation (e.g., agricultural input subsidies) to activities that favor sustainable land use and management.
In turn, public policies can make markets work better (correct market failures), by integrating ecosystem service values where possible into price signals and by putting adequate institutions, regulations, and financing in place. Some of the policy instruments include payments for ecosystem services (PES) schemes, subsidy reforms and fiscal transfers. PES can be local (e.g., water yields) or global (e.g., carbon credits generated from reduced emissions from avoided deforestation and forest degradation through REDD+ programs). These policy instruments may serve as important financing instruments to cover the up-front costs of restoration activities.
Cost-Benefit Analysis Cost-benefit analysis of restoration projects extends the discounted future cash-flow approach used in financial analysis to public benefits of restoration projects (Harrison and Herbohn 2016). It is widely used to justify investment decisions, perform trade-off analysis of public and private benefits perceived by different beneficiaries, and determine the appropriate economic incentives for engaging private landowners in restoration. Results of cost-benefit analysis can be presented in terms of net present value, the benefit/cost ratio, or the internal rate of return. An investment in restoration can be justified if the net present value is greater than zero (or the benefit/cost ratio exceeds 1). The choice of the discount rate used to calculate the net present value has a huge effect on the attractiveness of a potential investment (Box 3.4).
Verdone and Seidl (2017) estimate a benefit-cost ratio of restoring 350 million hectares of degraded forest land ranging between $7.5 and $30.9 (i.e., every dollar invested would yield approximately $7–30 in benefits for restoring 350 million hectares of forest lands, or an estimated $2–9 trillion NPV for a 50-year period). Their results are consistent with the estimates made by De Groot et al. (2013), who found that the benefit-cost ratio of restoring temperate and tropical forests and woodlands over a 20-year time horizon ranged from a low of about $2 to a high of about $32, depending on the biome and scenario. It should be noted that failure to capture all of the cobenefits (especially the nonmarket benefits) of restoration interventions can lead to lower benefit-cost ratios. For example, Verdone and Seidl (2017) reported a much lower estimate of $0.7 trillion NPV under a 4.3 percent discount rate without accounting for the value of public goods.
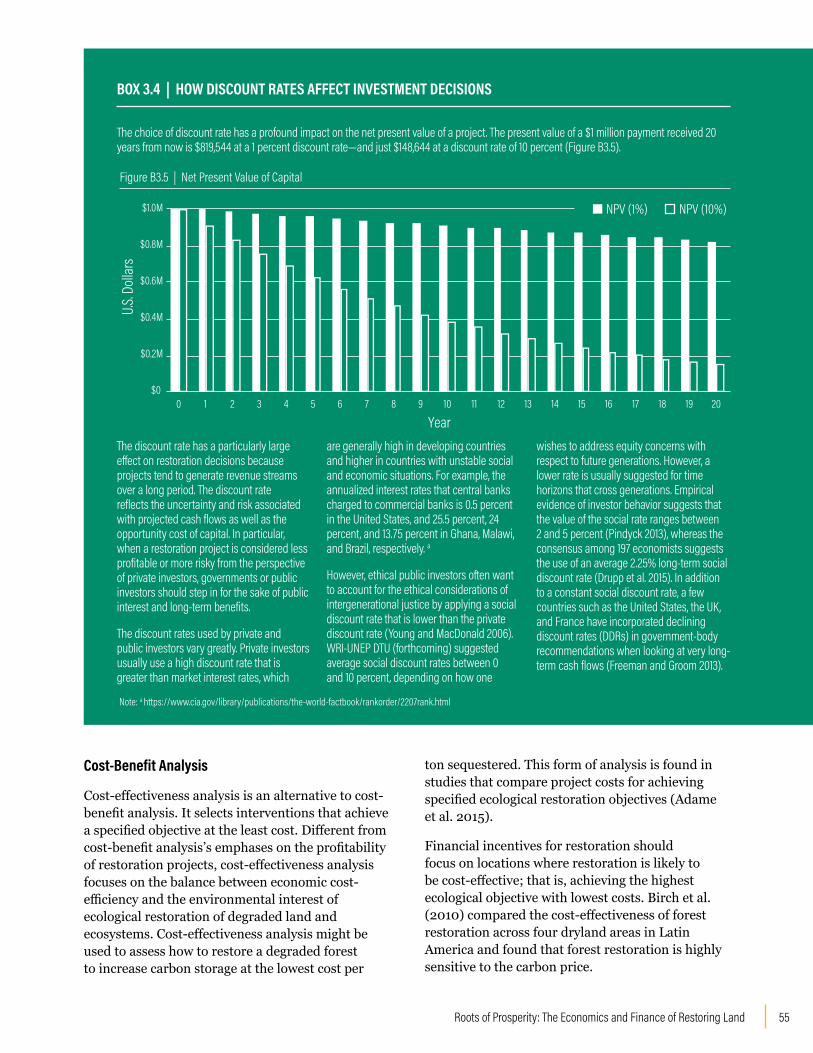
55Roots of Prosperity: The Economics and Finance of Restoring Land
The choice of discount rate has a profound impact on the net present value of a project. The present value of a $1 million payment received 20 years from now is $819,544 at a 1 percent discount rate—and just $148,644 at a discount rate of 10 percent (Figure B3.5).
BOX 3.4 | HOW DISCOUNT RATES AFFECT INVESTMENT DECISIONS
$0
$0.2M
$0.4M
$0.6M
$0.8M
$1.0M
0 1 2 3 4 5 6 7 8 9 10 11 12 13 14 15 16 17 18 19 20
U.S. D
ollar
s
Year
NPV (1%) NPV (10%)
Figure B3.5 | Net Present Value of Capital
The discount rate has a particularly large effect on restoration decisions because projects tend to generate revenue streams over a long period. The discount rate reflects the uncertainty and risk associated with projected cash flows as well as the opportunity cost of capital. In particular, when a restoration project is considered less profitable or more risky from the perspective of private investors, governments or public investors should step in for the sake of public interest and long-term benefits.
The discount rates used by private and public investors vary greatly. Private investors usually use a high discount rate that is greater than market interest rates, which
are generally high in developing countries and higher in countries with unstable social and economic situations. For example, the annualized interest rates that central banks charged to commercial banks is 0.5 percent in the United States, and 25.5 percent, 24 percent, and 13.75 percent in Ghana, Malawi, and Brazil, respectively. a
However, ethical public investors often want to account for the ethical considerations of intergenerational justice by applying a social discount rate that is lower than the private discount rate (Young and MacDonald 2006). WRI-UNEP DTU (forthcoming) suggested average social discount rates between 0 and 10 percent, depending on how one
wishes to address equity concerns with respect to future generations. However, a lower rate is usually suggested for time horizons that cross generations. Empirical evidence of investor behavior suggests that the value of the social rate ranges between 2 and 5 percent (Pindyck 2013), whereas the consensus among 197 economists suggests the use of an average 2.25% long-term social discount rate (Drupp et al. 2015). In addition to a constant social discount rate, a few countries such as the United States, the UK, and France have incorporated declining discount rates (DDRs) in government-body recommendations when looking at very long-term cash flows (Freeman and Groom 2013).
Cost-Benefit Analysis
Cost-effectiveness analysis is an alternative to cost-benefit analysis. It selects interventions that achieve a specified objective at the least cost. Different from cost-benefit analysis’s emphases on the profitability of restoration projects, cost-effectiveness analysis focuses on the balance between economic cost-efficiency and the environmental interest of ecological restoration of degraded land and ecosystems. Cost-effectiveness analysis might be used to assess how to restore a degraded forest to increase carbon storage at the lowest cost per
ton sequestered. This form of analysis is found in studies that compare project costs for achieving specified ecological restoration objectives (Adame et al. 2015).
Financial incentives for restoration should focus on locations where restoration is likely to be cost-effective; that is, achieving the highest ecological objective with lowest costs. Birch et al. (2010) compared the cost-effectiveness of forest restoration across four dryland areas in Latin America and found that forest restoration is highly sensitive to the carbon price.
Note: a https://www.cia.gov/library/publications/the-world-factbook/rankorder/2207rank.html

WRI.org 56
Cost-effectiveness analysis can also help justify public and private investment in green infrastructure. Using this technique, WRI found that investing in green infrastructure options such as riparian buffers and reforestation could generate cost savings of up to 67 percent over constructing a new filtration plant in Portland, Maine (Talberth et al. 2013). Nevertheless, very few studies have evaluated the cost-effectiveness of restoration interventions (Birch et al. 2010).
Spatial Restoration Optimization AnalysisThe collective benefits of forest and landscape restoration are more than the sum of the individual benefits of each land-use intervention. Spatial optimization models can be used to take into account the total benefits and potential trade-offs generated at the landscape scale. Focusing on the landscape level helps policymakers better understand the optimal combination of restoration
interventions that enable the long-term recovery of functionality and sustainability and improve livelihoods and well-being. These models build on geographical information systems (GIS) and economic optimization modeling to spatially estimate and simulate future potential land-use allocations and calculate optimal mosaic restoration options that generate the highest multiple economic and environmental benefits.
Initiative 20x20, coordinated by WRI, developed and applied a spatial optimization model in Guatemala to identify the optimal resource allocation for public investments in restoration interventions to achieve different government objectives, taking opportunity costs into account.12
Zamora-Cristales et al. (In preparation) present model results for a five-year strategic plan for a Pacific Coast river, where the government has set
Riparian forest
Sugar cane
Cattle ranching
No use
0
20
40
60
80
100
1 2 3 4
5
Area to prioritize in each landuse (ha)
Prioritization year Riparian forest
Sugar cane
Stream bed
No use
Figure 3.5 | An Example of a Five-Year Strategic Plan for Restoration Investment
Source: Zamora-Cristales et al. In preparation.

57Roots of Prosperity: The Economics and Finance of Restoring Land
a goal of restoring at least 70 hectares of forest per year (Figure 3.5). According to the model, during the first year, restoration should focus on conserving the existing forest areas along the river. In years two and three, areas with no current use (low opportunity cost) are a priority. In years four and five, restoration should focus on areas currently used for sugar cane and cattle ranching.
The spatial component of this analysis allows decision-makers to visualize potential impacts of certain policies across different locations. Spatially explicit models of restoration benefits can be combined with temporal data to develop multiple restoration scenarios that explore how benefits change over space and time. This analysis can be combined with multi-objective optimization functions to account for different desired impacts for restoration and identify trade-offs between different objectives.13
The results from spatial optimization models may be particularly helpful for guiding public investment decisions. In particular, they provide information that can help investors, including impact investors, identify investments that will support a combination of diverse restoration
interventions on different land mosaics to maximize the socioeconomic gains while achieving decent restoration outcomes at the landscape level.
However, the use of spatial optimization models is often constrained by the poor quality of biophysical information. Model application is often limited to modeling correlations between restoration activities and their environmental impacts.
Macroeconomic Analysis of Socioeconomic ImpactsUnlike economic benefit analysis, macroeconomic analysis focuses on the contributions of changes of a particular policy to changes in gross output and employment (BenDor et al. 2015b), as well as the income distribution effects of the policy. For instance, Go et al. (2010) examine the impacts of wage subsidies on employment in South Africa. Using a CGE model paired with information on occupational choice and employment, they estimate that a 10 percent wage subsidy would increase employment by 2 to 7 percent, depending on the rigidity of the labor market. The results helped South Africa’s finance minister redraft the original wage subsidy policy proposal (Devarajan and Robinson 2013).

WRI.org 58
Macroeconomic models have not yet been used to assess restoration benefits more broadly. To help extend their application, the International Food Policy Research Institute (IFPRI) recently partnered with WRI. The two institutions will jointly explore the potential of incorporating restoration policies into a CGE model for agriculture and pilot it in selected countries that have committed to Initiative 20x20. The modeling results are expected to help international donors and governments better understand the potential economy-wide impacts of achieving national restoration objectives under different scenarios.
Recommendations Economic analysis plays an important role in motivating restoration interventions. It makes the value of ecosystem services and costs of degradation visible, and it identifies who bears the costs and who reaps the benefits.
Despite this, the potential of economic analysis to inform policymaking in support of restoration is still largely unrealized. This is because most environmental economic analyses are still an academic exercise, still almost exclusively ex ante with very few analyses assessing the actual costs and benefits after a successful restoration activity, and because the theoretical valuations of expected future benefits are clearly not persuading investors. To enhance the science-based decision-making for restoration in developing countries, scientists and organizations that work in the field of assessing the benefits of forest and landscape restoration around the world could be better coordinated through a formally established international body, such as the UNCCD or Intergovernmental Science-Policy Platform on Biodiversity and Ecosystem Services.
Moreover, a work stream focusing on the economics of land restoration, similar to TEEB, could be created to monitor and document the progress and outcomes of restoration implementation around the world, to promote research and communication on the science-policy and science-business interface to better inform decision-making, and to host a central database of research findings and economic evidence on restoration around the world. The following specific actions could be undertaken within the work stream:
1. Report disaggregated benefits in addition to the total net present value of projects. Such reporting would help stakeholders see who gains, who loses, and who may need to be compensated for undertaking restoration activities.
2. Analyze the benefits of restoration activities beyond the restored sites, taking into account broader economic benefits, including nonmarket benefits, where possible.
3. Broaden the scope of farm-level analyses to a landscape scale, in order to achieve buy-in for interventions. Broad analyses can engage a wide range of stakeholders, including water utilities, electricity providers, and government agencies, by demonstrating how they would benefit from smallholder-led efforts coordinated at a landscape scale.
4. Use macroeconomic modeling to show how changes in land productivity may affect the national or global economy.
5. Following project implementation, conduct studies on the effects of restoration to help policymakers track how landscape restoration improves livelihoods; monitor and document actual restoration projects to provide concrete ex post evidence of benefits delivered.
Spatially explicit models of restoration benefits can be
combined with temporal data to develop multiple restoration
scenarios that explore how benefits change over space
and time.

59Roots of Prosperity: The Economics and Finance of Restoring Land
6. Improve the quality and delivery of information provided to practitioners and policymakers. For example, with recent advancements in technol-ogy and computer science, economic modeling tools can better incorporate spatial information in the analysis. Information presentation can be significantly improved by visualizing restora-tion benefits on GIS maps.
7. Create a database of findings. Although many ecosystem service values, especially values relating to local benefits, are context-specific, the results of studies in one area can be use-ful for decision-makers in others. Creating a database would provide policymakers or others who lack the time or money to have custom studies performed with access to state-of-the art knowledge. It would reduce the duplication of effort, allowing scarce research funds to be devoted to other areas.
8. Adopt a standardized valuation framework for assessing restoration benefits at both the national and community levels, in order to enhance the comparability and robustness of different studies. A high-level panel of social scientists, similar to the blue ribbon panel that the National Oceanic and Atmospheric Admin-istration created to evaluate the robustness of nonmarket valuation methods in the context of landscape restoration, could be established to provide this type of guidance (Arrow et al. 1993).
All these efforts would help bring together gov-ernments, research organizations, international development agencies, business, and civil society to act on improving restoration economic analysis and on better using economic analysis to inform policy and investment decisions.

WRI.org 60

61Roots of Prosperity: The Economics and Finance of Restoring Land
SECTION 4
CONCLUSIONS Improved understanding of the economics of restoration and
mechanisms for financing restoration actions will unlock current
opportunities to transform landscapes and achieve multiple
beneficial outcomes.

WRI.org 62
Degradation of land and forests has greatly reduced the productivity of some forest and agricultural ecosystems (Turner et al. 2016). For instance, degradation led to declining yields of maize, rice, and wheat that caused an estimated $244 million annual economic loss (6.8 percent of GDP) in Malawi and $2.3 billion (13.6 percent of GDP) in Tanzania (Kirui 2015). At a global level, degradation costs an estimated $6.3 trillion a year (8.3 percent of global GDP in 2016) in lost ecosystem service value, which includes agricultural products, clean air, freshwater, climate regulation, recreational opportunities, and fertile soils (Sutton et al. 2016).
Recognition of the importance of restoring degraded land and forests has grown, as commitments to the Bonn Challenge indicate. But restoration is not attracting the necessary investment, for the seven reasons identified in Section 2:
▪ Environmental and social benefits usually have no market value.
▪ Incentives to degrade land outweigh incentives to restore it.
▪ Climate finance is difficult to access.
▪ Funding for restoration is sometimes limited to small environmental budgets.
▪ Many restoration projects are too small to be attractive.
▪ Many restoration projects have very long (10- to 20-year) investment time frames.
▪ Restoration is considered a risky investment.
Much of the problem could be overcome if decision-makers widened their concept of return on investment in restoration to include a broader set of benefits, including both market benefits (such as greater crop yields and timber and nontimber forest products) and nonmarket benefits (such as biodiversity and improved water and soil retention). The reason they do not is that these nonmonetized benefits cannot easily be incorporated into financing decisions.
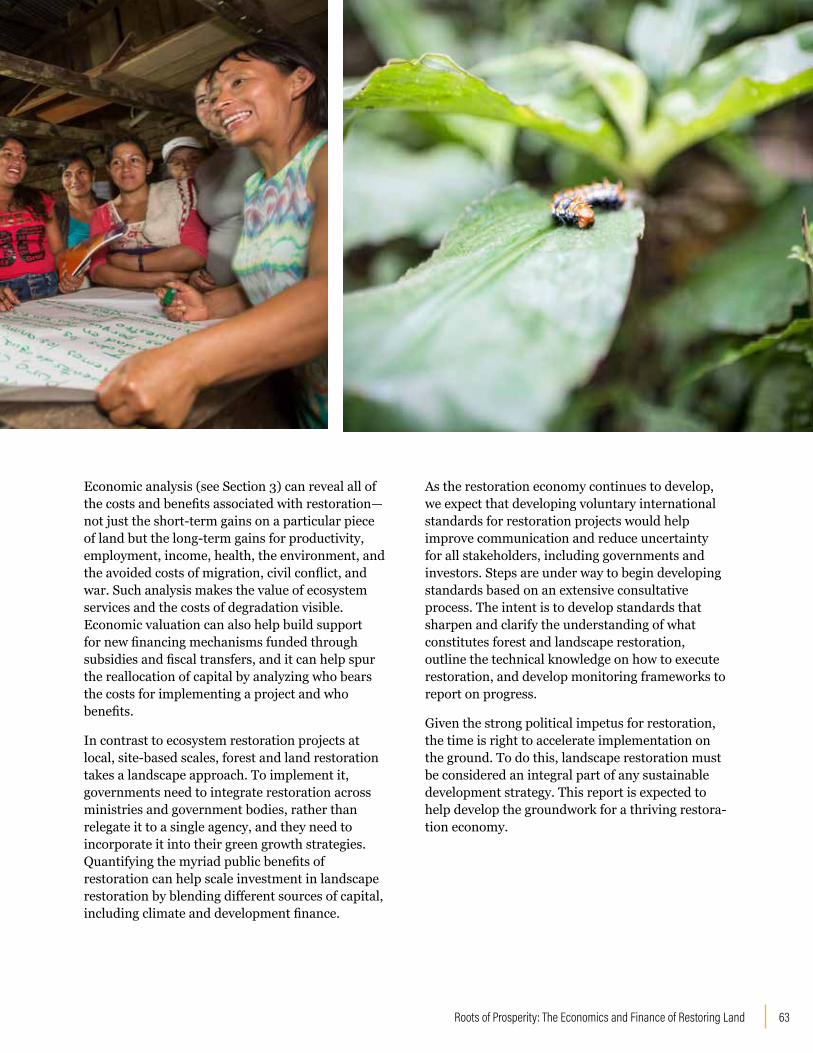
63Roots of Prosperity: The Economics and Finance of Restoring Land
Economic analysis (see Section 3) can reveal all of the costs and benefits associated with restoration—not just the short-term gains on a particular piece of land but the long-term gains for productivity, employment, income, health, the environment, and the avoided costs of migration, civil conflict, and war. Such analysis makes the value of ecosystem services and the costs of degradation visible. Economic valuation can also help build support for new financing mechanisms funded through subsidies and fiscal transfers, and it can help spur the reallocation of capital by analyzing who bears the costs for implementing a project and who benefits.
In contrast to ecosystem restoration projects at local, site-based scales, forest and land restoration takes a landscape approach. To implement it, governments need to integrate restoration across ministries and government bodies, rather than relegate it to a single agency, and they need to incorporate it into their green growth strategies. Quantifying the myriad public benefits of restoration can help scale investment in landscape restoration by blending different sources of capital, including climate and development finance.
As the restoration economy continues to develop, we expect that developing voluntary international standards for restoration projects would help improve communication and reduce uncertainty for all stakeholders, including governments and investors. Steps are under way to begin developing standards based on an extensive consultative process. The intent is to develop standards that sharpen and clarify the understanding of what constitutes forest and landscape restoration, outline the technical knowledge on how to execute restoration, and develop monitoring frameworks to report on progress.
Given the strong political impetus for restoration, the time is right to accelerate implementation on the ground. To do this, landscape restoration must be considered an integral part of any sustainable development strategy. This report is expected to help develop the groundwork for a thriving restora-tion economy.

WRI.org 64
ABBREVIATIONSARIES Artificial Intelligence for Ecosystem Services
BNDES National Bank for Economic and Social Development
CGE Computable general equilibrium
CIF Climate Investment Funds
DDR Declining Discount Rates
ES Ecosystem services
ETS Emissions trading systems
FLR Forest and landscape restoration
GCF Green Climate Fund
GDP Gross domestic product
GEF Global Environment Facility
GHG Greenhouse gas
GIIN Global Impact Investing Network
GIS Geographic information system
IFPRI International Food Policy Research Institute
InVEST Integrated Valuation of Environmental Services and Trade-offs
I-O Input-output
ITC Investment tax credit
IUCN International Union for Conservation of Nature
MIGA Multilateral Investment Guarantee Agency
NDC Nationally Determined Contribution
NOAA National Oceanic and Atmospheric Administration
NPV Net present value
NTFPs Nontimber forest products
OECD Organisation for Economic Co-operation and Development
PES Payments for ecosystem services
REDD+ Reducing Emissions from Deforestation and Forest Degradation in developing countries
TEEB The Economics of Ecosystems and Biodiversity
TEV Total economic value
TIMOs Timber Investment Management Organizations
TNC The Nature Conservancy
UNCCD United Nations Convention to Combat Desertification
UNEP DTU UN Environment Programme (UNEP) Risø Centre
UNFCCC United Nations Framework Convention on Climate Change
WRI World Resources Institute

65Roots of Prosperity: The Economics and Finance of Restoring Land
ENDNOTES1. Information on the Bonn Challenge can be found at http://www.bonnchallenge.org/content/challenge.
2. http://www.bonnchallenge.org/commitments.
3. http://www.afr100.org/.
4. http://www.wri.org/our-work/project/initiative-20x20.
5. For an example of a venue in which technology entrepreneurs can pitch ideas and attract capital investment, see Silicon Valley Open Doors (http://www.svod.org).
6. Private benefits may also include the nonconsumptive use of natural resources by individuals through recreational or educational activities.
7. Developed at Stanford University, InVEST is a suite of free, open-source software models used to map and value the goods and services from nature that sustain and fulfill human life. It has been applied to developing nature-based solutions to targeting investments in forest restoration for the International Union for Conservation of Nature (IUCN) and national governments in Africa. See https://www.naturalcapitalproject.org/invest/.
8. Launched in 2007, ARIES is a networked software technology that redefines ecosystem service assessment and valuation for decision-making. The ARIES approach to mapping natural capital, natural processes, human beneficiaries, and service flows to society is a powerful new way to visualize, value, and manage the ecosystems on which the economy and well-being depend. See http://aries.integratedmodelling.org/.
9. A web-based policy-support tool for natural capital accounting and analysis of ecosystem services provided by natural environments: http://www.policysupport.org/costingnature.
10. Monte Carlo simulation is a computerized mathematical technique that allows people to account for risk in quantitative analysis and decision-making.
11. For more information on TEEB’s database see http://www.teebweb.org/publication/tthe-economics-ofecosystems-and-biodiversity-valuation-database-manual/.
12. Initiative 20x20 is a country-led effort to bring 20 million hectares of land in Latin America and the Caribbean into restoration by 2020. For detailed information about the initiative, see http://www.wri.org/our-work/project/initiative-20x20.
13. Gourevitch et al. (2016) used an optimization framework to optimize investments in national-scale forest landscape restoration in Uganda for different strategic objectives.

WRI.org 66
REFERENCESAdame, M.V., K. Hermoso, C. Perhans, E.C. Lovelock, and J. Herrera-Silverira. 2015. “Selecting Cost-Effective Areas for Restoration of Ecosystem Services.” Conservation Biology 29: 493–502.
Adams, C., S.T. Rodrigues, M. Calmon, and C. Kumar. 2016. “Impacts of Large-Scale Forest Restoration on Socioeconomic Status and Local Livelihoods: What We Know and Do Not Know.” Biotropica 48 (6): 731–744.
AF (Adaptation Fund). 2017. “Ecosystem Based Approaches for Reducing the Vulnerability of Food Security to the Impacts of Climate Change in the Chaco Region of Paraguay.” https://www.adaptation-fund.org/project/ecosystem-based-approaches-reducing-vulnerability-food-security-impacts-climate-change-chaco-region-paraguay/. Accessed September 20.
Amazon Fund. 2017. “Amazon Fund/Purposes and Management.” http://www.amazonfund.gov.br/FundoAmazonia/fam/site_en/Esquerdo/Fundo/. Accessed July 24.
Amerasinghe, N., J. Thwaites, G. Larsen, and A. Ballesteros. 2017. The Future of the Funds: Exploring the Architecture of Multilateral Climate Finance. Washington DC: World Resources Institute.
AngelList. 2017. “Komaza—the New Face of African Forestry.” https://angel.co/komaza.
Aronson, J., J.N. Blignaut, S.J. Milton, D. Le Maitre, K.J. Esler, A. Limouzin, C. Fontaine, M.P. de Wit, W. Mugido, P. Prinsloo, L. van der Elst, and N. Lederer. 2010. “Are Socioeconomic Benefits of Restoration Adequately Quantified? A Meta-analysis of Recent Papers (2000–2008) in Restoration Ecology and 12 Other Scientific Journals.” Restoration Ecology 18 (2): 143–154.
Arrow, K., R. Solow, P.R. Portney, E.E. Leamer, R. Radner, and H. Schuman. 1993. “Report of the NOAA Panel on Contingent Valuation.” Federal Register 58: 4601–4614.
Bagstad, K.J., D.J. Semmens, S. Waage, and R. Winthrop. 2013. “A Comparative Assessment of Decision-Support Tools for Ecosystem Services Quantification and Valuation.” Ecosystem Services 5: 27–39.
Baltzer, K., H. Hansen, and Institute of Food and Resource Economics, University of Copenhagen. 2012. “Agricultural Input Subsidies in Sub-Saharan Africa.” https://www.oecd.org/derec/49231998.pdf.
Barbier, E.B. 2007. “Valuing Ecosystem Services as Productive Inputs.” Economic Policy 22: 177–229.
Bartlett, N., H. Cushing, and S. Law. 2016. “Embedding a Carbon Price into Business Strategy.” CDP North America, Inc. https://b8f65cb373b1b7b15feb-c70d8ead6ced550b4d987d7c03fcdd1d.ssl.cf3.rackcdn.com/cms/reports/documents/000/001/132/original/CDP_Carbon_Price_2016_Report.pdf?1474269757.
Bellu, L., and R. Vega. 2009. Quantitative Socio-Economic Policy Impact Analysis: A Methodological Introduction. Rome: Food and Agriculture Organization of the United Nations.
Benayas, J.M.R., J.M. Bullock, and A.C. Newton. 2008. “Creating Woodland Islets to Reconcile Ecological Restoration, Conservation, and Agricultural Land Use.” Frontier Ecological Environment 6: 329–336.
BenDor, T., T.W. Lester, A. Livengood, A. Davis, and L. Yonavjak. 2015a. “Estimating the Size and Impact of the Ecological Restoration Economy.” PLOS One 10 (6): e0128339. https://doi.org/10.1371/journal.pone.0128339.
BenDor, T., A. Livengood, T.W. Lester, A. Davis, and L. Yonavjak. 2015b. “Defining and Evaluating the Ecological Restoration Economy.” Restoration Ecology 23 (3): 209–219.
Biderman, R., M. Calmon, and A. Padovezi. 2016. “Brazil Announces Restoration and Low-Carbon Agriculture Target: 22 Million Hectares by 2030” (blog) March 12. http://wribrasil.org.br/en/blog/2016/12/brazil-announces-restoration-and-low-carbon-agriculture-target-22-million-hectares-2030.
Birch, J.C., A.C. Newton, C.A. Aquino, E. Cantarello, C. Echeverría, T. Kitzberger, I. Schiappacasse, and N.T. Garavito. 2010. “Cost-Effectiveness of Dryland Forest Restoration Evaluated by Spatial Analysis of Ecosystem Services.” Proceedings of the National Academy of Sciences 107 (50): 21925–21930.
Blignaut, J., J. Aronson, and M. Wit. 2014. “The Economics of Restoration: Looking Back and Leaping Forward.” Annals of the New York Academy of Sciences 1322: 35–47.
Blignaut, J., K.J. Esler, M.P. de Wit, D. Le Maitre, S.J. Milton, and J. Aronson. 2013. “Establishing the Links between Economic Development and the Restoration of Natural Capital.” Current Opinion in Environmental Sustainability (5): 94–101. https://doi.org/10.1016/j.cosust.2012.12.003.
Blue Forest Conservation. 2017. “Forest Resilience Bond.” http://www.blueforestconservation.com/#aboutus.
BNDES (Banco Nacional de Desenvolvimento Econômico e Social). 2011. “BNDES Approves Three Atlantic Forest Restoration Projects in the Amount of R$11.8 Million.” http://www.bndes.gov.br/SiteBNDES/bndes/bndes_en/Institucional/Press/Noticias/2011/20110526_mataatlantica.html.
BNDES. 2015. The BNDES’ Atlantic Forest Initiative. Brasil: BNDES.
Bonn Challenge. 2017. “United States.” http://www.bonnchallenge.org/content/united-states. Accessed July 18.
Boyd, I.L., P.H. Freer-Smith, C.A. Gilligan, and H.C.J. Godfray. 2013. “The Consequence of Tree Pests and Diseases for Ecosystem Services.” Science 342: 1235773, doi: 10.1126/science.1235773.
Brancalion, P.H.S., and R.L. Chazdon. 2017. “Beyond Hectares: Four Principles to Guide Reforestation in the Context of Tropical Forest and Landscape Restoration.” Restoration Ecology. Strategic Issues Article. doi: 10.1111/re.12519.
Brancalion, P.H.S., R.A.G. Viani, B.B.N. Strassburg, and R.R. Rodrigues. 2012. “Cómo Financiar la Restauración de los Bosques Tropicales.” Unasylva 239(63/1): 41–50.

67Roots of Prosperity: The Economics and Finance of Restoring Land
Broadbent, E.N., A.M. Almeyda Zambrano, R. Dirzo, W.H. Durham, L. Driscoll, P. Gallagher, R. Salters, et al. 2012. “The Effects of Land Use Change and Ecotourism on Biodiversity: A Case Study of Manuel Antonio, Costa Rica, from 1985 to 2008.” Landscape Ecology 27 (5): 731–744.
Bruvoll, A., and B. Merethe Larsen. 2004. “Greenhouse Gas Emissions in Norway: Do Carbon Taxes Work?” Energy Policy 32 (4): 493–505.
Buchner, B., C. Trabacchi, F. Mazza, D. Abramskiehn, and D. Wang. 2015. “Global Landscape of Climate Finance 2015. Climate Policy Initiative.” https://climatepolicyinitiative.org/wp-content/uploads/2015/11/Global-Landscape-of-Climate-Finance-2015.pdf.
Buckingham, K., and C. Hanson. 2015. The Restoration Diagnostic; Case Example: Costa Rica. Washington, DC: World Resources Institute.
Budiharta, S., E. Meijaard, J.A. Wells, N.K. Abram, and K.A. Wilson. 2016. “Enhancing Feasibility: Incorporating a Socio-ecological Systems Framework into Restoration Planning.” Environmental Science and Policy 64: 83–92.
Bullock J.M., and H. Ding. Forthcoming. A Policy Guidebook on Ecosystem Service Model Selection: Lessons Learned from Sub-Saharan Africa. Washington, DC: World Resources Institute.
Burwood-Taylor, L. 2015. “TerViva Raises $2m in Series B to Grow Soybean Alternative on Degraded Land.” https://agfundernews.com/terviva-raises-2m-in-series-b-to-grow-soy-bean-alternative-on-degraded-land018.html.
Calle Z., E. Murgueitio, and J. Chará. 2012. “Integrating Forestry Sustainable Cattle-Ranching and Landscape Restoration.” Unasylva 63: 31–40.
Calvo-Alvarado, J., B. McLennan, A. Sánchez-Azofeifab, and T. Garvin. 2009. “Deforestation and Forest Restoration in Guanacaste, Costa Rica: Putting Conservation Policies in Context.” Forest Ecology and Management 258 (6): 931–940.
Carl, J. and D. Fedor. 2016. “Tracking global carbon revenues: A survey of carbon taxes versus cap-and-trade in the real world.” Energy Policy 96: 50-77.
Carriazo, F., A.M. Ibáñez, and M. García. 2003. “Valoración de los beneficios económicos provistos por el sistema de parques nacionales naturales: una aplicación del análisis de transferencia de beneficios.” Final Report. Bogotá, Colombia: Fundación para la educación superior y el desarrollo.
CFU (Climate Funds Update). 2017. “Which Climate Funds Focus on REDD+Finance?” http://www.climatefundsupdate.org/themes/redd. Accessed November 20.
Chazdon, R.L., and M.R. Guariguata. 2016. “Natural Regeneration as a Tool for Large-Scale Forest Restoration in the Tropics: Prospects and Challenges.” Biotropica 48 (6): 716–730.
Chazdon, R.L., and M. Uriarte. 2016. “Natural Regeneration in the Context of Large-Scale Forest and Landscape Restoration in the Tropics.” Biotropica 48 (6): 709–715.
Chiabai, A., C. Travisis, A. Markandya, H. Ding, and P. Nunes. 2011. “Economic Assessment of Forest Ecosystem Services Losses: Cost of Policy Inaction.” Environmental Resource Economics 50 (3): 405–445.
Christin, Z.L., K.J. Bagstad, and M.A. Verdone. 2016. “A Decision Framework for Identifying Models to Estimate Forest Ecosystem Service Gains from Restoration.” Forest Ecosystems 3 (3). https://doi.org/10.1186/s40663-016-0062-y.
CIF (Climate Investment Fund). 2017. “Forest Investment Program.” https://www.climateinvestmentfunds.org/fund/forest-investment-program. Accessed September 22.
Clement, F., and J.M. Amezaga. 2008. “Linking Reforestation Policies with Land Use Change in Northern Vietnam: Why Local Factors Matter.” Geoforum 39: 265–277.
Climate Bonds Initiative. 2017a. “Green Bonds Highlights 2016.” January. https://www.climatebonds.net/files/files/2016%20GB%20Market%20Roundup.pdf.
Climate Bonds Initiative. 2017b. “Explosive Growth in Green Bonds Market.” https://www.climatebonds.net/market/history.
Climate Bonds Initiative. 2017c. “How to Issue a Green Muni Bond.” https://www.climatebonds.net/files/files/Green%20City%20Playbook.pdf. Accessed July 21.
CONAF (Corporación Nacional Forestal, Chile). 2011. Tabla de Costos: Fija Costos de Forestación, Recuperación de Suelos Degradados, Estabilización de Dunas, Poda y Raleo, por Hectárea, y Establecimiento de Cortinas Cortavientos por Kilómetro. Santiago: Ministerio de Agricultura de Chile.
CONIF (Corporación Nacional de Investigación y Fomento Forestal, Colombia). 2012. Apoyo a los Componentes de Evaluación del CIF: Costos de Establecimiento de Plantaciones Forestales. Francisco Torres Romero, Bogota: CONIF.
Costanza, R., R. de Groot, P. Sutton, S. van der Ploeg, S. Anderson, and I. Kubiszewski. 2014. “Changes in the Global Value of Ecosystem Services.” Global Environmental Change 26: 152–158.
Cotler, H., C. Lopez, and S. Martinez-Trinidad. 2011. “¿Cuánto Nos Cuesta la Erosión de Suelos? Aproximación a Una Valoración Económica de la Perdida de Suelos Agrícolas en México.” Investigación Ambiental 3 (2): 31–43.
Credit Suisse and McKinsey Center for Business and Environment. 2016. “Conservation Finance: From Niche to Mainstream: The Building of an Institutional Asset Class.” http://assets.rockefellerfoundation.org/app/uploads/20160121144045/conservation-finance-en.pdf.
Credit Suisse, WWF (World Wildlife Fund), and McKinsey and Company. 2014. “Conservation Finance: Moving Beyond Donor Funding toward an Investor-Driven Approach.” https://www.cbd.int/financial/privatesector/g-private-wwf.pdf.
CV Magazine. 2017. “The Better Globe Group: An Inspirational Story.” http://www.corp-vis.com/2017-the-better-globe-group-an-inspirational-story. Accessed January 5.
WRI.org 68
DeFries, R., T. Rudel, M. Uriarte, and M. Hansen. 2010. “Deforestation Driven by Urban Population Growth and Agricultural Trade in the Twenty-First Century.” Nature Geoscience 3: 178–181.
De Groot, R., L. Brander, S. van der Ploeg, R. Costanza, F. Bernard, L. Braat, M. Christie, N. Crossman, A. Ghermandi, L. Hein, S. Hussain, P. Kumar, A. McVittie, R. Portela, L.C. Rodriguez, P. ten Brink, and P. van Beukering. 2012. “Global Estimates of the Value of Ecosystems and Their Services in Monetary Units.” Ecosystem Services 1: 50–61.
De Groot, R., S. Moolenaar, and M. van Weelden. 2017. “Guidelines to Analyse and Capture the Benefits of Ecosystem Restoration.” Working Paper. Amsterdam: Foundation for Sustainable Development (FSD), Wageningen and Commonland Foundation.
De Miranda Benini, R., M. Flanklin Sosai, J. Aquino Jr., B. Silva, and G. Platais. 2015. “Reflorestar Program: Large-Scale Restoration Strategy in Espírito Santo, Brazil.” Paper presented at the Sixth World Congress on Ecological Restoration, Manchester, United Kingdom, August 23–27, 2015.
Denier, L., S. Scherr, S. Shames, P. Chatterton, L. Hovani, and N. Stam. 2015. The Little Sustainable Landscapes Book. Oxford, UK: Global Canopy Programme.
De Sena, F. 1997. “Valoración Económica de las Actividades de Recreación en el Lago Cachí, Cartago.” (tesis de maestría), Centro Agronómico Tropical de Investigación y Enseñanza (CATIE), Costa Rica.
Devarajan, S., and S. Robinson. 2013. “Contribution of Computable General Equilibrium Modeling to Policy Formulation in Developing Countries.” In Handbook of Computable General Equilibrium Modeling, edited by P.B. Dixon and D. Jorgenson. Amsterdam: Elsevier, 277–301.
DIE (German Development Institute). 2016. “Wood Energy in Sub-Saharan Africa: How to Make a Shadow Business Sustainable.” Briefing Paper. Bonn: Deutsches Institut für Entwicklungspolitik.
Ding, H., A. Chiabai, S. Silvestri, and P.A.L.D. Nunes. 2016a. “Valuing Climate Change Impacts on European Forest Ecosystems.” Ecosystem Services 18: 141–153.
Ding, H., P. Veit, A. Blackman, E. Gray, K. Reytar, J. Altamirano, and B. Hodgdon. 2016b. Climate Benefits, Tenure Costs: The Economic Case for Securing Indigenous Land Rights in the Amazon. Washington, DC: World Resources Institute. http://www.wri.org/sites/default/files/Climate_Benefits_Tenure_Costs.pdf.
d’Olier-Lees, T., W. Chang, and K. Forsgren. 2017. “Bundling: A Growing Trend as Stakeholders Look to Unlock the Potential of the Infrastructure Asset Class.” S&P Global. https://www.spglobal.com/our-insights/Bundling-a-Growing-Trend-as-Stakeholders-Look-to-Unlock-the-Potential-of-the-Infrastructure-Asset-Class.html. Accessed February 10.
Dos Santos S., and C. Grzebieluckas. 2014. “Sistema Silvipastoril com Eucalipto e Pecuária de Corte: Uma Análise de Viabilidade Econômica em uma Propriedade Rural em Mato Grosso/Brasil.” http://www.custoseagronegocioonline.com.br/numero3v10/Artigo%2014%20silvapastoril.pdf.
Drupp, M., M. Freeman, B. Groom, and F. Nesje. 2015. “Discounting Disentangled: An Expert Survey on the Determinants of the Long-Term Social Discount Rate.” Centre for Climate Change Economics Policy Working Paper No. 195. London: Grantham Research Institute on Climate Change.
duPont, C.M., J. Levitt, and L. Bilmes. 2015. “Green Bonds and Land Conservation: The Evolution of a New Financing Tool.” Harvard Kennedy School of Government. http://scholar.harvard.edu/files/lbilmes/files/green_bonds_and_land-_rwp15_072_bilmes.pdf.
EcoEntreprises Fund. 2017. “History.” https://www.ecoenterprisesfund.com/index.php/about. Accessed September 22.
The Economist. 2015. “Farm Subsidies: Milking Taxpayers.” https://www.economist.com/news/united-states/21643191-crop-prices-fall-farmers-grow-subsidies-instead-milking-taxpayers.
Ecosystem Marketplace. 2016. “Norway Pledges $50m to Fund Indonesia’s Peat Restoration.” http://www.ecosystemmarketplace.com/articles/norway-pledges-50m-to-fund-indonesias-peat-restoration/.
Embrapa. 2016. “Produção de Sementes de Leguminosas Arbóreas Nativas com Qualidade Genética para Restauração Ambiental da Mata Atlântica.” https://www.embrapa.br/busca-de-projetos/-/projeto/210649/producao-de-sementes-de-leguminosas-arboreas-nativas-com-qualidade-genetica-para-restauracao-ambiental-da-mata-atlantica.
Environment and Climate Change Canada. 2017. “Greenhouse Gas Emissions by Canadian Economic Sector.” https://www.ec.gc.ca/indicateurs-indicators/default.asp?lang=en&n=F60DB708-1. Accessed April 13.
EWG (Environmental Working Group). 2016. “50 Billionaires Receive $6.3 Million in Federal Farm Subsidies.” https://www.ecowatch.com/50-billionaires-receive-6-3-million-in-federal-farm-subsidies-1891118158.html.
FAO (Food and Agriculture Organization of the United Nations). 2011a. Assessing Forest Degradation: Towards the Development of Globally Applicable Guidelines. Rome: FAO.
FAO. 2011b. The State of the World’s Land and Water Resources for Food and Agriculture (SOLAW)—Managing Systems at Risk. Rome: FAO. London: Earthscan.
FAO. 2016. “State of the World’s Forests 2016. Forests and Agriculture: Land-Use Challenges and Opportunities.” http://www.fao.org/3/a-i5588e.pdf.
FAO and ITTO (International Tropical Timber Organization). 2005. Best Practices for Improving Law Compliance in the Forestry Sector. Rome: FAO and ITTO.
FAO and UNCCD (United Nations Convention to Combat Desertification). 2015. Sustainable Financing for Forest and Landscape Restoration: Opportunities, Challenges and the Way Forward. Rome: FAO and UNCCD.

69Roots of Prosperity: The Economics and Finance of Restoring Land
Farber, S.C., R. Costanza, D.L. Childers, J. Erickson, K. Gross, M. Grove, C.S. Hopkinson et al. 2006. “Linking Ecology and Economics for Ecosystem Management.” Bioscience 56: 121–133.
Faruqi, S., and A. Wu. 2017. “Infographic: 4 Ways to Make Money in Land Restoration” (blog) December 12. http://www.wri.org/blog/2016/12/infographic-4-ways-make-money-land-restoration.
ForestFinance Group. 2017. “Forest Products.” https://www.forestfinance.de/en/#c3054. Accessed August 7.
Franzel, S. 2005. “Financial Analysis of Agroforestry Practices.” In Valuing Agroforestry Systems, edited by J.R. Alavalapti and D.E. Mercer. New York: Kluwer Academic Publishers.
Franzel, S. 2007. “The Uptake of Fodder Shrubs among Smallholders in East Africa: Key Elements That Facilitate Widespread Adoption.” Proceedings of an International Symposium. Ubon Ratchathani University, Thailand, Faculty of Agriculture.
Franzel, S., S. Carsan, B. Lukuyu, J. Sinja, and C. Wambugu. 2014. “Fodder Trees for Improving Livestock Productivity and Smallholder Livelihoods in Africa.” Current Opinion in Environmental Sustainability 6: 98–103.
Freeman, M., and B. Groom. 2013. “Biodiversity Valuation and the Discount Rate Problem.” Accounting, Auditing and Accountability Journal 26 (5): 715–745.
Gama, M.M.B. 2003. “Análise Técnica e Econômica de Sistemas Agroflorestais em Machadinho d’Oeste, Rondônia.” Tese apresentada à Universidade Federal de Viçosa, como parte das exigências do Programa de Pós-Graduação em Ciência Florestal, para obtenção do título de Doctor Scientiae. http://www.ipef.br/servicos/teses/arquivos/gama,mmb.pdf.
García-Martín, M., C. Bieling, A. Hart, and T. Plieninger. 2016. Integrated landscape initiatives in Europe: Multi-sector collaboration in multi-functional landscapes. Land Use Policy, 58: 43–53.
Garibaldi, L.A., I. Steffan-Dewenter, R. Winfree, M.A. Aizen, R. Bommarco, S.A. Cunningham, C. Kremen, L.G. Carvalheiro, L.D. Harder, and O. Afik. 2013. “Wild Pollinators Enhance Fruit Set of Crops Regardless of Honey Bee Abundance.” Science 339: 1608–1611.
GCEC (Global Commission on the Economy and Climate). 2014. “Land Use.” In Better Growth, Better Climate, edited by M. Davis and G. Wynn. Washington, DC: World Resources Institute. http://newclimateeconomy.report/2014/land-use/.
GCF (Green Climate Fund). 2016a. “Project FP026.” December 20. http://www.greenclimate.fund/-/sustainable-landscapes-in-eastern-madagascar?inheritRedirect=true&redirect=%2Fwhat-we-do%2Fprojects-programmes.
GCF. 2016b. “Development of Argan Orchards in Degraded Environment—DARED.” http://www.greenclimate.fund/-/development-of-argan-orchards-in-degraded-environment-dared?inheritRedirect=true&redirect=%2Fwhat-we-do%2Fprojects-programmes.
GCF. 2016c. “Comprehensive Guidebook for Direct Access Accreditation to the Green Climate Fund.” http://www.gcfreadinessprogramme.org/sites/default/files/Comprehensive%20Guidebook%20for%20NIE%20Accreditation%203.0.pdf.
GCF. 2017. “Pitch for the Planet.” http://www.greenclimate.fund/500m. Accessed November 20.
GEF (Global Environment Facility). 2016. “Forest Landscape Restoration in the Mayaga Region.” https://www.thegef.org/sites/default/files/project_documents/07-19-16_PIF_Request_Document_revised.pdf.
Ghazoul, J., and R. Chazdon. 2017. “Degradation and Recovery in Changing Forest Landscapes: A Multiscale Conceptual Framework.” Annual Review of Environment and Resources 42 (9): 1–28.
Ghermandi, A., H. Ding, and P.A.L.D. Nunes. 2013. “The Social Dimension of Biodiversity Policy in the European Union: Valuing the Benefits to Vulnerable Communities.” Environmental Science and Policy 33: 195–208.
Go, D.S., M. Kearney, V. Korman, S. Robinson, and K. Thierfelder. 2010. “Wage Subsidy and Labour Market Flexibility in South Africa.” Journal of Development Studies 46 (9): 1481–1502. https://doi.org/10.1080/00220380903428456 .
GOCR (Gobierno de Costa Rica). 1996. Ley Forestal: Artículo 69. Costa Rica.
GOCR. 2011. “Propuesta para la Preparación de Readiness R-PP Costa Rica.” Paper presented at The Forest Carbon Partnership Facility, Santiago, March 21, 2011. http://www.cambioclimaticocr.com/multimedio/recursos/mod-3/Documentos/redd/R-PPCostaRica%20(2a).pdf.
Godefroid, S., C. Piazza, G. Rossi, S. Buord, A.D. Stevens, R. Aguraiuja, C. Cowell et al. 2011. “How Successful Are Plant Species Reintroductions?” Biological Conservation 144 (2): 672–682.
Gold, M., I. Cernusca, and C. Cleavelin, eds. 2011. Agroforestry for Ecosystem Services, 2011 Annual Report: Research Education and Outreach. Columbia: University of Missouri, Center for Agroforestry. http://centerforagroforestry.org/pubs/annual11.pdf.
Gómez, M., and C. Reiche. "Costos de establecimiento y manejo de plantaciones forestales y sistemas agroforestales en Costa Rica." Centro Agronómico Tropical de investigación y Enseñenza, Serie técnica. Informe Técnico, 282.
González, J.M. 2013. “Costos y Beneficios de un Sistema Silvopastoril Intensivo (SSPi), con Base en Leucaena Leucocephala (Estudio de Caso en el Municipio de Tepalcatepec, Michoacán, México).” Avances en Investigación Agropecuaria 17 (3): 35-50.
Gool, L. 2017. “Land Life Company Raises 2.4 Million Euro Series a Round.” https://startupjuncture.com/2017/01/25/land-life-company-raises-2-4-million-euro-series-a-round/?via=indexdotco. Accessed January 31.
Gourevitch, J.D., P. Howthorne, B.L. Keeler, C.R. Beatty, M. Greve, and M. Verdone. 2016. “Optimizing Investments in National-Scale Forest Landscape Restoration in Uganda to Maximize Multiple Benefits.” Environmental Research Letters 11 (11): 1–9.
Government of Canada. 2016. “Government of Canada Announces Pan-Canadian Pricing on Carbon Pollution.” https://www.canada.ca/en/environment-climate-change/news/2016/10/government-canada-announces-canadian-pricing-carbon-pollution.html.
Greenpeace. 2015. “The Amazon’s Silent Crisis: License to Launder.” http://www.greenpeace.org/brasil/Global/brasil/documentos/2015/greenpeace_amazon_license_to_launder.pdf.

WRI.org 70
Gregorio N., J. Herbohn, S. Harrison, A. Pasa, J. Fernandez, R. Tripoli, and B. Polinar. 2015. “Evidence-Based Best Practice Community-Based Forest Restoration in Biliran: Integrating Food Security and Livelihood Improvements into Watershed Rehabilitation in the Philippines.” In Enhancing Food Security through Forest Landscape Restoration: Lessons from Burkina Faso, Brazil, Guatemala, Viet Nam, Ghana, Ethiopia and Philippines, edited by C. Kumar, C. Saint-Laurent, S. Begeladze, and M. Calmon. Gland, Switzerland: International Union for Conservation of Nature, 174–217. doi:10.2305/IUCN.CH.2015.FR.2.en.
Griscom, B.W., J. Adams, P.W. Ellis, R.A. Houghton, G. Lomax, D.A. Miteva, W.H. Schlesinger et al. 2017. “Natural Climate Solutions.” Proceedings of the National Academy of Science. doi: 10.1073/pnas.1710465114.
GSIA (Global Sustainable Investment Alliance). 2017. “The 2016 Global Sustainable Investment Review.” http://www.gsi-alliance.org/wp-content/uploads/2017/03/GSIR_Review2016.F.pdf. Accessed October 23.
Haglund, E., J. Ndjeunga, L. Snook, and D. Pasternak. 2011. “Dry Land Tree Management for Improved Household Livelihoods: Farmer Managed Natural Regeneration in Niger.” Journal of Environmental Management 92: 1696–1705.
Hansen, M.C., P.V. Potapov, R. Moore, M. Hancher, S.A. Turubanova, A. Tyukavina, D. Thau et al. 2013. “High-Resolution Global Maps of 21st-Century Forest Cover Change.” Science 342: 850–853.
Hardin, G. 1968. “The Tragedy of the Commons.” Science 162 (3859): 1243–1248.
Harrison, S., and J. Herbohn. 2016. “Financial Evaluation of Forestry Investments: Common Pitfalls and Guidelines for Better Analyses.” Small-Scale Forestry 15: 463–479.
Hirtenstein, A. 2017. “Green Really Is Gold for These Bond Lovers.” Bloomberg, March 9. https://www.bloomberg.com/news/articles/2017-03-10/new-shades-of-green-bonds-seen-as-market-set-to-double-again.
IKEA. 2017. “Sow a Seed.” http://www.ikea.com/ms/en_SG/about_ikea/our_responsibility/ikea_forest_projects/sow_a_seed.html. Accessed September 22.
Holloway, L.L., A.H. Andrianjara, and J.M. Zafindrandalana. 2009. “Direct costs of Masoala Corridors Restoration Project.” Masoala National Park, Madagascar.
Holloway, L.L. and C.C.D. Tingle. 2009. “Direct costs of Tetik'asa Mampody Savoka (TAMS).” Ankeniheny-Zahamena Mantadia Biodiversity Conservation Corridor and Restoration Project, Madagascar. http://wbcarbonfinance.org/Router.cfm?Page=BioCF&FID=9708&ItemID=9708&ft=Projects&ProjID=9638.
IPBES (Intergovernmental Science-Policy Platform on Biodiversity and Ecosystem Services). 2016. “Individual Chapters of the Methodological Assessment of Scenarios and Models of Biodiversity and Ecosystem Services (Deliverable 3 (c)).” Bonn: Intergovernmental Science-Policy Platform on Biodiversity and Ecosystem Services (IPBES). http://www.ipbes.net/sites/default/files/downloads/pdf/Deliverable%203c%20Individual%20chapters%203%20Oct.pdf.
ITC (International Trade Centre). 2017. “Importing Markets in 2016: Exporting Country: Brazil. Soya Beans.” http://www.trademap.org/tradestat/index.aspx. Accessed November 2.
IUCN (International Union for Conservation of Nature). 2012. “Enhancement of Natural Capital through Forest and Landscape Restoration (FLR). United States.” https://cmsdata.iucn.org/downloads/policy_brief_on_forest_restoration_2.pdf.
IUCN and WRI. 2014. “A Guide to the Restoration Opportunities Assessment Methodology (ROAM): Assessing Forest Landscape Restoration Opportunities at the National or Sub-National Level.” Working Paper. Gland, Switzerland: IUCN and WRI.
Jansen, H., A. Nieuwenhuyse, M. Ibrahim, and S. Abarca., 1997. “Evaluación Económica de la Incorporación de Leguminosas en Pasturas Mejoradas, Comparada con Sistemas Tradicionales de Alimentación en la Zona Atlántica de Costa Rica. Avances de Investigación.” Agroforestería en las Américas 4 (15): 9–13.
JP Morgan (JP Morgan Chase & Co). 2017. “JPMorgan Chase to Be 100 Percent Reliant on Renewable Energy by 2020; Announces $200 Billion Clean Energy Financing Commitment.” https://www.jpmorganchase.com/corporate/Corporate-Responsibility/document/jpmc-cr-sustainability-fact-sheet.pdf. Accessed September 22.
Kirui, O.K. 2015. “Economics of Land Degradation and Improvement in Eastern Africa: The Case of Tanzania and Malawi.” In Economics of Land Degradation and Improvement: A Global Assessment for Sustainable Development, edited by E. Nkonya, A. Mirzabaev, and J. von Braun. Cham, Switzerland: Springer International Publishing.
Kissinger, G. 2014. “Integrated Landscape Initiative Analysis.” In Financing Strategies for Integrated Landscape Investment, edited by S. Shames. Washington, DC: EcoAgriculture Partners, on behalf of the Landscapes for People, Food and Nature Initiative.
Klein, A.-M., B.E. Vaissiere, J.H. Cane, I. Steffan-Dewenter, S.A. Cunningham, C. Kremen, and T. Tscharntke. 2007. “Importance of Pollinators in Changing Landscapes for World Crops.” Proceedings of the Royal Society of London B: Biological Sciences 274: 303–313.
Kumar, P., ed. 2010. The Economics of Ecosystems and Biodiversity: Ecological and Economic Foundations. London and Washington, DC: Earthscan.
Ladrach, W. 2009. “Management of Teak Plantations for Solid Wood Products.” International Society of Tropical Foresters News. http://www.istf-bethesda.org/specialreports/teca_teak/teak.pdf.
Lawler J.J., J. Aukema, J. Grant, B. Halpern, P. Kareiva, C.R. Nelson, K. Ohleth, J.D. Olden, M.A. Schlaepfer, and B. Silliman. 2006. “Conservation Science: A 20-Year Report Card.” Frontier Ecological Environment 4: 473–480.
Lawn, P. 2016. Resolving the Climate Change Crisis: The Ecological Economics of Climate Change. Dordrecht, Netherlands: Springer Science+Business Media.
Lele S., O. Springate-Baginski, R. Lakerveld, D. Deb, and P. Dash. 2013. “Ecosystem Services: Origins, Contributions, Pitfalls, and Alternatives.” Conservation and Society 11 (4): 343–358.
Le News. 2015. “Big Rise in Swiss Carbon Tax from 1 January 2016.” http://lenews.ch/2015/12/29/big-rises-in-swiss-carbon-tax-from-1-january-2016/.
Li, H., S. Yao, R. Yin, and G. Liu. 2015. “Assessing the Decadal Impact of China’s Sloping Land Conversion Program on Household Income under Enrollment and Earning Differentiation.” Forest Policy and Economics 61: 95–103.

71Roots of Prosperity: The Economics and Finance of Restoring Land
Liang, Y., S. Li, M.W. Feldman, and G.C. Daily. 2012. “Does Household Composition Matter? The Impact of the Grain for Green Program on Rural Livelihoods in China.” Ecological Economics 75: 152–160.
Liquete, C., C. Piroddi, E.G. Drakou, L. Gurney, S. Katsanevakis, A. Charef, and B. Egoh. 2013. “Current Status and Future Prospects for the Assessment of Marine and Coastal Ecosystem Services: A Systematic Review.” PLOS One 8 (7): e67737. https://doi.org/10.1371/journal.pone.0067737.
Liu, C., S. Wang, H. Liu, and W. Zhu. 2013. “The impact of China’s Priority Forest Programs on rural households’ income mobility.” Land Use Policy 31: 237–248.
Lopez-Sanchez E., and M. Musalem. 2007. “Sistemas Agroforestales con Cedro Rojo, Cedro Nogal y Primavera Una Alternativa para el Desarrollo de Plantaciones Forestales Comerciales en los Tuxtlas, Veracruz, México.” Revista Chapingo Serie Ciencias Forestales y del Ambiente 13 (1): 59–66.
The Lyme Timber Company. 2017. “The Lyme Timber Company LP.” http://www.lymetimber.com/. Accessed September 22.
Maas, B., Y. Clough, and T. Tscharntke. 2013. “Bats and Birds Increase Crop Yield in Tropical Agroforestry Landscapes.” Ecology Letters 16: 1480–1487.
Maginnis, S., and W. Jackson. 2007. “What Is FLR and How Does It Differ from Current Approaches?” In The Forest Landscape Restoration Handbook, edited by J. Reitbergen-McCracken, S. Maginnis, and A. Sarre. London: Earthscan.
Masullo, I., G. Larsen, L. Brown, and L. Dougherty-Choux. 2015. “'Direct Access’ to Climate Finance: Lessons Learned by National Institutions.” Working Paper. Washington DC: World Resources Institute.
May, P.H., P. Bernasconi, S. Wunder, and R. Lubowski. 2015. “Environmental Reserve Quotas in Brazil’s New Forest Legislation: An Ex Ante Appraisal.” Occasional Paper 131. Bogor, Indonesia: Center for International Forestry Research. http://www.cifor.org/publications/pdf_files/OccPapers/OP-131.pdf.
McFarland, W., S. Whitley, and G. Kissinger. 2015. “Subsidies to Key Commodities Driving Forest Loss.” Working Paper. London: Overseas Development Institute. https://www.odi.org/sites/odi.org.uk/files/odi-assets/publications-opinion-files/9577.pdf.
Meléndez-Ortiz, R., C. Bellmann, and J. Hepburn. 2009. Agricultural Subsidies in the WTO Green Box: Ensuring Coherence with Sustainable Development Goals. Cambridge: Cambridge University Press.
Menkaus, S., and D.J. Lober. 1996. “International Ecotourism and the Valuation of Tropical Rainforest in Costa Rica.” Journal of Environmental Management 47: 1–10.
Mercer LLC. 2010. “Investment Horizons: Do Managers Do What They Say?” Mercer LLC. https://irrcinstitute.org/wp-content/uploads/2015/09/IRRCMercerInvestmentHorizonsReport_Feb20101.pdf.
Mercer, D.E., G.E. Frey, and F.W. Cubbage. 2014. “Economics of Agroforestry.” In Handbook of Forest Economics, edited by S. Kant and J.R.R. Alavalapati. New York: Routledge, 188–209. https://srs.fs.usda.gov/pubs/ja/2014/ja_2014_mercer_001.pdf.
Mewes M., M. Drechsler, K. Johst, A. Sturm, and F. Watzold. 2015. “A Systematic Approach for Assessing Spatially and Temporally Differentiated Opportunity Costs of Biodiversity Conservation Measures in Grasslands.” Agricultural Systems 137: 76–88.
MIGA (Multilateral Investment Guarantee Agency). 2012. “EcoPlanet Bamboo.” https://www.miga.org/Pages/Projects/Project.aspx?pid=1233.
MIGA. 2015a. Investment Guarantee Guide. Washington, DC: World Bank. https://www.miga.org/Pages/Resources/BrochuresOnProductsAndServices.aspx.
MIGA. 2015b. “EcoPlanet Bamboo.” https://www.miga.org/pages/projects/project.aspx?pid=1450.
Milcu, A., X. Ioana, J. Hanspach, D. Abson, and J. Fischer. 2013. “Cultural Ecosystem Services: A Literature Review and Prospects for Future Research.” Ecology and Society 18 (3): 44. http://dx.doi.org/10.5751/ES-05790-180344.
Millennium Ecosystem Assessment. 2005. Ecosystems and Human Well-Being: Synthesis. Washington, DC: Island Press. http://www.unep.org/maweb/documents/document.356.aspx.pdf.
Montagnini, F., E. Somarriba Chávez, H. Fassola, and B. Eibl. 2015. “Sistemas Agroforestales: Funciones Productivas, Socioeconómicas y Ambientales.” Serie técnica. Informe técnico 402. CATIE. Turrialba, Costa Rica.
Moringa. 2017. “Targets”. https://www.moringapartnership.com/targets/. Accessed July 17.
Mudaliar, A., A. Pineiro, and R. Bass. 2016. Impact Investing Trends: Evidence of a Growing Industry. New York: Global Impact Investing Network. https://thegiin.org/knowledge/publication/impact-investing-trends.
Mudaliar, A., H. Schiff, R. Bass, and H. Dithrich. 2017. 2017 Annual Impact Investor Survey. 7th ed. New York: Global Impact Investing Network. https://thegiin.org/assets/GIIN_AnnualImpactInvestorSurvey_2017_Web_Final.pdf.
Mudhara, M., and P.E. Hildebrand. 2005. “Assessment of Constraints to the Adoption of Improved Fallows in Zimbabwe Using Linear Programming Models.” In Valuing Agroforestry Systems, edited by J.R. Alavalapti and D.E. Mercer. New York: Kluwer Academic Publishers.
Mueller, B., and L.J. Alston. 2007. “Legal Reserve Requirements in Brazilian Forests: Path Dependent Evolution of De Facto Legislation.” http://www.anpec.org.br/encontro2007/artigos/A07A147.pdf.
MWE (Uganda Ministry of Water and Environment) and IUCN (International Union for the Conservation of Nature). 2016. “Forest Landscape Restoration Opportunity Assessment Report for Uganda.” https://portals.iucn.org/library/sites/library/files/documents/2016-076.pdf.
Navrud, S., and R. Ready. 2010. Environmental Value Transfer: Issues and Methods. Amstermdan: Springer International Publishing.
Nielsen-Pincus, M., and C. Moseley. 2013. “The Economic and Employment Impacts of Forest and Watershed Restoration.” Restoration Ecology 21 (2): 207–214, https://doi.org/10.1111/j.1526-100X.2012.00885.x.
Norman, M., and S. Nakhooda. 2015. The State of REDD+ Finance. Washington, DC: Center for Global Development.

WRI.org 72
Nunes F.S.M., B.S. Soares-Filho, R. Rajão, and F. Merry. 2017. “Enabling Large-Scale Forest Restoration in Minas Gerais State, Brazil.” Environmental Research 12 (044022). https://doi.org/10.1088/1748-9326/aa6658.
OECD (Organisation for Economic Co-operation and Development). 2010. The Use of Input Subsidies in Developing Countries. Paris: OECD. https://www.oecd.org/tad/agricultural-policies/46340359.pdf.
OECD. 2011. “Promoting Longer-Term Investment by Institutional Investors: Selected Issues and Policies.” Paper prepared for the EUROFI High Level Seminar, Paris, February 17–18, 2011. http://www.oecd.org/finance/private-pensions/48281131.pdf.
OECD. 2016. “Agricultural Policy Monitoring and Evaluation 2016: Highlights and Recommendations.” https://www.oecd.org/tad/agricultural-policies/agriculture-policy-monitoring-flyer-2016.pdf.
Ortiz Malavasi, E., L.F. Sage Mora, and C. Borge Carvajal. 2003. “Impacto del Programa de Pago de Servicios Ambientales en Costa Rica como Medio de Reducción de la Pobreza en los Medios Rurales.” Documento de Trabajo No. 8. San José, Costa Rica: Unidad Regional de Asistencia Técnica (RUTA).
Padovezi, A. 2015. “A COP21 Surprise: Brazilian States Commit to Restore More than 3 Million Hectares of Degraded Land” (blog) December 22. http://www.wri.org/blog/2015/12/cop21-surprise-brazilian-states-commit-restore-more-3-million-hectares-degraded-land.
Pagiola S., A. Arcenas, and G. Platais. 2005. “Can Payments for Environmental Services Help Reduce Poverty? An Exploration of the Issues and the Evidence to Date from Latin America.” World Development 33 (2): 237–253.
Parker, C., M. Cranford, N. Oakes, and M. Leggett. 2012. The Little Biodiversity Finance Book. 3rd ed. Oxford: Global Canopy Programme. https://www.cbd.int/financial/hlp/doc/literature/LittleBiodiversityFinanceBook_3rd%20edition.pdf.
Pindyck, R. 2013. “Uncertainty in Environmental Economics.” Review of Environmental Economic Policy 1: 45–65.
Potapov, P., M.C. Hansen, L. Laestadius, S. Turubanova, A. Yaroshenko, C. Thies, W. Smith et al. 2017. “The Last Frontiers of Wilderness: Tracking Loss of Intact Forest Landscapes from 2000 to 2013.” Science Advances 3: e1600821.
PPCR (Pilot Program for Climate Resilience). 2017. “Sustainable Land and Water Resources Management Project (SLWRMP).” https://www.climateinvestmentfunds.org/projects/sustainable-land-and-water-resources-management-project-slwrmp. Accessed September 20.
Preclaw, R., and A. Bakshi. 2015. The Cost of Being Green. New York: Barclays. https://www.environmental-finance.com/assets/files/US_Credit_Focus_The_Cost_of_Being_Green.pdf.
Raes, L., T. Nello, and J.F. Fonseca. In Preparation. “Análisis Económico de las Categorías de Intervención para la Restauración de Paisajes Productivos en El Salvador.” UICN-ORMACC.
Ramírez P. 2005. "Diseño de un Sistema Agroforestal basado en Café Robusta que incrementa la Sustentabilidad, Rentabilidad y Equidad, en la Amazonia Ecuatoriana." Tesis de Grado Magister en Gestión en Desarrollo Rural y Agricultura Sustentable. Universidad Católica de Temuco, Chile.
Reij, C., G. Tappan, and M. Smale. 2009. “Agroenvironmental Transformation in the Sahel. Another Kind of ‘Green Revolution’.” IFPRI Discussion Paper 00914. Washington, DC: International Food Policy Research Institute.
Republic of Malawi. 2017. National Forest Landscape Restoration Strategy. Lilongwe, Malawi: The Ministry of Natural Resources.
Restore the Earth Foundation. 2016. “Restore the Earth Foundation.” http://restoretheearth.org/.
RNRA (Rwanda Natural Resource Authority) and IUCN (International Union for the Conservation of Nature). 2015. “Forest Landscape Restoration Opportunity Assessment Report for Rwanda.” http://cmsdata.iucn.org/downloads/roar_web_version.pdf.
Rocha, C., C.A. Cárdenas, and J.M. Delgado. 2013. “Costos de Establecimiento de un Sistema Silvopastoril de Sauco (Sambucus nigra) y Kikuyo (Penisetum clandestinum) en Roncesvalles (Tolima).” Revista Agroforestería Neotropical 3: 70–76.
Rojas Y., S. Muller-Using, M. Martin, and B. Muller-Using. 2012. Rentabilidad Económica de Distintas Propuesas Silvicolas para los Renovales de Nothofagus en el Centro Sur de Chile. Instituto Forestal, Ministerio de Agricultura, Chile.
Rosen, H.S., and A.J.W. Sappington. 2015. “What Do University Endowment Managers Worry About? An Analysis of Alternative Asset Investments and Background Income.” Working Paper No. 244. Princeton, NJ: Griswold Center for Economic Policy Studies. http://www.princeton.edu/ceps/workingpapers/244rosen.pdf.
Roxburgh, C., S. Lund, and J. Piotrowski. 2011. “Mapping Global Capital Markets 2011.” http://www.mckinsey.com/industries/private-equity-and-principal-investors/our-insights/mapping-global-capital-markets-2011.
Sabogal, C., C. Besacier, and D. McGuire. 2015. “Forest and Landscape Restoration: Concepts, Approaches and Challenges for Implementation.” Unasylva 245 (66): 3–10.
Sáenz, L., M. Mulligan, F. Arjona, and T. Gutierrez. 2014. “The Role of Cloud Forest Restoration on Energy Security.” Ecosystem Services 9: 180–190. https://doi.org/10.1016/j.ecoser.2014.06.012.
Sandewall, M., H. Kassa, S. Wu, P.V. Khoa, Y. He, and B. Ohlsson. 2015. “Policies to Promote Household Based Plantation Forestry and Their Impacts on Livelihoods and the Environment: Cases from Ethiopia, China, Vietnam, and Sweden.” International Forest Review 17: 98–111.
SBA (Small Business Administration). 2017. “Investment Capital.” https://www.sba.gov/funding-programs/investment-capital.
SEIA (Solar Energy Industries Association). 2017. “Solar Investment Tax Credit (ITC).” http://www.seia.org/policy/finance-tax/solar-investment-tax-credit. Accessed July 21.
Shiferaw, B., T. Kebede, M. Kassie, and M. Fisher. 2015. “Market Imperfections, Access to Information and Technology Adoption in Uganda: Challenges of Overcoming Multiple Constraints.” Agricultural Economics 46 (4): 475–488.
Statistics Norway. 2017. “Emissions of Greenhouse Gases.” https://www.ssb.no/en/klimagassn. Accessed May 19.

73Roots of Prosperity: The Economics and Finance of Restoring Land
Stefanes, M., J.M. Ochoa Quintero, F. de Oliveira Roque, L.S. Moreira Sugai, L. Reverberi Tambosi, R. Lourival, and S. Laurance. 2016. “Incorporating Resilience and Cost in Ecological Restoration Strategies at Landscape Scale.” Ecology and Society 21 (4): 54.
Sunding, K.N. 2011. “Toward an Era of Restoration in Ecology: Successes, Failures, and Opportunities Ahead.” Annual Review of Ecology, Evolution, and Systematics 42: 465–87. Doi: 10.1146/annurev-ecolsys-102710-145115.
Sutton, P.C., S. Anderson, R. Costanza, and I. Kubiszewski. 2016. “The Ecological Economics of Land Degradation: Impacts on Ecosystem Service Values.” Ecological Economics 129: 182–192.
Swinfield, T., R. Afriandi, F. Antoni, and R.D. Harrison. 2016. “Accelerating Tropical Forest Restoration through the Selective Removal of Pioneer Species.” Forest Ecology and Management 381: 209–216.
Swinkels, R., and S. Franzel. 1997. “Adoption Potential of Hedgerow Intercropping in the Maize-Based Cropping Systems in the Highlands of Western Kenya. Part II: Economic and Farmers’ Evaluation.” Experimental Agriculture 33: 211–223.
Talberth J., E. Gray, L. Yonavjak, and T. Gartner. 2013. “Green versus Gray: Nature’s Solutions to Infrastructure Demands.” https://www.thesolutionsjournal.com/article/green-versus-gray-natures-solutions-to-infrastructure-demands/.
TEEB (The Economics of Ecosystems and Biodiversity). 2009. The Economics of Ecosystems and Biodiversity—an Interim Report. Brussels: European Commission.
TNC (The Nature Conservancy). 2017. “Water Funds Help to Provide Fresh Water Today and into the Future.” https://www.nature.org/ourinitiatives/regions/latinamerica/water-funds-of-south-america.xml. Accessed September 22.
Thomas, S., P. Dargush, S. Harrison, and J. Herbohn. 2010. “Why Are There So Few Afforestation and Reforestation Clean Development Mechanism Projects?” Land Use Policy 27 (3): 880–887.
Turner, K.G., S. Anderson, M. Gonzales-Chang, R. Costanza, S. Courville, T. Dalgaard, E. Dominati et al. 2016. “A Review of Methods, Data, and Models to Assess Changes in the Value of Ecosystem Services from Land Degradation and Restoration.” Ecological Modelling 319: 190–207.
UNCCD (United Nations Convention to Combat Desertification). 2017. “LDN Fund Officially Launched.” http://www2.unccd.int/news-events/ldn-fund-officially-launched. Accessed September 12.
UNIDO (United Nations Industrial Development Organization). 2017. “Bundling Small-Scale Energy Efficiency Projects.” Issue Paper. http://www.unido.org/fileadmin/import/18562_Bundling_issue_paper.pdf. Accessed July 21.
US EPA (U.S. Environmental Protection Agency). 2016. “Climate Change Indicators: U.S. Greenhouse Gas Emissions.” https://www.epa.gov/climate-indicators/climate-change-indicators-us-greenhouse-gas-emissions.
Venter, O., E.W. Sanderson, A. Magrach, J.R. Allan, J. Beher, K.R. Jones, H.P. Possingham, W.F. Laurance, P. Wood, and B.M. Fekete. 2016. “Sixteen Years of Change in the Global Terrestrial Human Footprint and Implications for Biodiversity Conservation.” Nature Communications 7: 1–11.
Verdone, M.A., and A. Seidl. 2017. “Time, Space, Place and the Bonn Challenge Global Forest Restoration Target.” Restoration Ecology, 25: 903–911. doi:10.1111/rec.12512.
Vergara, W., L. Gallardo Lomeli, A. Rios, P. Isbell, S. Prager, and R. De Camino. 2016. The Economic Case of Landscape Restoration in Latin America. Washington, DC: WRI.
Villanueva, C., M. Ibrahim, and F. Casasola. 2008. “Valor Económico y Ecológico de las Cercas Vivas en Fincas y Paisajes Ganaderos.” Turrialba, Costa Rica: CATIE.
Vinholis, M.D., M.L.F. Nicodemo, P.M. Santos, and G. Cola. 2010. “Custo da Implantação de Sistemas de Produção Silvipastoris em São Carlos, SP.” In Enconotro Nacional de Engenharia de Produçã, 30, São Carlos, SP. Maturidade e desafios Da Engenharia de Produção: Competividade das Empresas, Condições de Trabalho, Meio Ambiente-Anais. São Carlos: ABEPRO.
Wagner, B., and R. Shropshire. 2009. “An Estimation of the Economic Impacts of Restoration in Montana.” Montana Department of Labor and Industry.
World Bank. 2000. Costa Rica: Forest Strategy and the Evolution of Land Use. Washington, DC: World Bank.
World Bank. 2011. “Gross Domestic Product 2010.” http://siteresources.worldbank.org/DATASTATISTICS/Resources/GDP.pdf.
World Bank. 2017a. “GDP (Current US$). Indonesia and Brazil.” http://data.worldbank.org/indicator/NY.GDP.MKTP.CD?locations=ID-BR. Accessed August 9.
World Bank. 2017b. “Forest Area (% of Land Area).” Washington DC: World Bank. http://data.worldbank.org/indicator/AG.LND.FRST.ZS. Accessed July 20.
World Bank Group. 2016. “World Bank Group Guarantee Products,” https://ppp.worldbank.org/public-private-partnership/sites/ppp.worldbank.org/files/documents/PPPCCSA_WBGGuarantees_Final%20_%20English%20_Printed%20Oct%202016.pdf.
World Bank Project Database. 2017. “Projects and Operations, The World Bank.” https://data.worldbank.org/data-catalog/projects-portfolio. Accessed November 20.
WRI (World Resources Institute). 2017. “African Forest Landscape Restoration Initiative (AFR100).” http://www.wri.org/our-work/project/AFR100/restoration-commitments. Accessed July 18.
WRI-UNEP DTU (United Nations Environment Programme and Technical University of Denmark). Forthcoming. Sustainable Development Guidance: Guidance for Assessing the Environmental, Social and Economic Impacts of Policies and Actions. Berlin: ICAT and United Nations Environment Programme.
Wuethrich, B. 2007. “Biodiversity. Reconstructing Brazil’s Atlantic Rainforest.” Science 315: 1070–1072.
Young, M., and D. MacDonald. 2006. “How Should We Discount the Future? An Environmental Perspective.” In Economics and the Future, edited by D. Pannell and S. Schilizzi. Northampton, MA: Edward Elgar Publishing, Inc.
Zambrano, A. M. A, E.N. Broadbent, and W.H. Durham. 2010. “Social and Environmental Effects of Ecotourism in the Osa Peninsula of Costa Rica: The Lapa Rios Case.” Journal of Ecotourism 9 (1): 62–83.
Zamora-Cristales R., M. Liere, W. Vergara, L. Gallardo, and M. Franco. In Preparation. “Economic Implications of Restoring Riparian Zones in Guatemala: The Role of Public Incentives.” Issue Brief. Washington, DC: World Resources Institute.
Zwick, S. 2017. “Where Will JPMorgan Chase Put Its 200 Billion Green Dollars?” http://www.ecosystemmarketplace.com/articles/where-will-jpmorgan-chase-put-its-200-billion-green-dollars/. Accessed July 31.

WRI.org 74
ACKNOWLEDGMENTSThis report benefited greatly from spirited discussions with all par-ticipants at the Expert Workshop on the Economics and Financing of Restoration Opportunities, organized by World Resources Institute in Washington, DC, on March 31, 2017.
The authors are grateful for the comments and suggestions on an early report outline provided by Amy W. Ando (University of Illinois and Resources for the Future), Christopher Delgado (World Bank and Johns Hopkins School of Advanced International Studies), Barbara Wagner (Montana Dept. of Labor and Industry), Edward Barbier (Colorado State University), and Stefanie Tye (WRI).
The authors also wish to express their particular thanks to the following individuals for their valuable guidance, critical reviews, and research support: Ana Ríos (Inter-America Development Bank), Anil Markandya (BC3), Caroline van Leenders (Dutch Ministry of Foreign Affairs), David Mayer (UNDP BIOFIN), Dolf de Groot (Wageningen University), Edward Davey (the Prince of Wales's Charitable Foundation), John Herbohn (University of the Sunshine Coast), Jon Strand (University of Oslo), Robert Beach (RTI International), Sara Scherr (Ecoagriculture), and Todd Bendor (UNC).
Many World Resources Institute colleagues provided comments on drafts of this report, including Fred Stolle, James Mulligan, Katie Reytar, Maria Franco Chuaire, Helen Mountford, Sean DeWitt, Laura Malaguzzi Valeri, Daryl Ditz, and Michelle Manion. The authors would also like to acknowledge those involved with graphic design, editing, and layout as well as communications and outreach: Carni Klirs, Julie Moretti, Emily Matthews, Barbara Karni, Caroline Gagne, James Anderson, Natasha Ferrari, John-Rob Pool, Deborah Zabarenko, Lauren Zelin and Ally Friedman.
We are pleased to acknowledge our institutional strategic partners, who provide core funding to WRI: Netherlands Ministry of Foreign Affairs, Royal Danish Ministry of Foreign Affairs, and Swedish International Development Cooperation Agency.
ABOUT THE AUTHORSHelen Ding is a Senior Environmental Economist with the Economics Center at WRI.Contact: [email protected]
Sofia Faruqi is Manager of the New Restoration Economy in the Forests Program at WRI.Contact: [email protected]
Andrew Wu is a Research Analyst in the New Restoration Economy in the Forests Program at WRI.Contact: [email protected]
Juan Carlos Altamirano is a Senior Economist with the Economics Center and the Open Climate Network at WRI.Contact: [email protected]
Andrés Anchondo Ortega is a Research Assistant in the New Restoration Economy in the Forests Program at WRI.Contact: [email protected]
Michael Verdone is a Senior Associate at BBC Research & Consulting.Contact: [email protected]
René Zamora Cristales is an Associate II with the Global Restoration Initiative in the Forests Program at WRI.Contact: [email protected]
Robin Chazdon is a Senior Fellow in the Forests program at WRI, Professor Emerita in the Ecology and Evolutionary Biology Department at the University of Connecticut, and a Research Professor at the University of the Sunshine Coast, Queensland, Australia.Contact: [email protected]
Walter Vergara is a Senior Fellow with the Global Restoration Initiative in the Forests Program and coordinator of Initiative 20x20 at WRI.Contact: [email protected]
PHOTO CREDITS Cover photo, Table of Conents, pg. 5, 13 (right), 14 Patrick Shepherd/CIFOR; pg. iv, 6 (left), 8, 35, 36 (right), 46 (left), 57 (left), 60, 63 (right) Ollivier Girard/CIFOR; pg. 2 Photo by Kate Evans/CIFOR; pg. 6 (right) BCClimateChampions; pg. 10 Ulet Ifansasti/CIFOR; pg. 13 (left) Mokhamad Edliadi/CIFOR; pg. 34 (left)cuatrok77, (right) Marlon del Aguila Guerrero/CIFOR; pg. 46 (left) PRONeil Williamson; pg. 49, 54, 62 (right) Marlon del Aguila Guerrero/CIFOR; pg. 57 (right) Joe Nkadaani/CIFOR; pg. 59 Sande Murunga/CIFOR; pg. 62 (left) Sande Murunga/CIFOR.

Copyright 2017 World Resources Institute. This work is licensed under the Creative Commons Attribution 4.0 International License. To view a copy of the license, visit http://creativecommons.org/licenses/by/4.0/
Each World Resources Institute report represents a timely, scholarly treatment of a subject of public concern. WRI takes responsibility for choosing the study topics and guaranteeing its authors and researchers freedom of inquiry. It also solicits and responds to the guidance of advisory panels and expert reviewers. Unless otherwise stated, however, all the interpretation and findings set forth in WRI publications are those of the authors.
Maps are for illustrative purposes and do not imply the expression of any opinion on the part of WRI, concerning the legal status of any country or territory or concerning the delimitation of frontiers or boundaries.
ABOUT WRIWorld Resources Institute is a global research organization that turns big ideas into action at the nexus of environment, economic opportunity, and human well-being.
Our ChallengeNatural resources are at the foundation of economic opportunity and human well-being. But today, we are depleting Earth’s resources at rates that are not sustainable, endangering economies and people’s lives. People depend on clean water, fertile land, healthy forests, and a stable climate. Livable cities and clean energy are essential for a sustainable planet. We must address these urgent, global challenges this decade.
Our VisionWe envision an equitable and prosperous planet driven by the wise management of natural resources. We aspire to create a world where the actions of government, business, and communities combine to eliminate poverty and sustain the natural environment for all people.
Our ApproachCOUNT ITWe start with data. We conduct independent research and draw on the latest technology to develop new insights and recommendations. Our rigorous analysis identifies risks, unveils opportunities, and informs smart strategies. We focus our efforts on influential and emerging economies where the future of sustainability will be determined.
CHANGE ITWe use our research to influence government policies, business strategies, and civil society action. We test projects with communities, companies, and government agencies to build a strong evidence base. Then, we work with partners to deliver change on the ground that alleviates poverty and strengthens society. We hold ourselves accountable to ensure our outcomes will be bold and enduring.
SCALE ITWe don’t think small. Once tested, we work with partners to adopt and expand our efforts regionally and globally. We engage with decision-makers to carry out our ideas and elevate our impact. We measure success through government and business actions that improve people’s lives and sustain a healthy environment.
Copyright 2017 World Resources Institute. This work is licensed under the Creative Commons Attribution 4.0 International License. To view a copy of the license, visit http://creativecommons.org/licenses/by/4.0/Copyright 2017 World Resources Institute. This work is licensed under the Creative Commons Attribution 4.0 International License. To view a copy of the license, visit http://creativecommons.org/licenses/by/4.0/

WRI.org 76
10 G STREET NE SUITE 800WASHINGTON, DC 20002, USA+1 (202) 729-7600WWW.WRI.ORG ISBN 978-1-56973-925-9