ROOK COUNTY Demographics - wyomingcda.com · County Profiles Crook County Wyoming Housing Database...
57
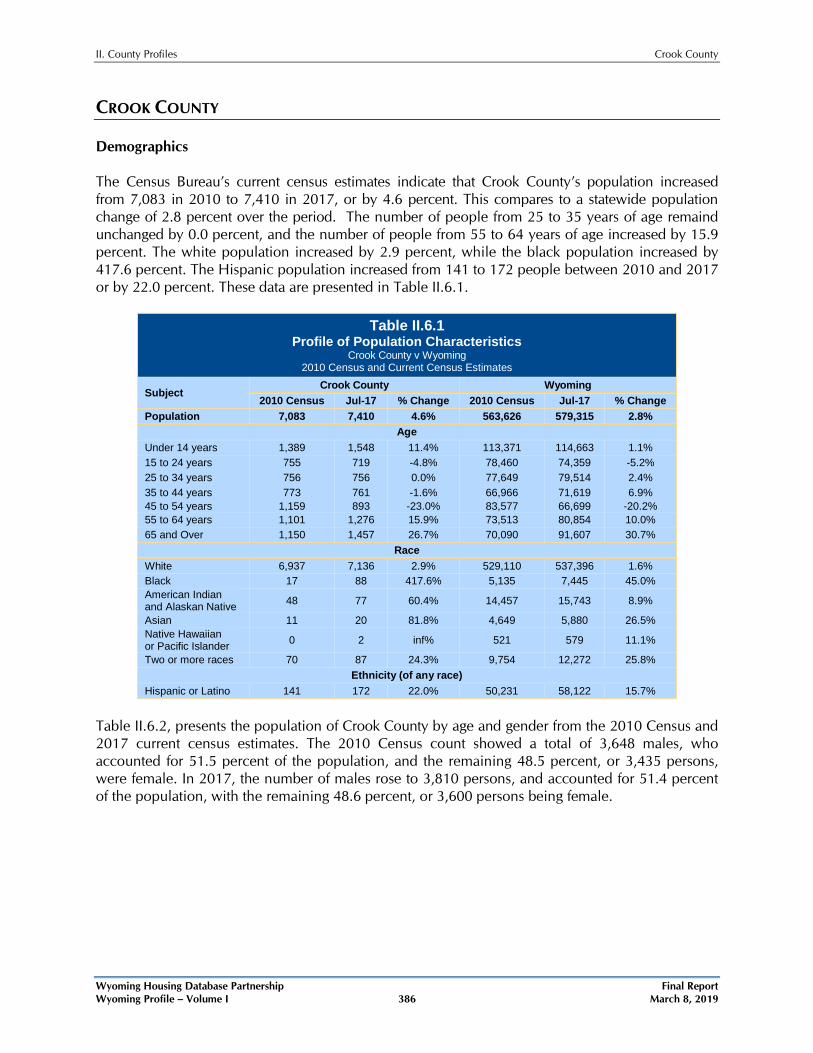
II. County Profiles Crook County Wyoming Housing Database Partnership Final Report Wyoming Profile – Volume I 386 March 8, 2019 CROOK COUNTY Demographics The Census Bureau’s current census estimates indicate that Crook County’s population increased from 7,083 in 2010 to 7,410 in 2017, or by 4.6 percent. This compares to a statewide population change of 2.8 percent over the period. The number of people from 25 to 35 years of age remaind unchanged by 0.0 percent, and the number of people from 55 to 64 years of age increased by 15.9 percent. The white population increased by 2.9 percent, while the black population increased by 417.6 percent. The Hispanic population increased from 141 to 172 people between 2010 and 2017 or by 22.0 percent. These data are presented in Table II.6.1. Table II.6.1 Profile of Population Characteristics Crook County v Wyoming 2010 Census and Current Census Estimates Subject Crook County Wyoming 2010 Census Jul-17 % Change 2010 Census Jul-17 % Change Population 7,083 7,410 4.6% 563,626 579,315 2.8% Age Under 14 years 1,389 1,548 11.4% 113,371 114,663 1.1% 15 to 24 years 755 719 -4.8% 78,460 74,359 -5.2% 25 to 34 years 756 756 0.0% 77,649 79,514 2.4% 35 to 44 years 773 761 -1.6% 66,966 71,619 6.9% 45 to 54 years 1,159 893 -23.0% 83,577 66,699 -20.2% 55 to 64 years 1,101 1,276 15.9% 73,513 80,854 10.0% 65 and Over 1,150 1,457 26.7% 70,090 91,607 30.7% Race White 6,937 7,136 2.9% 529,110 537,396 1.6% Black 17 88 417.6% 5,135 7,445 45.0% American Indian and Alaskan Native 48 77 60.4% 14,457 15,743 8.9% Asian 11 20 81.8% 4,649 5,880 26.5% Native Hawaiian or Pacific Islander 0 2 inf% 521 579 11.1% Two or more races 70 87 24.3% 9,754 12,272 25.8% Ethnicity (of any race) Hispanic or Latino 141 172 22.0% 50,231 58,122 15.7% Table II.6.2, presents the population of Crook County by age and gender from the 2010 Census and 2017 current census estimates. The 2010 Census count showed a total of 3,648 males, who accounted for 51.5 percent of the population, and the remaining 48.5 percent, or 3,435 persons, were female. In 2017, the number of males rose to 3,810 persons, and accounted for 51.4 percent of the population, with the remaining 48.6 percent, or 3,600 persons being female.
Transcript of ROOK COUNTY Demographics - wyomingcda.com · County Profiles Crook County Wyoming Housing Database...
II. County Profiles Crook County
Wyoming Housing Database Partnership Final Report Wyoming Profile – Volume I 386 March 8, 2019
CROOK COUNTY Demographics The Census Bureau’s current census estimates indicate that Crook County’s population increased from 7,083 in 2010 to 7,410 in 2017, or by 4.6 percent. This compares to a statewide population change of 2.8 percent over the period. The number of people from 25 to 35 years of age remaind unchanged by 0.0 percent, and the number of people from 55 to 64 years of age increased by 15.9 percent. The white population increased by 2.9 percent, while the black population increased by 417.6 percent. The Hispanic population increased from 141 to 172 people between 2010 and 2017 or by 22.0 percent. These data are presented in Table II.6.1.
Table II.6.1 Profile of Population Characteristics
Crook County v Wyoming 2010 Census and Current Census Estimates
Subject Crook County Wyoming
2010 Census Jul-17 % Change 2010 Census Jul-17 % Change Population 7,083 7,410 4.6% 563,626 579,315 2.8%
Age Under 14 years 1,389 1,548 11.4% 113,371 114,663 1.1% 15 to 24 years 755 719 -4.8% 78,460 74,359 -5.2% 25 to 34 years 756 756 0.0% 77,649 79,514 2.4% 35 to 44 years 773 761 -1.6% 66,966 71,619 6.9% 45 to 54 years 1,159 893 -23.0% 83,577 66,699 -20.2% 55 to 64 years 1,101 1,276 15.9% 73,513 80,854 10.0% 65 and Over 1,150 1,457 26.7% 70,090 91,607 30.7%
Race White 6,937 7,136 2.9% 529,110 537,396 1.6% Black 17 88 417.6% 5,135 7,445 45.0% American Indian and Alaskan Native 48 77 60.4% 14,457 15,743 8.9%
Asian 11 20 81.8% 4,649 5,880 26.5% Native Hawaiian or Pacific Islander 0 2 inf% 521 579 11.1%
Two or more races 70 87 24.3% 9,754 12,272 25.8% Ethnicity (of any race)
Hispanic or Latino 141 172 22.0% 50,231 58,122 15.7%
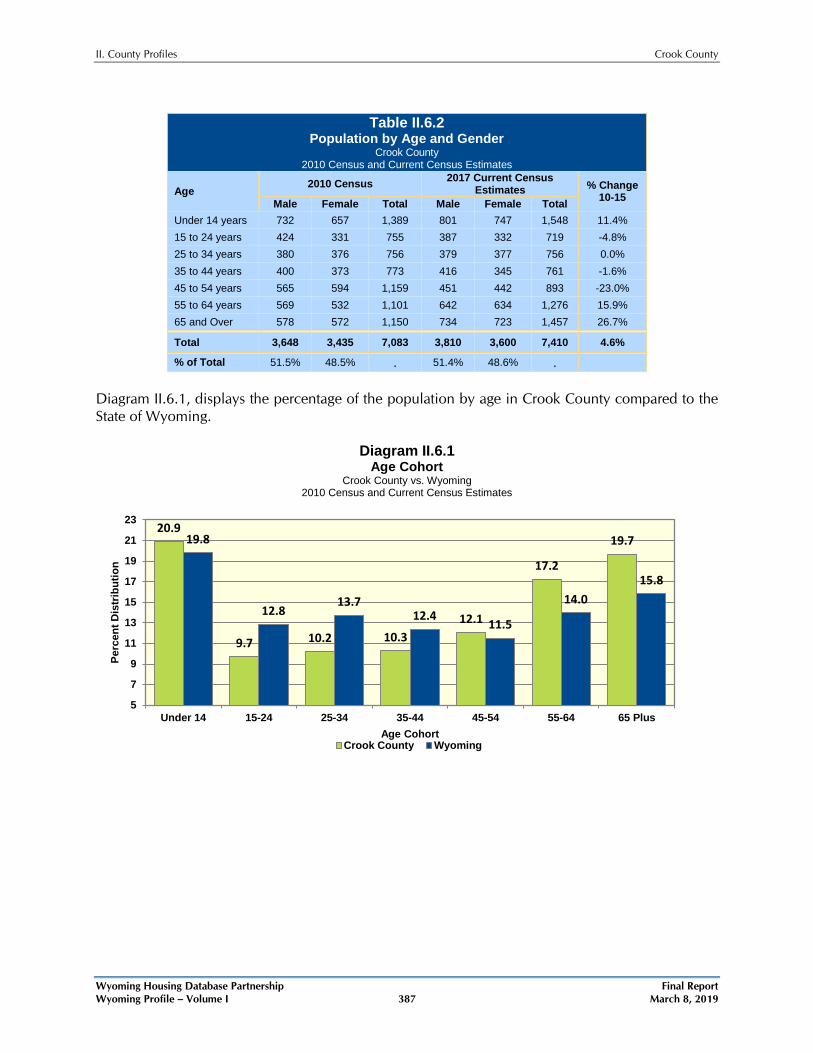
Table II.6.2, presents the population of Crook County by age and gender from the 2010 Census and 2017 current census estimates. The 2010 Census count showed a total of 3,648 males, who accounted for 51.5 percent of the population, and the remaining 48.5 percent, or 3,435 persons, were female. In 2017, the number of males rose to 3,810 persons, and accounted for 51.4 percent of the population, with the remaining 48.6 percent, or 3,600 persons being female.
II. County Profiles Crook County
Wyoming Housing Database Partnership Final Report Wyoming Profile – Volume I 387 March 8, 2019
Table II.6.2
Population by Age and Gender Crook County
2010 Census and Current Census Estimates
Age 2010 Census 2017 Current Census
Estimates % Change 10-15 Male Female Total Male Female Total
Under 14 years 732 657 1,389 801 747 1,548 11.4% 15 to 24 years 424 331 755 387 332 719 -4.8% 25 to 34 years 380 376 756 379 377 756 0.0% 35 to 44 years 400 373 773 416 345 761 -1.6% 45 to 54 years 565 594 1,159 451 442 893 -23.0% 55 to 64 years 569 532 1,101 642 634 1,276 15.9% 65 and Over 578 572 1,150 734 723 1,457 26.7%
Total 3,648 3,435 7,083 3,810 3,600 7,410 4.6%
% of Total 51.5% 48.5% . 51.4% 48.6% . Diagram II.6.1, displays the percentage of the population by age in Crook County compared to the State of Wyoming.
Diagram II.6.1 Age Cohort
Crook County vs. Wyoming 2010 Census and Current Census Estimates
20.9
9.7 10.2 10.3 12.1
17.2
19.7 19.8
12.8 13.7
12.4 11.5
14.0 15.8
5
7
9
11
13
15
17
19
21
23
Under 14 15-24 25-34 35-44 45-54 55-64 65 Plus
Perc
ent D
istr
ibut
ion
Age Cohort Crook County Wyoming

II. County Profiles Crook County
Wyoming Housing Database Partnership Final Report Wyoming Profile – Volume I 388 March 8, 2019
The Wyoming driver’s license data provided by the WYDOT indicated a net decrease of 72 persons during the first half of 2018. The driver’s license total exchanges since 2000 for Crook County are presented in Table II.6.3, and showed a net increase of 757 persons over the time period.
Table II.6.3 Driver’s Licenses Exchanged and Surrendered
Crook County vs Wyoming WYDOT Data, 2000 – 2018
Year In-Migrants Out-Migrants Net Change 2000 187 167 20 2001 202 146 56 2002 191 131 60 2003 173 141 32 2004 184 157 27 2005 192 151 41 2006 214 156 58 2007 260 130 130 2008 259 126 133 2009 231 148 83 2010 218 106 112 2011 171 142 29 2012 198 166 32 2013 191 185 6 2014 220 195 25 2015 172 194 -22 2016 166 186 -20 2017 216 189 27 2018 184 224 -40 Total 3,829 3,040 789
II. County Profiles Crook County
Wyoming Housing Database Partnership Final Report Wyoming Profile – Volume I 389 March 8, 2019
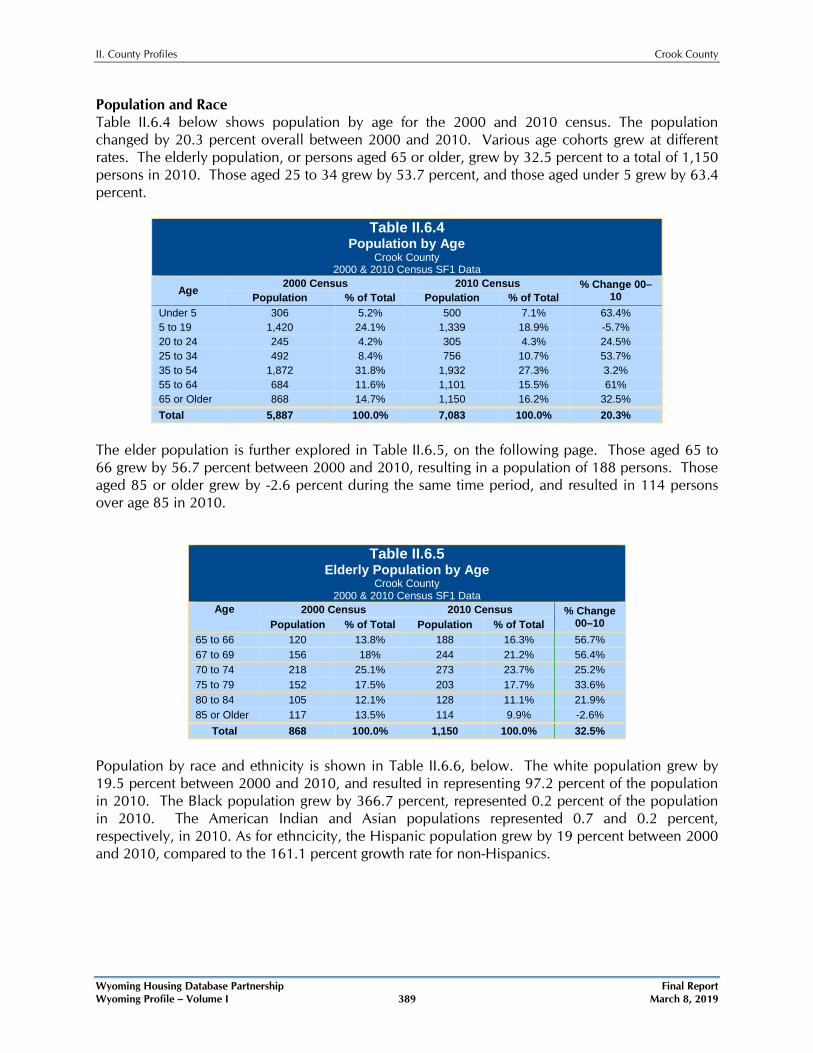
Population and Race Table II.6.4 below shows population by age for the 2000 and 2010 census. The population changed by 20.3 percent overall between 2000 and 2010. Various age cohorts grew at different rates. The elderly population, or persons aged 65 or older, grew by 32.5 percent to a total of 1,150 persons in 2010. Those aged 25 to 34 grew by 53.7 percent, and those aged under 5 grew by 63.4 percent.
Table II.6.4 Population by Age
Crook County 2000 & 2010 Census SF1 Data
Age 2000 Census 2010 Census % Change 00–10 Population % of Total Population % of Total
Under 5 306 5.2% 500 7.1% 63.4% 5 to 19 1,420 24.1% 1,339 18.9% -5.7% 20 to 24 245 4.2% 305 4.3% 24.5% 25 to 34 492 8.4% 756 10.7% 53.7% 35 to 54 1,872 31.8% 1,932 27.3% 3.2% 55 to 64 684 11.6% 1,101 15.5% 61% 65 or Older 868 14.7% 1,150 16.2% 32.5% Total 5,887 100.0% 7,083 100.0% 20.3%
The elder population is further explored in Table II.6.5, on the following page. Those aged 65 to 66 grew by 56.7 percent between 2000 and 2010, resulting in a population of 188 persons. Those aged 85 or older grew by -2.6 percent during the same time period, and resulted in 114 persons over age 85 in 2010.
Table II.6.5 Elderly Population by Age
Crook County 2000 & 2010 Census SF1 Data
Age 2000 Census 2010 Census % Change 00–10 Population % of Total Population % of Total
65 to 66 120 13.8% 188 16.3% 56.7% 67 to 69 156 18% 244 21.2% 56.4% 70 to 74 218 25.1% 273 23.7% 25.2% 75 to 79 152 17.5% 203 17.7% 33.6% 80 to 84 105 12.1% 128 11.1% 21.9% 85 or Older 117 13.5% 114 9.9% -2.6%
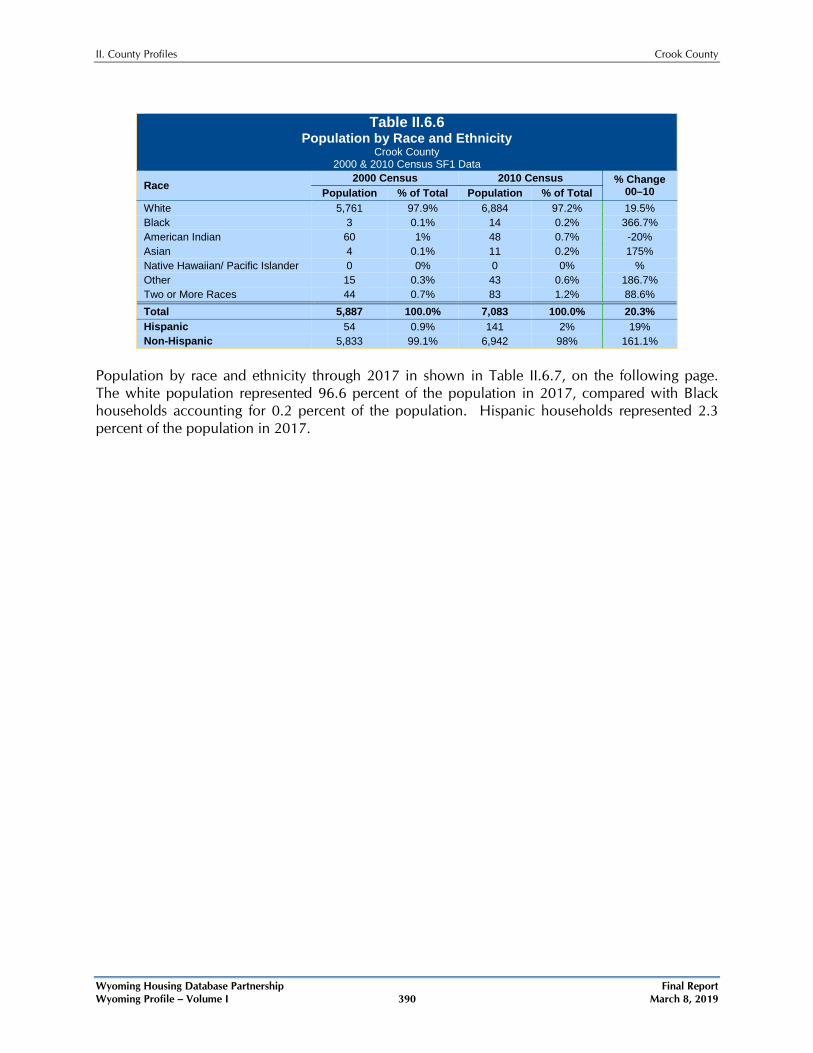
Total 868 100.0% 1,150 100.0% 32.5% Population by race and ethnicity is shown in Table II.6.6, below. The white population grew by 19.5 percent between 2000 and 2010, and resulted in representing 97.2 percent of the population in 2010. The Black population grew by 366.7 percent, represented 0.2 percent of the population in 2010. The American Indian and Asian populations represented 0.7 and 0.2 percent, respectively, in 2010. As for ethncicity, the Hispanic population grew by 19 percent between 2000 and 2010, compared to the 161.1 percent growth rate for non-Hispanics.
II. County Profiles Crook County
Wyoming Housing Database Partnership Final Report Wyoming Profile – Volume I 390 March 8, 2019
Table II.6.6
Population by Race and Ethnicity Crook County
2000 & 2010 Census SF1 Data
Race 2000 Census 2010 Census % Change
00–10 Population % of Total Population % of Total White 5,761 97.9% 6,884 97.2% 19.5% Black 3 0.1% 14 0.2% 366.7% American Indian 60 1% 48 0.7% -20% Asian 4 0.1% 11 0.2% 175% Native Hawaiian/ Pacific Islander 0 0% 0 0% % Other 15 0.3% 43 0.6% 186.7% Two or More Races 44 0.7% 83 1.2% 88.6% Total 5,887 100.0% 7,083 100.0% 20.3% Hispanic 54 0.9% 141 2% 19% Non-Hispanic 5,833 99.1% 6,942 98% 161.1%
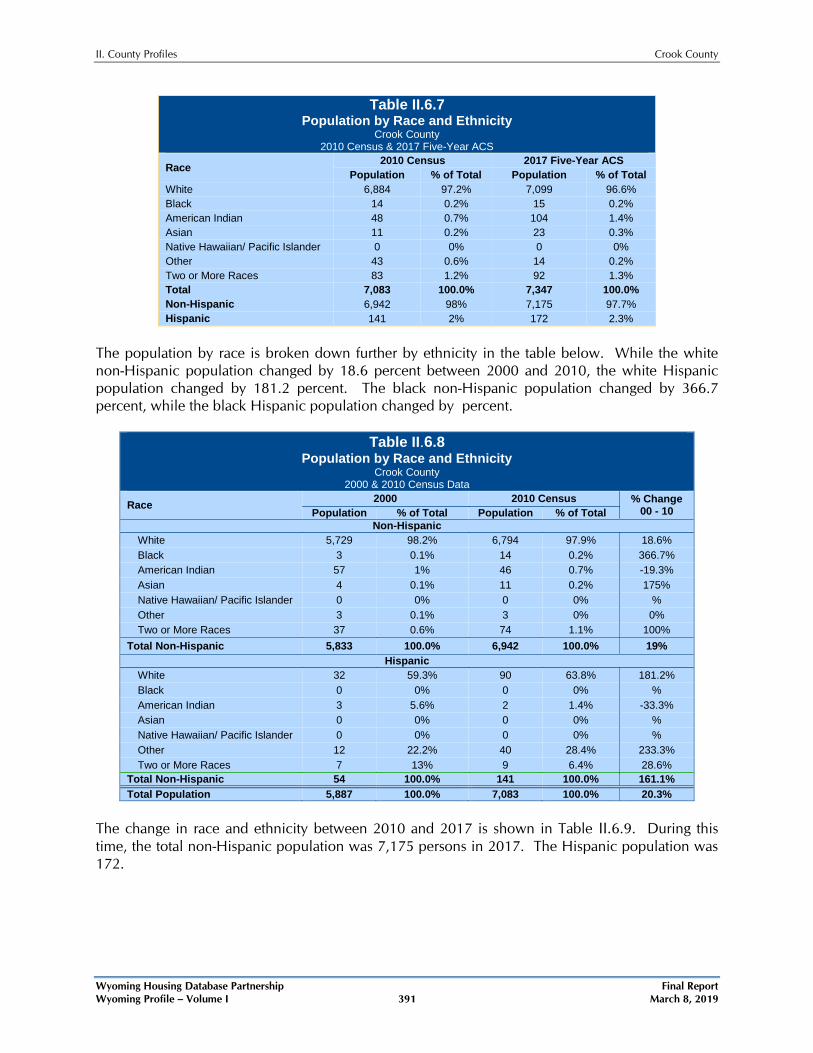
Population by race and ethnicity through 2017 in shown in Table II.6.7, on the following page. The white population represented 96.6 percent of the population in 2017, compared with Black households accounting for 0.2 percent of the population. Hispanic households represented 2.3 percent of the population in 2017.
II. County Profiles Crook County
Wyoming Housing Database Partnership Final Report Wyoming Profile – Volume I 391 March 8, 2019
Table II.6.7 Population by Race and Ethnicity
Crook County 2010 Census & 2017 Five-Year ACS
Race 2010 Census 2017 Five-Year ACS Population % of Total Population % of Total
White 6,884 97.2% 7,099 96.6% Black 14 0.2% 15 0.2% American Indian 48 0.7% 104 1.4% Asian 11 0.2% 23 0.3% Native Hawaiian/ Pacific Islander 0 0% 0 0% Other 43 0.6% 14 0.2% Two or More Races 83 1.2% 92 1.3% Total 7,083 100.0% 7,347 100.0% Non-Hispanic 6,942 98% 7,175 97.7% Hispanic 141 2% 172 2.3%
The population by race is broken down further by ethnicity in the table below. While the white non-Hispanic population changed by 18.6 percent between 2000 and 2010, the white Hispanic population changed by 181.2 percent. The black non-Hispanic population changed by 366.7 percent, while the black Hispanic population changed by percent.
Table II.6.8 Population by Race and Ethnicity
Crook County 2000 & 2010 Census Data
Race 2000 2010 Census % Change 00 - 10 Population % of Total Population % of Total
Non-Hispanic White 5,729 98.2% 6,794 97.9% 18.6% Black 3 0.1% 14 0.2% 366.7% American Indian 57 1% 46 0.7% -19.3% Asian 4 0.1% 11 0.2% 175% Native Hawaiian/ Pacific Islander 0 0% 0 0% % Other 3 0.1% 3 0% 0% Two or More Races 37 0.6% 74 1.1% 100%
Total Non-Hispanic 5,833 100.0% 6,942 100.0% 19% Hispanic
White 32 59.3% 90 63.8% 181.2% Black 0 0% 0 0% % American Indian 3 5.6% 2 1.4% -33.3% Asian 0 0% 0 0% % Native Hawaiian/ Pacific Islander 0 0% 0 0% % Other 12 22.2% 40 28.4% 233.3% Two or More Races 7 13% 9 6.4% 28.6%
Total Non-Hispanic 54 100.0% 141 100.0% 161.1% Total Population 5,887 100.0% 7,083 100.0% 20.3%
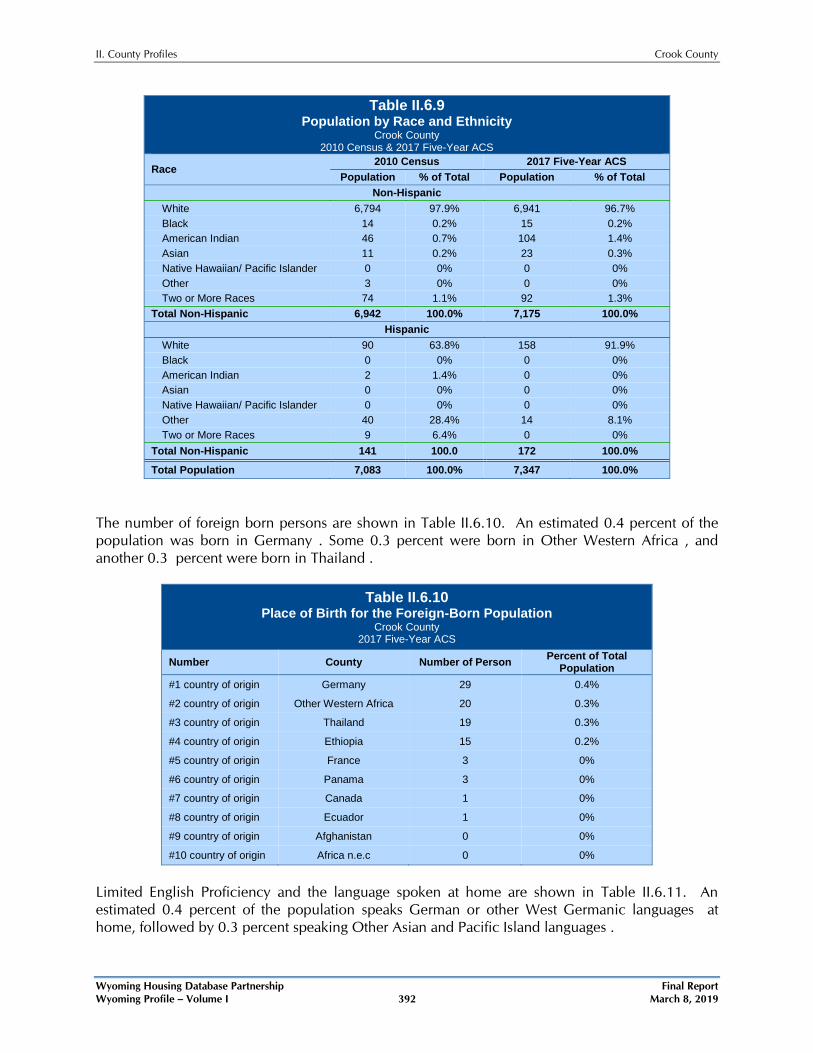
The change in race and ethnicity between 2010 and 2017 is shown in Table II.6.9. During this time, the total non-Hispanic population was 7,175 persons in 2017. The Hispanic population was 172.
II. County Profiles Crook County
Wyoming Housing Database Partnership Final Report Wyoming Profile – Volume I 392 March 8, 2019
Table II.6.9 Population by Race and Ethnicity
Crook County 2010 Census & 2017 Five-Year ACS
Race 2010 Census 2017 Five-Year ACS
Population % of Total Population % of Total Non-Hispanic
White 6,794 97.9% 6,941 96.7% Black 14 0.2% 15 0.2% American Indian 46 0.7% 104 1.4% Asian 11 0.2% 23 0.3% Native Hawaiian/ Pacific Islander 0 0% 0 0% Other 3 0% 0 0% Two or More Races 74 1.1% 92 1.3%
Total Non-Hispanic 6,942 100.0% 7,175 100.0% Hispanic
White 90 63.8% 158 91.9% Black 0 0% 0 0% American Indian 2 1.4% 0 0% Asian 0 0% 0 0% Native Hawaiian/ Pacific Islander 0 0% 0 0% Other 40 28.4% 14 8.1% Two or More Races 9 6.4% 0 0%
Total Non-Hispanic 141 100.0 172 100.0%
Total Population 7,083 100.0% 7,347 100.0%
The number of foreign born persons are shown in Table II.6.10. An estimated 0.4 percent of the population was born in Germany . Some 0.3 percent were born in Other Western Africa , and another 0.3 percent were born in Thailand .
Table II.6.10 Place of Birth for the Foreign-Born Population
Crook County 2017 Five-Year ACS
Number County Number of Person Percent of Total Population
#1 country of origin Germany 29 0.4%
#2 country of origin Other Western Africa 20 0.3%
#3 country of origin Thailand 19 0.3%
#4 country of origin Ethiopia 15 0.2%
#5 country of origin France 3 0%
#6 country of origin Panama 3 0%
#7 country of origin Canada 1 0%
#8 country of origin Ecuador 1 0%
#9 country of origin Afghanistan 0 0%
#10 country of origin Africa n.e.c 0 0%
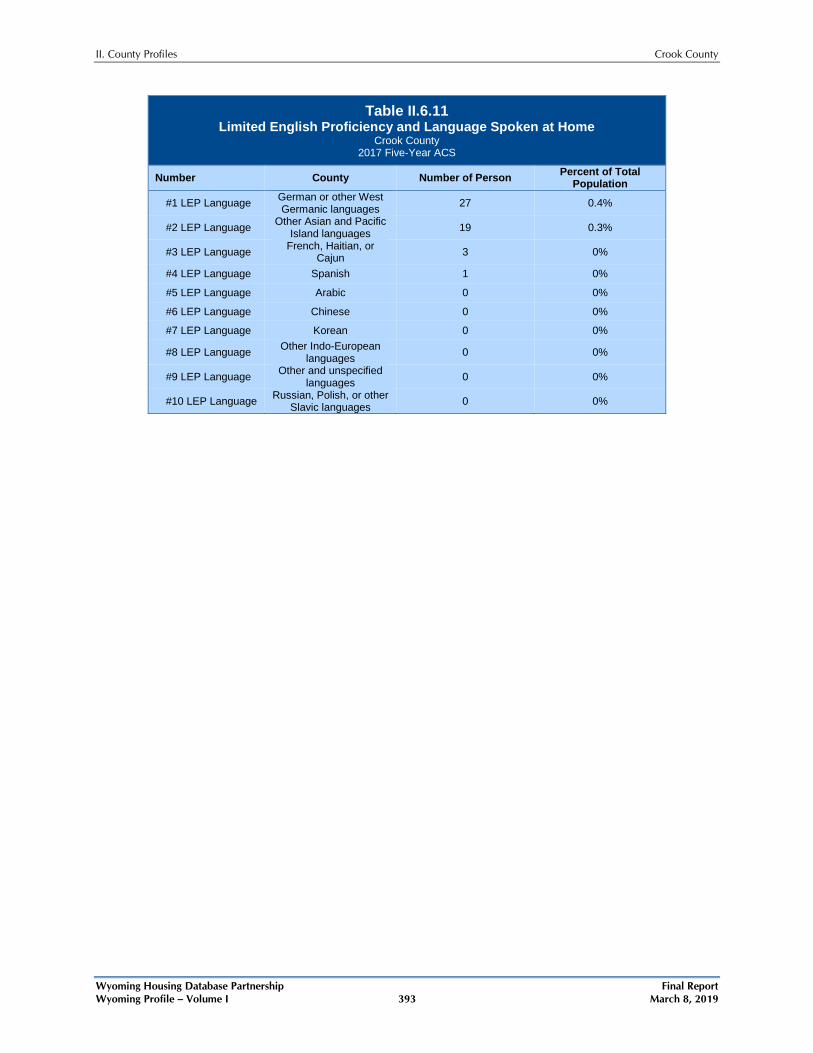
Limited English Proficiency and the language spoken at home are shown in Table II.6.11. An estimated 0.4 percent of the population speaks German or other West Germanic languages at home, followed by 0.3 percent speaking Other Asian and Pacific Island languages .
II. County Profiles Crook County
Wyoming Housing Database Partnership Final Report Wyoming Profile – Volume I 393 March 8, 2019
Table II.6.11 Limited English Proficiency and Language Spoken at Home
Crook County 2017 Five-Year ACS
Number County Number of Person Percent of Total Population
#1 LEP Language German or other West Germanic languages 27 0.4%
#2 LEP Language Other Asian and Pacific Island languages 19 0.3%
#3 LEP Language French, Haitian, or Cajun 3 0%
#4 LEP Language Spanish 1 0%
#5 LEP Language Arabic 0 0%
#6 LEP Language Chinese 0 0%
#7 LEP Language Korean 0 0%
#8 LEP Language Other Indo-European languages 0 0%
#9 LEP Language Other and unspecified languages 0 0%
#10 LEP Language Russian, Polish, or other Slavic languages 0 0%
II. County Profiles Crook County
Wyoming Housing Database Partnership Final Report Wyoming Profile – Volume I 394 March 8, 2019
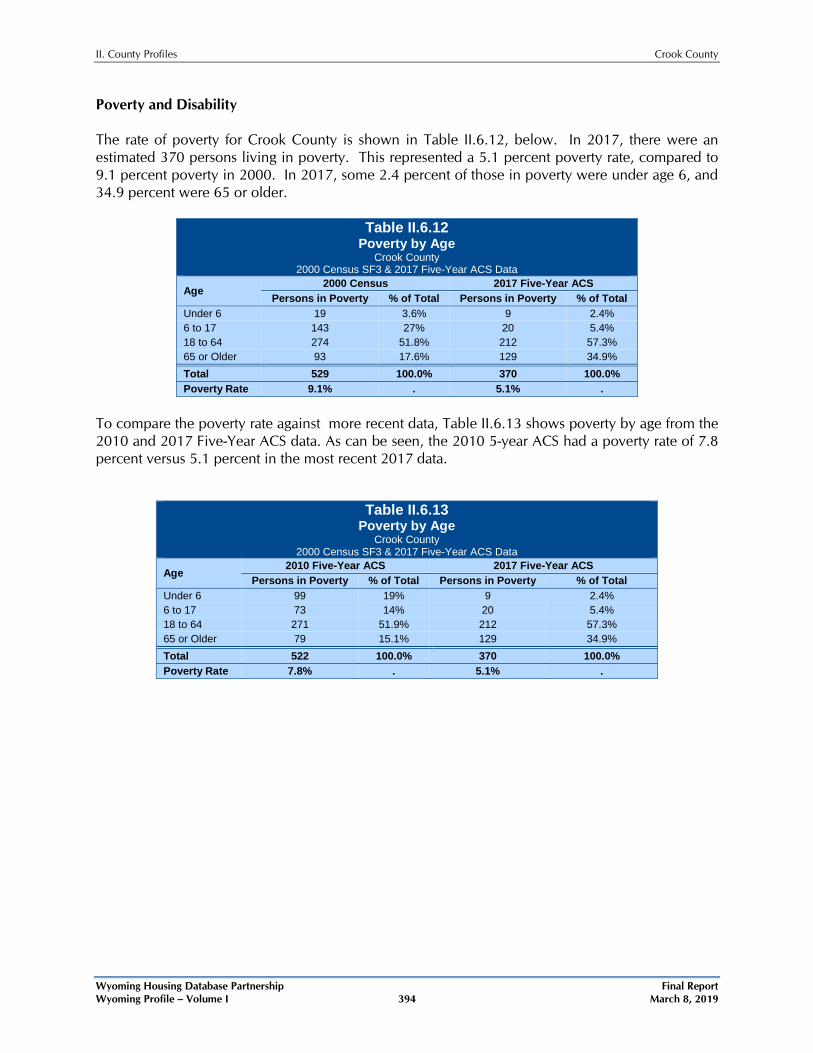
Poverty and Disability The rate of poverty for Crook County is shown in Table II.6.12, below. In 2017, there were an estimated 370 persons living in poverty. This represented a 5.1 percent poverty rate, compared to 9.1 percent poverty in 2000. In 2017, some 2.4 percent of those in poverty were under age 6, and 34.9 percent were 65 or older.
Table II.6.12 Poverty by Age
Crook County 2000 Census SF3 & 2017 Five-Year ACS Data
Age 2000 Census 2017 Five-Year ACS
Persons in Poverty % of Total Persons in Poverty % of Total Under 6 19 3.6% 9 2.4% 6 to 17 143 27% 20 5.4% 18 to 64 274 51.8% 212 57.3% 65 or Older 93 17.6% 129 34.9% Total 529 100.0% 370 100.0% Poverty Rate 9.1% . 5.1% .
To compare the poverty rate against more recent data, Table II.6.13 shows poverty by age from the 2010 and 2017 Five-Year ACS data. As can be seen, the 2010 5-year ACS had a poverty rate of 7.8 percent versus 5.1 percent in the most recent 2017 data.
Table II.6.13 Poverty by Age
Crook County 2000 Census SF3 & 2017 Five-Year ACS Data
Age 2010 Five-Year ACS 2017 Five-Year ACS
Persons in Poverty % of Total Persons in Poverty % of Total Under 6 99 19% 9 2.4% 6 to 17 73 14% 20 5.4% 18 to 64 271 51.9% 212 57.3% 65 or Older 79 15.1% 129 34.9% Total 522 100.0% 370 100.0% Poverty Rate 7.8% . 5.1% .
II. County Profiles Crook County
Wyoming Housing Database Partnership Final Report Wyoming Profile – Volume I 395 March 8, 2019
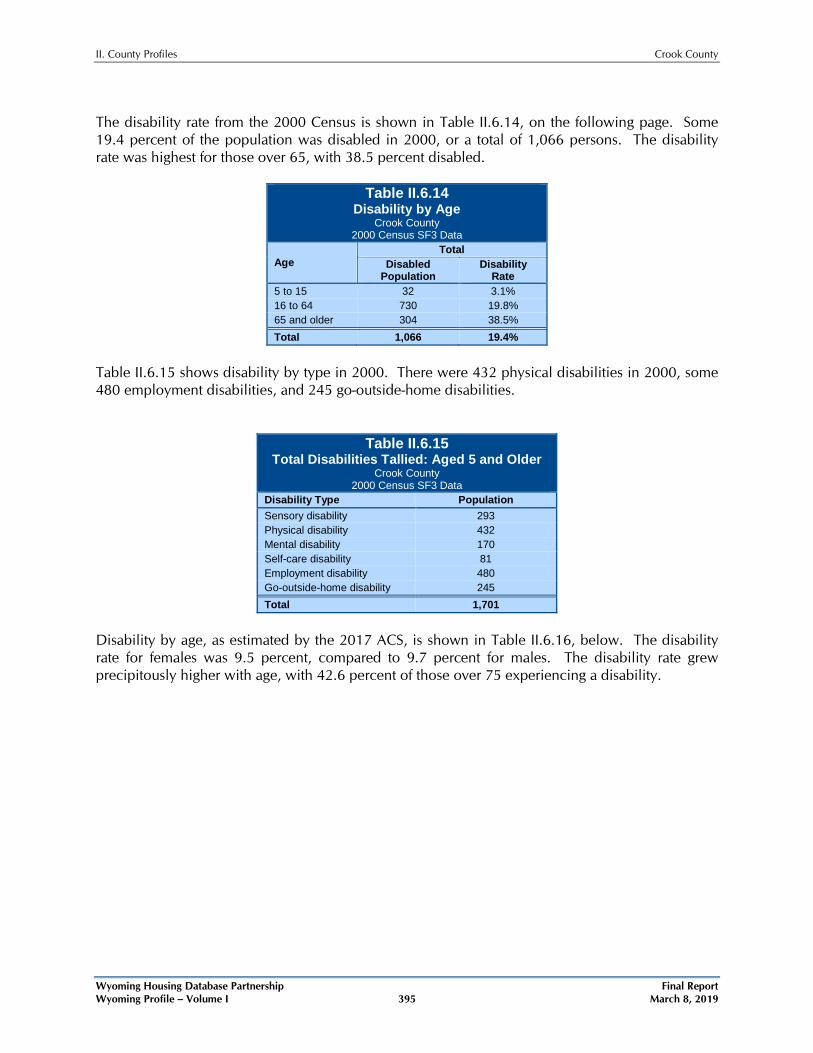
The disability rate from the 2000 Census is shown in Table II.6.14, on the following page. Some 19.4 percent of the population was disabled in 2000, or a total of 1,066 persons. The disability rate was highest for those over 65, with 38.5 percent disabled.
Table II.6.14 Disability by Age
Crook County 2000 Census SF3 Data
Age Total
Disabled Population
Disability Rate
5 to 15 32 3.1% 16 to 64 730 19.8% 65 and older 304 38.5% Total 1,066 19.4%
Table II.6.15 shows disability by type in 2000. There were 432 physical disabilities in 2000, some 480 employment disabilities, and 245 go-outside-home disabilities.
Table II.6.15 Total Disabilities Tallied: Aged 5 and Older
Crook County 2000 Census SF3 Data
Disability Type Population Sensory disability 293 Physical disability 432 Mental disability 170 Self-care disability 81 Employment disability 480 Go-outside-home disability 245 Total 1,701
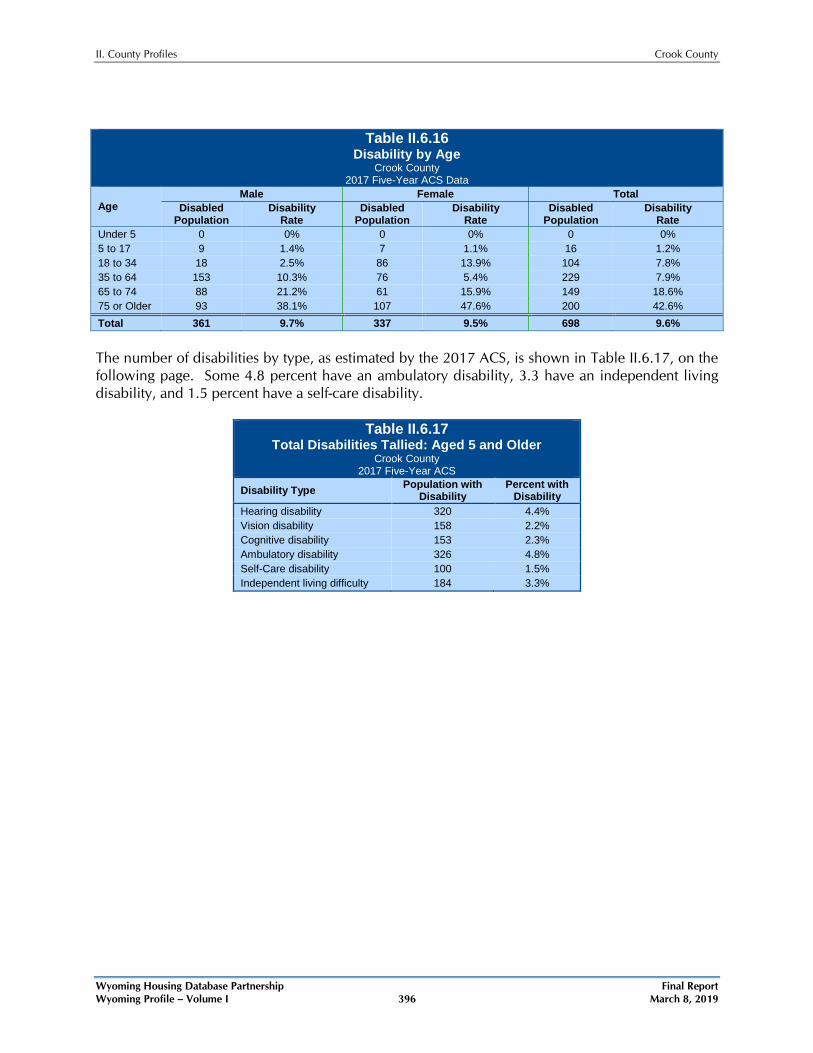
Disability by age, as estimated by the 2017 ACS, is shown in Table II.6.16, below. The disability rate for females was 9.5 percent, compared to 9.7 percent for males. The disability rate grew precipitously higher with age, with 42.6 percent of those over 75 experiencing a disability.
II. County Profiles Crook County
Wyoming Housing Database Partnership Final Report Wyoming Profile – Volume I 396 March 8, 2019
Table II.6.16 Disability by Age
Crook County 2017 Five-Year ACS Data
Age Male Female Total
Disabled Population
Disability Rate
Disabled Population
Disability Rate
Disabled Population
Disability Rate
Under 5 0 0% 0 0% 0 0% 5 to 17 9 1.4% 7 1.1% 16 1.2% 18 to 34 18 2.5% 86 13.9% 104 7.8% 35 to 64 153 10.3% 76 5.4% 229 7.9% 65 to 74 88 21.2% 61 15.9% 149 18.6% 75 or Older 93 38.1% 107 47.6% 200 42.6% Total 361 9.7% 337 9.5% 698 9.6% The number of disabilities by type, as estimated by the 2017 ACS, is shown in Table II.6.17, on the following page. Some 4.8 percent have an ambulatory disability, 3.3 have an independent living disability, and 1.5 percent have a self-care disability.
Table II.6.17 Total Disabilities Tallied: Aged 5 and Older
Crook County 2017 Five-Year ACS
Disability Type Population with Disability
Percent with Disability
Hearing disability 320 4.4% Vision disability 158 2.2% Cognitive disability 153 2.3% Ambulatory disability 326 4.8% Self-Care disability 100 1.5% Independent living difficulty 184 3.3%
II. County Profiles Crook County
Wyoming Housing Database Partnership Final Report Wyoming Profile – Volume I 397 March 8, 2019
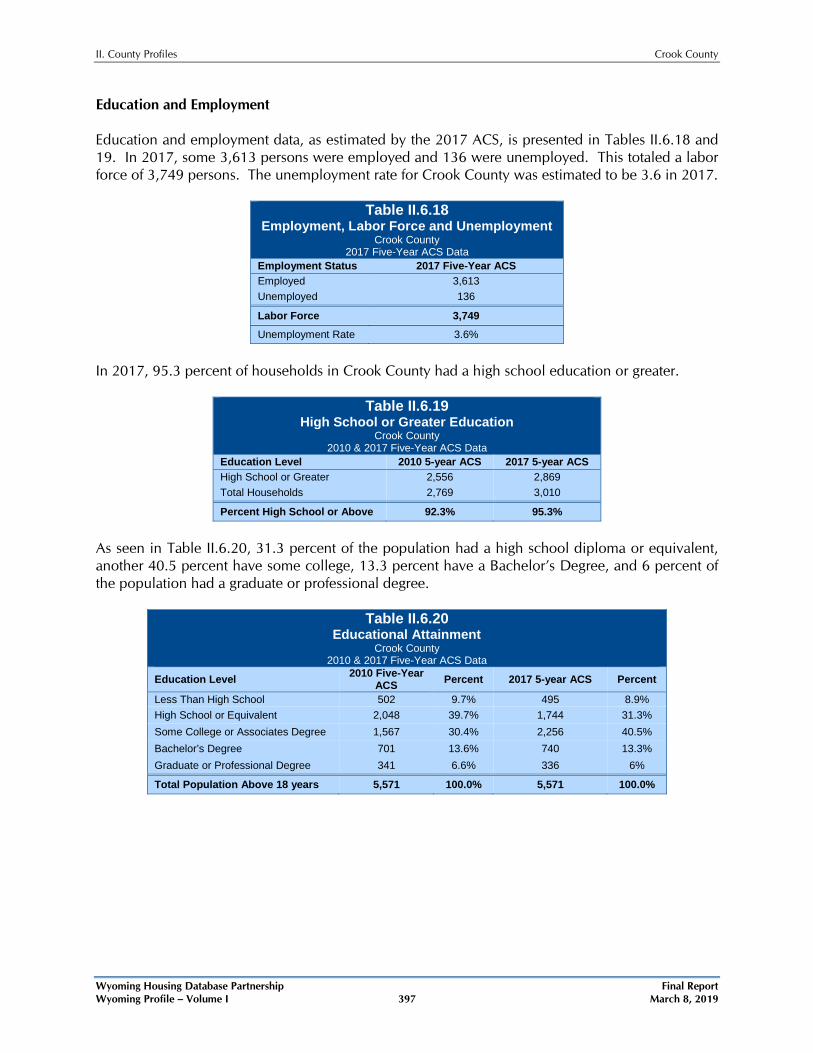
Education and Employment Education and employment data, as estimated by the 2017 ACS, is presented in Tables II.6.18 and 19. In 2017, some 3,613 persons were employed and 136 were unemployed. This totaled a labor force of 3,749 persons. The unemployment rate for Crook County was estimated to be 3.6 in 2017.
Table II.6.18 Employment, Labor Force and Unemployment
Crook County 2017 Five-Year ACS Data
Employment Status 2017 Five-Year ACS Employed 3,613 Unemployed 136
Labor Force 3,749
Unemployment Rate 3.6%
In 2017, 95.3 percent of households in Crook County had a high school education or greater.
Table II.6.19 High School or Greater Education
Crook County 2010 & 2017 Five-Year ACS Data
Education Level 2010 5-year ACS 2017 5-year ACS High School or Greater 2,556 2,869 Total Households 2,769 3,010
Percent High School or Above 92.3% 95.3%
As seen in Table II.6.20, 31.3 percent of the population had a high school diploma or equivalent, another 40.5 percent have some college, 13.3 percent have a Bachelor’s Degree, and 6 percent of the population had a graduate or professional degree.
Table II.6.20 Educational Attainment
Crook County 2010 & 2017 Five-Year ACS Data
Education Level 2010 Five-Year ACS Percent 2017 5-year ACS Percent
Less Than High School 502 9.7% 495 8.9% High School or Equivalent 2,048 39.7% 1,744 31.3% Some College or Associates Degree 1,567 30.4% 2,256 40.5% Bachelor’s Degree 701 13.6% 740 13.3% Graduate or Professional Degree 341 6.6% 336 6%
Total Population Above 18 years 5,571 100.0% 5,571 100.0%
II. County Profiles Crook County
Wyoming Housing Database Partnership Final Report Wyoming Profile – Volume I 398 March 8, 2019
Economics
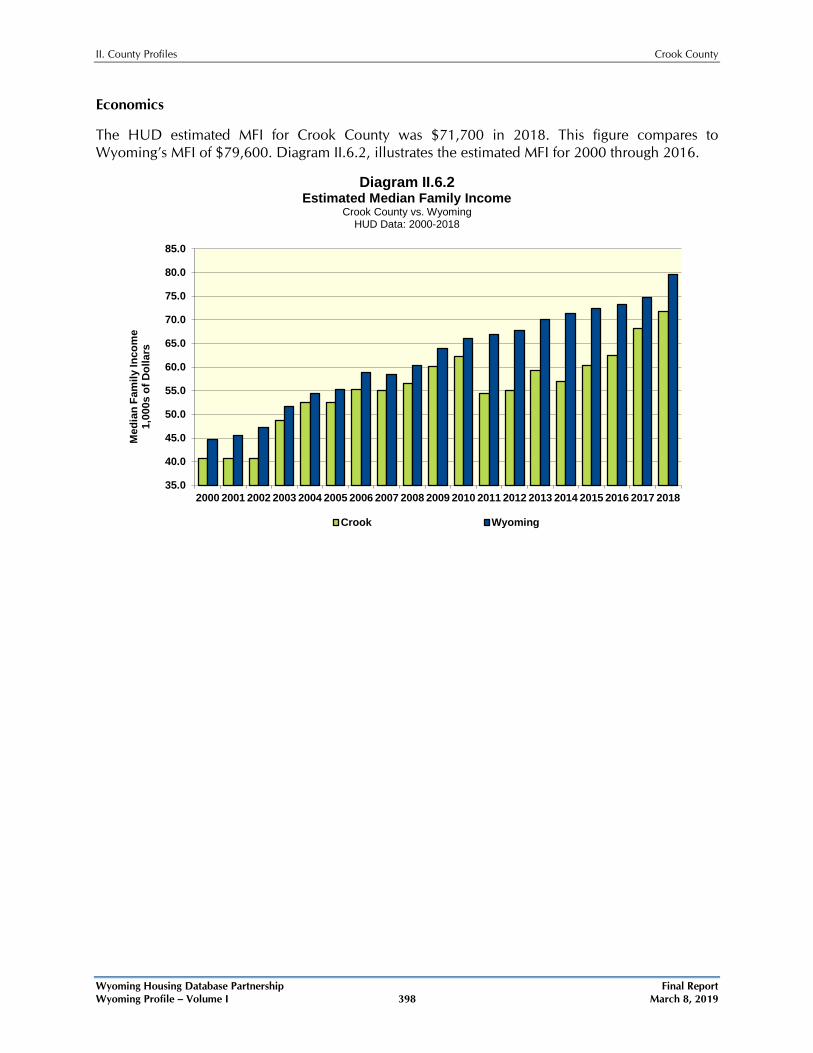
The HUD estimated MFI for Crook County was $71,700 in 2018. This figure compares to Wyoming’s MFI of $79,600. Diagram II.6.2, illustrates the estimated MFI for 2000 through 2016.
Diagram II.6.2 Estimated Median Family Income
Crook County vs. Wyoming HUD Data: 2000-2018
35.0
40.0
45.0
50.0
55.0
60.0
65.0
70.0
75.0
80.0
85.0
2000 2001 2002 2003 2004 2005 2006 2007 2008 2009 2010 2011 2012 2013 2014 2015 2016 2017 2018
Med
ian
Fam
ily In
com
e 1,
000s
of D
olla
rs
Crook Wyoming
II. County Profiles Crook County
Wyoming Housing Database Partnership Final Report Wyoming Profile – Volume I 399 March 8, 2019
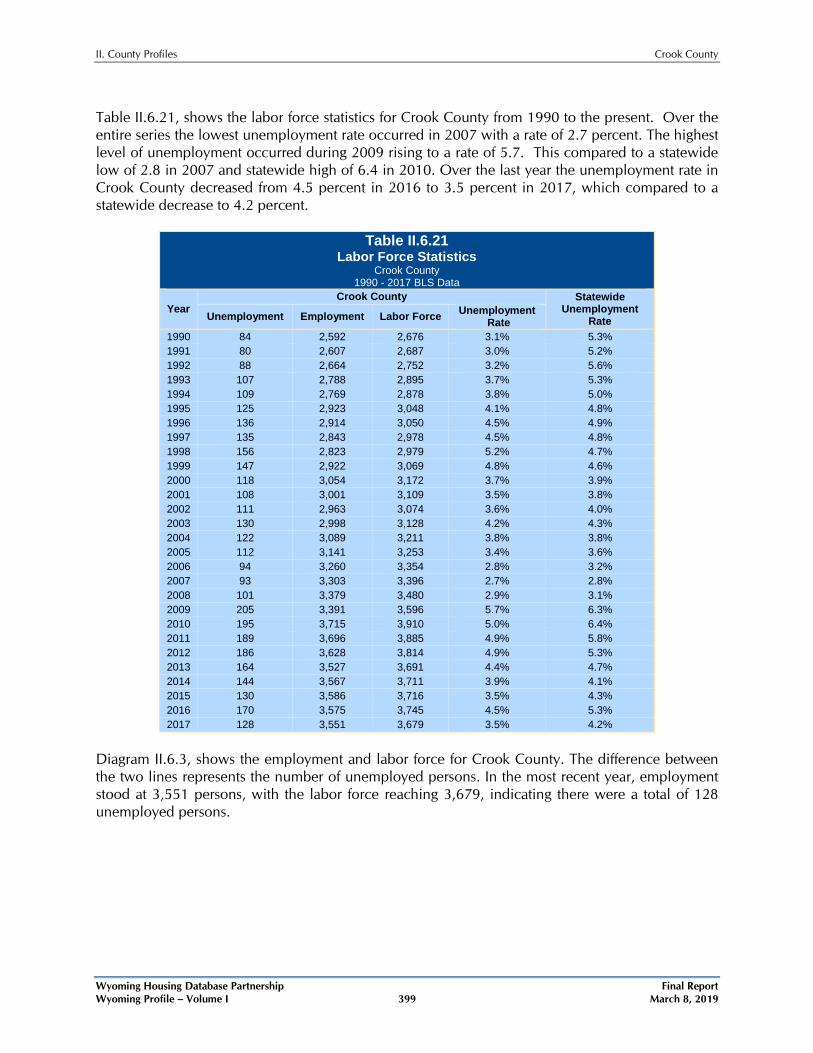
Table II.6.21, shows the labor force statistics for Crook County from 1990 to the present. Over the entire series the lowest unemployment rate occurred in 2007 with a rate of 2.7 percent. The highest level of unemployment occurred during 2009 rising to a rate of 5.7. This compared to a statewide low of 2.8 in 2007 and statewide high of 6.4 in 2010. Over the last year the unemployment rate in Crook County decreased from 4.5 percent in 2016 to 3.5 percent in 2017, which compared to a statewide decrease to 4.2 percent.
Table II.6.21 Labor Force Statistics
Crook County 1990 - 2017 BLS Data
Year Crook County Statewide
Unemployment Rate Unemployment Employment Labor Force Unemployment
Rate 1990 84 2,592 2,676 3.1% 5.3% 1991 80 2,607 2,687 3.0% 5.2% 1992 88 2,664 2,752 3.2% 5.6% 1993 107 2,788 2,895 3.7% 5.3% 1994 109 2,769 2,878 3.8% 5.0% 1995 125 2,923 3,048 4.1% 4.8% 1996 136 2,914 3,050 4.5% 4.9% 1997 135 2,843 2,978 4.5% 4.8% 1998 156 2,823 2,979 5.2% 4.7% 1999 147 2,922 3,069 4.8% 4.6% 2000 118 3,054 3,172 3.7% 3.9% 2001 108 3,001 3,109 3.5% 3.8% 2002 111 2,963 3,074 3.6% 4.0% 2003 130 2,998 3,128 4.2% 4.3% 2004 122 3,089 3,211 3.8% 3.8% 2005 112 3,141 3,253 3.4% 3.6% 2006 94 3,260 3,354 2.8% 3.2% 2007 93 3,303 3,396 2.7% 2.8% 2008 101 3,379 3,480 2.9% 3.1% 2009 205 3,391 3,596 5.7% 6.3% 2010 195 3,715 3,910 5.0% 6.4% 2011 189 3,696 3,885 4.9% 5.8% 2012 186 3,628 3,814 4.9% 5.3% 2013 164 3,527 3,691 4.4% 4.7% 2014 144 3,567 3,711 3.9% 4.1% 2015 130 3,586 3,716 3.5% 4.3% 2016 170 3,575 3,745 4.5% 5.3% 2017 128 3,551 3,679 3.5% 4.2%
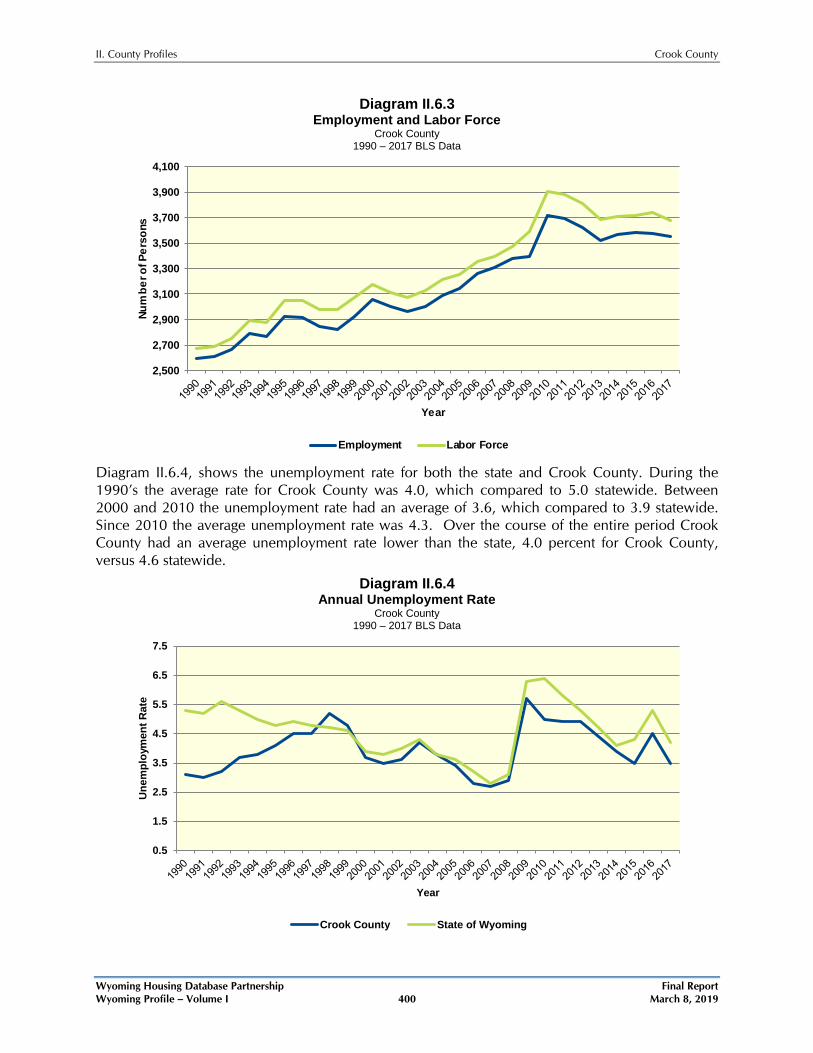
Diagram II.6.3, shows the employment and labor force for Crook County. The difference between the two lines represents the number of unemployed persons. In the most recent year, employment stood at 3,551 persons, with the labor force reaching 3,679, indicating there were a total of 128 unemployed persons.
II. County Profiles Crook County
Wyoming Housing Database Partnership Final Report Wyoming Profile – Volume I 400 March 8, 2019
Diagram II.6.3 Employment and Labor Force
Crook County 1990 – 2017 BLS Data
Diagram II.6.4, shows the unemployment rate for both the state and Crook County. During the 1990’s the average rate for Crook County was 4.0, which compared to 5.0 statewide. Between 2000 and 2010 the unemployment rate had an average of 3.6, which compared to 3.9 statewide. Since 2010 the average unemployment rate was 4.3. Over the course of the entire period Crook County had an average unemployment rate lower than the state, 4.0 percent for Crook County, versus 4.6 statewide.
Diagram II.6.4 Annual Unemployment Rate
Crook County 1990 – 2017 BLS Data
2,500
2,700
2,900
3,100
3,300
3,500
3,700
3,900
4,100
Num
ber o
f Per
sons
Year
Employment Labor Force
0.5
1.5
2.5
3.5
4.5
5.5
6.5
7.5
Une
mpl
oym
ent R
ate
Year
Crook County State of Wyoming
II. County Profiles Crook County
Wyoming Housing Database Partnership Final Report Wyoming Profile – Volume I 401 March 8, 2019
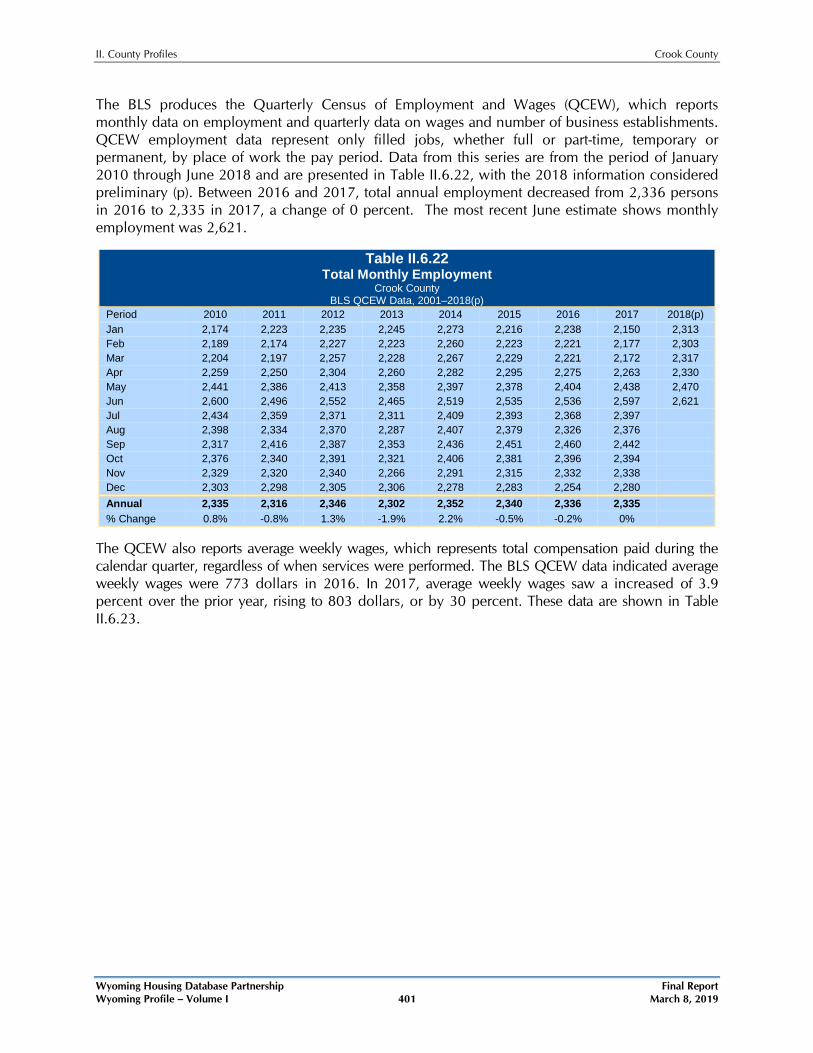
The BLS produces the Quarterly Census of Employment and Wages (QCEW), which reports monthly data on employment and quarterly data on wages and number of business establishments. QCEW employment data represent only filled jobs, whether full or part-time, temporary or permanent, by place of work the pay period. Data from this series are from the period of January 2010 through June 2018 and are presented in Table II.6.22, with the 2018 information considered preliminary (p). Between 2016 and 2017, total annual employment decreased from 2,336 persons in 2016 to 2,335 in 2017, a change of 0 percent. The most recent June estimate shows monthly employment was 2,621.
Table II.6.22 Total Monthly Employment
Crook County BLS QCEW Data, 2001–2018(p)
Period 2010 2011 2012 2013 2014 2015 2016 2017 2018(p) Jan 2,174 2,223 2,235 2,245 2,273 2,216 2,238 2,150 2,313 Feb 2,189 2,174 2,227 2,223 2,260 2,223 2,221 2,177 2,303 Mar 2,204 2,197 2,257 2,228 2,267 2,229 2,221 2,172 2,317 Apr 2,259 2,250 2,304 2,260 2,282 2,295 2,275 2,263 2,330 May 2,441 2,386 2,413 2,358 2,397 2,378 2,404 2,438 2,470 Jun 2,600 2,496 2,552 2,465 2,519 2,535 2,536 2,597 2,621 Jul 2,434 2,359 2,371 2,311 2,409 2,393 2,368 2,397 Aug 2,398 2,334 2,370 2,287 2,407 2,379 2,326 2,376 Sep 2,317 2,416 2,387 2,353 2,436 2,451 2,460 2,442 Oct 2,376 2,340 2,391 2,321 2,406 2,381 2,396 2,394 Nov 2,329 2,320 2,340 2,266 2,291 2,315 2,332 2,338 Dec 2,303 2,298 2,305 2,306 2,278 2,283 2,254 2,280 Annual 2,335 2,316 2,346 2,302 2,352 2,340 2,336 2,335 % Change 0.8% -0.8% 1.3% -1.9% 2.2% -0.5% -0.2% 0%
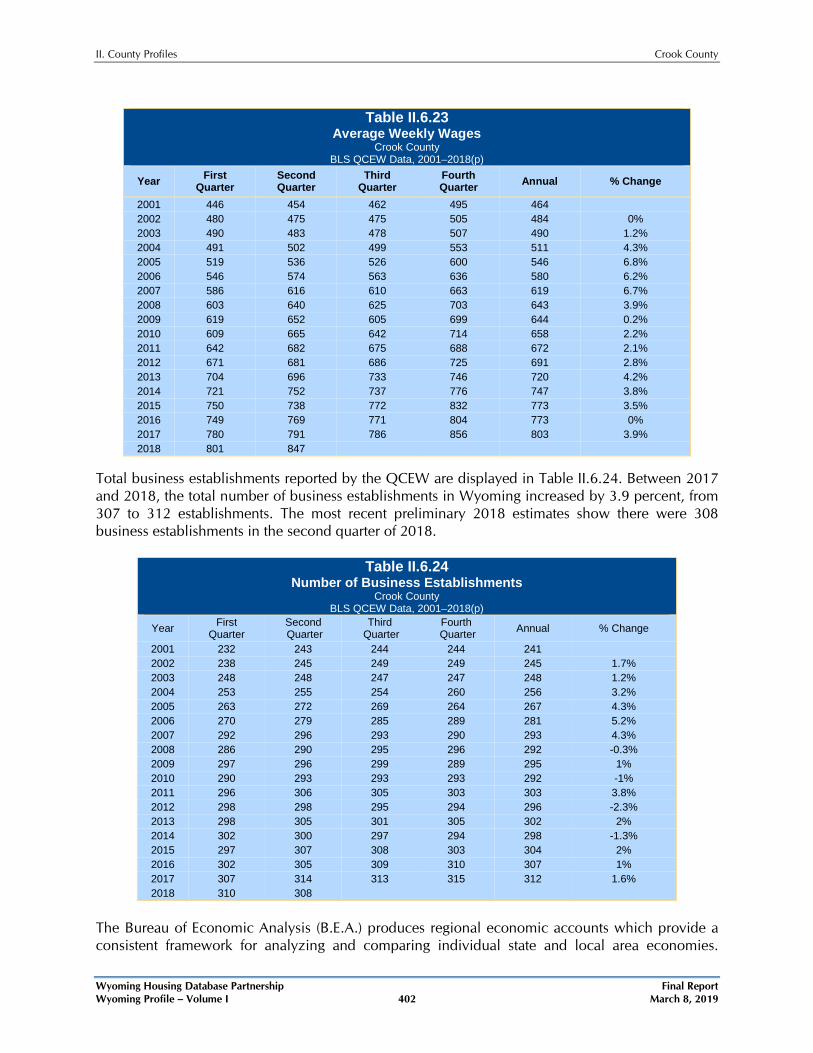
The QCEW also reports average weekly wages, which represents total compensation paid during the calendar quarter, regardless of when services were performed. The BLS QCEW data indicated average weekly wages were 773 dollars in 2016. In 2017, average weekly wages saw a increased of 3.9 percent over the prior year, rising to 803 dollars, or by 30 percent. These data are shown in Table II.6.23.
II. County Profiles Crook County
Wyoming Housing Database Partnership Final Report Wyoming Profile – Volume I 402 March 8, 2019
Table II.6.23 Average Weekly Wages
Crook County BLS QCEW Data, 2001–2018(p)
Year First Quarter
Second Quarter
Third Quarter
Fourth Quarter Annual % Change
2001 446 454 462 495 464 2002 480 475 475 505 484 0% 2003 490 483 478 507 490 1.2% 2004 491 502 499 553 511 4.3% 2005 519 536 526 600 546 6.8% 2006 546 574 563 636 580 6.2% 2007 586 616 610 663 619 6.7% 2008 603 640 625 703 643 3.9% 2009 619 652 605 699 644 0.2% 2010 609 665 642 714 658 2.2% 2011 642 682 675 688 672 2.1% 2012 671 681 686 725 691 2.8% 2013 704 696 733 746 720 4.2% 2014 721 752 737 776 747 3.8% 2015 750 738 772 832 773 3.5% 2016 749 769 771 804 773 0% 2017 780 791 786 856 803 3.9% 2018 801 847
Total business establishments reported by the QCEW are displayed in Table II.6.24. Between 2017 and 2018, the total number of business establishments in Wyoming increased by 3.9 percent, from 307 to 312 establishments. The most recent preliminary 2018 estimates show there were 308 business establishments in the second quarter of 2018.
Table II.6.24 Number of Business Establishments
Crook County BLS QCEW Data, 2001–2018(p)
Year First Quarter
Second Quarter
Third Quarter
Fourth Quarter Annual % Change
2001 232 243 244 244 241 2002 238 245 249 249 245 1.7% 2003 248 248 247 247 248 1.2% 2004 253 255 254 260 256 3.2% 2005 263 272 269 264 267 4.3% 2006 270 279 285 289 281 5.2% 2007 292 296 293 290 293 4.3% 2008 286 290 295 296 292 -0.3% 2009 297 296 299 289 295 1% 2010 290 293 293 293 292 -1% 2011 296 306 305 303 303 3.8% 2012 298 298 295 294 296 -2.3% 2013 298 305 301 305 302 2% 2014 302 300 297 294 298 -1.3% 2015 297 307 308 303 304 2% 2016 302 305 309 310 307 1% 2017 307 314 313 315 312 1.6% 2018 310 308
The Bureau of Economic Analysis (B.E.A.) produces regional economic accounts which provide a consistent framework for analyzing and comparing individual state and local area economies.
II. County Profiles Crook County
Wyoming Housing Database Partnership Final Report Wyoming Profile – Volume I 403 March 8, 2019
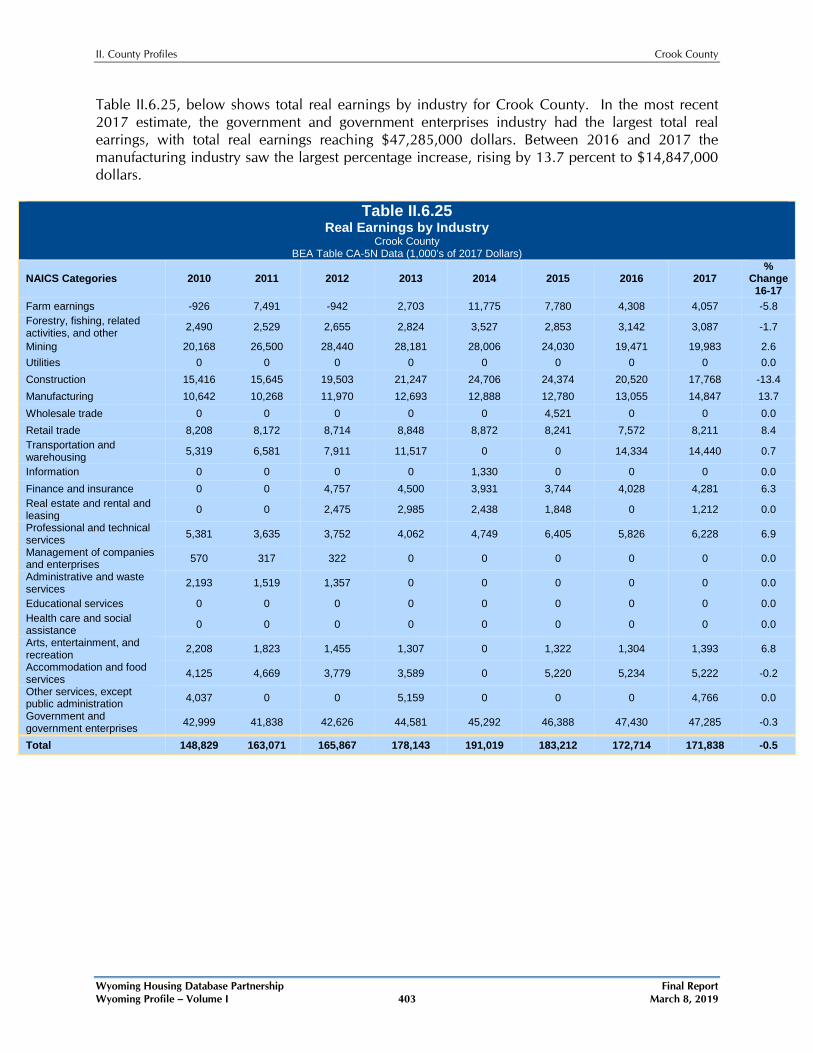
Table II.6.25, below shows total real earnings by industry for Crook County. In the most recent 2017 estimate, the government and government enterprises industry had the largest total real earrings, with total real earnings reaching $47,285,000 dollars. Between 2016 and 2017 the manufacturing industry saw the largest percentage increase, rising by 13.7 percent to $14,847,000 dollars.
Table II.6.25 Real Earnings by Industry
Crook County BEA Table CA-5N Data (1,000’s of 2017 Dollars)
NAICS Categories 2010 2011 2012 2013 2014 2015 2016 2017 %
Change 16-17
Farm earnings -926 7,491 -942 2,703 11,775 7,780 4,308 4,057 -5.8 Forestry, fishing, related activities, and other 2,490 2,529 2,655 2,824 3,527 2,853 3,142 3,087 -1.7
Mining 20,168 26,500 28,440 28,181 28,006 24,030 19,471 19,983 2.6 Utilities 0 0 0 0 0 0 0 0 0.0 Construction 15,416 15,645 19,503 21,247 24,706 24,374 20,520 17,768 -13.4 Manufacturing 10,642 10,268 11,970 12,693 12,888 12,780 13,055 14,847 13.7 Wholesale trade 0 0 0 0 0 4,521 0 0 0.0 Retail trade 8,208 8,172 8,714 8,848 8,872 8,241 7,572 8,211 8.4 Transportation and warehousing 5,319 6,581 7,911 11,517 0 0 14,334 14,440 0.7
Information 0 0 0 0 1,330 0 0 0 0.0 Finance and insurance 0 0 4,757 4,500 3,931 3,744 4,028 4,281 6.3 Real estate and rental and leasing 0 0 2,475 2,985 2,438 1,848 0 1,212 0.0
Professional and technical services 5,381 3,635 3,752 4,062 4,749 6,405 5,826 6,228 6.9
Management of companies and enterprises 570 317 322 0 0 0 0 0 0.0
Administrative and waste services 2,193 1,519 1,357 0 0 0 0 0 0.0
Educational services 0 0 0 0 0 0 0 0 0.0 Health care and social assistance 0 0 0 0 0 0 0 0 0.0
Arts, entertainment, and recreation 2,208 1,823 1,455 1,307 0 1,322 1,304 1,393 6.8
Accommodation and food services 4,125 4,669 3,779 3,589 0 5,220 5,234 5,222 -0.2
Other services, except public administration 4,037 0 0 5,159 0 0 0 4,766 0.0
Government and government enterprises 42,999 41,838 42,626 44,581 45,292 46,388 47,430 47,285 -0.3
Total 148,829 163,071 165,867 178,143 191,019 183,212 172,714 171,838 -0.5
II. County Profiles Crook County
Wyoming Housing Database Partnership Final Report Wyoming Profile – Volume I 404 March 8, 2019
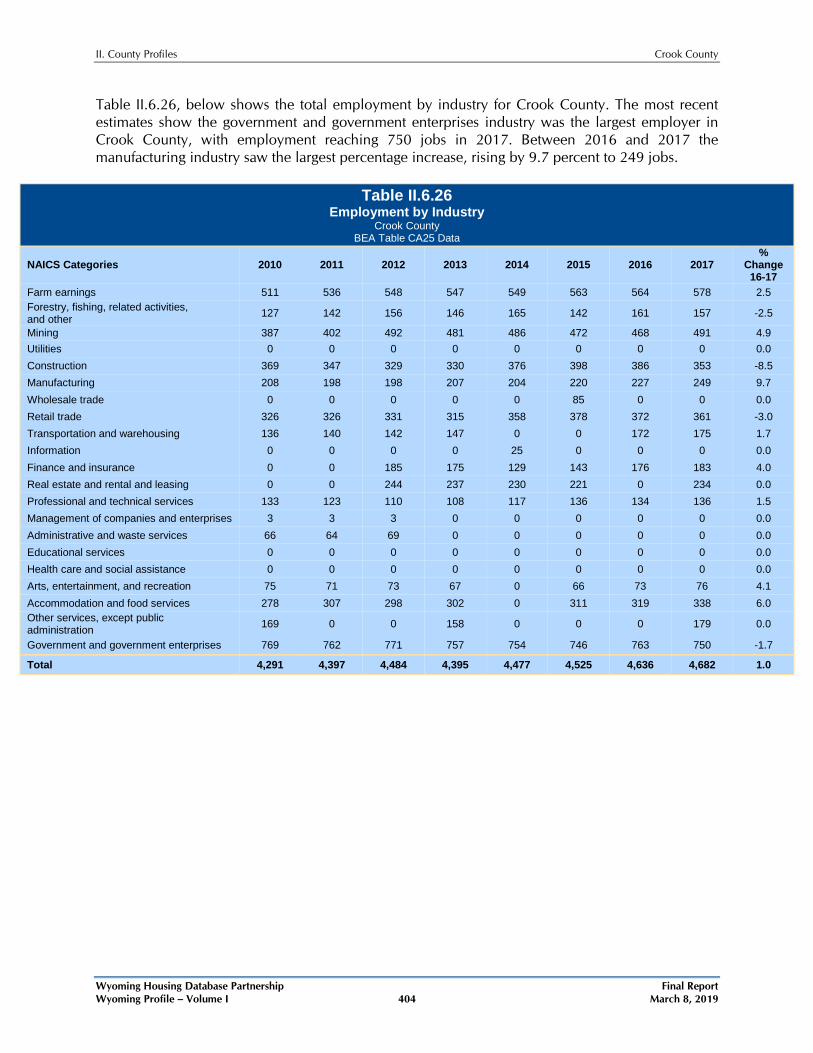
Table II.6.26, below shows the total employment by industry for Crook County. The most recent estimates show the government and government enterprises industry was the largest employer in Crook County, with employment reaching 750 jobs in 2017. Between 2016 and 2017 the manufacturing industry saw the largest percentage increase, rising by 9.7 percent to 249 jobs.
Table II.6.26 Employment by Industry
Crook County BEA Table CA25 Data
NAICS Categories 2010 2011 2012 2013 2014 2015 2016 2017 %
Change 16-17
Farm earnings 511 536 548 547 549 563 564 578 2.5 Forestry, fishing, related activities, and other 127 142 156 146 165 142 161 157 -2.5
Mining 387 402 492 481 486 472 468 491 4.9 Utilities 0 0 0 0 0 0 0 0 0.0 Construction 369 347 329 330 376 398 386 353 -8.5 Manufacturing 208 198 198 207 204 220 227 249 9.7 Wholesale trade 0 0 0 0 0 85 0 0 0.0 Retail trade 326 326 331 315 358 378 372 361 -3.0 Transportation and warehousing 136 140 142 147 0 0 172 175 1.7 Information 0 0 0 0 25 0 0 0 0.0 Finance and insurance 0 0 185 175 129 143 176 183 4.0 Real estate and rental and leasing 0 0 244 237 230 221 0 234 0.0 Professional and technical services 133 123 110 108 117 136 134 136 1.5 Management of companies and enterprises 3 3 3 0 0 0 0 0 0.0 Administrative and waste services 66 64 69 0 0 0 0 0 0.0 Educational services 0 0 0 0 0 0 0 0 0.0 Health care and social assistance 0 0 0 0 0 0 0 0 0.0 Arts, entertainment, and recreation 75 71 73 67 0 66 73 76 4.1 Accommodation and food services 278 307 298 302 0 311 319 338 6.0 Other services, except public administration 169 0 0 158 0 0 0 179 0.0
Government and government enterprises 769 762 771 757 754 746 763 750 -1.7
Total 4,291 4,397 4,484 4,395 4,477 4,525 4,636 4,682 1.0
II. County Profiles Crook County
Wyoming Housing Database Partnership Final Report Wyoming Profile – Volume I 405 March 8, 2019
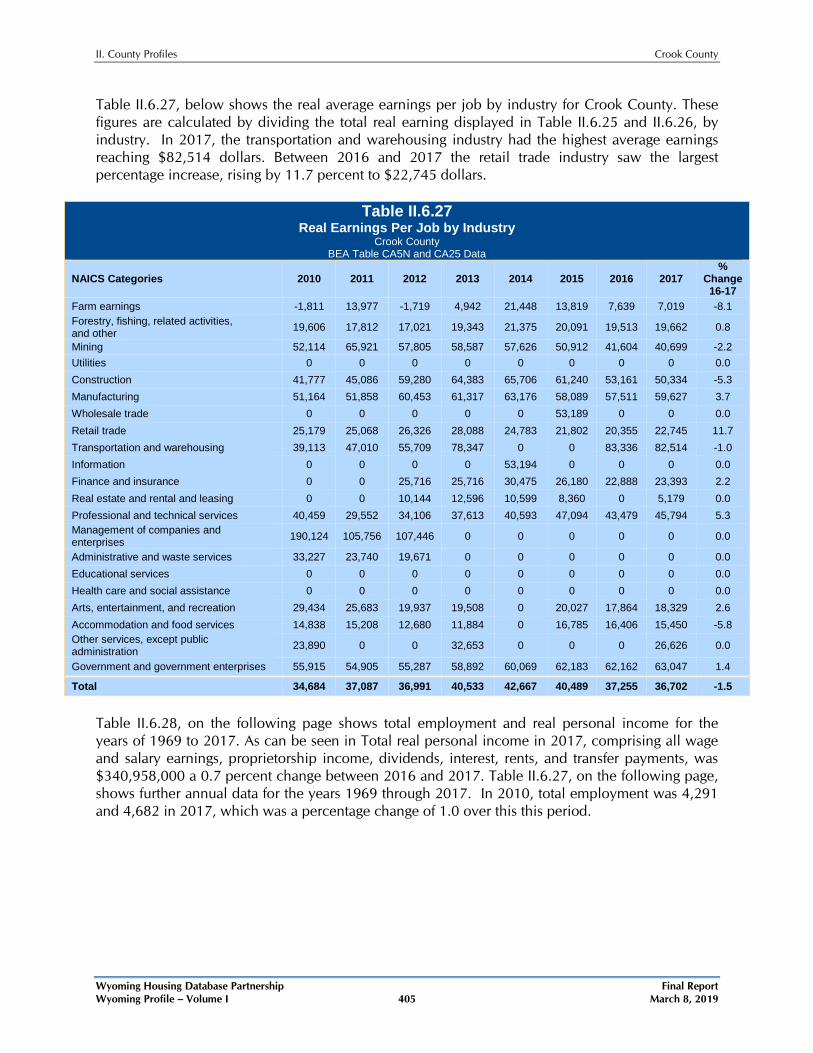
Table II.6.27, below shows the real average earnings per job by industry for Crook County. These figures are calculated by dividing the total real earning displayed in Table II.6.25 and II.6.26, by industry. In 2017, the transportation and warehousing industry had the highest average earnings reaching $82,514 dollars. Between 2016 and 2017 the retail trade industry saw the largest percentage increase, rising by 11.7 percent to $22,745 dollars.
Table II.6.27 Real Earnings Per Job by Industry
Crook County BEA Table CA5N and CA25 Data
NAICS Categories 2010 2011 2012 2013 2014 2015 2016 2017 %
Change 16-17
Farm earnings -1,811 13,977 -1,719 4,942 21,448 13,819 7,639 7,019 -8.1 Forestry, fishing, related activities, and other 19,606 17,812 17,021 19,343 21,375 20,091 19,513 19,662 0.8
Mining 52,114 65,921 57,805 58,587 57,626 50,912 41,604 40,699 -2.2 Utilities 0 0 0 0 0 0 0 0 0.0 Construction 41,777 45,086 59,280 64,383 65,706 61,240 53,161 50,334 -5.3 Manufacturing 51,164 51,858 60,453 61,317 63,176 58,089 57,511 59,627 3.7 Wholesale trade 0 0 0 0 0 53,189 0 0 0.0 Retail trade 25,179 25,068 26,326 28,088 24,783 21,802 20,355 22,745 11.7 Transportation and warehousing 39,113 47,010 55,709 78,347 0 0 83,336 82,514 -1.0 Information 0 0 0 0 53,194 0 0 0 0.0 Finance and insurance 0 0 25,716 25,716 30,475 26,180 22,888 23,393 2.2 Real estate and rental and leasing 0 0 10,144 12,596 10,599 8,360 0 5,179 0.0 Professional and technical services 40,459 29,552 34,106 37,613 40,593 47,094 43,479 45,794 5.3 Management of companies and enterprises 190,124 105,756 107,446 0 0 0 0 0 0.0
Administrative and waste services 33,227 23,740 19,671 0 0 0 0 0 0.0 Educational services 0 0 0 0 0 0 0 0 0.0 Health care and social assistance 0 0 0 0 0 0 0 0 0.0 Arts, entertainment, and recreation 29,434 25,683 19,937 19,508 0 20,027 17,864 18,329 2.6 Accommodation and food services 14,838 15,208 12,680 11,884 0 16,785 16,406 15,450 -5.8 Other services, except public administration 23,890 0 0 32,653 0 0 0 26,626 0.0
Government and government enterprises 55,915 54,905 55,287 58,892 60,069 62,183 62,162 63,047 1.4
Total 34,684 37,087 36,991 40,533 42,667 40,489 37,255 36,702 -1.5
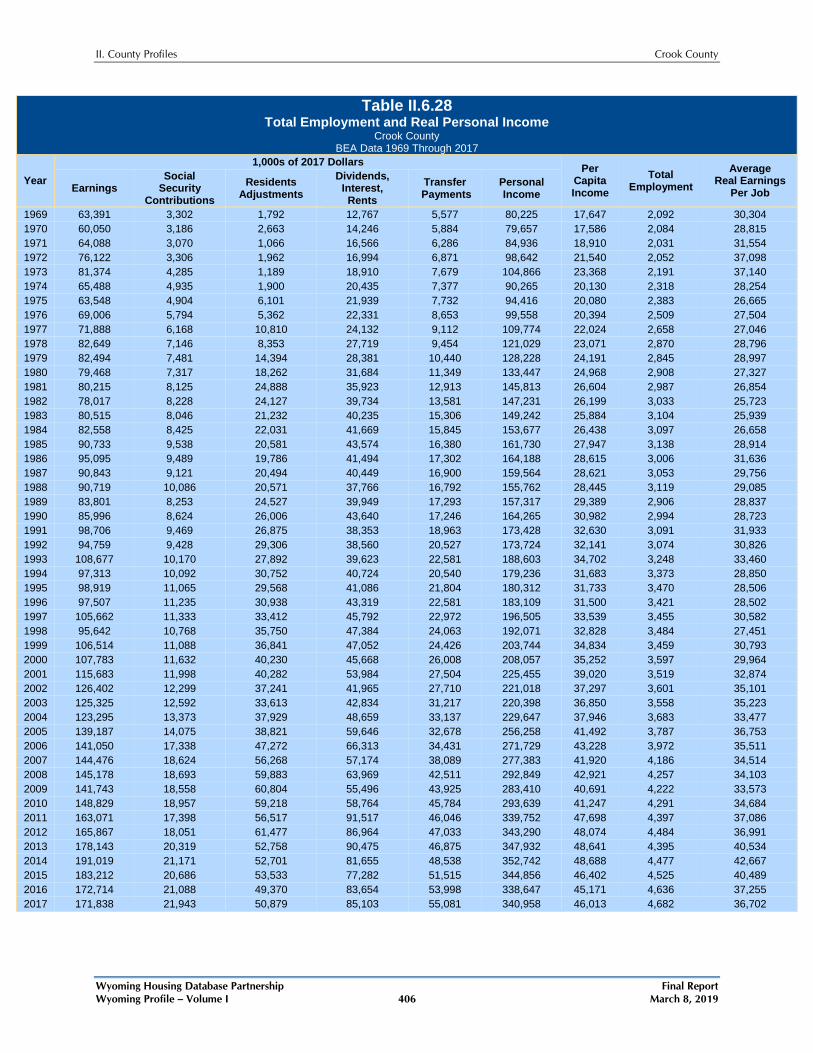
Table II.6.28, on the following page shows total employment and real personal income for the years of 1969 to 2017. As can be seen in Total real personal income in 2017, comprising all wage and salary earnings, proprietorship income, dividends, interest, rents, and transfer payments, was $340,958,000 a 0.7 percent change between 2016 and 2017. Table II.6.27, on the following page, shows further annual data for the years 1969 through 2017. In 2010, total employment was 4,291 and 4,682 in 2017, which was a percentage change of 1.0 over this this period.
II. County Profiles Crook County
Wyoming Housing Database Partnership Final Report Wyoming Profile – Volume I 406 March 8, 2019
Table II.6.28 Total Employment and Real Personal Income
Crook County BEA Data 1969 Through 2017
Year
1,000s of 2017 Dollars Per Capita Income
Total Employment
Average Real Earnings
Per Job Earnings Social
Security Contributions
Residents Adjustments
Dividends, Interest, Rents
Transfer Payments
Personal Income
1969 63,391 3,302 1,792 12,767 5,577 80,225 17,647 2,092 30,304 1970 60,050 3,186 2,663 14,246 5,884 79,657 17,586 2,084 28,815 1971 64,088 3,070 1,066 16,566 6,286 84,936 18,910 2,031 31,554 1972 76,122 3,306 1,962 16,994 6,871 98,642 21,540 2,052 37,098 1973 81,374 4,285 1,189 18,910 7,679 104,866 23,368 2,191 37,140 1974 65,488 4,935 1,900 20,435 7,377 90,265 20,130 2,318 28,254 1975 63,548 4,904 6,101 21,939 7,732 94,416 20,080 2,383 26,665 1976 69,006 5,794 5,362 22,331 8,653 99,558 20,394 2,509 27,504 1977 71,888 6,168 10,810 24,132 9,112 109,774 22,024 2,658 27,046 1978 82,649 7,146 8,353 27,719 9,454 121,029 23,071 2,870 28,796 1979 82,494 7,481 14,394 28,381 10,440 128,228 24,191 2,845 28,997 1980 79,468 7,317 18,262 31,684 11,349 133,447 24,968 2,908 27,327 1981 80,215 8,125 24,888 35,923 12,913 145,813 26,604 2,987 26,854 1982 78,017 8,228 24,127 39,734 13,581 147,231 26,199 3,033 25,723 1983 80,515 8,046 21,232 40,235 15,306 149,242 25,884 3,104 25,939 1984 82,558 8,425 22,031 41,669 15,845 153,677 26,438 3,097 26,658 1985 90,733 9,538 20,581 43,574 16,380 161,730 27,947 3,138 28,914 1986 95,095 9,489 19,786 41,494 17,302 164,188 28,615 3,006 31,636 1987 90,843 9,121 20,494 40,449 16,900 159,564 28,621 3,053 29,756 1988 90,719 10,086 20,571 37,766 16,792 155,762 28,445 3,119 29,085 1989 83,801 8,253 24,527 39,949 17,293 157,317 29,389 2,906 28,837 1990 85,996 8,624 26,006 43,640 17,246 164,265 30,982 2,994 28,723 1991 98,706 9,469 26,875 38,353 18,963 173,428 32,630 3,091 31,933 1992 94,759 9,428 29,306 38,560 20,527 173,724 32,141 3,074 30,826 1993 108,677 10,170 27,892 39,623 22,581 188,603 34,702 3,248 33,460 1994 97,313 10,092 30,752 40,724 20,540 179,236 31,683 3,373 28,850 1995 98,919 11,065 29,568 41,086 21,804 180,312 31,733 3,470 28,506 1996 97,507 11,235 30,938 43,319 22,581 183,109 31,500 3,421 28,502 1997 105,662 11,333 33,412 45,792 22,972 196,505 33,539 3,455 30,582 1998 95,642 10,768 35,750 47,384 24,063 192,071 32,828 3,484 27,451 1999 106,514 11,088 36,841 47,052 24,426 203,744 34,834 3,459 30,793 2000 107,783 11,632 40,230 45,668 26,008 208,057 35,252 3,597 29,964 2001 115,683 11,998 40,282 53,984 27,504 225,455 39,020 3,519 32,874 2002 126,402 12,299 37,241 41,965 27,710 221,018 37,297 3,601 35,101 2003 125,325 12,592 33,613 42,834 31,217 220,398 36,850 3,558 35,223 2004 123,295 13,373 37,929 48,659 33,137 229,647 37,946 3,683 33,477 2005 139,187 14,075 38,821 59,646 32,678 256,258 41,492 3,787 36,753 2006 141,050 17,338 47,272 66,313 34,431 271,729 43,228 3,972 35,511 2007 144,476 18,624 56,268 57,174 38,089 277,383 41,920 4,186 34,514 2008 145,178 18,693 59,883 63,969 42,511 292,849 42,921 4,257 34,103 2009 141,743 18,558 60,804 55,496 43,925 283,410 40,691 4,222 33,573 2010 148,829 18,957 59,218 58,764 45,784 293,639 41,247 4,291 34,684 2011 163,071 17,398 56,517 91,517 46,046 339,752 47,698 4,397 37,086 2012 165,867 18,051 61,477 86,964 47,033 343,290 48,074 4,484 36,991 2013 178,143 20,319 52,758 90,475 46,875 347,932 48,641 4,395 40,534 2014 191,019 21,171 52,701 81,655 48,538 352,742 48,688 4,477 42,667 2015 183,212 20,686 53,533 77,282 51,515 344,856 46,402 4,525 40,489 2016 172,714 21,088 49,370 83,654 53,998 338,647 45,171 4,636 37,255 2017 171,838 21,943 50,879 85,103 55,081 340,958 46,013 4,682 36,702
II. County Profiles Crook County
Wyoming Housing Database Partnership Final Report Wyoming Profile – Volume I 407 March 8, 2019
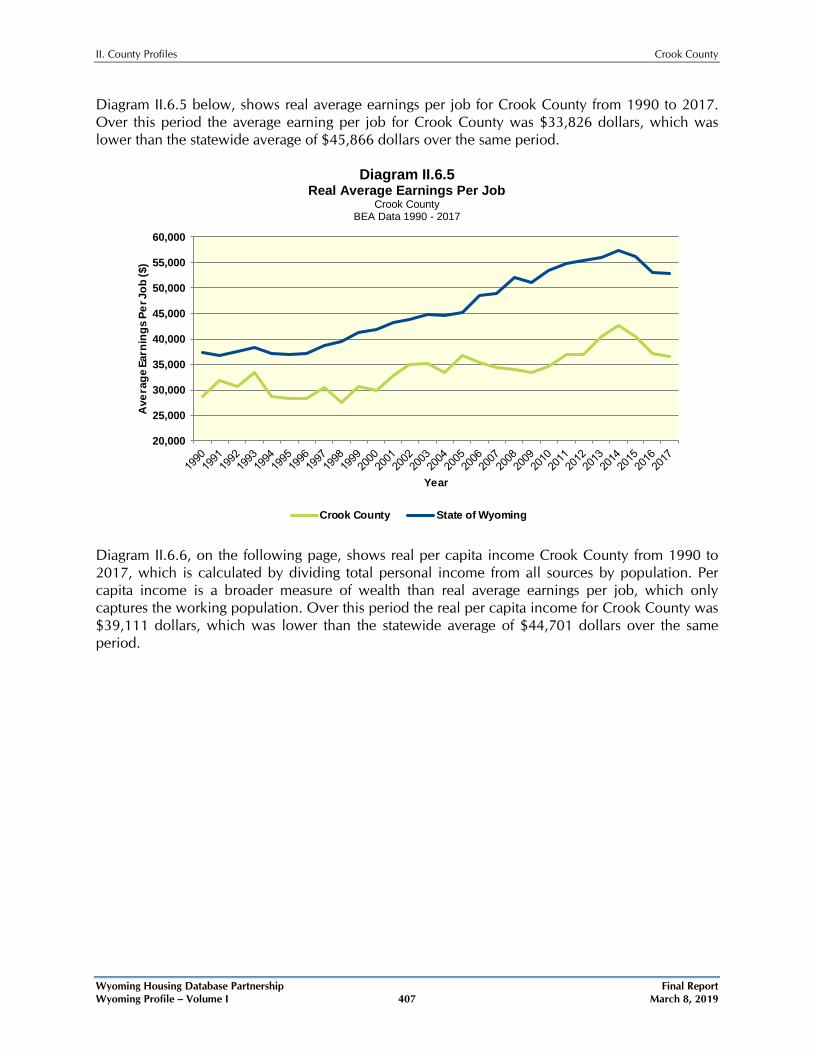
Diagram II.6.5 below, shows real average earnings per job for Crook County from 1990 to 2017. Over this period the average earning per job for Crook County was $33,826 dollars, which was lower than the statewide average of $45,866 dollars over the same period.
Diagram II.6.5 Real Average Earnings Per Job
Crook County BEA Data 1990 - 2017
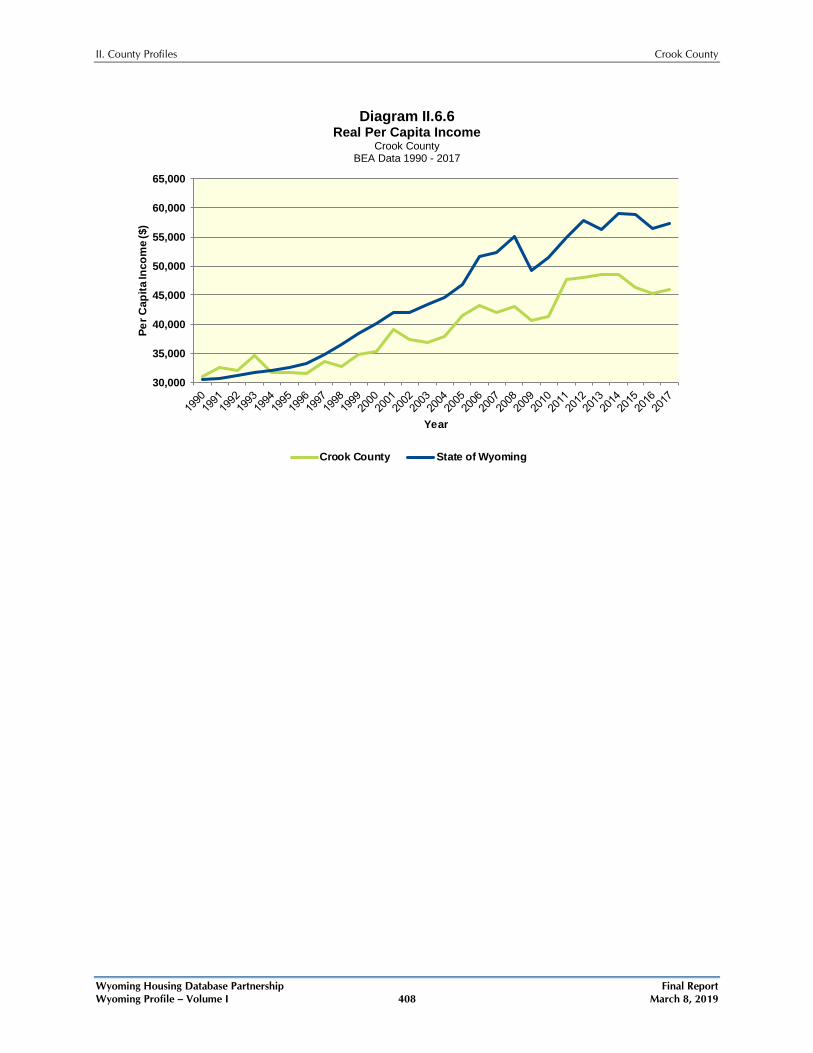
Diagram II.6.6, on the following page, shows real per capita income Crook County from 1990 to 2017, which is calculated by dividing total personal income from all sources by population. Per capita income is a broader measure of wealth than real average earnings per job, which only captures the working population. Over this period the real per capita income for Crook County was $39,111 dollars, which was lower than the statewide average of $44,701 dollars over the same period.
20,000
25,000
30,000
35,000
40,000
45,000
50,000
55,000
60,000
Ave
rage
Ear
ning
s Pe
r Job
($)
Year
Crook County State of Wyoming
II. County Profiles Crook County
Wyoming Housing Database Partnership Final Report Wyoming Profile – Volume I 408 March 8, 2019
Diagram II.6.6
Real Per Capita Income Crook County
BEA Data 1990 - 2017
30,000
35,000
40,000
45,000
50,000
55,000
60,000
65,000
Per C
apita
Inco
me
($)
Year
Crook County State of Wyoming
II. County Profiles Crook County
Wyoming Housing Database Partnership Final Report Wyoming Profile – Volume I 409 March 8, 2019
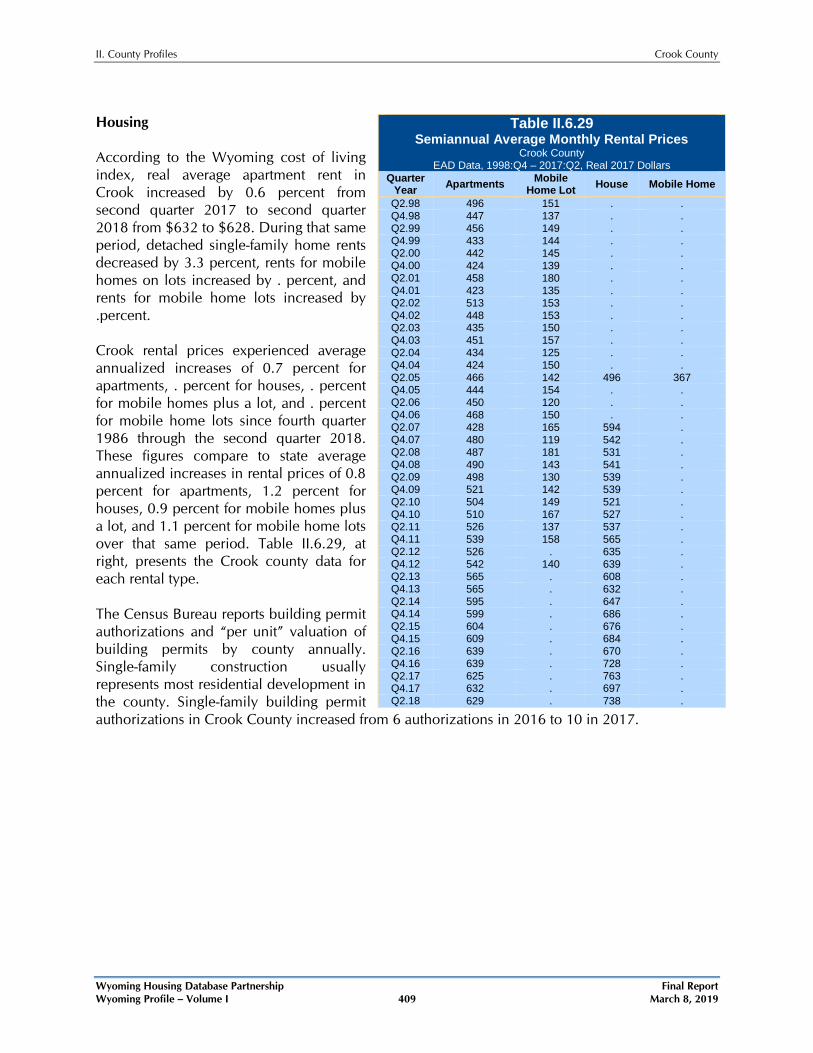
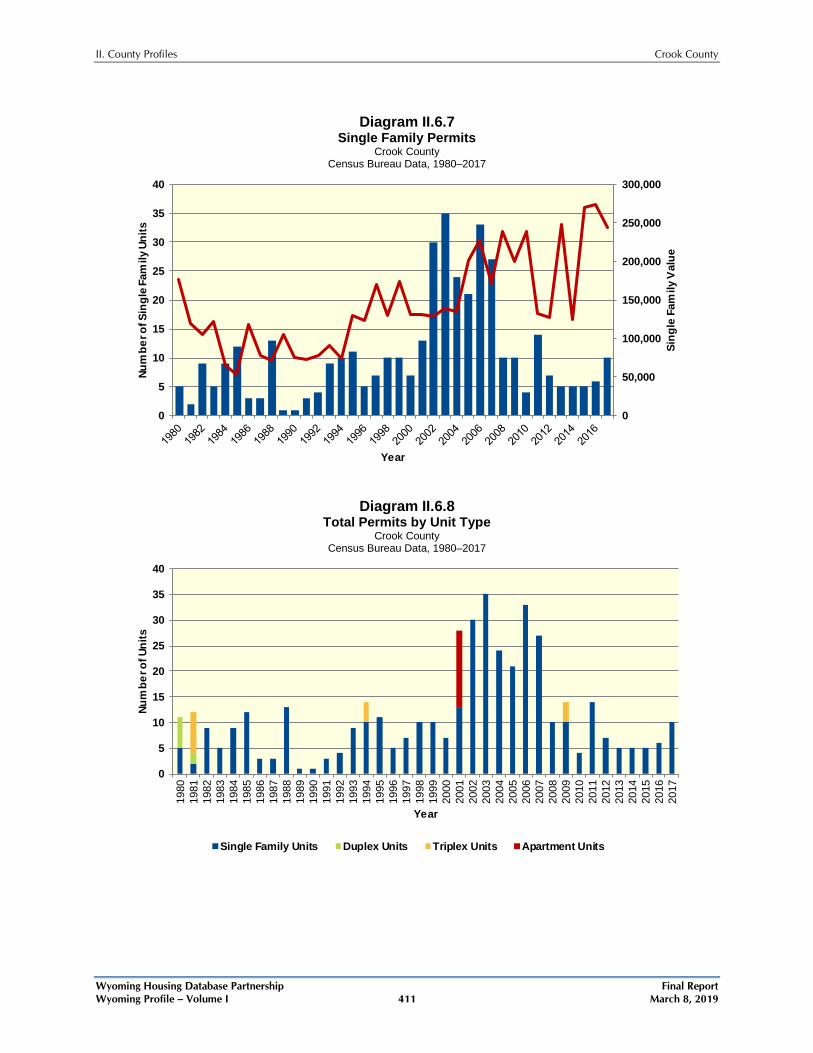
Housing According to the Wyoming cost of living index, real average apartment rent in Crook increased by 0.6 percent from second quarter 2017 to second quarter 2018 from $632 to $628. During that same period, detached single-family home rents decreased by 3.3 percent, rents for mobile homes on lots increased by . percent, and rents for mobile home lots increased by .percent. Crook rental prices experienced average annualized increases of 0.7 percent for apartments, . percent for houses, . percent for mobile homes plus a lot, and . percent for mobile home lots since fourth quarter 1986 through the second quarter 2018. These figures compare to state average annualized increases in rental prices of 0.8 percent for apartments, 1.2 percent for houses, 0.9 percent for mobile homes plus a lot, and 1.1 percent for mobile home lots over that same period. Table II.6.29, at right, presents the Crook county data for each rental type. The Census Bureau reports building permit authorizations and “per unit” valuation of building permits by county annually. Single-family construction usually represents most residential development in the county. Single-family building permit authorizations in Crook County increased from 6 authorizations in 2016 to 10 in 2017.
Table II.6.29 Semiannual Average Monthly Rental Prices
Crook County EAD Data, 1998:Q4 – 2017:Q2, Real 2017 Dollars
Quarter Year Apartments Mobile
Home Lot House Mobile Home
Q2.98 496 151 . . Q4.98 447 137 . . Q2.99 456 149 . . Q4.99 433 144 . . Q2.00 442 145 . . Q4.00 424 139 . . Q2.01 458 180 . . Q4.01 423 135 . . Q2.02 513 153 . . Q4.02 448 153 . . Q2.03 435 150 . . Q4.03 451 157 . . Q2.04 434 125 . . Q4.04 424 150 . . Q2.05 466 142 496 367 Q4.05 444 154 . . Q2.06 450 120 . . Q4.06 468 150 . . Q2.07 428 165 594 . Q4.07 480 119 542 . Q2.08 487 181 531 . Q4.08 490 143 541 . Q2.09 498 130 539 . Q4.09 521 142 539 . Q2.10 504 149 521 . Q4.10 510 167 527 . Q2.11 526 137 537 . Q4.11 539 158 565 . Q2.12 526 . 635 . Q4.12 542 140 639 . Q2.13 565 . 608 . Q4.13 565 . 632 . Q2.14 595 . 647 . Q4.14 599 . 686 . Q2.15 604 . 676 . Q4.15 609 . 684 . Q2.16 639 . 670 . Q4.16 639 . 728 . Q2.17 625 . 763 . Q4.17 632 . 697 . Q2.18 629 . 738 .
II. County Profiles Crook County
Wyoming Housing Database Partnership Final Report Wyoming Profile – Volume I 410 March 8, 2019
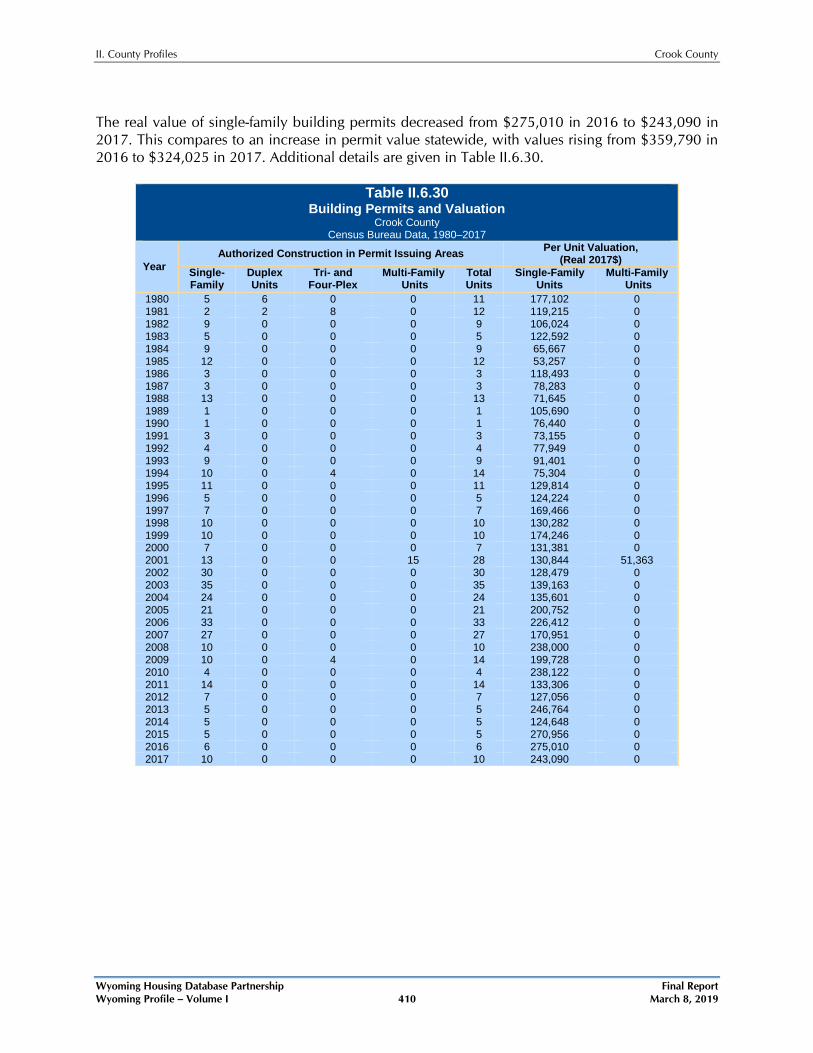
The real value of single-family building permits decreased from $275,010 in 2016 to $243,090 in 2017. This compares to an increase in permit value statewide, with values rising from $359,790 in 2016 to $324,025 in 2017. Additional details are given in Table II.6.30.
Table II.6.30
Building Permits and Valuation Crook County
Census Bureau Data, 1980–2017
Year Authorized Construction in Permit Issuing Areas Per Unit Valuation,
(Real 2017$) Single- Family
Duplex Units
Tri- and Four-Plex
Multi-Family Units
Total Units
Single-Family Units
Multi-Family Units
1980 5 6 0 0 11 177,102 0 1981 2 2 8 0 12 119,215 0 1982 9 0 0 0 9 106,024 0 1983 5 0 0 0 5 122,592 0 1984 9 0 0 0 9 65,667 0 1985 12 0 0 0 12 53,257 0 1986 3 0 0 0 3 118,493 0 1987 3 0 0 0 3 78,283 0 1988 13 0 0 0 13 71,645 0 1989 1 0 0 0 1 105,690 0 1990 1 0 0 0 1 76,440 0 1991 3 0 0 0 3 73,155 0 1992 4 0 0 0 4 77,949 0 1993 9 0 0 0 9 91,401 0 1994 10 0 4 0 14 75,304 0 1995 11 0 0 0 11 129,814 0 1996 5 0 0 0 5 124,224 0 1997 7 0 0 0 7 169,466 0 1998 10 0 0 0 10 130,282 0 1999 10 0 0 0 10 174,246 0 2000 7 0 0 0 7 131,381 0 2001 13 0 0 15 28 130,844 51,363 2002 30 0 0 0 30 128,479 0 2003 35 0 0 0 35 139,163 0 2004 24 0 0 0 24 135,601 0 2005 21 0 0 0 21 200,752 0 2006 33 0 0 0 33 226,412 0 2007 27 0 0 0 27 170,951 0 2008 10 0 0 0 10 238,000 0 2009 10 0 4 0 14 199,728 0 2010 4 0 0 0 4 238,122 0 2011 14 0 0 0 14 133,306 0 2012 7 0 0 0 7 127,056 0 2013 5 0 0 0 5 246,764 0 2014 5 0 0 0 5 124,648 0 2015 5 0 0 0 5 270,956 0 2016 6 0 0 0 6 275,010 0 2017 10 0 0 0 10 243,090 0
II. County Profiles Crook County
Wyoming Housing Database Partnership Final Report Wyoming Profile – Volume I 411 March 8, 2019
Diagram II.6.7
Single Family Permits Crook County
Census Bureau Data, 1980–2017
Diagram II.6.8 Total Permits by Unit Type
Crook County Census Bureau Data, 1980–2017
0
50,000
100,000
150,000
200,000
250,000
300,000
0
5
10
15
20
25
30
35
40
Sing
le F
amily
Val
ue
Num
ber o
f Sin
gle
Fam
ily U
nits
Year
0
5
10
15
20
25
30
35
40
1980
1981
1982
1983
1984
1985
1986
1987
1988
1989
1990
1991
1992
1993
1994
1995
1996
1997
1998
1999
2000
2001
2002
2003
2004
2005
2006
2007
2008
2009
2010
2011
2012
2013
2014
2015
2016
2017
Num
ber o
f Uni
ts
Year
Single Family Units Duplex Units Triplex Units Apartment Units
II. County Profiles Crook County
Wyoming Housing Database Partnership Final Report Wyoming Profile – Volume I 412 March 8, 2019
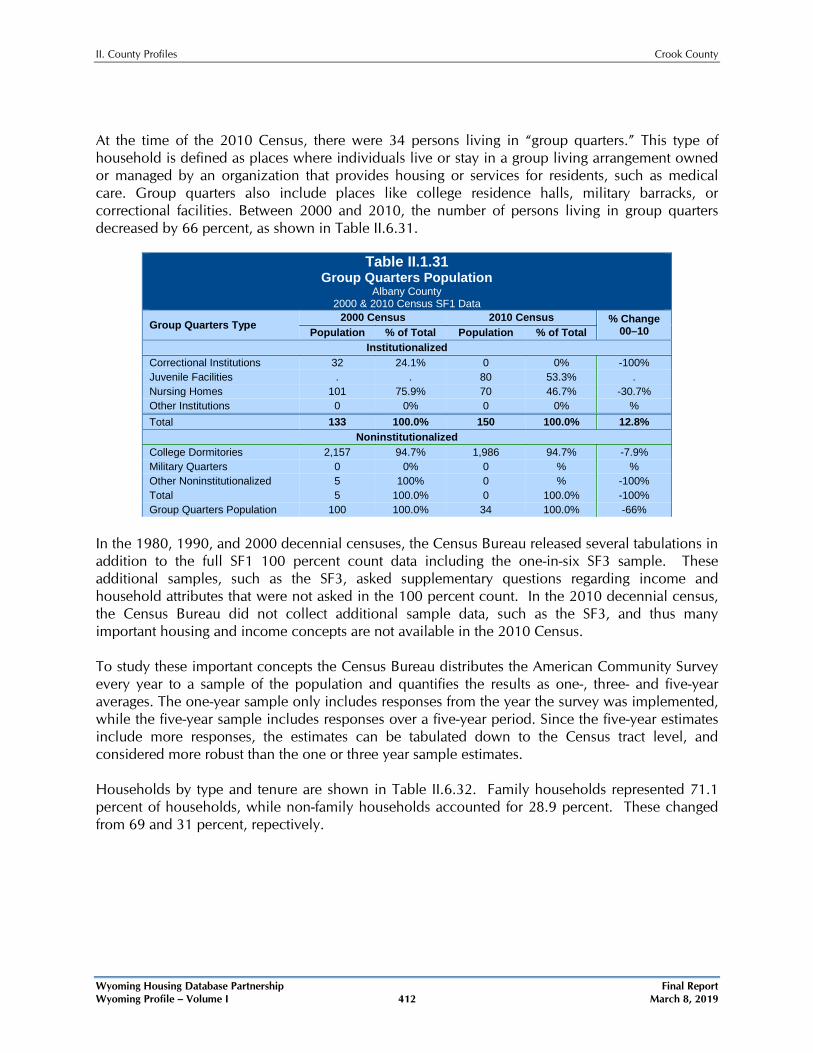
At the time of the 2010 Census, there were 34 persons living in “group quarters.” This type of household is defined as places where individuals live or stay in a group living arrangement owned or managed by an organization that provides housing or services for residents, such as medical care. Group quarters also include places like college residence halls, military barracks, or correctional facilities. Between 2000 and 2010, the number of persons living in group quarters decreased by 66 percent, as shown in Table II.6.31.
Table II.1.31 Group Quarters Population
Albany County 2000 & 2010 Census SF1 Data
Group Quarters Type 2000 Census 2010 Census % Change
00–10 Population % of Total Population % of Total Institutionalized
Correctional Institutions 32 24.1% 0 0% -100% Juvenile Facilities . . 80 53.3% . Nursing Homes 101 75.9% 70 46.7% -30.7% Other Institutions 0 0% 0 0% % Total 133 100.0% 150 100.0% 12.8%
Noninstitutionalized College Dormitories 2,157 94.7% 1,986 94.7% -7.9% Military Quarters 0 0% 0 % % Other Noninstitutionalized 5 100% 0 % -100% Total 5 100.0% 0 100.0% -100% Group Quarters Population 100 100.0% 34 100.0% -66%
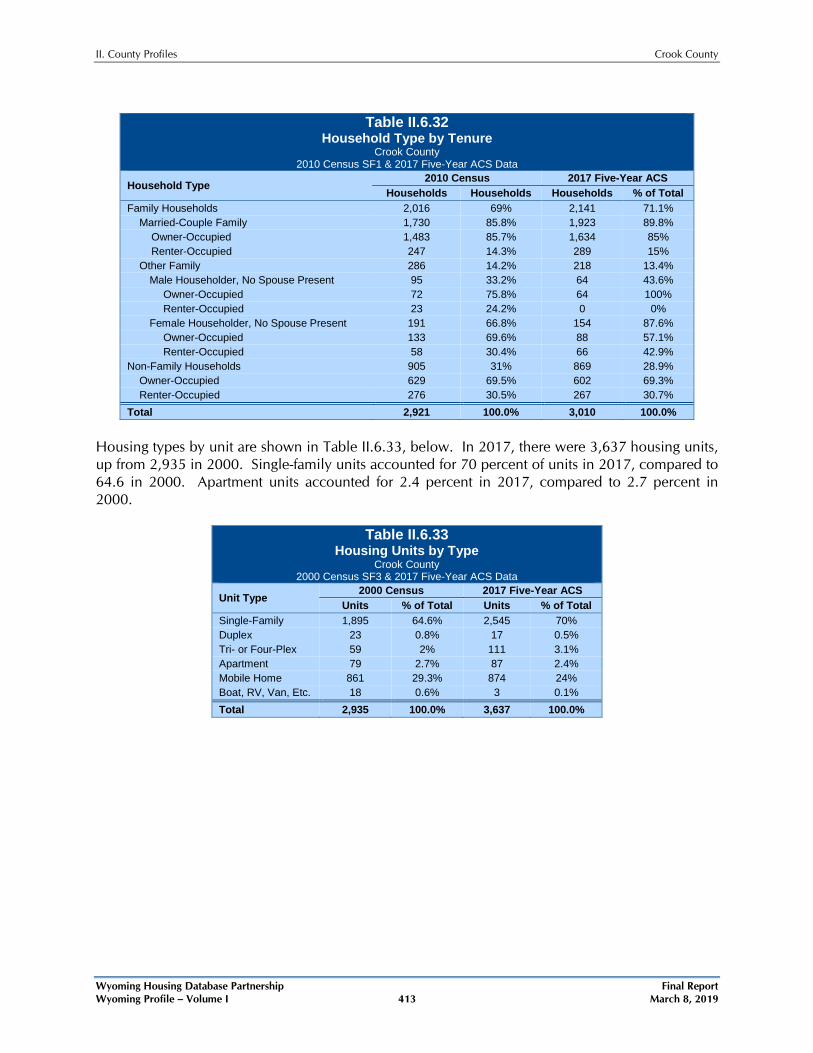
In the 1980, 1990, and 2000 decennial censuses, the Census Bureau released several tabulations in addition to the full SF1 100 percent count data including the one-in-six SF3 sample. These additional samples, such as the SF3, asked supplementary questions regarding income and household attributes that were not asked in the 100 percent count. In the 2010 decennial census, the Census Bureau did not collect additional sample data, such as the SF3, and thus many important housing and income concepts are not available in the 2010 Census. To study these important concepts the Census Bureau distributes the American Community Survey every year to a sample of the population and quantifies the results as one-, three- and five-year averages. The one-year sample only includes responses from the year the survey was implemented, while the five-year sample includes responses over a five-year period. Since the five-year estimates include more responses, the estimates can be tabulated down to the Census tract level, and considered more robust than the one or three year sample estimates. Households by type and tenure are shown in Table II.6.32. Family households represented 71.1 percent of households, while non-family households accounted for 28.9 percent. These changed from 69 and 31 percent, repectively.
II. County Profiles Crook County
Wyoming Housing Database Partnership Final Report Wyoming Profile – Volume I 413 March 8, 2019
Table II.6.32
Household Type by Tenure Crook County
2010 Census SF1 & 2017 Five-Year ACS Data
Household Type 2010 Census 2017 Five-Year ACS
Households Households Households % of Total Family Households 2,016 69% 2,141 71.1%
Married-Couple Family 1,730 85.8% 1,923 89.8% Owner-Occupied 1,483 85.7% 1,634 85% Renter-Occupied 247 14.3% 289 15%
Other Family 286 14.2% 218 13.4% Male Householder, No Spouse Present 95 33.2% 64 43.6%
Owner-Occupied 72 75.8% 64 100% Renter-Occupied 23 24.2% 0 0%
Female Householder, No Spouse Present 191 66.8% 154 87.6% Owner-Occupied 133 69.6% 88 57.1% Renter-Occupied 58 30.4% 66 42.9%
Non-Family Households 905 31% 869 28.9% Owner-Occupied 629 69.5% 602 69.3% Renter-Occupied 276 30.5% 267 30.7%
Total 2,921 100.0% 3,010 100.0% Housing types by unit are shown in Table II.6.33, below. In 2017, there were 3,637 housing units, up from 2,935 in 2000. Single-family units accounted for 70 percent of units in 2017, compared to 64.6 in 2000. Apartment units accounted for 2.4 percent in 2017, compared to 2.7 percent in 2000.
Table II.6.33 Housing Units by Type
Crook County 2000 Census SF3 & 2017 Five-Year ACS Data
Unit Type 2000 Census 2017 Five-Year ACS
Units % of Total Units % of Total Single-Family 1,895 64.6% 2,545 70% Duplex 23 0.8% 17 0.5% Tri- or Four-Plex 59 2% 111 3.1% Apartment 79 2.7% 87 2.4% Mobile Home 861 29.3% 874 24% Boat, RV, Van, Etc. 18 0.6% 3 0.1% Total 2,935 100.0% 3,637 100.0%
II. County Profiles Crook County
Wyoming Housing Database Partnership Final Report Wyoming Profile – Volume I 414 March 8, 2019
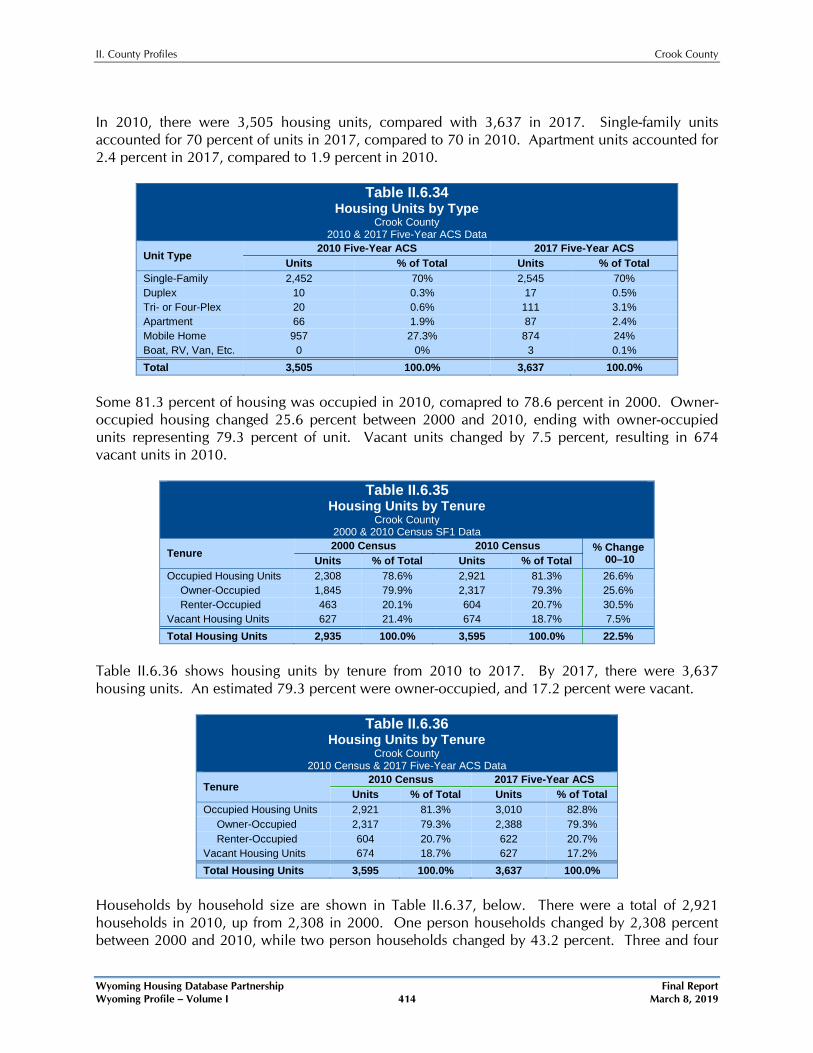
In 2010, there were 3,505 housing units, compared with 3,637 in 2017. Single-family units accounted for 70 percent of units in 2017, compared to 70 in 2010. Apartment units accounted for 2.4 percent in 2017, compared to 1.9 percent in 2010.
Table II.6.34 Housing Units by Type
Crook County 2010 & 2017 Five-Year ACS Data
Unit Type 2010 Five-Year ACS 2017 Five-Year ACS
Units % of Total Units % of Total Single-Family 2,452 70% 2,545 70% Duplex 10 0.3% 17 0.5% Tri- or Four-Plex 20 0.6% 111 3.1% Apartment 66 1.9% 87 2.4% Mobile Home 957 27.3% 874 24% Boat, RV, Van, Etc. 0 0% 3 0.1% Total 3,505 100.0% 3,637 100.0%
Some 81.3 percent of housing was occupied in 2010, comapred to 78.6 percent in 2000. Owner-occupied housing changed 25.6 percent between 2000 and 2010, ending with owner-occupied units representing 79.3 percent of unit. Vacant units changed by 7.5 percent, resulting in 674 vacant units in 2010.
Table II.6.35 Housing Units by Tenure
Crook County 2000 & 2010 Census SF1 Data
Tenure 2000 Census 2010 Census % Change
00–10 Units % of Total Units % of Total Occupied Housing Units 2,308 78.6% 2,921 81.3% 26.6%
Owner-Occupied 1,845 79.9% 2,317 79.3% 25.6% Renter-Occupied 463 20.1% 604 20.7% 30.5%
Vacant Housing Units 627 21.4% 674 18.7% 7.5% Total Housing Units 2,935 100.0% 3,595 100.0% 22.5%
Table II.6.36 shows housing units by tenure from 2010 to 2017. By 2017, there were 3,637 housing units. An estimated 79.3 percent were owner-occupied, and 17.2 percent were vacant.
Table II.6.36 Housing Units by Tenure
Crook County 2010 Census & 2017 Five-Year ACS Data
Tenure 2010 Census 2017 Five-Year ACS
Units % of Total Units % of Total Occupied Housing Units 2,921 81.3% 3,010 82.8%
Owner-Occupied 2,317 79.3% 2,388 79.3% Renter-Occupied 604 20.7% 622 20.7%
Vacant Housing Units 674 18.7% 627 17.2% Total Housing Units 3,595 100.0% 3,637 100.0%
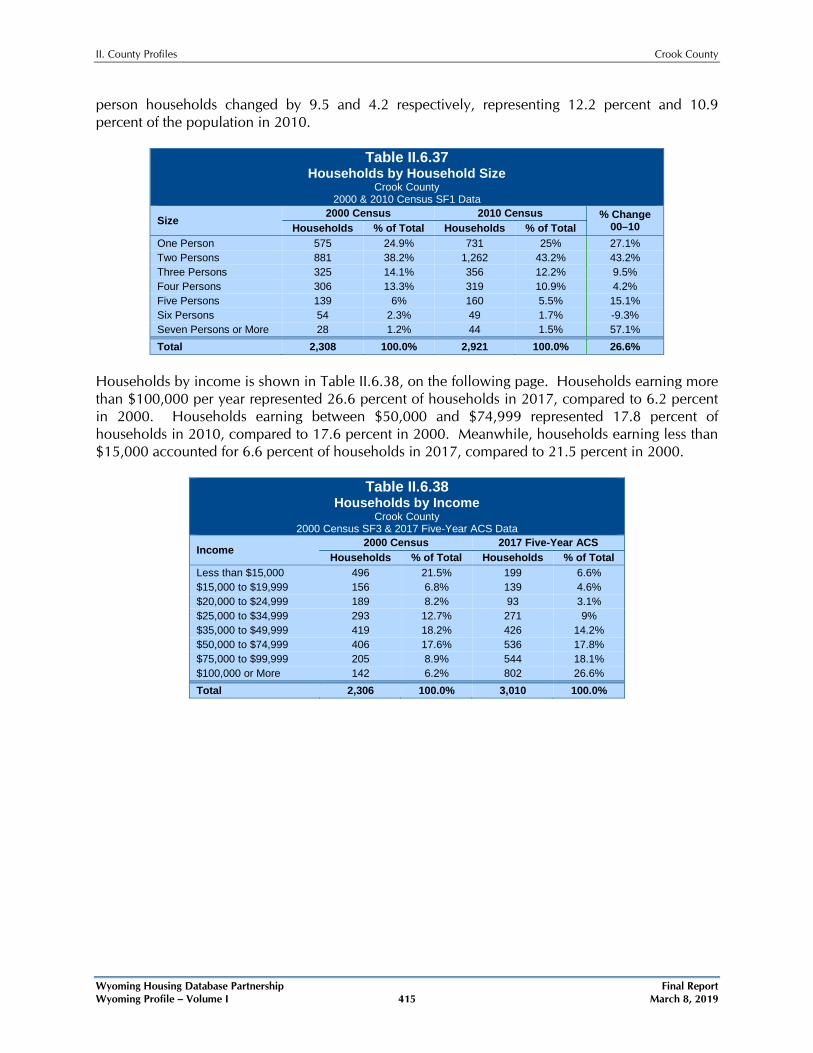
Households by household size are shown in Table II.6.37, below. There were a total of 2,921 households in 2010, up from 2,308 in 2000. One person households changed by 2,308 percent between 2000 and 2010, while two person households changed by 43.2 percent. Three and four
II. County Profiles Crook County
Wyoming Housing Database Partnership Final Report Wyoming Profile – Volume I 415 March 8, 2019
person households changed by 9.5 and 4.2 respectively, representing 12.2 percent and 10.9 percent of the population in 2010.
Table II.6.37 Households by Household Size
Crook County 2000 & 2010 Census SF1 Data
Size 2000 Census 2010 Census % Change
00–10 Households % of Total Households % of Total One Person 575 24.9% 731 25% 27.1% Two Persons 881 38.2% 1,262 43.2% 43.2% Three Persons 325 14.1% 356 12.2% 9.5% Four Persons 306 13.3% 319 10.9% 4.2% Five Persons 139 6% 160 5.5% 15.1% Six Persons 54 2.3% 49 1.7% -9.3% Seven Persons or More 28 1.2% 44 1.5% 57.1% Total 2,308 100.0% 2,921 100.0% 26.6%
Households by income is shown in Table II.6.38, on the following page. Households earning more than $100,000 per year represented 26.6 percent of households in 2017, compared to 6.2 percent in 2000. Households earning between $50,000 and $74,999 represented 17.8 percent of households in 2010, compared to 17.6 percent in 2000. Meanwhile, households earning less than $15,000 accounted for 6.6 percent of households in 2017, compared to 21.5 percent in 2000.
Table II.6.38 Households by Income
Crook County 2000 Census SF3 & 2017 Five-Year ACS Data
Income 2000 Census 2017 Five-Year ACS
Households % of Total Households % of Total Less than $15,000 496 21.5% 199 6.6% $15,000 to $19,999 156 6.8% 139 4.6% $20,000 to $24,999 189 8.2% 93 3.1% $25,000 to $34,999 293 12.7% 271 9% $35,000 to $49,999 419 18.2% 426 14.2% $50,000 to $74,999 406 17.6% 536 17.8% $75,000 to $99,999 205 8.9% 544 18.1% $100,000 or More 142 6.2% 802 26.6% Total 2,306 100.0% 3,010 100.0%
II. County Profiles Crook County
Wyoming Housing Database Partnership Final Report Wyoming Profile – Volume I 416 March 8, 2019
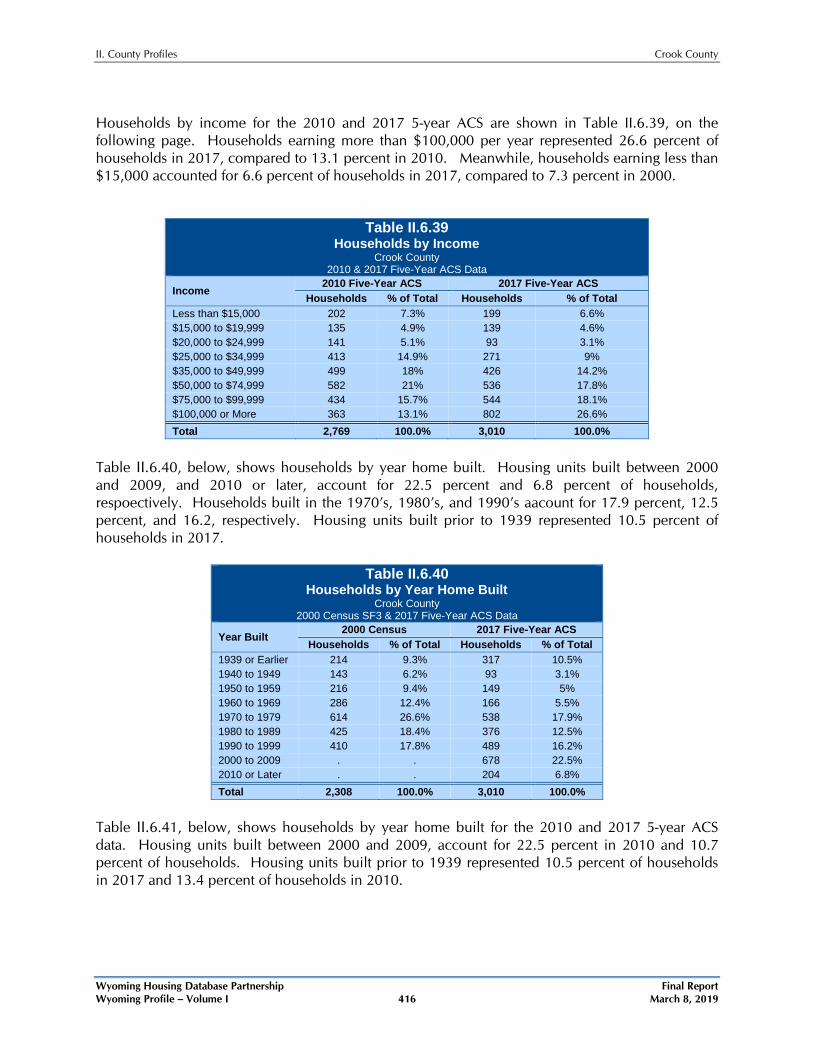
Households by income for the 2010 and 2017 5-year ACS are shown in Table II.6.39, on the following page. Households earning more than $100,000 per year represented 26.6 percent of households in 2017, compared to 13.1 percent in 2010. Meanwhile, households earning less than $15,000 accounted for 6.6 percent of households in 2017, compared to 7.3 percent in 2000.
Table II.6.39 Households by Income
Crook County 2010 & 2017 Five-Year ACS Data
Income 2010 Five-Year ACS 2017 Five-Year ACS
Households % of Total Households % of Total Less than $15,000 202 7.3% 199 6.6% $15,000 to $19,999 135 4.9% 139 4.6% $20,000 to $24,999 141 5.1% 93 3.1% $25,000 to $34,999 413 14.9% 271 9% $35,000 to $49,999 499 18% 426 14.2% $50,000 to $74,999 582 21% 536 17.8% $75,000 to $99,999 434 15.7% 544 18.1% $100,000 or More 363 13.1% 802 26.6% Total 2,769 100.0% 3,010 100.0%
Table II.6.40, below, shows households by year home built. Housing units built between 2000 and 2009, and 2010 or later, account for 22.5 percent and 6.8 percent of households, respoectively. Households built in the 1970’s, 1980’s, and 1990’s aacount for 17.9 percent, 12.5 percent, and 16.2, respectively. Housing units built prior to 1939 represented 10.5 percent of households in 2017.
Table II.6.40 Households by Year Home Built
Crook County 2000 Census SF3 & 2017 Five-Year ACS Data
Year Built 2000 Census 2017 Five-Year ACS
Households % of Total Households % of Total 1939 or Earlier 214 9.3% 317 10.5% 1940 to 1949 143 6.2% 93 3.1% 1950 to 1959 216 9.4% 149 5% 1960 to 1969 286 12.4% 166 5.5% 1970 to 1979 614 26.6% 538 17.9% 1980 to 1989 425 18.4% 376 12.5% 1990 to 1999 410 17.8% 489 16.2% 2000 to 2009 . . 678 22.5% 2010 or Later . . 204 6.8% Total 2,308 100.0% 3,010 100.0%
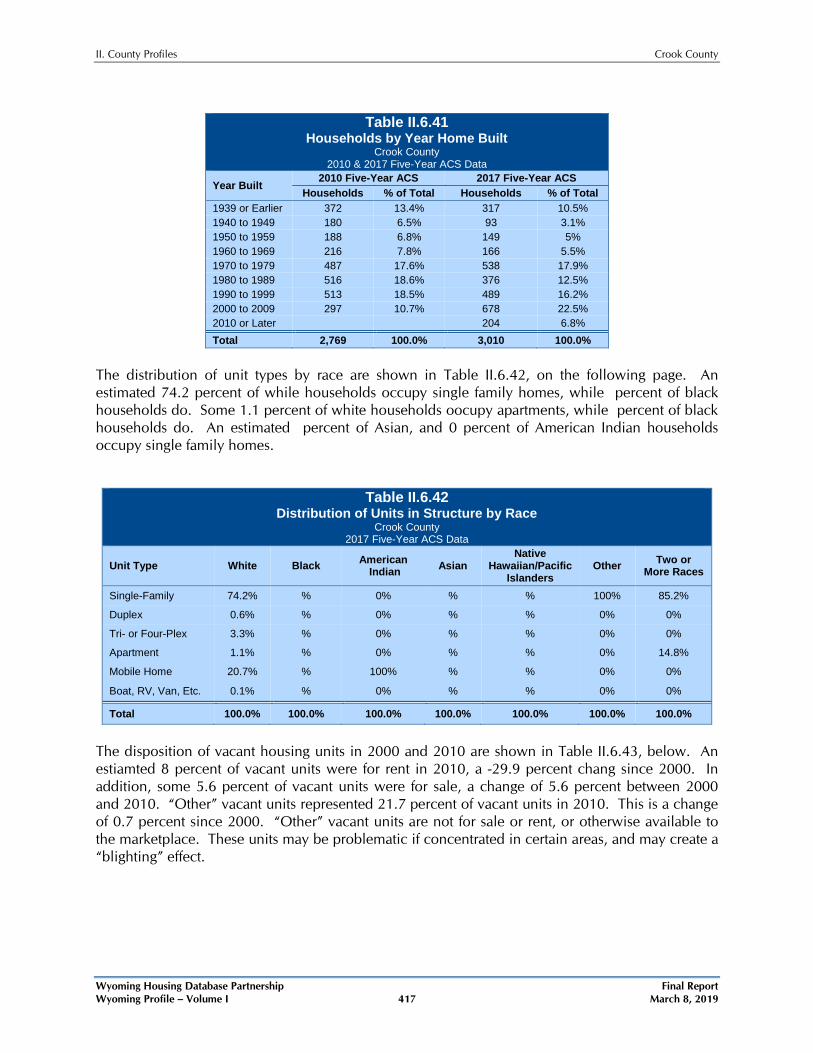
Table II.6.41, below, shows households by year home built for the 2010 and 2017 5-year ACS data. Housing units built between 2000 and 2009, account for 22.5 percent in 2010 and 10.7 percent of households. Housing units built prior to 1939 represented 10.5 percent of households in 2017 and 13.4 percent of households in 2010.
II. County Profiles Crook County
Wyoming Housing Database Partnership Final Report Wyoming Profile – Volume I 417 March 8, 2019
Table II.6.41
Households by Year Home Built Crook County
2010 & 2017 Five-Year ACS Data
Year Built 2010 Five-Year ACS 2017 Five-Year ACS
Households % of Total Households % of Total 1939 or Earlier 372 13.4% 317 10.5% 1940 to 1949 180 6.5% 93 3.1% 1950 to 1959 188 6.8% 149 5% 1960 to 1969 216 7.8% 166 5.5% 1970 to 1979 487 17.6% 538 17.9% 1980 to 1989 516 18.6% 376 12.5% 1990 to 1999 513 18.5% 489 16.2% 2000 to 2009 297 10.7% 678 22.5% 2010 or Later 204 6.8% Total 2,769 100.0% 3,010 100.0%
The distribution of unit types by race are shown in Table II.6.42, on the following page. An estimated 74.2 percent of while households occupy single family homes, while percent of black households do. Some 1.1 percent of white households oocupy apartments, while percent of black households do. An estimated percent of Asian, and 0 percent of American Indian households occupy single family homes.
Table II.6.42 Distribution of Units in Structure by Race
Crook County 2017 Five-Year ACS Data
Unit Type White Black American Indian Asian
Native Hawaiian/Pacific
Islanders Other Two or
More Races
Single-Family 74.2% % 0% % % 100% 85.2%
Duplex 0.6% % 0% % % 0% 0%
Tri- or Four-Plex 3.3% % 0% % % 0% 0%
Apartment 1.1% % 0% % % 0% 14.8%
Mobile Home 20.7% % 100% % % 0% 0%
Boat, RV, Van, Etc. 0.1% % 0% % % 0% 0%
Total 100.0% 100.0% 100.0% 100.0% 100.0% 100.0% 100.0%
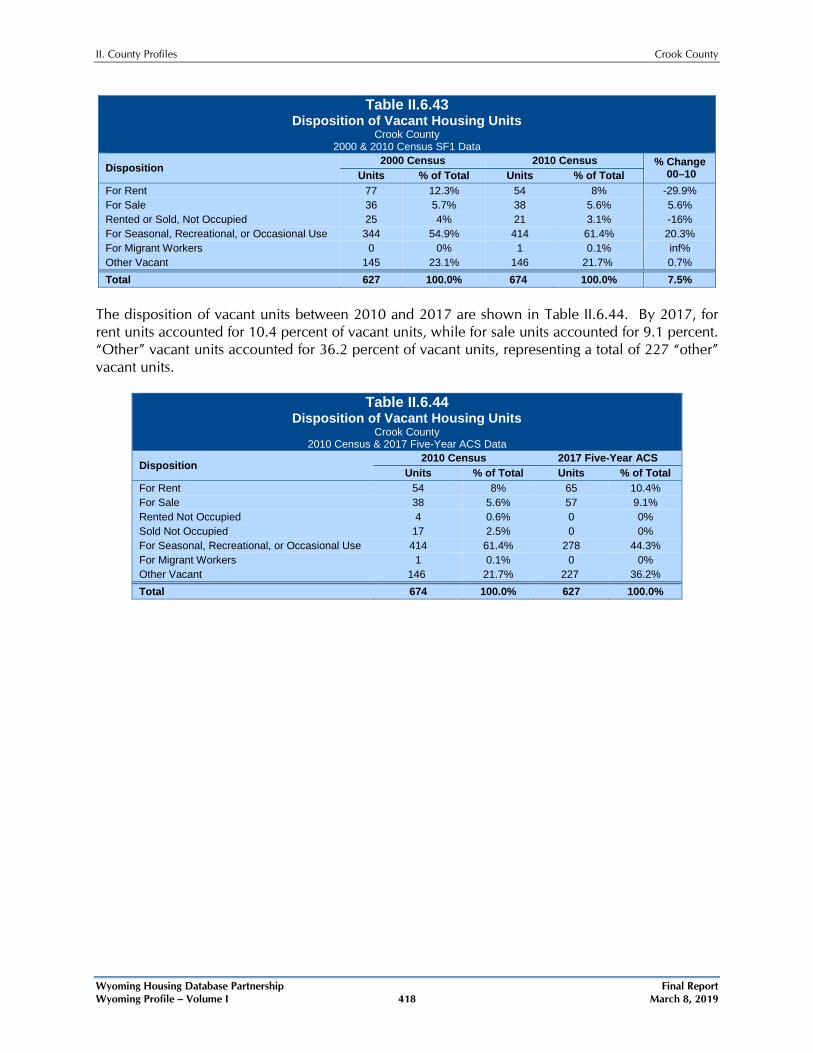
The disposition of vacant housing units in 2000 and 2010 are shown in Table II.6.43, below. An estiamted 8 percent of vacant units were for rent in 2010, a -29.9 percent chang since 2000. In addition, some 5.6 percent of vacant units were for sale, a change of 5.6 percent between 2000 and 2010. “Other” vacant units represented 21.7 percent of vacant units in 2010. This is a change of 0.7 percent since 2000. “Other” vacant units are not for sale or rent, or otherwise available to the marketplace. These units may be problematic if concentrated in certain areas, and may create a “blighting” effect.
II. County Profiles Crook County
Wyoming Housing Database Partnership Final Report Wyoming Profile – Volume I 418 March 8, 2019
Table II.6.43 Disposition of Vacant Housing Units
Crook County 2000 & 2010 Census SF1 Data
Disposition 2000 Census 2010 Census % Change
00–10 Units % of Total Units % of Total For Rent 77 12.3% 54 8% -29.9% For Sale 36 5.7% 38 5.6% 5.6% Rented or Sold, Not Occupied 25 4% 21 3.1% -16% For Seasonal, Recreational, or Occasional Use 344 54.9% 414 61.4% 20.3% For Migrant Workers 0 0% 1 0.1% inf% Other Vacant 145 23.1% 146 21.7% 0.7% Total 627 100.0% 674 100.0% 7.5%
The disposition of vacant units between 2010 and 2017 are shown in Table II.6.44. By 2017, for rent units accounted for 10.4 percent of vacant units, while for sale units accounted for 9.1 percent. “Other” vacant units accounted for 36.2 percent of vacant units, representing a total of 227 “other” vacant units.
Table II.6.44 Disposition of Vacant Housing Units
Crook County 2010 Census & 2017 Five-Year ACS Data
Disposition 2010 Census 2017 Five-Year ACS
Units % of Total Units % of Total For Rent 54 8% 65 10.4% For Sale 38 5.6% 57 9.1% Rented Not Occupied 4 0.6% 0 0% Sold Not Occupied 17 2.5% 0 0% For Seasonal, Recreational, or Occasional Use 414 61.4% 278 44.3% For Migrant Workers 1 0.1% 0 0% Other Vacant 146 21.7% 227 36.2% Total 674 100.0% 627 100.0%
II. County Profiles Crook County
Wyoming Housing Database Partnership Final Report Wyoming Profile – Volume I 419 March 8, 2019
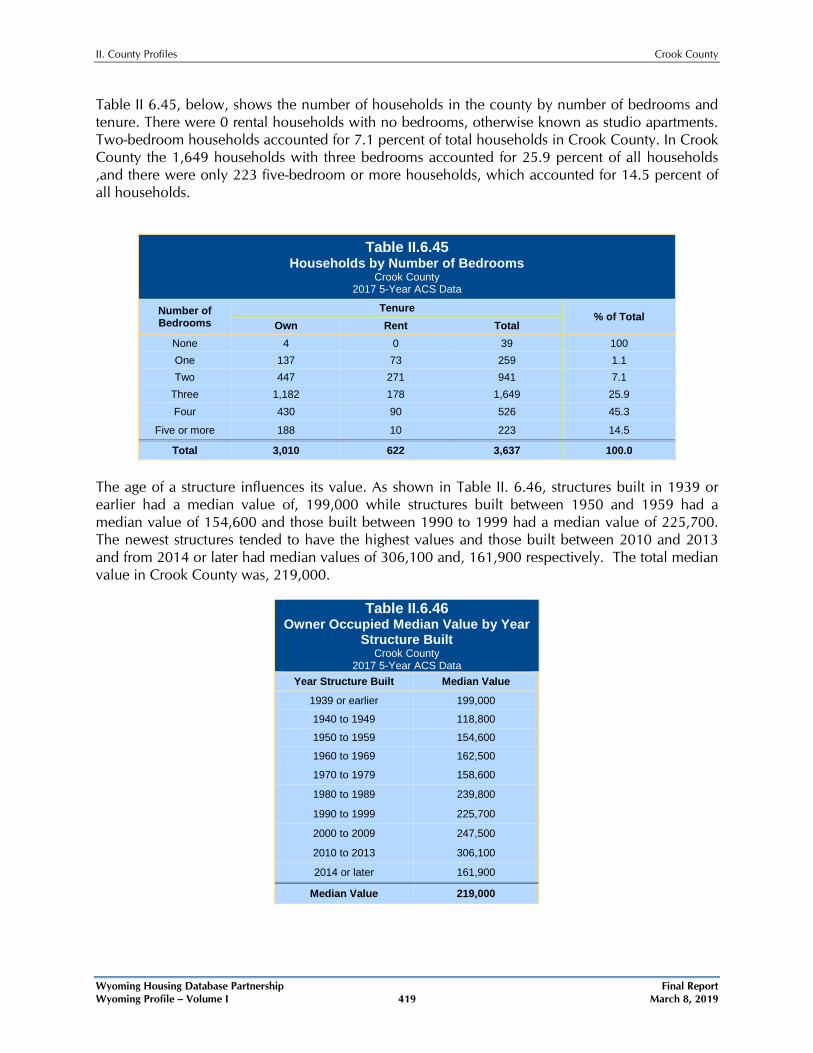
Table II 6.45, below, shows the number of households in the county by number of bedrooms and tenure. There were 0 rental households with no bedrooms, otherwise known as studio apartments. Two-bedroom households accounted for 7.1 percent of total households in Crook County. In Crook County the 1,649 households with three bedrooms accounted for 25.9 percent of all households ,and there were only 223 five-bedroom or more households, which accounted for 14.5 percent of all households.
Table II.6.45
Households by Number of Bedrooms Crook County
2017 5-Year ACS Data Number of Bedrooms
Tenure % of Total
Own Rent Total None 4 0 39 100 One 137 73 259 1.1 Two 447 271 941 7.1
Three 1,182 178 1,649 25.9 Four 430 90 526 45.3
Five or more 188 10 223 14.5
Total 3,010 622 3,637 100.0
The age of a structure influences its value. As shown in Table II. 6.46, structures built in 1939 or earlier had a median value of, 199,000 while structures built between 1950 and 1959 had a median value of 154,600 and those built between 1990 to 1999 had a median value of 225,700. The newest structures tended to have the highest values and those built between 2010 and 2013 and from 2014 or later had median values of 306,100 and, 161,900 respectively. The total median value in Crook County was, 219,000.
Table II.6.46 Owner Occupied Median Value by Year
Structure Built Crook County
2017 5-Year ACS Data Year Structure Built Median Value
1939 or earlier 199,000
1940 to 1949 118,800
1950 to 1959 154,600
1960 to 1969 162,500
1970 to 1979 158,600
1980 to 1989 239,800
1990 to 1999 225,700
2000 to 2009 247,500
2010 to 2013 306,100
2014 or later 161,900
Median Value 219,000
II. County Profiles Crook County
Wyoming Housing Database Partnership Final Report Wyoming Profile – Volume I 420 March 8, 2019
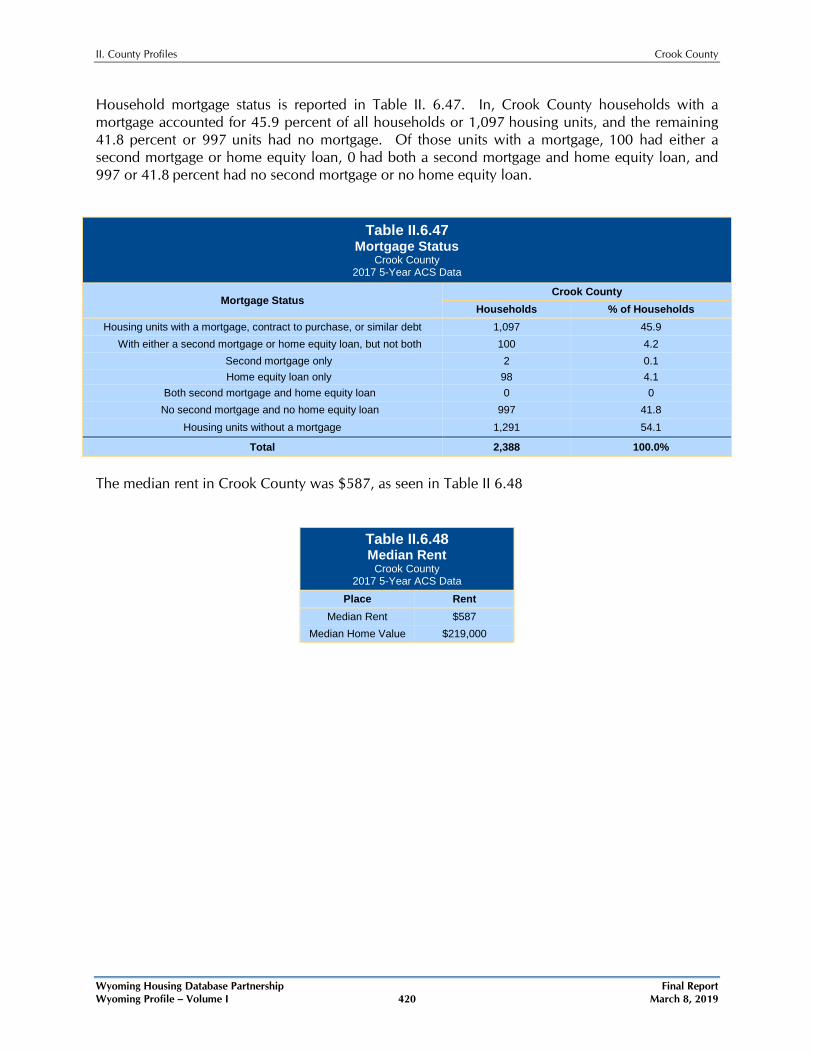
Household mortgage status is reported in Table II. 6.47. In, Crook County households with a mortgage accounted for 45.9 percent of all households or 1,097 housing units, and the remaining 41.8 percent or 997 units had no mortgage. Of those units with a mortgage, 100 had either a second mortgage or home equity loan, 0 had both a second mortgage and home equity loan, and 997 or 41.8 percent had no second mortgage or no home equity loan.
Table II.6.47
Mortgage Status Crook County
2017 5-Year ACS Data
Mortgage Status Crook County
Households % of Households Housing units with a mortgage, contract to purchase, or similar debt 1,097 45.9 With either a second mortgage or home equity loan, but not both 100 4.2
Second mortgage only 2 0.1 Home equity loan only 98 4.1
Both second mortgage and home equity loan 0 0 No second mortgage and no home equity loan 997 41.8
Housing units without a mortgage 1,291 54.1
Total 2,388 100.0%
The median rent in Crook County was $587, as seen in Table II 6.48
Table II.6.48 Median Rent
Crook County 2017 5-Year ACS Data
Place Rent Median Rent $587
Median Home Value $219,000
II. County Profiles Crook County
Wyoming Housing Database Partnership Final Report Wyoming Profile – Volume I 421 March 8, 2019
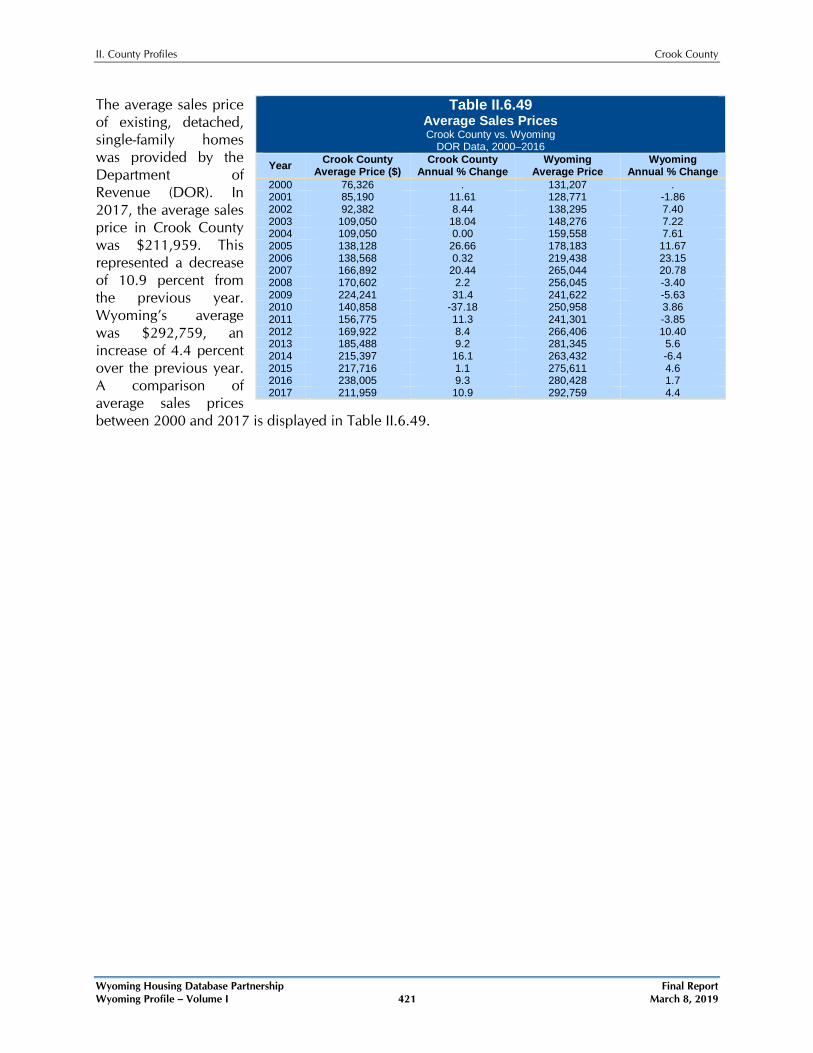
The average sales price of existing, detached, single-family homes was provided by the Department of Revenue (DOR). In 2017, the average sales price in Crook County was $211,959. This represented a decrease of 10.9 percent from the previous year. Wyoming’s average was $292,759, an increase of 4.4 percent over the previous year. A comparison of average sales prices between 2000 and 2017 is displayed in Table II.6.49.
Table II.6.49 Average Sales Prices Crook County vs. Wyoming
DOR Data, 2000–2016 Year Crook County
Average Price ($) Crook County
Annual % Change Wyoming
Average Price Wyoming
Annual % Change 2000 76,326 . 131,207 . 2001 85,190 11.61 128,771 -1.86 2002 92,382 8.44 138,295 7.40 2003 109,050 18.04 148,276 7.22 2004 109,050 0.00 159,558 7.61 2005 138,128 26.66 178,183 11.67 2006 138,568 0.32 219,438 23.15 2007 166,892 20.44 265,044 20.78 2008 170,602 2.2 256,045 -3.40 2009 224,241 31.4 241,622 -5.63 2010 140,858 -37.18 250,958 3.86 2011 156,775 11.3 241,301 -3.85 2012 169,922 8.4 266,406 10.40 2013 185,488 9.2 281,345 5.6 2014 215,397 16.1 263,432 -6.4 2015 217,716 1.1 275,611 4.6 2016 238,005 9.3 280,428 1.7 2017 211,959 10.9 292,759 4.4
II. County Profiles Crook County
Wyoming Housing Database Partnership Final Report Wyoming Profile – Volume I 422 March 8, 2019
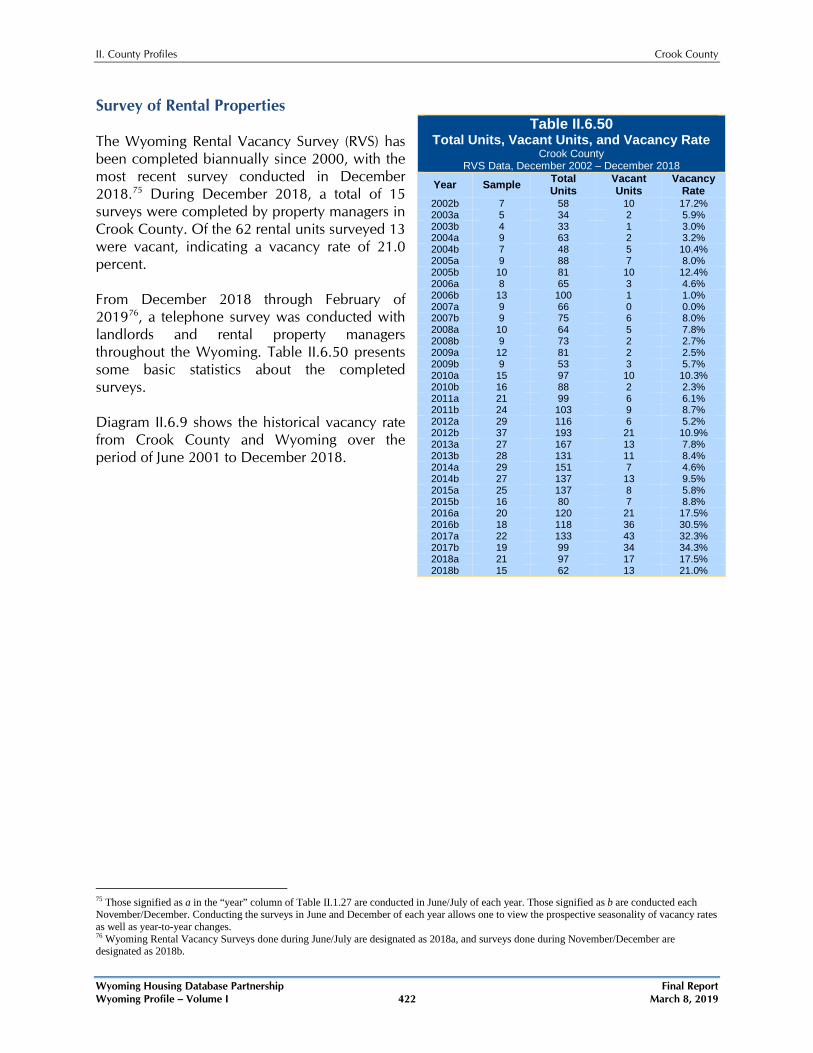
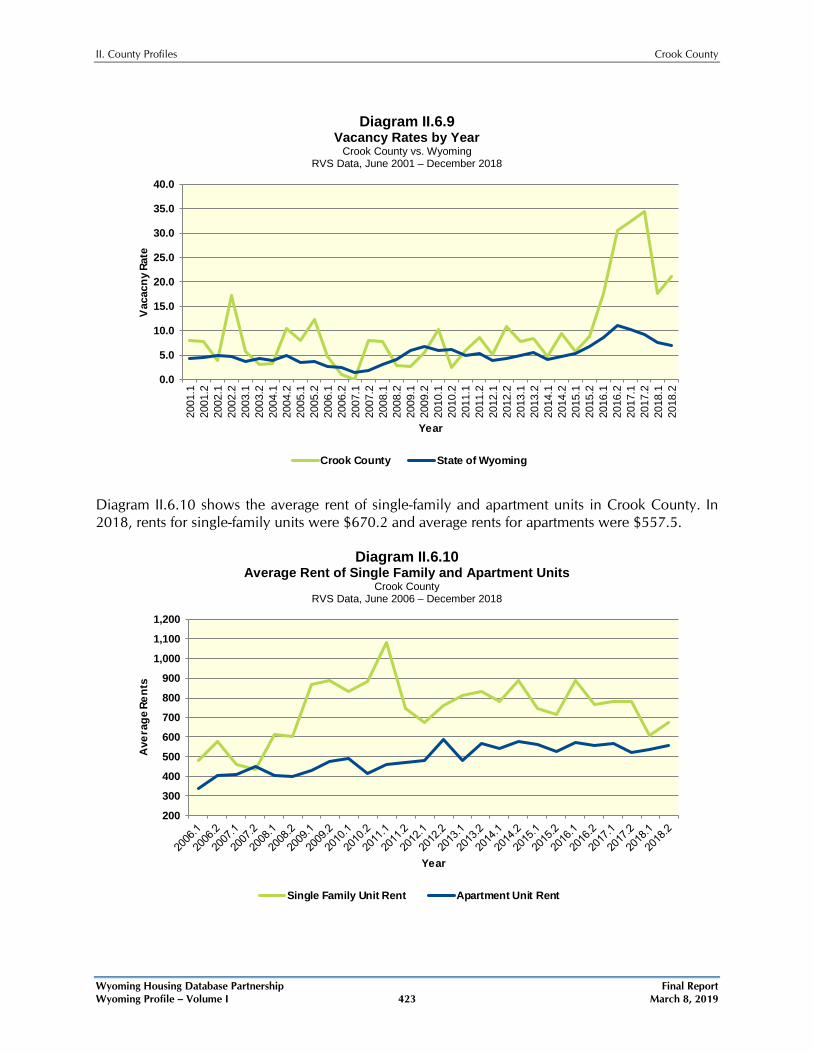
Survey of Rental Properties The Wyoming Rental Vacancy Survey (RVS) has been completed biannually since 2000, with the most recent survey conducted in December 2018.75 During December 2018, a total of 15 surveys were completed by property managers in Crook County. Of the 62 rental units surveyed 13 were vacant, indicating a vacancy rate of 21.0 percent. From December 2018 through February of 201976, a telephone survey was conducted with landlords and rental property managers throughout the Wyoming. Table II.6.50 presents some basic statistics about the completed surveys. Diagram II.6.9 shows the historical vacancy rate from Crook County and Wyoming over the period of June 2001 to December 2018.
75 Those signified as a in the “year” column of Table II.1.27 are conducted in June/July of each year. Those signified as b are conducted each November/December. Conducting the surveys in June and December of each year allows one to view the prospective seasonality of vacancy rates as well as year-to-year changes. 76 Wyoming Rental Vacancy Surveys done during June/July are designated as 2018a, and surveys done during November/December are designated as 2018b.
Table II.6.50 Total Units, Vacant Units, and Vacancy Rate
Crook County RVS Data, December 2002 – December 2018
Year Sample Total Units
Vacant Units
Vacancy Rate
2002b 7 58 10 17.2% 2003a 5 34 2 5.9% 2003b 4 33 1 3.0% 2004a 9 63 2 3.2% 2004b 7 48 5 10.4% 2005a 9 88 7 8.0% 2005b 10 81 10 12.4% 2006a 8 65 3 4.6% 2006b 13 100 1 1.0% 2007a 9 66 0 0.0% 2007b 9 75 6 8.0% 2008a 10 64 5 7.8% 2008b 9 73 2 2.7% 2009a 12 81 2 2.5% 2009b 9 53 3 5.7% 2010a 15 97 10 10.3% 2010b 16 88 2 2.3% 2011a 21 99 6 6.1% 2011b 24 103 9 8.7% 2012a 29 116 6 5.2% 2012b 37 193 21 10.9% 2013a 27 167 13 7.8% 2013b 28 131 11 8.4% 2014a 29 151 7 4.6% 2014b 27 137 13 9.5% 2015a 25 137 8 5.8% 2015b 16 80 7 8.8% 2016a 20 120 21 17.5% 2016b 18 118 36 30.5% 2017a 22 133 43 32.3% 2017b 19 99 34 34.3% 2018a 21 97 17 17.5% 2018b 15 62 13 21.0%
II. County Profiles Crook County
Wyoming Housing Database Partnership Final Report Wyoming Profile – Volume I 423 March 8, 2019
Diagram II.6.9
Vacancy Rates by Year Crook County vs. Wyoming
RVS Data, June 2001 – December 2018
0.0
5.0
10.0
15.0
20.0
25.0
30.0
35.0
40.020
01.1
2001
.220
02.1
2002
.220
03.1
2003
.220
04.1
2004
.220
05.1
2005
.220
06.1
2006
.220
07.1
2007
.220
08.1
2008
.220
09.1
2009
.220
10.1
2010
.220
11.1
2011
.220
12.1
2012
.220
13.1
2013
.220
14.1
2014
.220
15.1
2015
.220
16.1
2016
.220
17.1
2017
.220
18.1
2018
.2
Vac
acny
Rat
e
Year
Crook County State of Wyoming
Diagram II.6.10 shows the average rent of single-family and apartment units in Crook County. In 2018, rents for single-family units were $670.2 and average rents for apartments were $557.5.
Diagram II.6.10 Average Rent of Single Family and Apartment Units
Crook County RVS Data, June 2006 – December 2018
200
300
400
500
600
700
800
900
1,000
1,100
1,200
Ave
rage
Ren
ts
Year
Single Family Unit Rent Apartment Unit Rent
II. County Profiles Crook County
Wyoming Housing Database Partnership Final Report Wyoming Profile – Volume I 424 March 8, 2019
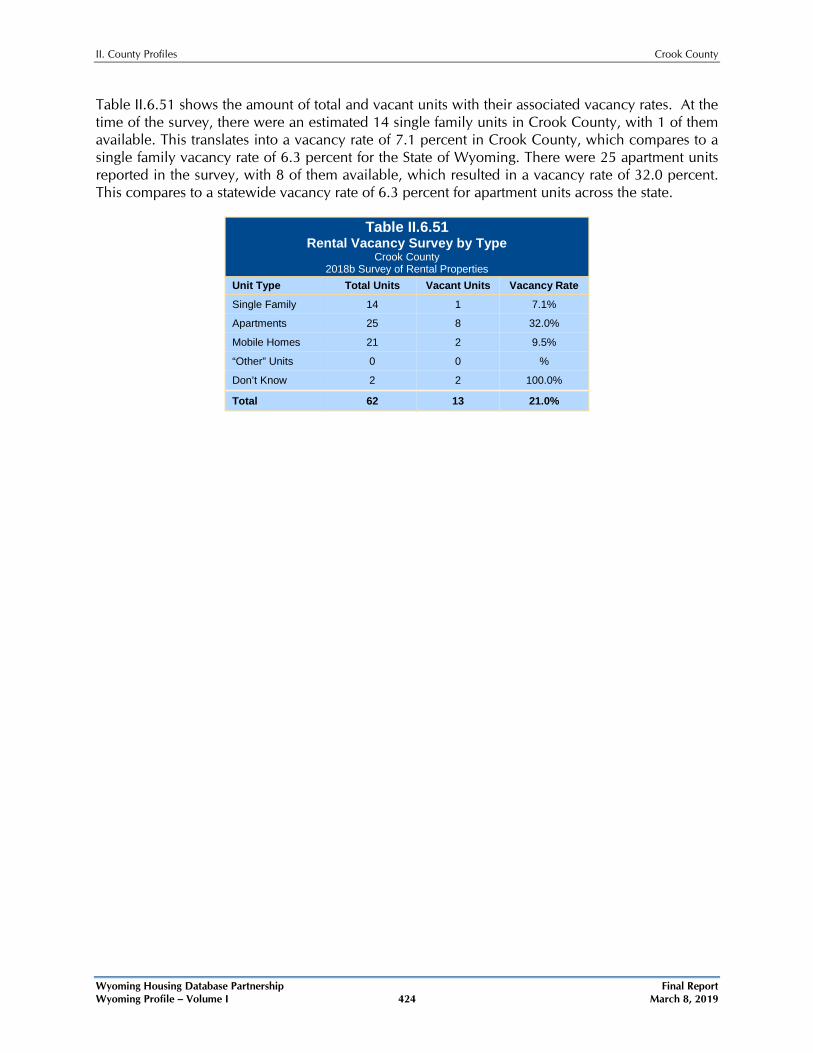
Table II.6.51 shows the amount of total and vacant units with their associated vacancy rates. At the time of the survey, there were an estimated 14 single family units in Crook County, with 1 of them available. This translates into a vacancy rate of 7.1 percent in Crook County, which compares to a single family vacancy rate of 6.3 percent for the State of Wyoming. There were 25 apartment units reported in the survey, with 8 of them available, which resulted in a vacancy rate of 32.0 percent. This compares to a statewide vacancy rate of 6.3 percent for apartment units across the state.
Table II.6.51 Rental Vacancy Survey by Type
Crook County 2018b Survey of Rental Properties
Unit Type Total Units Vacant Units Vacancy Rate
Single Family 14 1 7.1%
Apartments 25 8 32.0%
Mobile Homes 21 2 9.5%
“Other” Units 0 0 %
Don’t Know 2 2 100.0%
Total 62 13 21.0%
II. County Profiles Crook County
Wyoming Housing Database Partnership Final Report Wyoming Profile – Volume I 425 March 8, 2019
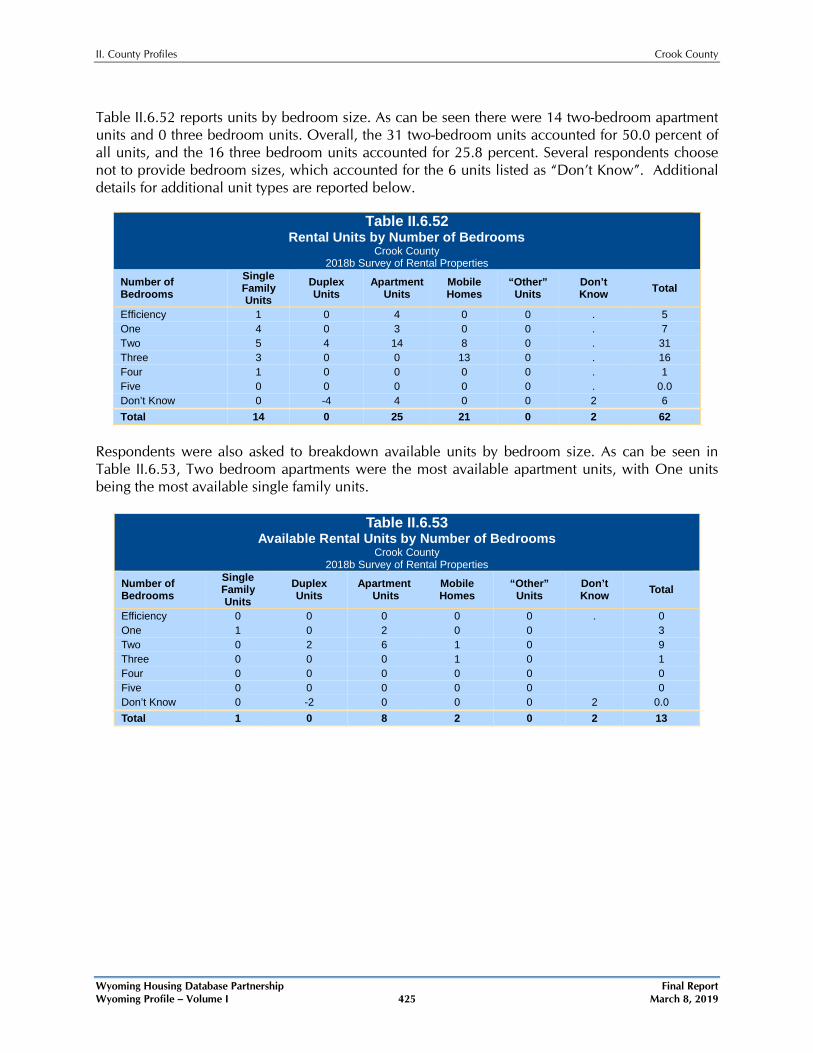
Table II.6.52 reports units by bedroom size. As can be seen there were 14 two-bedroom apartment units and 0 three bedroom units. Overall, the 31 two-bedroom units accounted for 50.0 percent of all units, and the 16 three bedroom units accounted for 25.8 percent. Several respondents choose not to provide bedroom sizes, which accounted for the 6 units listed as “Don’t Know”. Additional details for additional unit types are reported below.
Table II.6.52 Rental Units by Number of Bedrooms
Crook County 2018b Survey of Rental Properties
Number of Bedrooms
Single Family Units
Duplex Units
Apartment Units
Mobile Homes
“Other” Units
Don’t Know Total
Efficiency 1 0 4 0 0 . 5 One 4 0 3 0 0 . 7 Two 5 4 14 8 0 . 31 Three 3 0 0 13 0 . 16 Four 1 0 0 0 0 . 1 Five 0 0 0 0 0 . 0.0 Don’t Know 0 -4 4 0 0 2 6 Total 14 0 25 21 0 2 62
Respondents were also asked to breakdown available units by bedroom size. As can be seen in Table II.6.53, Two bedroom apartments were the most available apartment units, with One units being the most available single family units.
Table II.6.53 Available Rental Units by Number of Bedrooms
Crook County 2018b Survey of Rental Properties
Number of Bedrooms
Single Family Units
Duplex Units
Apartment Units
Mobile Homes
“Other” Units
Don’t Know Total
Efficiency 0 0 0 0 0 . 0 One 1 0 2 0 0 3 Two 0 2 6 1 0 9 Three 0 0 0 1 0 1 Four 0 0 0 0 0 0 Five 0 0 0 0 0 0 Don’t Know 0 -2 0 0 0 2 0.0 Total 1 0 8 2 0 2 13
II. County Profiles Crook County
Wyoming Housing Database Partnership Final Report Wyoming Profile – Volume I 426 March 8, 2019
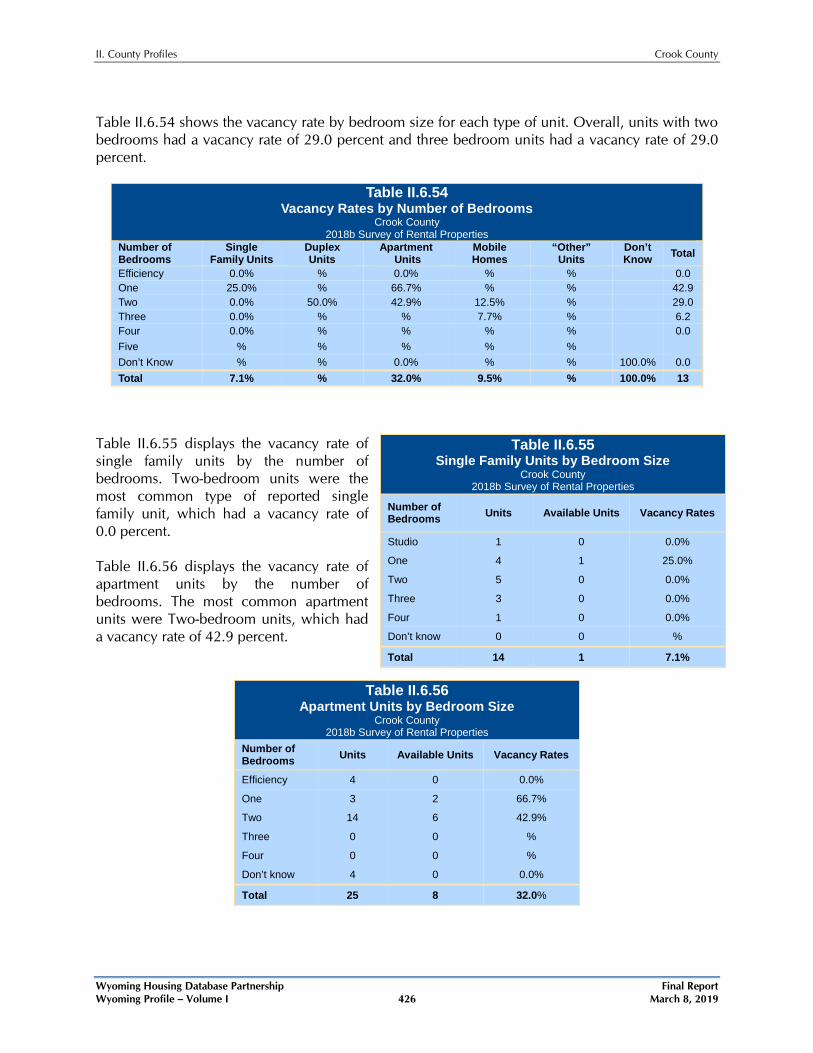
Table II.6.54 shows the vacancy rate by bedroom size for each type of unit. Overall, units with two bedrooms had a vacancy rate of 29.0 percent and three bedroom units had a vacancy rate of 29.0 percent.
Table II.6.54 Vacancy Rates by Number of Bedrooms
Crook County 2018b Survey of Rental Properties
Number of Bedrooms
Single Family Units
Duplex Units
Apartment Units
Mobile Homes
“Other” Units
Don’t Know Total
Efficiency 0.0% % 0.0% % % 0.0 One 25.0% % 66.7% % % 42.9 Two 0.0% 50.0% 42.9% 12.5% % 29.0 Three 0.0% % % 7.7% % 6.2 Four 0.0% % % % % 0.0 Five % % % % % Don’t Know % % 0.0% % % 100.0% 0.0 Total 7.1% % 32.0% 9.5% % 100.0% 13
Table II.6.55 displays the vacancy rate of single family units by the number of bedrooms. Two-bedroom units were the most common type of reported single family unit, which had a vacancy rate of 0.0 percent. Table II.6.56 displays the vacancy rate of apartment units by the number of bedrooms. The most common apartment units were Two-bedroom units, which had a vacancy rate of 42.9 percent.
Table II.6.56 Apartment Units by Bedroom Size
Crook County 2018b Survey of Rental Properties
Number of Bedrooms Units Available Units Vacancy Rates
Efficiency 4 0 0.0% One 3 2 66.7% Two 14 6 42.9% Three 0 0 % Four 0 0 % Don’t know 4 0 0.0% Total 25 8 32.0%
Table II.6.55 Single Family Units by Bedroom Size
Crook County 2018b Survey of Rental Properties
Number of Bedrooms Units Available Units Vacancy Rates
Studio 1 0 0.0% One 4 1 25.0% Two 5 0 0.0% Three 3 0 0.0% Four 1 0 0.0% Don’t know 0 0 % Total 14 1 7.1%
II. County Profiles Crook County
Wyoming Housing Database Partnership Final Report Wyoming Profile – Volume I 427 March 8, 2019
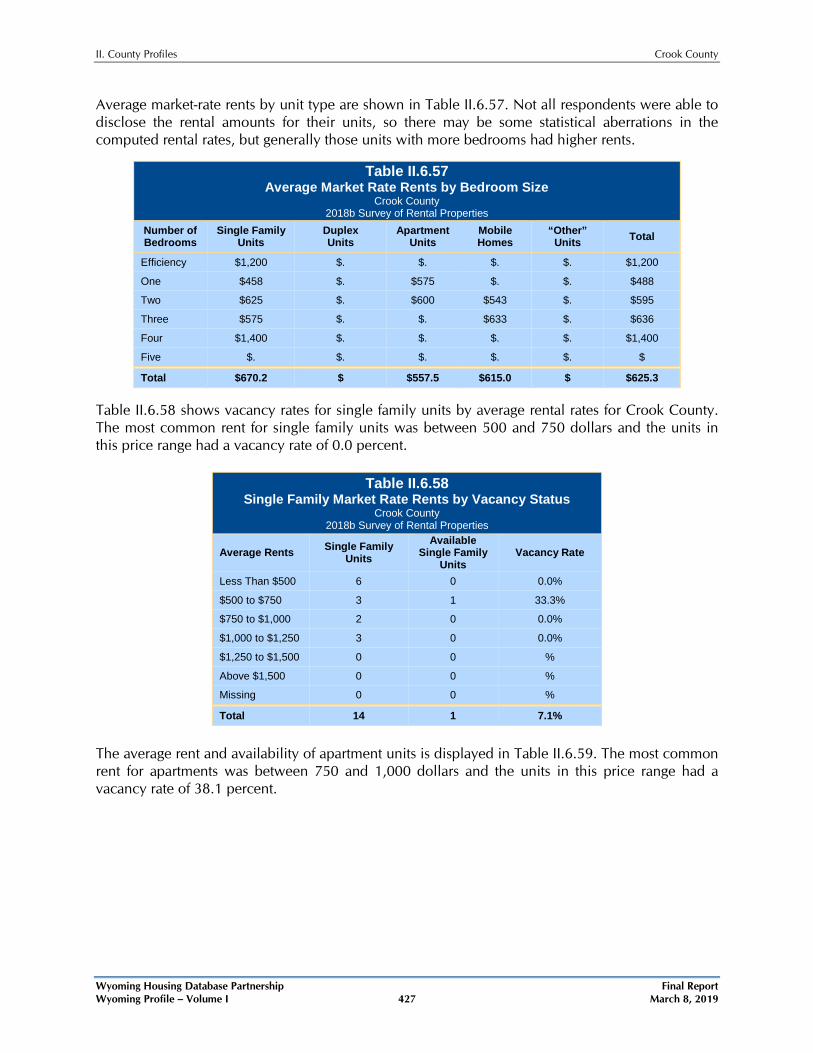
Average market-rate rents by unit type are shown in Table II.6.57. Not all respondents were able to disclose the rental amounts for their units, so there may be some statistical aberrations in the computed rental rates, but generally those units with more bedrooms had higher rents.
Table II.6.57 Average Market Rate Rents by Bedroom Size
Crook County 2018b Survey of Rental Properties
Number of Bedrooms
Single Family Units
Duplex Units
Apartment Units
Mobile Homes
“Other” Units Total
Efficiency $1,200 $. $. $. $. $1,200 One $458 $. $575 $. $. $488 Two $625 $. $600 $543 $. $595 Three $575 $. $. $633 $. $636 Four $1,400 $. $. $. $. $1,400 Five $. $. $. $. $. $ Total $670.2 $ $557.5 $615.0 $ $625.3
Table II.6.58 shows vacancy rates for single family units by average rental rates for Crook County. The most common rent for single family units was between 500 and 750 dollars and the units in this price range had a vacancy rate of 0.0 percent.
Table II.6.58 Single Family Market Rate Rents by Vacancy Status
Crook County 2018b Survey of Rental Properties
Average Rents Single Family Units
Available Single Family
Units Vacancy Rate
Less Than $500 6 0 0.0% $500 to $750 3 1 33.3% $750 to $1,000 2 0 0.0% $1,000 to $1,250 3 0 0.0% $1,250 to $1,500 0 0 % Above $1,500 0 0 % Missing 0 0 % Total 14 1 7.1%
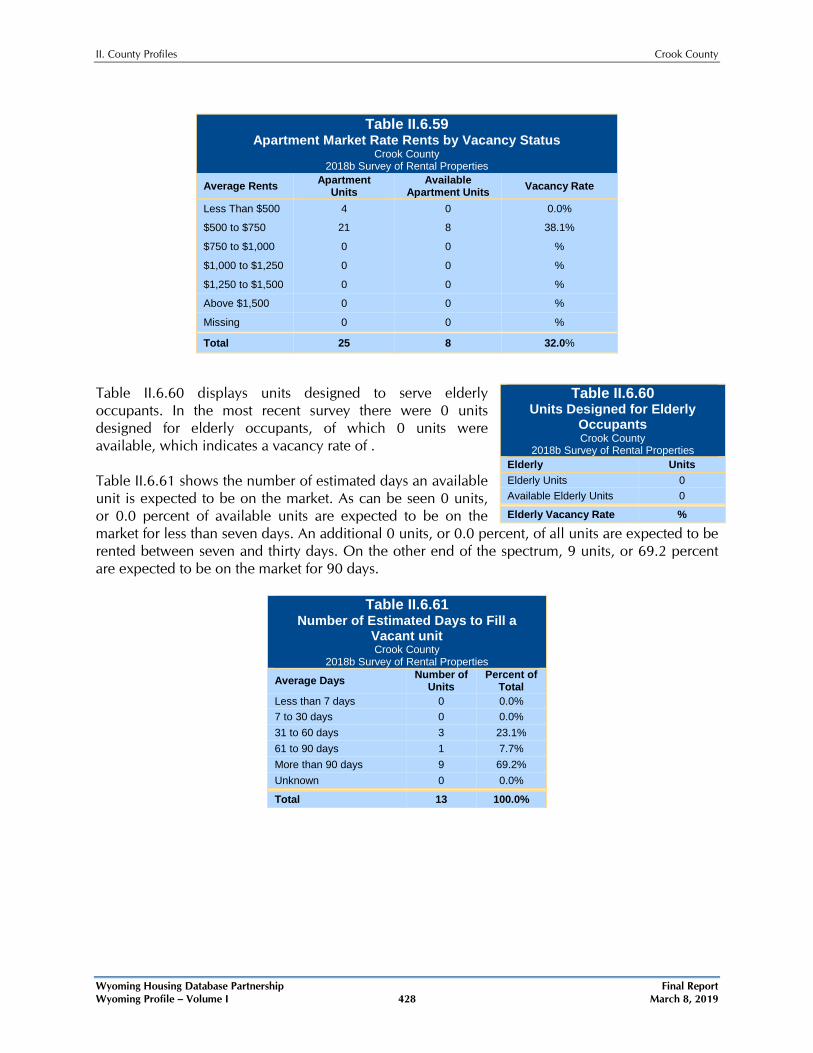
The average rent and availability of apartment units is displayed in Table II.6.59. The most common rent for apartments was between 750 and 1,000 dollars and the units in this price range had a vacancy rate of 38.1 percent.
II. County Profiles Crook County
Wyoming Housing Database Partnership Final Report Wyoming Profile – Volume I 428 March 8, 2019
Table II.6.59
Apartment Market Rate Rents by Vacancy Status Crook County
2018b Survey of Rental Properties
Average Rents Apartment Units
Available Apartment Units Vacancy Rate
Less Than $500 4 0 0.0% $500 to $750 21 8 38.1% $750 to $1,000 0 0 % $1,000 to $1,250 0 0 % $1,250 to $1,500 0 0 % Above $1,500 0 0 % Missing 0 0 % Total 25 8 32.0%
Table II.6.60 displays units designed to serve elderly occupants. In the most recent survey there were 0 units designed for elderly occupants, of which 0 units were available, which indicates a vacancy rate of . Table II.6.61 shows the number of estimated days an available unit is expected to be on the market. As can be seen 0 units, or 0.0 percent of available units are expected to be on the market for less than seven days. An additional 0 units, or 0.0 percent, of all units are expected to be rented between seven and thirty days. On the other end of the spectrum, 9 units, or 69.2 percent are expected to be on the market for 90 days.
Table II.6.61 Number of Estimated Days to Fill a
Vacant unit Crook County
2018b Survey of Rental Properties
Average Days Number of Units
Percent of Total
Less than 7 days 0 0.0% 7 to 30 days 0 0.0% 31 to 60 days 3 23.1% 61 to 90 days 1 7.7% More than 90 days 9 69.2% Unknown 0 0.0%
Total 13 100.0%
Table II.6.60 Units Designed for Elderly
Occupants Crook County
2018b Survey of Rental Properties Elderly Units Elderly Units 0 Available Elderly Units 0
Elderly Vacancy Rate %
II. County Profiles Crook County
Wyoming Housing Database Partnership Final Report Wyoming Profile – Volume I 429 March 8, 2019
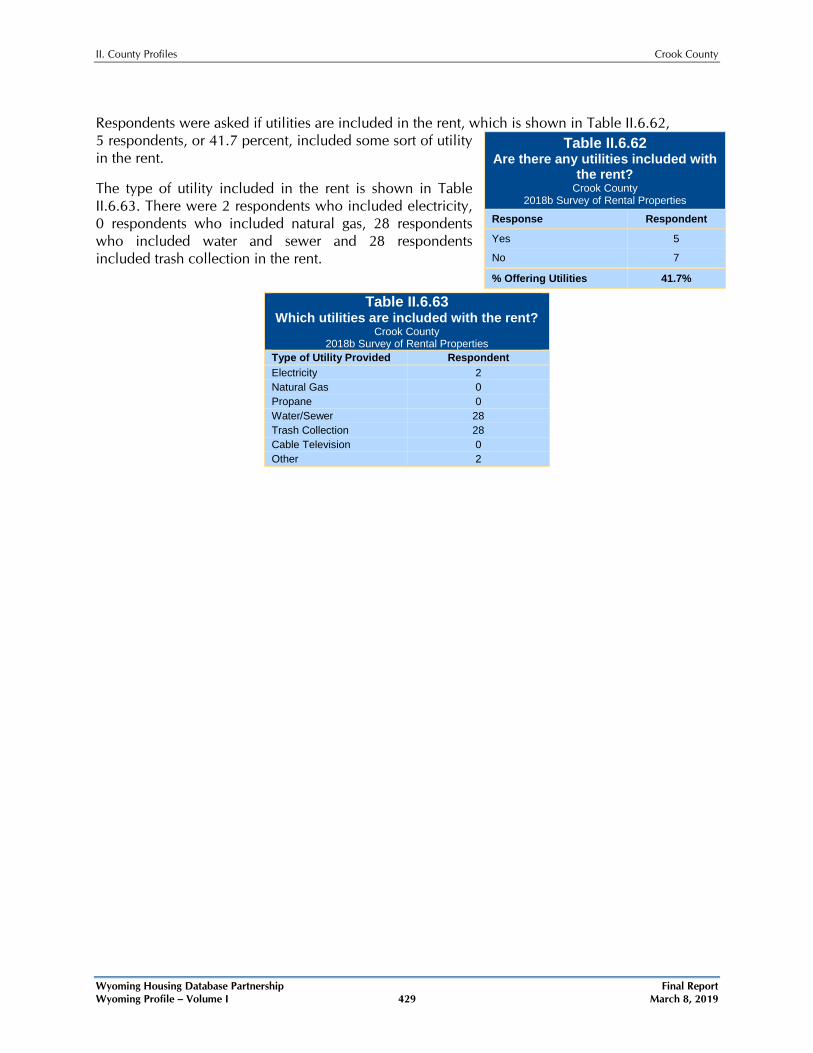
Respondents were asked if utilities are included in the rent, which is shown in Table II.6.62, 5 respondents, or 41.7 percent, included some sort of utility in the rent.
The type of utility included in the rent is shown in Table II.6.63. There were 2 respondents who included electricity, 0 respondents who included natural gas, 28 respondents who included water and sewer and 28 respondents included trash collection in the rent.
Table II.6.63 Which utilities are included with the rent?
Crook County 2018b Survey of Rental Properties
Type of Utility Provided Respondent Electricity 2 Natural Gas 0 Propane 0 Water/Sewer 28 Trash Collection 28 Cable Television 0 Other 2
Table II.6.62 Are there any utilities included with
the rent? Crook County
2018b Survey of Rental Properties Response Respondent
Yes 5
No 7
% Offering Utilities 41.7%
II. County Profiles Crook County
Wyoming Housing Database Partnership Final Report Wyoming Profile – Volume I 430 March 8, 2019
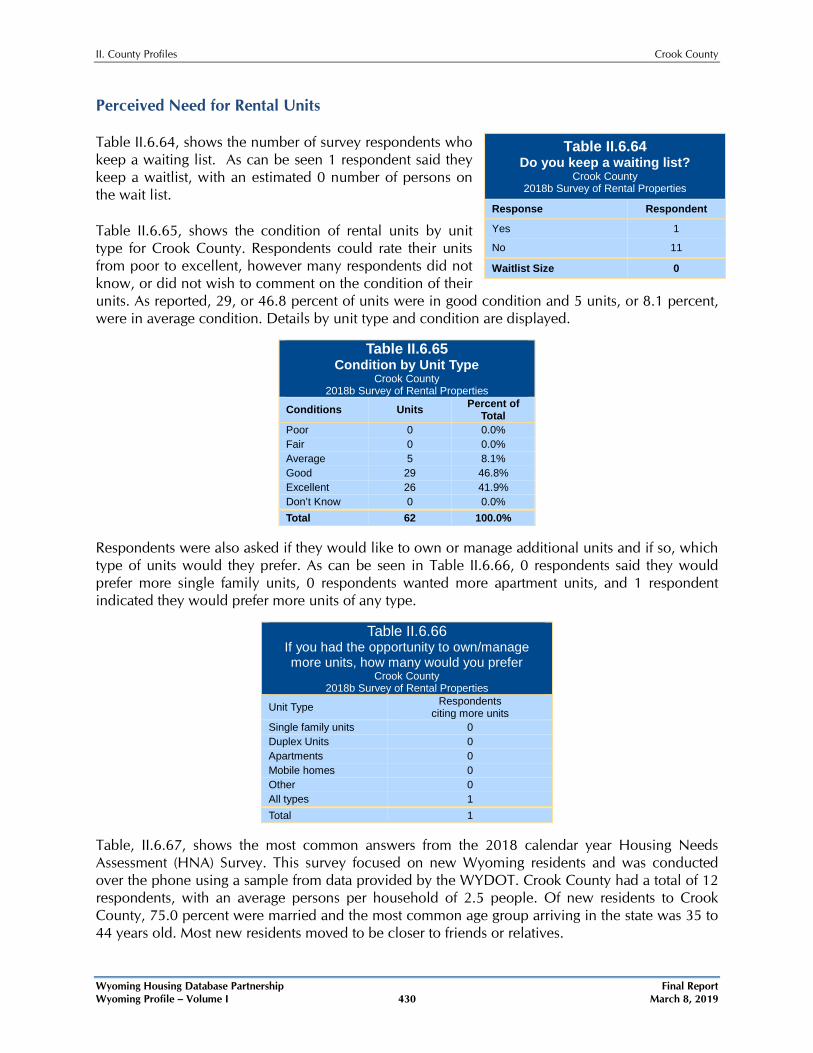
Perceived Need for Rental Units Table II.6.64, shows the number of survey respondents who keep a waiting list. As can be seen 1 respondent said they keep a waitlist, with an estimated 0 number of persons on the wait list. Table II.6.65, shows the condition of rental units by unit type for Crook County. Respondents could rate their units from poor to excellent, however many respondents did not know, or did not wish to comment on the condition of their units. As reported, 29, or 46.8 percent of units were in good condition and 5 units, or 8.1 percent, were in average condition. Details by unit type and condition are displayed.
Table II.6.65 Condition by Unit Type
Crook County 2018b Survey of Rental Properties
Conditions Units Percent of Total
Poor 0 0.0% Fair 0 0.0% Average 5 8.1% Good 29 46.8% Excellent 26 41.9% Don’t Know 0 0.0% Total 62 100.0%
Respondents were also asked if they would like to own or manage additional units and if so, which type of units would they prefer. As can be seen in Table II.6.66, 0 respondents said they would prefer more single family units, 0 respondents wanted more apartment units, and 1 respondent indicated they would prefer more units of any type.
Table II.6.66 If you had the opportunity to own/manage more units, how many would you prefer
Crook County 2018b Survey of Rental Properties
Unit Type Respondents citing more units
Single family units 0 Duplex Units 0 Apartments 0 Mobile homes 0 Other 0 All types 1 Total 1
Table, II.6.67, shows the most common answers from the 2018 calendar year Housing Needs Assessment (HNA) Survey. This survey focused on new Wyoming residents and was conducted over the phone using a sample from data provided by the WYDOT. Crook County had a total of 12 respondents, with an average persons per household of 2.5 people. Of new residents to Crook County, 75.0 percent were married and the most common age group arriving in the state was 35 to 44 years old. Most new residents moved to be closer to friends or relatives.
Table II.6.64 Do you keep a waiting list?
Crook County 2018b Survey of Rental Properties
Response Respondent
Yes 1
No 11
Waitlist Size 0
II. County Profiles Crook County
Wyoming Housing Database Partnership Final Report Wyoming Profile – Volume I 431 March 8, 2019
The HNA survey, also asked residents about their current residence. New residents most commonly reported living in a single family home, with 58.3 percent of respondents renting their residence. The average mortgage payment in Crook County was $239 and the average rent was $771. When asked if they were satisfied with their current housing, 83.3 percent said they were satisfied with their current housing.
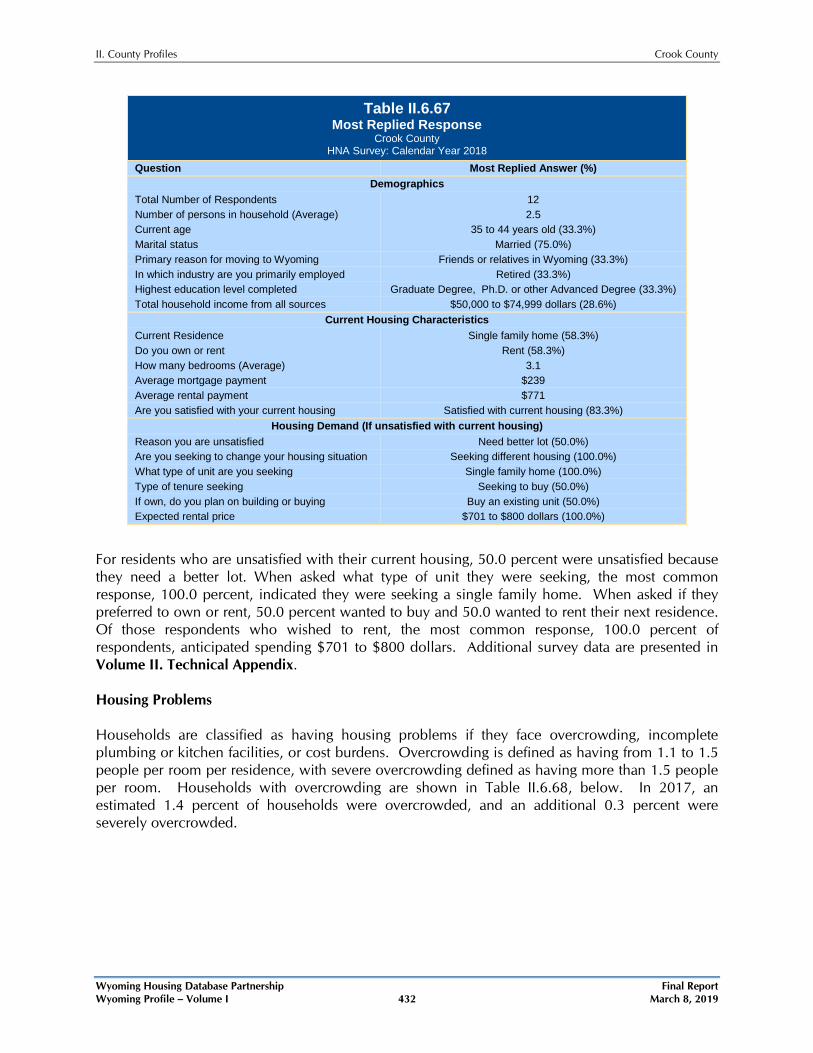
II. County Profiles Crook County
Wyoming Housing Database Partnership Final Report Wyoming Profile – Volume I 432 March 8, 2019
Table II.6.67 Most Replied Response
Crook County HNA Survey: Calendar Year 2018
Question Most Replied Answer (%) Demographics
Total Number of Respondents 12 Number of persons in household (Average) 2.5 Current age 35 to 44 years old (33.3%) Marital status Married (75.0%) Primary reason for moving to Wyoming Friends or relatives in Wyoming (33.3%) In which industry are you primarily employed Retired (33.3%) Highest education level completed Graduate Degree, Ph.D. or other Advanced Degree (33.3%) Total household income from all sources $50,000 to $74,999 dollars (28.6%)
Current Housing Characteristics Current Residence Single family home (58.3%) Do you own or rent Rent (58.3%) How many bedrooms (Average) 3.1 Average mortgage payment $239 Average rental payment $771 Are you satisfied with your current housing Satisfied with current housing (83.3%)
Housing Demand (If unsatisfied with current housing) Reason you are unsatisfied Need better lot (50.0%) Are you seeking to change your housing situation Seeking different housing (100.0%) What type of unit are you seeking Single family home (100.0%) Type of tenure seeking Seeking to buy (50.0%) If own, do you plan on building or buying Buy an existing unit (50.0%) Expected rental price $701 to $800 dollars (100.0%)
For residents who are unsatisfied with their current housing, 50.0 percent were unsatisfied because they need a better lot. When asked what type of unit they were seeking, the most common response, 100.0 percent, indicated they were seeking a single family home. When asked if they preferred to own or rent, 50.0 percent wanted to buy and 50.0 wanted to rent their next residence. Of those respondents who wished to rent, the most common response, 100.0 percent of respondents, anticipated spending $701 to $800 dollars. Additional survey data are presented in Volume II. Technical Appendix. Housing Problems Households are classified as having housing problems if they face overcrowding, incomplete plumbing or kitchen facilities, or cost burdens. Overcrowding is defined as having from 1.1 to 1.5 people per room per residence, with severe overcrowding defined as having more than 1.5 people per room. Households with overcrowding are shown in Table II.6.68, below. In 2017, an estimated 1.4 percent of households were overcrowded, and an additional 0.3 percent were severely overcrowded.
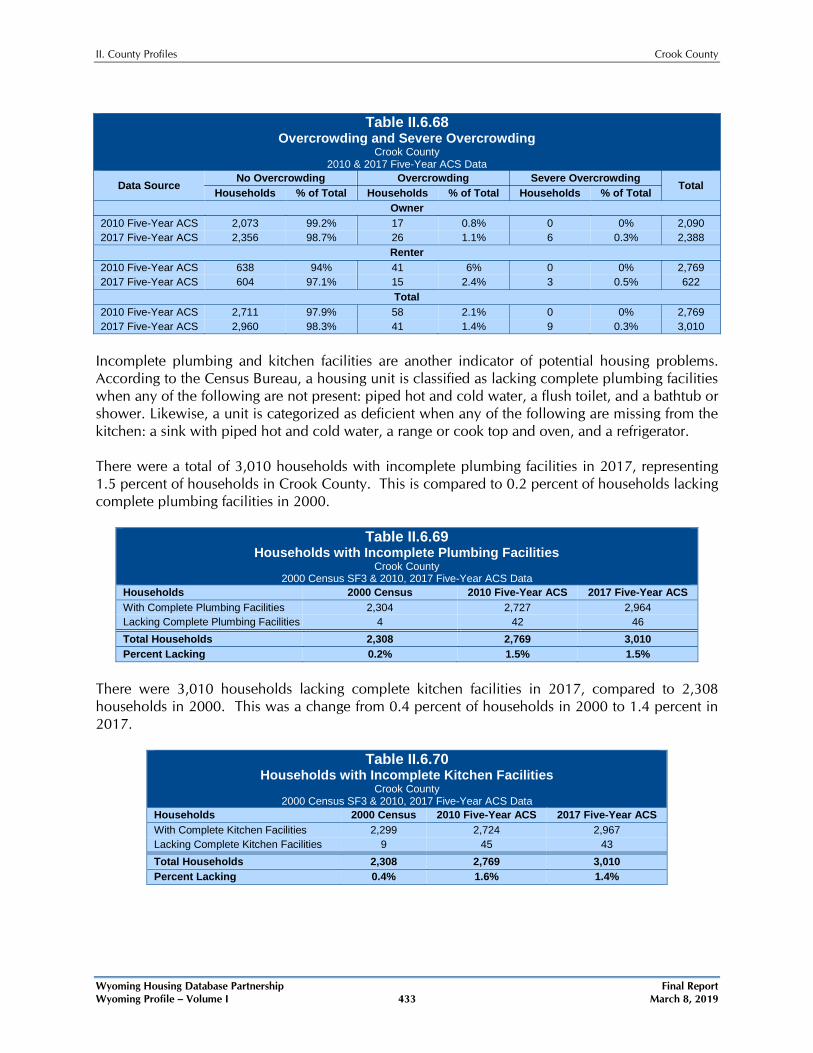
II. County Profiles Crook County
Wyoming Housing Database Partnership Final Report Wyoming Profile – Volume I 433 March 8, 2019
Table II.6.68
Overcrowding and Severe Overcrowding Crook County
2010 & 2017 Five-Year ACS Data
Data Source No Overcrowding Overcrowding Severe Overcrowding
Total Households % of Total Households % of Total Households % of Total
Owner 2010 Five-Year ACS 2,073 99.2% 17 0.8% 0 0% 2,090 2017 Five-Year ACS 2,356 98.7% 26 1.1% 6 0.3% 2,388
Renter 2010 Five-Year ACS 638 94% 41 6% 0 0% 2,769 2017 Five-Year ACS 604 97.1% 15 2.4% 3 0.5% 622
Total 2010 Five-Year ACS 2,711 97.9% 58 2.1% 0 0% 2,769 2017 Five-Year ACS 2,960 98.3% 41 1.4% 9 0.3% 3,010
Incomplete plumbing and kitchen facilities are another indicator of potential housing problems. According to the Census Bureau, a housing unit is classified as lacking complete plumbing facilities when any of the following are not present: piped hot and cold water, a flush toilet, and a bathtub or shower. Likewise, a unit is categorized as deficient when any of the following are missing from the kitchen: a sink with piped hot and cold water, a range or cook top and oven, and a refrigerator. There were a total of 3,010 households with incomplete plumbing facilities in 2017, representing 1.5 percent of households in Crook County. This is compared to 0.2 percent of households lacking complete plumbing facilities in 2000.
Table II.6.69 Households with Incomplete Plumbing Facilities
Crook County 2000 Census SF3 & 2010, 2017 Five-Year ACS Data
Households 2000 Census 2010 Five-Year ACS 2017 Five-Year ACS With Complete Plumbing Facilities 2,304 2,727 2,964 Lacking Complete Plumbing Facilities 4 42 46 Total Households 2,308 2,769 3,010 Percent Lacking 0.2% 1.5% 1.5%
There were 3,010 households lacking complete kitchen facilities in 2017, compared to 2,308 households in 2000. This was a change from 0.4 percent of households in 2000 to 1.4 percent in 2017.
Table II.6.70 Households with Incomplete Kitchen Facilities
Crook County 2000 Census SF3 & 2010, 2017 Five-Year ACS Data
Households 2000 Census 2010 Five-Year ACS 2017 Five-Year ACS With Complete Kitchen Facilities 2,299 2,724 2,967 Lacking Complete Kitchen Facilities 9 45 43 Total Households 2,308 2,769 3,010 Percent Lacking 0.4% 1.6% 1.4%

II. County Profiles Crook County
Wyoming Housing Database Partnership Final Report Wyoming Profile – Volume I 434 March 8, 2019
Cost burden is defined as gross housing costs that range from 30.0 to 50.0 percent of gross household income; severe cost burden is defined as gross housing costs that exceed 50.0 percent of gross household income. For homeowners, gross housing costs include property taxes, insurance, energy payments, water and sewer service, and refuse collection. If the homeowner has a mortgage, the determination also includes principal and interest payments on the mortgage loan. For renters, this figure represents monthly rent and selected electricity and natural gas energy charges.
In Crook County, 7.5 of households had a cost burden and 5.9 percent had a severe cost burden. Some 6.1 percent of renters were cost burdened, and 14.3 percent were severely cost burdened. Owner-occupied households without a mortgage had a cost burden rate of 4.5 percent and a severe cost burden rate of 1.6 percent. Owner ossupied households with a mortgage had a cost burden rate of 11.9 percent, and severe cost burden at 6.2 percent.
Table II.6.71 Cost Burden and Severe Cost Burden by Tenure
Crook County 2010 & 2017 Five-Year ACS Data
Data Source Less Than 30% 31%-50% Above 50% Not Computed
Total Households % of Total Households % of Total Households % of Total Households % of Total
Owner With a Mortgage 2010 Five-Year ACS 759 79.1% 98 10.2% 102 10.6% 0 0% 959 2017 Five-Year ACS 898 81.9% 131 11.9% 68 6.2% 0 0% 1,097
Owner Without a Mortgage 2010 Five-Year ACS 992 87.7% 102 9% 34 3% 3 0.3% 1,131 2017 Five-Year ACS 1,177 91.2% 58 4.5% 21 1.6% 35 2.7% 1,291
Renter 2010 Five-Year ACS 354 52.1% 54 8% 83 12.2% 188 27.7% 679 2017 Five-Year ACS 374 60.1% 38 6.1% 89 14.3% 121 19.5% 622
Total 2010 Five-Year AC 2,105 76% 254 9.2% 219 7.9% 191 6.9% 2,769 2017 Five-Year ACS 2,449 81.4% 227 7.5% 178 5.9% 156 5.2% 3,010
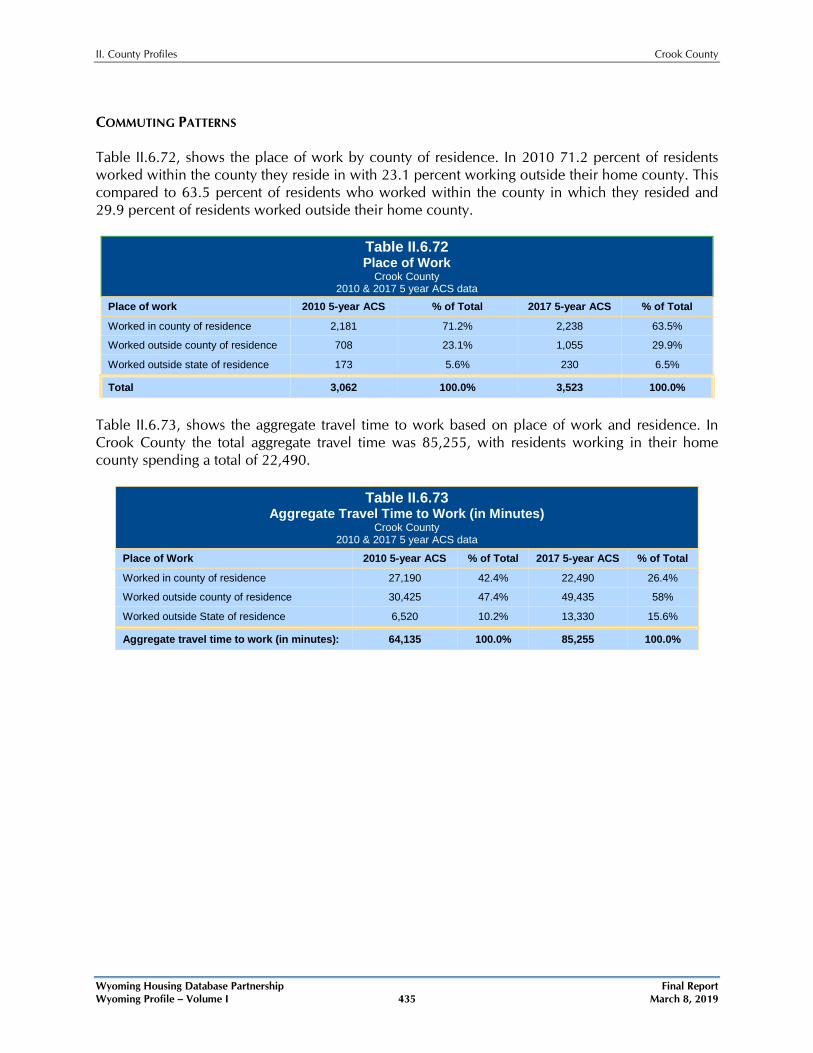
II. County Profiles Crook County
Wyoming Housing Database Partnership Final Report Wyoming Profile – Volume I 435 March 8, 2019
COMMUTING PATTERNS Table II.6.72, shows the place of work by county of residence. In 2010 71.2 percent of residents worked within the county they reside in with 23.1 percent working outside their home county. This compared to 63.5 percent of residents who worked within the county in which they resided and 29.9 percent of residents worked outside their home county.
Table II.6.72 Place of Work
Crook County 2010 & 2017 5 year ACS data
Place of work 2010 5-year ACS % of Total 2017 5-year ACS % of Total
Worked in county of residence 2,181 71.2% 2,238 63.5%
Worked outside county of residence 708 23.1% 1,055 29.9%
Worked outside state of residence 173 5.6% 230 6.5%
Total 3,062 100.0% 3,523 100.0%
Table II.6.73, shows the aggregate travel time to work based on place of work and residence. In Crook County the total aggregate travel time was 85,255, with residents working in their home county spending a total of 22,490.
Table II.6.73 Aggregate Travel Time to Work (in Minutes)
Crook County 2010 & 2017 5 year ACS data
Place of Work 2010 5-year ACS % of Total 2017 5-year ACS % of Total
Worked in county of residence 27,190 42.4% 22,490 26.4%
Worked outside county of residence 30,425 47.4% 49,435 58%
Worked outside State of residence 6,520 10.2% 13,330 15.6%
Aggregate travel time to work (in minutes): 64,135 100.0% 85,255 100.0%
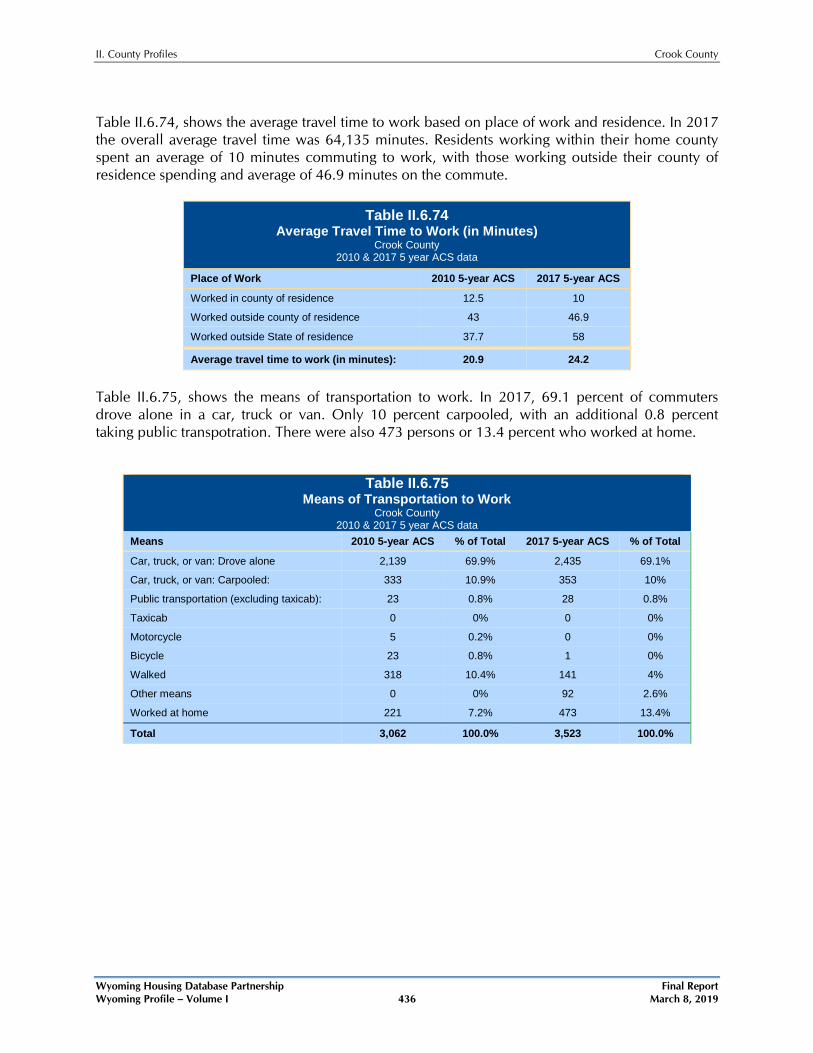
II. County Profiles Crook County
Wyoming Housing Database Partnership Final Report Wyoming Profile – Volume I 436 March 8, 2019
Table II.6.74, shows the average travel time to work based on place of work and residence. In 2017 the overall average travel time was 64,135 minutes. Residents working within their home county spent an average of 10 minutes commuting to work, with those working outside their county of residence spending and average of 46.9 minutes on the commute.
Table II.6.74 Average Travel Time to Work (in Minutes)
Crook County 2010 & 2017 5 year ACS data
Place of Work 2010 5-year ACS 2017 5-year ACS
Worked in county of residence 12.5 10
Worked outside county of residence 43 46.9
Worked outside State of residence 37.7 58
Average travel time to work (in minutes): 20.9 24.2
Table II.6.75, shows the means of transportation to work. In 2017, 69.1 percent of commuters drove alone in a car, truck or van. Only 10 percent carpooled, with an additional 0.8 percent taking public transpotration. There were also 473 persons or 13.4 percent who worked at home.
Table II.6.75 Means of Transportation to Work
Crook County 2010 & 2017 5 year ACS data
Means 2010 5-year ACS % of Total 2017 5-year ACS % of Total
Car, truck, or van: Drove alone 2,139 69.9% 2,435 69.1%
Car, truck, or van: Carpooled: 333 10.9% 353 10% Public transportation (excluding taxicab): 23 0.8% 28 0.8% Taxicab 0 0% 0 0% Motorcycle 5 0.2% 0 0% Bicycle 23 0.8% 1 0% Walked 318 10.4% 141 4% Other means 0 0% 92 2.6% Worked at home 221 7.2% 473 13.4%
Total 3,062 100.0% 3,523 100.0%
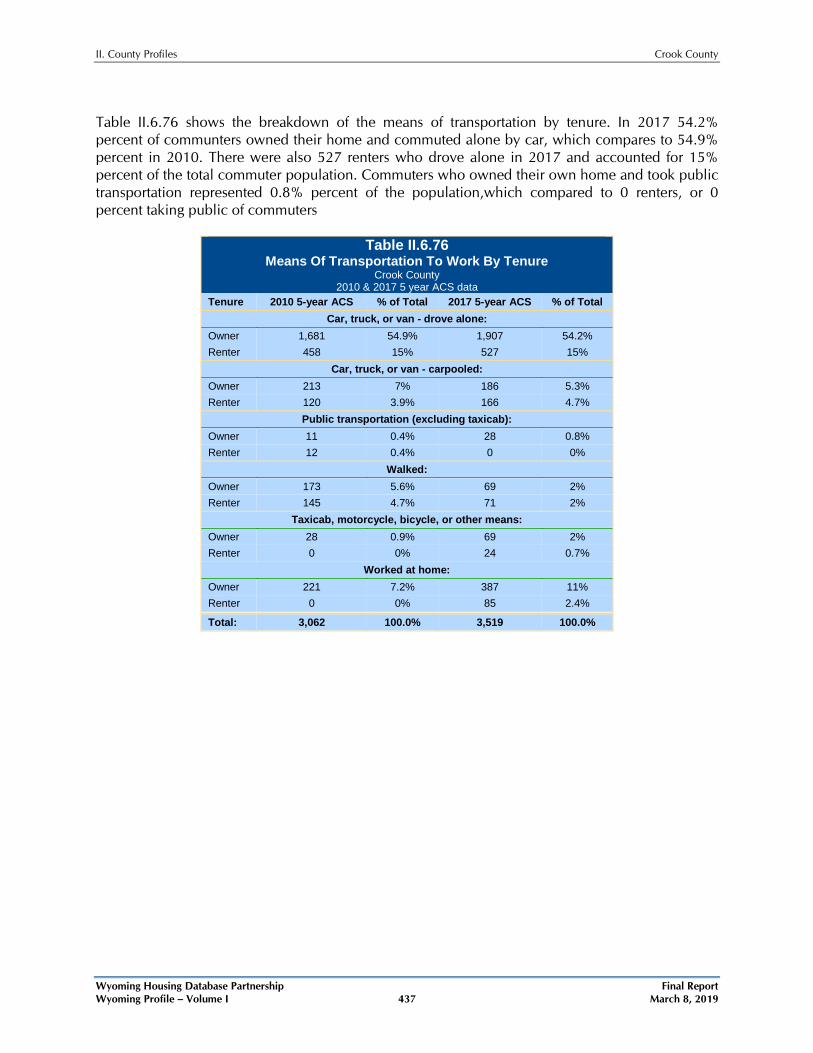
II. County Profiles Crook County
Wyoming Housing Database Partnership Final Report Wyoming Profile – Volume I 437 March 8, 2019
Table II.6.76 shows the breakdown of the means of transportation by tenure. In 2017 54.2% percent of communters owned their home and commuted alone by car, which compares to 54.9% percent in 2010. There were also 527 renters who drove alone in 2017 and accounted for 15% percent of the total commuter population. Commuters who owned their own home and took public transportation represented 0.8% percent of the population,which compared to 0 renters, or 0 percent taking public of commuters
Table II.6.76 Means Of Transportation To Work By Tenure
Crook County 2010 & 2017 5 year ACS data
Tenure 2010 5-year ACS % of Total 2017 5-year ACS % of Total Car, truck, or van - drove alone:
Owner 1,681 54.9% 1,907 54.2% Renter 458 15% 527 15%
Car, truck, or van - carpooled: Owner 213 7% 186 5.3% Renter 120 3.9% 166 4.7%
Public transportation (excluding taxicab): Owner 11 0.4% 28 0.8% Renter 12 0.4% 0 0%
Walked: Owner 173 5.6% 69 2% Renter 145 4.7% 71 2%
Taxicab, motorcycle, bicycle, or other means: Owner 28 0.9% 69 2% Renter 0 0% 24 0.7%
Worked at home: Owner 221 7.2% 387 11% Renter 0 0% 85 2.4% Total: 3,062 100.0% 3,519 100.0%
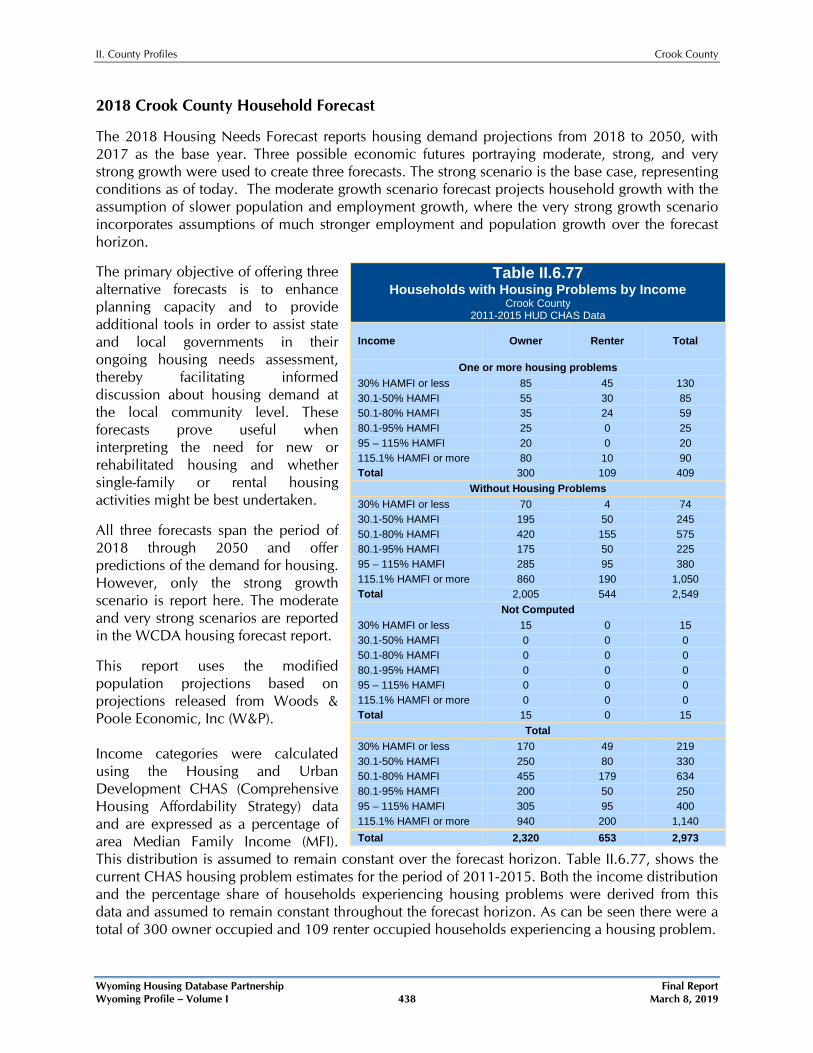
II. County Profiles Crook County
Wyoming Housing Database Partnership Final Report Wyoming Profile – Volume I 438 March 8, 2019
2018 Crook County Household Forecast
The 2018 Housing Needs Forecast reports housing demand projections from 2018 to 2050, with 2017 as the base year. Three possible economic futures portraying moderate, strong, and very strong growth were used to create three forecasts. The strong scenario is the base case, representing conditions as of today. The moderate growth scenario forecast projects household growth with the assumption of slower population and employment growth, where the very strong growth scenario incorporates assumptions of much stronger employment and population growth over the forecast horizon. The primary objective of offering three alternative forecasts is to enhance planning capacity and to provide additional tools in order to assist state and local governments in their ongoing housing needs assessment, thereby facilitating informed discussion about housing demand at the local community level. These forecasts prove useful when interpreting the need for new or rehabilitated housing and whether single-family or rental housing activities might be best undertaken.
All three forecasts span the period of 2018 through 2050 and offer predictions of the demand for housing. However, only the strong growth scenario is report here. The moderate and very strong scenarios are reported in the WCDA housing forecast report.
This report uses the modified population projections based on projections released from Woods & Poole Economic, Inc (W&P). Income categories were calculated using the Housing and Urban Development CHAS (Comprehensive Housing Affordability Strategy) data and are expressed as a percentage of area Median Family Income (MFI). This distribution is assumed to remain constant over the forecast horizon. Table II.6.77, shows the current CHAS housing problem estimates for the period of 2011-2015. Both the income distribution and the percentage share of households experiencing housing problems were derived from this data and assumed to remain constant throughout the forecast horizon. As can be seen there were a total of 300 owner occupied and 109 renter occupied households experiencing a housing problem.
Table II.6.77 Households with Housing Problems by Income
Crook County 2011-2015 HUD CHAS Data
Income Owner Renter Total
One or more housing problems 30% HAMFI or less 85 45 130 30.1-50% HAMFI 55 30 85 50.1-80% HAMFI 35 24 59 80.1-95% HAMFI 25 0 25 95 – 115% HAMFI 20 0 20 115.1% HAMFI or more 80 10 90 Total 300 109 409
Without Housing Problems 30% HAMFI or less 70 4 74 30.1-50% HAMFI 195 50 245 50.1-80% HAMFI 420 155 575 80.1-95% HAMFI 175 50 225 95 – 115% HAMFI 285 95 380 115.1% HAMFI or more 860 190 1,050 Total 2,005 544 2,549
Not Computed 30% HAMFI or less 15 0 15 30.1-50% HAMFI 0 0 0 50.1-80% HAMFI 0 0 0 80.1-95% HAMFI 0 0 0 95 – 115% HAMFI 0 0 0 115.1% HAMFI or more 0 0 0 Total 15 0 15
Total 30% HAMFI or less 170 49 219 30.1-50% HAMFI 250 80 330 50.1-80% HAMFI 455 179 634 80.1-95% HAMFI 200 50 250 95 – 115% HAMFI 305 95 400 115.1% HAMFI or more 940 200 1,140 Total 2,320 653 2,973
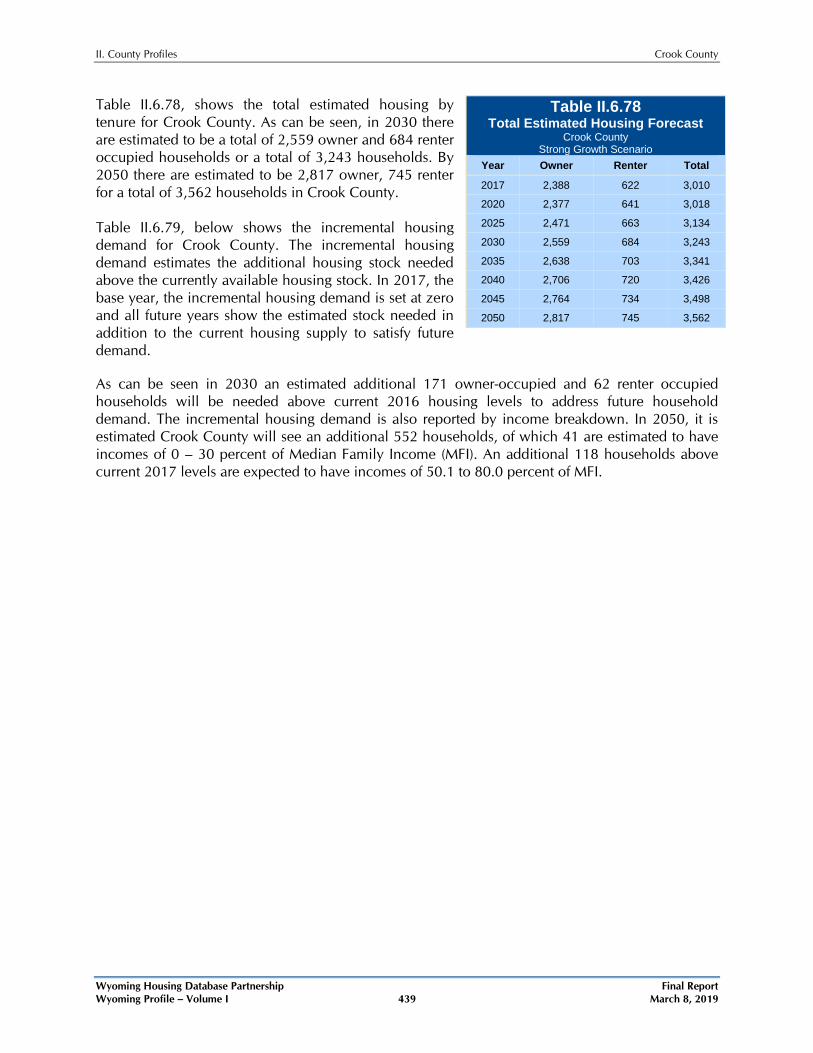
II. County Profiles Crook County
Wyoming Housing Database Partnership Final Report Wyoming Profile – Volume I 439 March 8, 2019
Table II.6.78, shows the total estimated housing by tenure for Crook County. As can be seen, in 2030 there are estimated to be a total of 2,559 owner and 684 renter occupied households or a total of 3,243 households. By 2050 there are estimated to be 2,817 owner, 745 renter for a total of 3,562 households in Crook County. Table II.6.79, below shows the incremental housing demand for Crook County. The incremental housing demand estimates the additional housing stock needed above the currently available housing stock. In 2017, the base year, the incremental housing demand is set at zero and all future years show the estimated stock needed in addition to the current housing supply to satisfy future demand. As can be seen in 2030 an estimated additional 171 owner-occupied and 62 renter occupied households will be needed above current 2016 housing levels to address future household demand. The incremental housing demand is also reported by income breakdown. In 2050, it is estimated Crook County will see an additional 552 households, of which 41 are estimated to have incomes of 0 – 30 percent of Median Family Income (MFI). An additional 118 households above current 2017 levels are expected to have incomes of 50.1 to 80.0 percent of MFI.
Table II.6.78 Total Estimated Housing Forecast
Crook County Strong Growth Scenario
Year Owner Renter Total
2017 2,388 622 3,010
2020 2,377 641 3,018
2025 2,471 663 3,134
2030 2,559 684 3,243
2035 2,638 703 3,341
2040 2,706 720 3,426
2045 2,764 734 3,498
2050 2,817 745 3,562
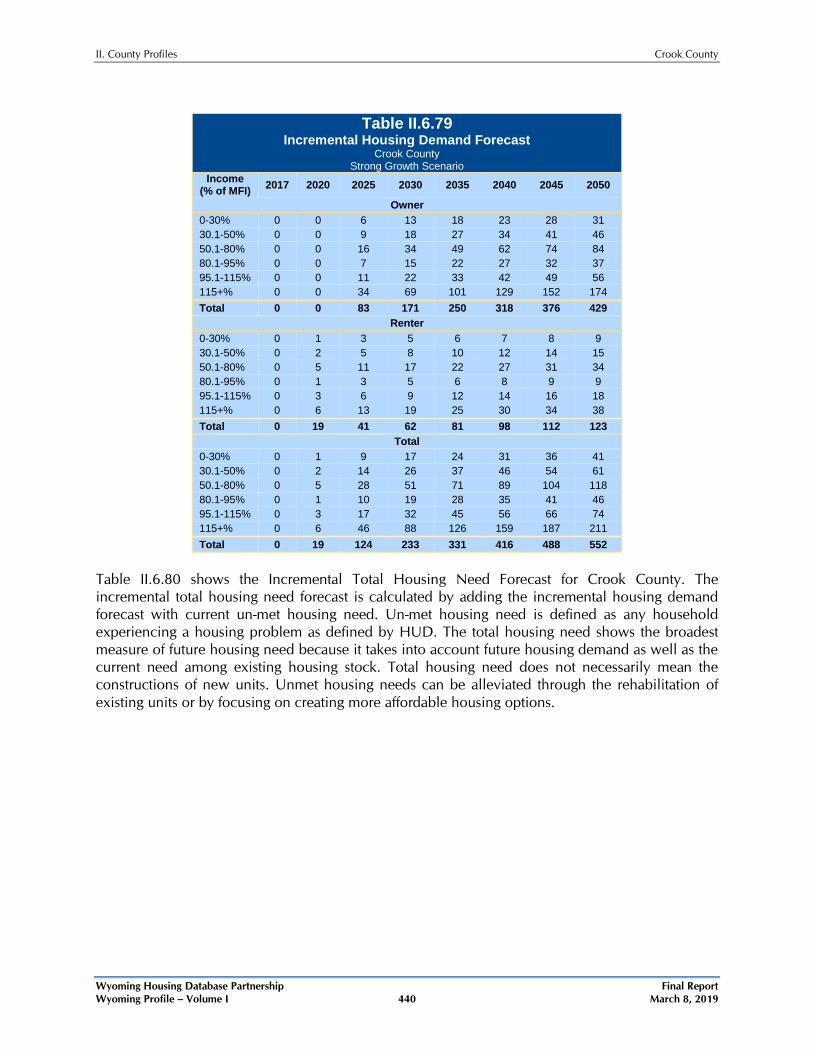
II. County Profiles Crook County
Wyoming Housing Database Partnership Final Report Wyoming Profile – Volume I 440 March 8, 2019
Table II.6.79
Incremental Housing Demand Forecast Crook County
Strong Growth Scenario Income
(% of MFI) 2017 2020 2025 2030 2035 2040 2045 2050
Owner 0-30% 0 0 6 13 18 23 28 31 30.1-50% 0 0 9 18 27 34 41 46 50.1-80% 0 0 16 34 49 62 74 84 80.1-95% 0 0 7 15 22 27 32 37 95.1-115% 0 0 11 22 33 42 49 56 115+% 0 0 34 69 101 129 152 174 Total 0 0 83 171 250 318 376 429
Renter 0-30% 0 1 3 5 6 7 8 9 30.1-50% 0 2 5 8 10 12 14 15 50.1-80% 0 5 11 17 22 27 31 34 80.1-95% 0 1 3 5 6 8 9 9 95.1-115% 0 3 6 9 12 14 16 18 115+% 0 6 13 19 25 30 34 38 Total 0 19 41 62 81 98 112 123
Total 0-30% 0 1 9 17 24 31 36 41 30.1-50% 0 2 14 26 37 46 54 61 50.1-80% 0 5 28 51 71 89 104 118 80.1-95% 0 1 10 19 28 35 41 46 95.1-115% 0 3 17 32 45 56 66 74 115+% 0 6 46 88 126 159 187 211 Total 0 19 124 233 331 416 488 552
Table II.6.80 shows the Incremental Total Housing Need Forecast for Crook County. The incremental total housing need forecast is calculated by adding the incremental housing demand forecast with current un-met housing need. Un-met housing need is defined as any household experiencing a housing problem as defined by HUD. The total housing need shows the broadest measure of future housing need because it takes into account future housing demand as well as the current need among existing housing stock. Total housing need does not necessarily mean the constructions of new units. Unmet housing needs can be alleviated through the rehabilitation of existing units or by focusing on creating more affordable housing options.
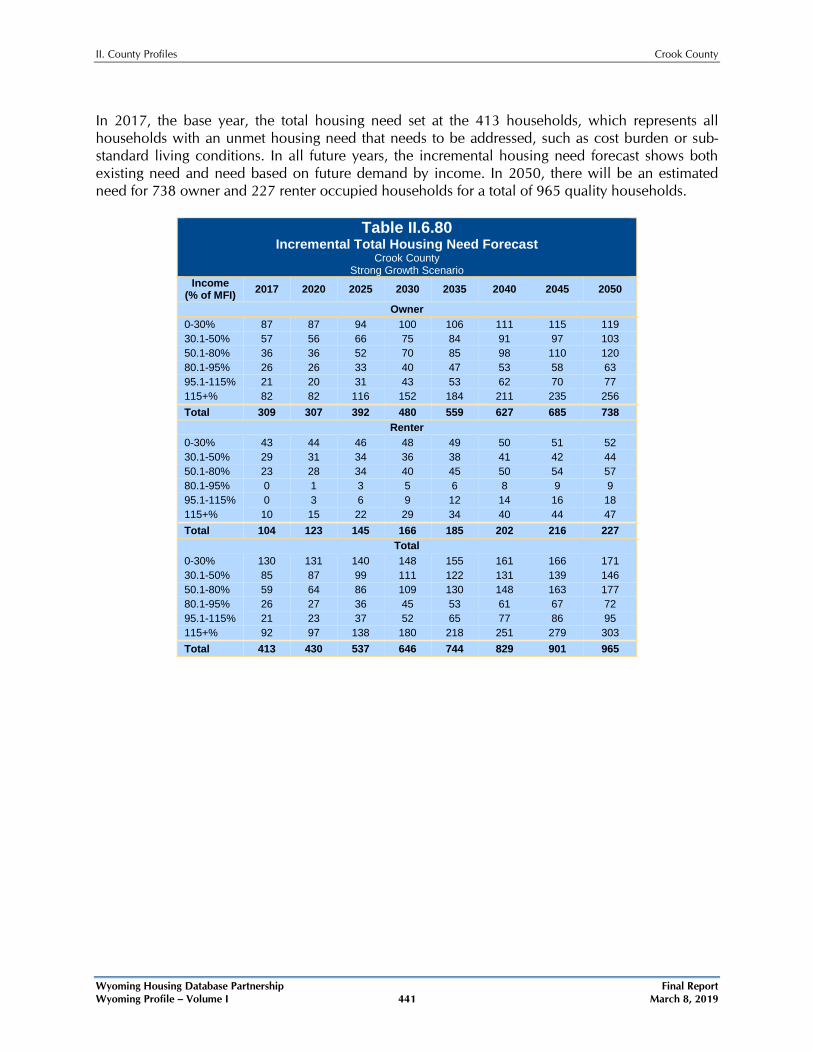
II. County Profiles Crook County
Wyoming Housing Database Partnership Final Report Wyoming Profile – Volume I 441 March 8, 2019
In 2017, the base year, the total housing need set at the 413 households, which represents all households with an unmet housing need that needs to be addressed, such as cost burden or sub-standard living conditions. In all future years, the incremental housing need forecast shows both existing need and need based on future demand by income. In 2050, there will be an estimated need for 738 owner and 227 renter occupied households for a total of 965 quality households.
Table II.6.80 Incremental Total Housing Need Forecast
Crook County Strong Growth Scenario
Income (% of MFI) 2017 2020 2025 2030 2035 2040 2045 2050
Owner 0-30% 87 87 94 100 106 111 115 119 30.1-50% 57 56 66 75 84 91 97 103 50.1-80% 36 36 52 70 85 98 110 120 80.1-95% 26 26 33 40 47 53 58 63 95.1-115% 21 20 31 43 53 62 70 77 115+% 82 82 116 152 184 211 235 256 Total 309 307 392 480 559 627 685 738
Renter 0-30% 43 44 46 48 49 50 51 52 30.1-50% 29 31 34 36 38 41 42 44 50.1-80% 23 28 34 40 45 50 54 57 80.1-95% 0 1 3 5 6 8 9 9 95.1-115% 0 3 6 9 12 14 16 18 115+% 10 15 22 29 34 40 44 47 Total 104 123 145 166 185 202 216 227
Total 0-30% 130 131 140 148 155 161 166 171 30.1-50% 85 87 99 111 122 131 139 146 50.1-80% 59 64 86 109 130 148 163 177 80.1-95% 26 27 36 45 53 61 67 72 95.1-115% 21 23 37 52 65 77 86 95 115+% 92 97 138 180 218 251 279 303 Total 413 430 537 646 744 829 901 965
II. County Profiles Crook County
Wyoming Housing Database Partnership Final Report Wyoming Profile – Volume I 442 March 8, 2019
2018 WCDA Loan Profile The Wyoming Community Development Authority (WCDA) began purchasing home loans in 1978 to provide affordable housing in Wyoming. There were a total of 323 loans purchased in Crook County between 1979 and 2018, with 13 occurring in fiscal 2017. The average home size over the period was 1,310 square feet and 1,274 square feet in fiscal 2018. For homes receiving a WCDA loan in fiscal 2018, the average year a home was built was 1989. The average household income in fiscal 2018 in nominal terms, without the effects of inflation being taken into consideration, was $54,250. The average purchase price in fiscal 2018 was $150,300. In fiscal 2018, 0.0 percent of loans purchased were for new construction, and 23.1 percent had female heads of household. Fiscal year data for the entire operating history of the WCDA can be found in Volume II. Technical Appendix.